An Empirical Estimation of NCAA Head Football Coaches Contract Duration
-
Stacey L. Brook


Abstract
While previous research on head coach dismissals finds that team performance and managerial characteristics impact employment survival, these studies ignore the impact of contract modifications. Using an accelerated failure time survival model with hand-collected college head football coach contract data, I find that race/ethnicity affects the hazard rate of contract modifications but not the hazard rate of a head coach’s dismissal. Additionally, analysis of employment duration ignoring contract modifications may result in erroneous conclusions with respect to the effect that race/ethnicity has on a head coach’s dismissal.
1 Introduction
National Collegiate Athletic Association (NCAA) Football[1] Bowl Subdivision (FBS) head coaches change jobs so often that members of the sports media refer to it as a “coaching carousel.” For example, between 2008 and 2019, 159 NCAA FBS (full-time)[2] head coaches were fired, another 43 NCAA FBS head coaches either resigned or retired, while an additional 80 NCAA FBS head coaches quit their current position to take another job (either in the NCAA or National Football League [NFL]). Using the data collected below, the percentage of NCAA FBS head coaches on the “coaching carousel” ranged from a high of 24.2 % in 2012 to a low of 12.5 % in 2014.
What is less well-known is regarding NCAA FBS head coaches contract modifications.[3] For example, even though the University of Cincinnati eliminated[4] their men’s soccer program citing “widespread uncertainty” in April 2020, and in September 2020 eliminated[5] 14 athletic staff positions and cut contracted athletic staff salaries because of the global pandemic, their head football coach received[6] a contract modification. Thus, even with widespread athletic department uncertainty, reductions in athletic programs, positions, and salaries, some employees were receiving a contract modification. This is not a singular event; during the 2008–2019 time period, 484 NCAA FBS head coach contracts were modified, which was greater than head coach firings, resignations, retirements, and quits combined. Using the data collected below, contract modifications ranged from a high of 40.0 % in 2017 to a low of 25.0 % in 2009.
The employment duration literature reports conflicting hazard rates based on a head coach’s race/ethnicity. Yet, no study has included contract modifications in the duration analysis. Thus, the purpose of the paper is to extend the employment duration literature by including contract modifications and determine if NCAA FBS head coaches are systematically disadvantaged in the labor market based on their race/ethnicity.
In summary, I find that head coaches that perform better (worse) than expected receive contract modifications at higher (lower) rates. I also find that head coaches that lead programs having poor expected team performance are fired at higher rates. Head coaches that quit their current job for another coaching job have both higher and actual expected performance and are more likely to work at perceived higher quality conferences. The head coach’s race/ethnicity is found to be statistically significant for contract modifications, but not when head coaches are fired, dismissed, or quit. Yet, Caucasian head coach’s contracts are modified sooner than non-Caucasian head coaches; as well as head coaches employed among higher quality conferences receive contract modifications sooner than head coaches in less prominent athletic conferences.
Finally, a counterfactual duration analysis (where contract modifications are ignored) where employment duration continues until the head coach is either fired or dismissed is presented. The most striking counterfactual result is that race/ethnicity is now statistically significant when head coaches are either fired or dismissed. Thus, ignoring contract modifications in head coach labor contract duration analysis may result in biased or erroneous conclusions.
The paper is organized as follows: first, a review of the sports head coach literature is presented. Second, a brief discussion of contract terms, event types, and data sources are presented, followed by an overview of the survival analysis. Next, the head football coach contract duration model is presented, which is followed by the estimated results. A discussion of the implications of race/ethnicity as well as a counterfactual analysis of contract duration ignoring contract modifications is presented, and a conclusion section finishes up the analysis.
2 Literature Review
The literature review first focuses on why contracts are an important area of empirical research on duration. Jenkins (1996) argued that using free agents in salary models is better than using players’ salary during a multi-year contract. Berri and Brook (2010) use this reasoning to analyze both general manager performance evaluation and salary determination for free agent National Hockey League goalies. Fogarty, Soebbing, and Agyemang (2015) and Brook (2021) then extend the salary determination models beyond only using free agents by including contract modifications for NCAA head football coaches. Both papers separated head coaches by contract type (new and modified) when examining salary determination. Finally, Krautmann (2018) examined Major League Baseball player’s salaries given they have been given a contract extension. Thus, the contribution of the analysis presented here is that contract modifications are also included in the employment duration analysis.
Additionally, two areas of the literature on employment duration are addressed. One is the head coach’s performance expectations. Both Soebbing, Wicker, and Weimar (2015) and Humphrey, Paul, and Weinbach (2016) used sports betting market data as a measure of performance expectations to estimate the impact of employment turnover using ordinary least squares and logit regression, respectively. Lefgren et al. (2019) use score differential as a performance expectation for National Football League head coaches to examine contract dismissals, where coaches with a positive score differential are dismissed at different rates than those with a negative score differential. Semmelroth (2022) reported that performance expectations statistically affect both coach dismissals and quits.
With respect to the employee’s race/ethnicity, Mixon and Treviño (2004) used a discrete-time duration analysis and found that black NCAA head football coaches are less likely to be fired and suggest that while there are few black coaches in the NCAA head football labor market; black head football coaches may be given more time at the helm of the football program. Alternatively, using a log-logistic accelerated failure time survival model of NBA head coaches, Kahn (2006) reports that there is no racial discrimination at traditional levels of statistical significance. Groothuis and Hill (2013) failed to find either pay or exit discrimination for NBA players, while Salaga and Juravich (2020) found that non-White NFL head coaches have longer duration but there were no racial differences for head coach dismissals. Jepsen (2023) found that hazard rates are higher for WNBA employees who are either White or an immigrant.
Turning now to the sports head coach survival analysis dismissal literature, Holmes (2011) employed a discrete-time hazard model to investigate NCAA head coach firings from 1983 to 2006. The author used a measure of expectations based on recent and historical team performance with the coach (as opposed to using betting markets) to represent market expectations and found that higher recent team performance decreases a head coach’s dismissal, as well as that black coaches have a negative effect on duration after seven seasons of coaching. Maxcy (2013) employed a Weibull survival model of coach employment duration for NCAA FBS head coaches and found that head coaches who used resources less efficiently or had lower winning percentages increase their likelihood of being dismissed.
Additionally, Audas, Dobson, and Goddard (1999) use match (game level) data and found that team performance has a greater impact on “involuntary” employment termination while managerial characteristics have a greater impact on “voluntary” employment termination. Barros, Frick, and Passos (2009) found that more successful coaches survive for longer periods of time and teams with higher employment costs results in head coaches surviving for shorter periods of time. d’Addona and Kind (2014) found that recent match outcomes significantly and steadily increase the hazard rate over the six decades the authors analyzed. van Ours and van Tuijl (2016) reported that coaching experience is positively and statistically significant for head coaches’ dismissals.
3 Contracts: Legal Terms, Event Types, and Data Sources
Changes to an existing contract fall under three legal terms: amendments, extensions, or restatements. A contract amendment results from deleting, changing, correcting, or adding to an existing contract. A contract extension occurs if the parties agree to extend the terms of the contract for an additional amount of time, while a contract is restated when the contract includes changes to an existing contract between the two parties such as to redefine contract terms. If the existing employees contract changes due to an amendment, extension, or restatement, it is classified here as a contract modification.
The duration of an existing contract ends under six types of events. One is if the head coach’s contract was modified as defined above. Alternatively, a contract ends if the head coach was fired “without cause,” meaning that the head coach’s employment is terminated for reasons that do not violate the terms of the contract, or if the head coach was fired “for cause,” where a clear reason was given for the head coaches employment termination, such as if the head coach violated NCAA rules or other clauses of their contract. Alternatively, an existing contract ends if the head coach quits for another job, usually another football coaching job. Each of these cases are announced at the time of employment termination.
Two additional events are that employment termination is announced well in advance of employment separation. The first is if the head coach resigns (which I define when the head coach announces in advance of the last game of the season that the head coach would not continue coaching). The other occurs if the head coach retires. Retirement is also announced well in advance of the end of the season and the head coach does not return in the dataset. Yet, it is possible that a head coach is given the option to announce their resignation or retirement as an alternative to the university announcing the firing of the head coach. This possibility is explored in the estimated results section of the analysis.
Contract duration data were found using two methods. The first source used the actual head coach’s employment contract acquired via public records request. The advantage of using the actual contracts is that in many cases, amendments and restatements are provided allowing for modifications to be clearly ascertained. A second source was performing an internet search by the coach’s name, the university’s name, and the words “contract extension” or “fired.”
4 Survival Analysis
Survival analysis is a statistical technique analyzing the time to the occurrence of an event, where typically the event is a failure such as an injury or death. The advantage of using survival analysis (as opposed to linear or logistic regression) is due to the large number of incomplete observations that typically occur in the time period being analyzed. For any period chosen, many of the observations are incomplete as to the analysis of duration. This is problematic for conventional statistics such as calculating the mean, standard deviation or median. If the incomplete (or right censored) observations are treated as measurements of survival time, the resulting empirical estimates are not estimates of the respective parameters, but rather are a combination of the estimates of survival time and a second (possibly) different distribution, which depends on survival time as well as the statistical assumptions about the incomplete (right censored) mechanism (Hosmer and Lemeshow 1999).
Survival analysis is different from ordinary least squares in that the normality assumption is replaced with a more appropriate assumption. Since the NCAA head coach contract duration model assumes that employment is “risky” in terms of duration, risk is assumed to be nonmonotone (Holmes 2011; Kahn 2006) in duration time. This is the reason an accelerated failure time survival model is employed.
Based on the Akaike information criterion (AIC), a log-logistic accelerated failure time regression (also used by Kahn 2006) is preferred over the log-normal accelerated failure time regression for each of the regressions that follow. Specifically, contract duration, τ
j
= exp(−x
j
β
x
)t
j
, is assumed to be distributed log-logistic with parameters (β0, γ) with the cumulative distribution function:
In this study, the unit of observation is by contract duration (aggregate number of games coached) as opposed to the employee (head coach), employer (university), or year (football season), and this overcomes potential measurement error when evaluating employee dismissals. If contract modifications are ignored, then the duration analysis occurs from the beginning of the employment to the end of the employment, which ignores changes in information during segments of employment.
For example, suppose employee A has signed a 6-year contract but subsequently receives a contract modification at the end of the second year of employment. If the employee is fired at the end of the fifth year, ignoring this contract modification after the second year potentially biases the estimated duration analysis results. Contract duration when the employee was fired is 3 years (the second contract), not 5 years. This possibility is explored in the counterfactual results that are presented at the end and shows that ignoring contract modifications erroneously supports that NCAA FBS head coaches are fired based on their race/ethnicity, but this result does not hold statistically when incorporating contract modifications in the duration analysis.
5 NCAA Head Football Coach Contract Duration Model
The NCAA head coach contract duration model is: tj = f( x j), where t is the duration time, j is the contract, x is a vector of both time-varying and time-invariant control variables. The duration time of the number of games coached was also used by Audas, Dobson, and Goddard (1999). The difference here is that a new observation occurs when an existing contract is modified not just when a contract is terminated.
The following control (independent) variables are employed in the contract duration model. The cumulative number of wins (Win) and the cumulative number of losses (Loss) for each contract were calculated over the duration of each contract. Both Pieper, Nüesch, and Franck (2014) and Semmelroth (2022) reported that performance expectations statistically affect head coach duration. Thus, betting market data were used to determine if the team “covers” the point spread ([points scored – opponents points scored] > point spread) to measure team performance expectations. The cumulative number of games the team covered (Cover) the point spread as well as the cumulative number of games not covering the point spread (NotCover) was calculated for each contract. Betting market data capture the current expectation of the team’s performance as opposed to using historical team performance. Thus, a team may be losing many games, but covering the point spread that reflects the team is performing better than expected. Historical performance fails to capture current team performance expectations, making the inclusion of betting market data a potentially important explanatory variable for modeling contract duration.
Due to the possibility that the hazard rate spikes at the end of the season (Last Game), or if a team plays in a postseason bowl game (Bowl Game), a dummy variable for each of these cases is included. Additional control variables include the head coach’s experience (xp) and experience squared (xp2) as measured by the number of games coached at the NCAA FBS level prior to performing under the new or modified contract and was found using the NCAA’s player/coach search website. The head coach’s race/ethnicity (ethnicity) was collected from various internet sources and is measured as a one if the head coach is Caucasian and zero if the head coach is non-Caucasian (Black, Latino, or multiracial). A dummy variable for one[8] (Power5) of the two Football Bowl Subdivision was also included. This was inspired by Barros, Frick, and Passos (2009) who found that Bundesliga teams with higher employment costs fire their head coaches sooner. Similarly, Power5 conferences tend to generate higher revenues and may have more impatient fan bases than the other conferences. Finally, following Maxcy (2013), the current season recruiting index points is included to control for the current recruiting class of football players. Descriptive statistics are presented in Tables 1 and 2.
Survival analysis dependent variable descriptive statistics.
| Total | Mean | Minimum | Median | Maximum | |
|---|---|---|---|---|---|
| No. of records | 848 | 1 | 1 | 1 | 1 |
| (First) entry time | 0 | 0 | 0 | 0 | |
| (Final) exit time | 22.186 | 1 | 19.5 | 78 | |
| Time at riska | 18,814 | 22.186 | 1 | 19.5 | 78 |
|
|
|||||
| Contract ending in | |||||
|
|
|||||
| Contract modifications | 484 | 0.571 | 0 | 1 | 1 |
| Fired | 145 | 0.171 | 0 | 0 | 1 |
| Turnover | 202 | 0.238 | 0 | 0 | 1 |
| Quits | 80 | 0.094 | 0 | 0 | 1 |
-
aOnly full-time head coaches are included, but some received contract modifications over very short time periods. For example, both Matt Campbell (Iowa State) and Frank Solich (Ohio) received a contract modification at the end of the 2019 regular season and then received another contract modification after the postseason bowl game (one game later). This is the reason that some contracts are very short in time at risk.
Independent variable descriptive statistics.
| Mean | Standard deviation | Minimum | Maximum | |
|---|---|---|---|---|
| Win | 11.797 | 7.665 | 0.000 | 50.000 |
| Loss | 10.423 | 7.870 | 0.000 | 46.000 |
| Cover | 10.680 | 6.307 | 0.000 | 42.000 |
| NotCover | 11.586 | 7.194 | 0.000 | 45.000 |
| Power5 | 0.506 | – | 0.000 | 1.000 |
| xp | 70.902 | 76.320 | 0.000 | 512.000 |
| xp 2 | 10,844.985 | 22,847.670 | 0.000 | 2.62e+05 |
| Ethnicity | 0.874 | – | 0.000 | 1.000 |
| Last game | 0.274 | – | 0.000 | 1.000 |
| Bowl game | 0.472 | – | 0.000 | 1.000 |
| Recruit | 169.367 | 60.047 | 0.000 | 323.870 |
|
|
||||
| n | 848 | |||
Now the analysis turns to the specific survival models used and their estimated results by the type of contract event.
6 Survival Analysis Accelerated Failure Time Estimated Results
From 2008 to 2019, there were 249 different FBS head football coaches and 848 contracts.[9] The onset of risk is assumed to start[10] (t = 0) at the beginning of the contract (or for left truncated observations in 2008 the number of games coached under the current contract prior to the 2008 season). There were 67 (8 % of contracts) left truncated observations where the head coach is already under an existing contract in 2008. An incomplete result (in terms of duration) occurs if the head coach is still under contract (i.e., right censored), which occurred 81 times in 2019 (9.6 % of the total contracts). Otherwise, the contract duration ends when the contract is modified or employment is terminated.
Turning now to the accelerated failure time survival analysis specific model, NCAA FBS head coach contract duration is a function of the cumulative number of wins (losses), the cumulative number of games the team covers (fails to cover), the betting market point spread, whether the team is a Power5 conference member, the experience (and squared experience) of the head coach, the head coaches race/ethnicity, whether the contract ended at the end of the regular season or if the contract ends after the postseason bowl game, and the current level of football recruiting. Each head football coach contract duration model is estimated using clustered standard errors by team to control for potential team specific correlation.
6.1 Modified Contracts
First, the NCAA FBS head coach contract modification estimated results are presented in Table 3, with time ratios (i.e., exponentiated coefficients) as opposed to the coefficient in levels. There were 479 contract modifications[11] out of 848 total contracts. Based on the AIC criterion, the preferred model is an accelerated failure time log-logistic survival model with experience squared. While it is unusual for the constant term to be interpreted in regression analysis, the constant term is the baseline hazard time in survival analysis. In Table 3, the constant is 10.83, meaning that the baseline hazard time is nearly 11 games coached under the current contract (which is almost equal to the number of regular season games played for one season, with a few exceptions). Second, the model shows the cumulative number of games won, the cumulative number of games covering betting market spreads, membership in the top conferences, the head coach’s race/ethnicity, the last regular season game, and whether the game was a postseason bowl game are statistically significant. For each additional game the team wins, the hazard rate increases by less than one percent, while for each additional point the team covers, the point spread results in nearly a 6.8 % increase in the hazard rate. Caucasian head coaches face a 9.0 % decrease in the hazard rate of a contract modification. As hypothesized, the contract modification hazard rate increases at the end of the regular season with a 20.9 % increase, and the hazard rate decreases after the postseason bowl game by 12.7 %.
2008–2019 head coach contract modification model.
| Dependent variable: | Contract modification |
|---|---|
| Analysis time | Time ratio/(se) |
| Win | 1.008* |
| (0.00) | |
| Cover | 1.068*** |
| (0.00) | |
| Power5 | 0.931* |
| (0.03) | |
| xp | 1.000 |
| (0.00) | |
| xp 2 | 1.000 |
| (0.00) | |
| Ethnicity | 0.910* |
| (0.03) | |
| Last game | 1.209*** |
| (0.05) | |
| Bowl game | 0.873*** |
| (0.02) | |
| Recruit | 1.000 |
| (0.00) | |
| Constant | 10.835*** |
| (0.75) | |
|
|
|
| Lngamma | −1.812*** |
| (0.04) | |
|
|
|
| Gamma | 0.163 |
| Modifications | 479 |
| N | 843 |
-
*p < 0.05, **p < 0.01, ***p < 0.001.
Finally, the shape parameter (γ) is less than one indicating the contract modification hazard has a nonmonotone shape in that the hazard first increases in analysis time and then decreases in analysis time. This seems reasonable even for contract modifications that the hazard of a contract modification should initially increase for the head coach, but as the number of games coached without a contract modification, the hazard rate decreases. Yet, as shown in Figure 1, Caucasian head football coaches receive contract modifications at faster rates than non-Caucasian head football coaches.
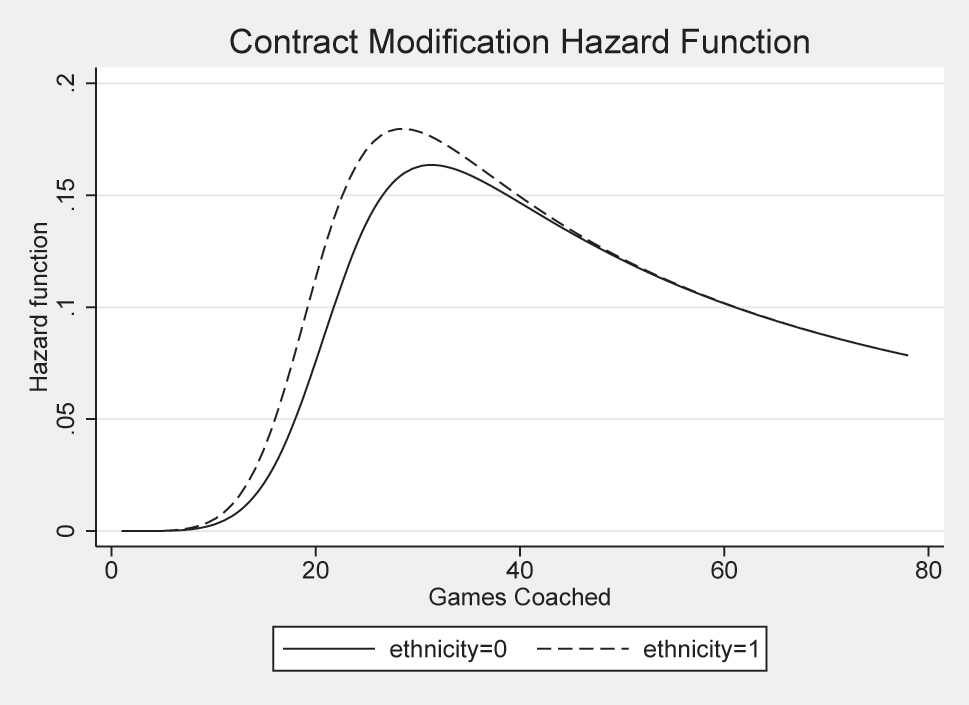
Contract modification hazard function. Caucasian (ethnicity = 1) head football coaches face higher hazard rates of contract modifications than non-Caucasian (ethnicity = 0) head football coaches.
6.2 Contracts Duration: Fired Without Cause & Employee Dismissal
The survival analysis estimated results (using time ratios) for head coaches whose employment ends are presented in Table 4. The model where head coaches are fired “without cause” (i.e., not violating the terms of the contract) are presented in the column on the left, and the head coach dismissal (where the head coach is fired for any reason, as well as if the head coach resigns or retires) model estimated results are presented in the column on the right. Survival analysis for the cases where head coaches are fired “with cause” (i.e., contract violations), the head coaches resigns, or the head coach retires are not analyzed due to low power for each individual contract event type.
2008–2019 head coach fired without cause & dismissed model.
| Dependent variable: | Fired w/o cause | Dismissed |
|---|---|---|
| Analysis time | Time ratio/(se) | Time ratio/(se) |
| Loss | 0.996 | 1.001 |
| (0.00) | (0.00) | |
| NotCover | 1.062*** | 1.056*** |
| (0.00) | (0.00) | |
| Power5 | 0.943 | 0.935 |
| (0.05) | (0.04) | |
| xp | 0.997*** | 0.998*** |
| (0.00) | (0.00) | |
| xp 2 | 1.000*** | 1.000 |
| (0.00) | (0.00) | |
| Ethnicity | 1.092 | 1.067 |
| (0.06) | (0.05) | |
| Last game | 0.918* | 0.881** |
| (0.03) | (0.03) | |
| Bowl game | 1.818*** | 1.507*** |
| (0.14) | (0.08) | |
| Recruit | 1.001 | 1.000 |
| (0.00) | (0.00) | |
| Constant | 12.673*** | 13.076*** |
| (1.25) | (1.17) | |
|
|
||
| Lngamma | −1.734*** | −1.685*** |
| (0.06) | (0.06) | |
|
|
||
| Gamma | 0.176 | 0.186 |
| Fired | 145 | – |
| Dismissed | – | 202 |
| N | 843 | 843 |
-
*p < 0.05, **p < 0.01, ***p < 0.001.
First, there were 145 coaches fired “without cause” out of 843 total contracts during this time period. Based on the AIC criterion, the preferred model is an accelerated failure time log-logistic survival model with experience squared. The baseline time is 12.7 games coached under the current contract, which is just over one season during 2008–2019 seasons. The model shows that the cumulative number of games not covering the betting market point spread is statistically significant. Each additional game where the football program does not cover the betting market spread results in about a 6.2 % increase in being fired. Prior experience and experience squared are also statistically significant, but the marginal impact is very small in terms of analysis time. The hazard rate decreases by 8.2 % at the end of the regular season but increases by about 81.8 % for teams playing in the post season. The shape parameter (γ) is less than one, and as such, the head coach firing hazard has a nonmonotone shape in that the hazard first increases in analysis time and then decreases in analysis time similarly as was the case of contract modifications.
Alternatively, if a head coach could announce that they are retiring or resigning but instead would have been fired, combining the events where the head coach is fired with retiring and resignation is investigated. There were 202 contracts resulting in employment dismissal (i.e., the head coach was fired either with or without cause, retired, or resigned). The AIC criterion results in the log-logistic distribution with experience squared to be the best representation of the data. The baseline time is 13.1 games coached under the current contract, which is just over one season during this time period. The model shows that the cumulative number of games not covering the betting market point spread is statistically significant. Each additional game where the football program does not cover the betting market spread results in about a 5.6 % increase in being fired. Prior experience is also statistically significant, but the marginal impact is very small in terms of analysis time. The hazard rate decreases by 11.9 % at the end of the regular season but increases by 50.7 % for teams playing in the post season. The shape parameter (g) is less than one, and as such, the head coach firing hazard has a nonmonotone shape in that the hazard first increases in analysis time and then decreases in analysis time similarly as was the case of contract modifications.
6.3 Contracts Duration: Employee Quits
During this time period, head coaches quit their current job in order to take another job (either as an NCAA head coach, an NCAA assistant coach, an NFL head coach, or an NFL assistant coach) 80 times. Based on the AIC criterion, the preferred model is an accelerated failure time log-logistic survival model with experience squared, and the estimated results are presented in Table 5. The baseline time is 10.5 games under contract, meaning that a head coach needs slightly less than one season of experience before they will be able to take another similar job holding all of the independent variable’s constant. The model shows that the cumulative number of wins, the cumulative number of games covering the betting market point spread, and coaching in a more competitive football conference are each statistically significant. Each additional win results in a 2.1 % decrease in the head coach quitting, each additional game where the football program covers the betting market spread results in about an 11.7 % increase in the head coach quitting, and coaching in a better-quality football conference results in a 39.6 % increase of the head coach quitting for another job.
2008–2019 head coach quits model.
| Dependent variable: | Head coach quits |
|---|---|
| Analysis time | Time ratio/(se) |
| Win | 0.979*** |
| (0.00) | |
| Cover | 1.117*** |
| (0.01) | |
| Power5 | 1.396*** |
| (0.14) | |
| xp | 0.998 |
| (0.00) | |
| xp 2 | 1.000 |
| (0.00) | |
| Ethnicity | 1.131 |
| (0.09) | |
| Last game | 1.506*** |
| (0.15) | |
| Bowl game | 1.259*** |
| (0.08) | |
| Recruit | 1.000 |
| (0.00) | |
| Constant | 10.453*** |
| (1.66) | |
|
|
|
| Lngamma | −1.353*** |
| (0.10) | |
|
|
|
| Gamma | 0.258 |
| Quits | 80 |
| N | 843 |
-
*p < 0.05, **p < 0.01, ***p < 0.001.
Additionally, head coaches quit at the end of the regular season at a very high rate of 50.6 %, as well as after playing in a postseason bowl game at a rate of 25.9 %. This makes sense since some head coaches quit from their current position for another head coaching job after the regular season is over and subsequently more head coaches quit after playing in a bowl game to replace those coaches who quit before the postseason as well as to replace head coaches who are fired after the postseason. The shape (γ) parameter is again less than one, indicating the hypothesized assumption that risk is nonmonotone resulting in a relationship between analysis time and head coach quitting where the hazard initially increases and then decreases is appropriate.
7 Contract Duration: Race/Ethnicity and Conference Subdivision
There are two issues to further investigate. The first is the impact that race/ethnicity or conference type has on the duration of contract modifications for these two groups and the second is to perform a counterfactual survival analysis ignoring contract modifications, which is consistent with the literature.
7.1 Race/Ethnicity and Power5 Conference
The average predicted time to a contract modification was analyzed without time ratios, and then the average predictions were calculated separately for the two groups (i.e., non-Caucasian and Caucasian and non-Power5 Conference and Power5 Conference).
Given the prior literature has reported varying impacts regarding race/ethnicity, contract modification predictive margins are calculated for the race/ethnicity variable. Caucasian head coaches have an average predicted time to a contract modification of 26.0 games, while non-Caucasian head coaches have an average predicted time to a contract modification of 29.1 games. Given most NCAA FBS seasons are 13 games (12 regular season and one postseason), the delay of 3 games is that non-Caucasian head coaches wait for an additional 9 months before a contract modification, and given these contracts are often in the millions of dollars per year, the time value of money delay is a substantial amount of money. For Power5 conferences, the average predicted time to a contract modification is 25.7 games coached, while for non-Power5 conference teams, the average predicted time to a contract modification is 27.1 games coached.
7.2 Counterfactual Contract Duration Results: Fired Without Cause & All Dismissals
The counterfactual is the state of the world without contract modifications, and employment duration for head football coaches falls under two cases – fired “without cause” only and all dismissals (fired “without cause,” “without cause,” resigned, or retired). The event of head coaches quitting is not included. Now the number of contracts decreases to 390. Tables 6 and 7 report the counterfactual survival analysis descriptive statistics.
Counterfactual survival analysis dependent variable descriptive statistics.
| Total | Mean | Minimum | Median | Maximum | |
|---|---|---|---|---|---|
| No. of records | 390 | 1 | 1 | 1 | 1 |
| (First) entry time | 0 | 0 | 0 | 0 | |
| (Final) exit time | 47.244 | 5 | 38 | 166 | |
| Time at riska | 18,425 | 47.244 | 5 | 38 | 166 |
|
|
|||||
| Contract ending in: | |||||
|
|
|||||
| Fired | 143 | 0.367 | 0 | 0 | 1 |
| Turnover | 199 | 0.510 | 0 | 0 | 1 |
| Quits | 80 | 0.205 | 0 | 0 | 1 |
-
aTommy Bowden (Clemson) was fired (without cause) after coaching five games during the 2008 season. This is the reason for such short time periods of contract duration.
Counterfactual independent variable descriptive statistics.
| Mean | Standard deviation | Minimum | Maximum | |
|---|---|---|---|---|
| Win | 39.554 | 30.085 | 0.000 | 150.000 |
| Loss | 32.974 | 17.179 | 1.000 | 85.000 |
| Cover | 35.159 | 22.539 | 1.000 | 97.000 |
| NotCover | 37.369 | 20.981 | 4.000 | 85.000 |
| Power5 | 0.462 | – | 0.000 | 1.000 |
| xp | 48.051 | 67.459 | 1.000 | 501.000 |
| xp 2 | 6,847.995 | 19,739.526 | 1.000 | 2.51e+05 |
| Ethnicity | 0.844 | – | 0.000 | 1.000 |
| Last game | 0.400 | – | 0.000 | 1.000 |
| Bowl game | 0.315 | – | 0.000 | 1.000 |
| Recruit | 166.736 | 57.734 | 0.000 | 323.661 |
|
|
||||
| n | 390 | |||
Table 8 reports the estimated accelerated failure time survival results for fired “without cause” in column 1 and for all dismissals in column 2 under the counterfactual of ignoring contract modifications. Both models are estimated using the log-logistic model with prior experience squared based on the AIC criterion. The most striking counterfactual result in each case is that one would conclude that head coaches are fired without cause or dismissed based on their race/ethnicity. This result is highly significant and has a large hazard rate in both models: 31.6 % for fired without cause and 27.1 % for all coach dismissals. Yet, when including contract modifications, there is not enough statistical evidence to support that head coaches are fired or dismissed based on their race/ethnicity. Hence, caution should be used in studies ignoring contract modifications.
2008–2019 head coach counterfactual models.
| Dependent variable: | Fired w/o cause | Dismissal |
|---|---|---|
| Analysis time | Time ratio/se | Time ratio/se |
| Loss | 1.007 | 1.008 |
| (0.00) | (0.00) | |
| NotCover | 1.029*** | 1.024*** |
| (0.00) | (0.00) | |
| Power5 | 0.940 | 0.868 |
| (0.11) | (0.09) | |
| xp | 0.990*** | 0.994*** |
| (0.00) | (0.00) | |
| xp 2 | 1.000*** | 1.000*** |
| (0.00) | (0.00) | |
| Ethnicity | 1.316*** | 1.271*** |
| (0.10) | (0.10) | |
| Last game | 1.059 | 1.049 |
| (0.06) | (0.06) | |
| Bowl game | 2.319*** | 1.680*** |
| (0.34) | (0.16) | |
| Recruit | 1.000 | 1.000 |
| (0.00) | (0.00) | |
| Constant | 14.614*** | 15.430*** |
| (3.33) | (3.26) | |
|
|
||
| Lngamma | −1.342*** | −1.262*** |
| (0.08) | (0.06) | |
|
|
||
| Gamma | 0.261 | 0.283 |
| Fired | 143 | – |
| Dismissal | – | 199 |
| N | 390 | 390 |
-
*p < 0.05, **p < 0.01, ***p < 0.001.
8 Conclusions
Using hand collecting data on NCAA FBS head coach contract modifications, an accelerated failure time survival model was employed under the assumption that the hazard rate for contract modifications, coach dismissals, and coach quits are nonmonotone. Most importantly, the race/ethnicity variable is statistically significant under contract modifications, and the predicted means for each group show that Caucasian head football coaches receive contract modifications sooner than non-Caucasian head coaches, but race/ethnicity is not statistically significant for head coaches with other types of contract events.
Given that contract modifications are typically ignored in the literature, a counterfactual analysis is provided, where any type of contract modification is removed, and the head coaches’ contract duration continues until the head coach is dismissed. The most striking counterfactual result is that race/ethnicity is statistically significant for head coaches when they are fired without cause as well as when they are dismissed by the university. Caution is, therefore, suggested in interpreting duration models when those employment duration models ignore contract modifications for NCAA FBS head coach who are fired without cause or who are dismissed.
A future extension of the contract duration model is to investigate whether the football programs performance is different for head coaches who receive a contract modification as compared to those head coaches who do not and for head coaches who are fired as compared to head coaches who are not fired. A second related extension is to employ the wise and unwise taxonomy of managerial dismissals by Flepp and Franck (2021) to contract modifications.
References
Audas, R., S. Dobson, and J. Goddard. 1999. “Organizational Performance and Managerial Turnover.” Managerial and Decision Economics 20 (6): 305–18. https://doi.org/10.1002/(sici)1099-1468(199909)20:6<305::aid-mde933>3.0.co;2-o.10.1002/(SICI)1099-1468(199909)20:6<305::AID-MDE933>3.0.CO;2-OSearch in Google Scholar
Barros, C., B. Frick, and J. Passos. 2009. “Coaching for Survival: the Hazards of Head Coach Careers in the German ‘Bundesliga’.” Applied Economics 41: 3303–11. https://doi.org/10.1080/00036840701721455.Search in Google Scholar
Berri, D., and S. Brook. 2010. “On the Evaluation of the ‘Most Important’ Position in Professional Sports.” Journal of Sports Economics 11 (2): 157–71. https://doi.org/10.1177/1527002510363097.Search in Google Scholar
Brook, S. 2021. “A Comparison of NCAA FBS Head Coaches Salary Determination from New and Modified Contracts.” Journal of Sports Economics 22 (5): 491–513. https://doi.org/10.1177/1527002520988336.Search in Google Scholar
d’Addona, S., and A. Kind. 2014. “Forced Manager Turnovers in English Soccer Leagues: A Long-Term Perspective.” Journal of Sports Economics 12 (2): 150–79. https://doi.org/10.1177/1527002512447803.Search in Google Scholar
Flepp, R., and E. Franck. 2021. “The Performance Effects of Wise and Unwise Managerial Dismissals.” Economic Inquiry 59 (1): 186–98. https://doi.org/10.1111/ecin.12924.Search in Google Scholar
Fogarty, K., B. Soebbing, and K. Agyemang. 2015. “NCAA Division I-FBS Salary Determinants: A Look at New and Amended Contracts.” Journal of Issues in Intercollegiate Athletics 8: 123–38.Search in Google Scholar
Groothuis, P., and J. Hill. 2013. “Pay Discrimination, Exit Discrimination or Both? Another Look at an Old Issue Using NBA Data.” Journal of Sports Economics 14 (2): 171–85. https://doi.org/10.1177/1527002511418515.Search in Google Scholar
Holmes, P. 2011. “Win or Go Home: Why College Football Coaches Get Fired.” Journal of Sports Economics 12 (2): 157–78. https://doi.org/10.1177/1527002510378820.Search in Google Scholar
Hosmer, D., and S. Lemeshow. 1999. Applied Survival Analysis: Regression Modeling of Time to Event Data. New York: Wiley and Sons.Search in Google Scholar
Humphreys, B., R. Paul, and A. Weinbach. 2016. “Performance Expectations and the Tenure of Head Coaches: Evidence From NCAA Football.” Research in Economics 70: 482–92. https://doi.org/10.1016/j.rie.2016.07.001.Search in Google Scholar
Jenkins, J. 1996. “A Reexamination of Salary Determination in Professional Basketball.” Social Science Quarterly 77 (3): 594–608.Search in Google Scholar
Jepsen, C. 2023. “Determinants of Career Exits and Career Breaks in Women’s Professional Basketball.” Journal of Sports Economics 24 (8): 1055–75. https://doi.org/10.1177/15270025231190647.Search in Google Scholar
Kahn, L. 2006. “Race, Performance, Pay and Retention Among National Basketball Association Head Coaches.” Journal of Sports Economics 7 (2): 119–49. https://doi.org/10.1177/1527002505276723.Search in Google Scholar
Krautmann, A. 2018. “Contract Extensions: The Case of Major League Baseball.” Journal of Sports Economics 19 (3): 299–314. https://doi.org/10.1177/1527002516656727.Search in Google Scholar
Lefgren, L., B. Platt, J. Price, and S. Higbee. 2019. “Outcome Based Accountability: Theory and Evidence.” Journal of Economic Behavior & Organization 160: 121–37. https://doi.org/10.1016/j.jebo.2019.02.012.Search in Google Scholar
Maxcy, J. 2013. “Efficiency and Managerial Performance in FBS College Football: To the Employment and Succession Decisions, Which Matters More, Coaching or Recruiting?” Journal of Sports Economics 14 (4): 368–88. https://doi.org/10.1177/1527002513497170.Search in Google Scholar
Mixon, F., and L. Treviño. 2004. “How Race Affects Dismissals of College Football Coaches.” Journal of Labor Research 25 (4): 645–56. https://doi.org/10.1007/s12122-004-1015-8.Search in Google Scholar
Pieper, J., S. Nüesch, and E. Franck. 2014. “How Performance Expectations Affect Managerial Replacement Decisions.” Schmalenbach Business Review 66: 5–23. https://doi.org/10.1007/bf03396867.Search in Google Scholar
Salaga, S., and M. Juravich. 2020. “National Football League Head Coach Race, Performance, Retention, and Dismissal.” Sport Management Review 23 (5): 978–91. https://doi.org/10.1016/j.smr.2019.12.005.Search in Google Scholar
Semmelroth, D. 2022. “Time to Say Goodbye: A Duration Analysis of the Determinants of Coach Dismissals and Quits in Major League Soccer.” Journal of Sports Economics 23 (1): 95–120. https://doi.org/10.1177/15270025211034820.Search in Google Scholar
Soebbing, B., P. Wicker, and D. Weimar. 2015. “The Impact of Leadership Changes on Expectations of Organizational Performance.” Journal of Sport Management 29: 485–97. https://doi.org/10.1123/jsm.2014-0089.Search in Google Scholar
van Ours, J., and M. van Tuijl. 2016. “In-season Head Coach Dismissals and the Performance of Professional Football Teams.” Economic Inquiry 54 (1): 591–604. https://doi.org/10.1111/ecin.12280.Search in Google Scholar
© 2024 the author(s), published by De Gruyter, Berlin/Boston
This work is licensed under the Creative Commons Attribution 4.0 International License.
Articles in the same Issue
- Frontmatter
- Editorial
- Guest Editorial
- Special Issue Articles
- Is Blood Thicker than Water? The Impact of Player Agencies on Player Salaries: Empirical Evidence from Five European Football Leagues
- When Colleagues Come to See Each Other as Rivals: Does Internal Competition Affect Workplace Performance?
- Pregnancy in the Paint and the Pitch: Does Giving Birth Impact Performance?
- An Empirical Estimation of NCAA Head Football Coaches Contract Duration
- Race, Market Size, Segregation and Subsequent Opportunities for Former NFL Head Coaches
- Football Fans’ Interest in and Willingness-To-Pay for Sustainable Merchandise Products
- Change in Home Bias Due to Ghost Games in the NFL
- Consumer Perceptions Matter: A Case Study of an Anomaly in English Football
- Talent Allocation in European Football Leagues: Why Competitive Imbalance May be optimal?
- Data Observer
- SOEP-LEE2: Linking Surveys on Employees to Employers in Germany
- The IAB-SMART-Mobility Module: An Innovative Research Dataset with Mobility Indicators Based on Raw Geodata
- Miscellaneous
- Annual Reviewer Acknowledgement