Change in Home Bias Due to Ghost Games in the NFL
-
Stephan Starke


Abstract
We analyse changes in the National Football League (NFL) due to ghost games in 2020. The home bias disappears as expected. This also applies to semi-ghost games with significantly fewer spectators than regular games and to referee decisions regarding penalties.
1 Introduction
“Practice,” that was New England Patriots head coach Bill Belichick’s succinct answer to the question of how he could describe the atmosphere without fans in the stadium and whether it was comparable to anything in his 45-year coaching career in the NFL (Sphigel 2020). A day earlier, his team won the season opener at home against the Miami Dolphins but had to play in front of an empty crowd at home in Gillette Stadium, which has a capacity of 66,000 under normal conditions.
The global corona pandemic affected the reality of life for all of us, for example through adherence to distance and hygiene rules, reduction of social contacts or simply the worry of falling ill ourselves. In addition, the economic and cultural impact of the prevailing situation was immense. However, the world’s top sports have managed to hold games and complete competitions despite strict regulations. Depending on the political measures, the number of spectators on site had been greatly reduced to the point of holding ghost games in front of completely empty stands.
The US professional football league NFL also completed its 2020 season under the influence of the pandemic. While the draft in May, i.e. the allocation of college talent to the teams, and numerous training sessions in the spring and summer took place exclusively digitally, the league was able to hold its games completely and with only a few postponements in the time frame of a corona-free season.
What is a bitter loss for the sport and its fans gives academia the opportunity to gain new insights based on changed conditions. The games can be interpreted as quasi-experiments in which the spectators, or their absence, are understood as a treatment and thus the influence of (absent) spectators on various aspects can be measured. In the medium term, the question of whether fans have an influence on the game and how strong it is can be answered for each sport observed. In addition, comparisons can be made between the disciplines, the influences of spectators can be classified and thus facets of the sports can be explained.
In the NFL, spectators in the stadium are encouraged to actively intervene in the game. Through acoustic and visual motivation of the stadium announcer, the behaviour is established that during plays of the home offense the fans keep quiet in order not to disturb the communication of their own team. However, when the visiting team’s offence is on the field, spectators are encouraged to be as loud as possible, making tactical instructions difficult for the opponent to understand and implement. In addition, the typical American football game, in which a few seconds of action are followed by a longer break for substitutions and tactical discussions, does not require the spectators to be engaged throughout, but rather to provide support at specific moments of the game. For example, an NFL stadium typically becomes particularly loud on extremely important plays, such as third downs or a close score at the end of the game, as external fan influence is to be maximised on crucial plays and spectators take a more passive role in other situations. This is a clear contrast to football, for example, in which fans support their own team loudly throughout a half.
Even though in 2021 spectators at the screens have already become accustomed, the training atmosphere Belichick spoke of can be recreated. The lack of noise in the stands, for example, allows unfamiliar insights into the communication between players on the field. But how much are NFL football games really shaped by the sharp reduction in crowd size? Conversely, how much do NFL teams benefit from their fans in home games and how much are referees influenced by supporting crowds? We use econometric methods to shed light on and answer these questions in this study.
2 Theoretical Background
Much research has been conducted on home bias in the NFL and other sports. Early studies showed that home teams in the NFL enjoy an advantage over visiting teams, but that this advantage is smaller than in the other three major US sports, baseball, basketball and hockey (cf. Schwartz and Barsky 1977). Vergin and Sosik (1999) showed a significant home bias in the NFL, which the betting market takes into account in 67 % of all games with a favourite role of the host. The results in Albert and Koning (2007) confirm the hypothesis of a significant cross-league home bias in the overall sport of American football by analysing data from the NFL, US college football and the Australian professional league AFL.
In the MLB season 2020, which was also under the influence of the COVID-19 pandemic, no statistically significant difference could be found compared to the home game bias of the previous season (cf. Losak and Sabel 2021). In the NBA it was found that games with spectator restrictions were more often finished with a larger lead than games without spectator restrictions (cf. Steinfeld, Dallmeyer, and Breuer 2022).
A long-term increase in home bias can be identified between the years 1980 and 2005, which has since regressed in a slower form (cf. Jones 2016). Injuries cannot explain the recent downward trend in home bias, as they do not differ significantly between home and visiting teams but appear more frequently in all teams as the season progresses (cf. Jones 2016, 5).
Research on home bias and its roots is also pronounced in other sports. Boyko, Boyko, and Boyko (2007) show that in football a home bias does not only exist per se, but also correlates positively with increasing spectator numbers. This home bias is reflected in goal difference and referee decisions (yellow cards, red cards, penalties given). Among the referees, an individual home preference could additionally be identified. The two-year ban on visiting fans in the Argentinian Primera Division, the highest national division, which was enacted in 2013, demonstrated that the home bias is more pronounced with a decreasing number of visiting fans than with an average number of supporters of the visiting team (cf. Colella, Dalton, and Giusti 2021).
Rickman and Witt (2008) show that the home bias of referees can be reduced with increased pay. External material influences, such as bribery, can also change the advantage in both directions. In individual sports, home bias has only been shown to a limited extent to date. In tennis, for example, statistically significant results were only found for the men’s competition, while no clear picture could be drawn for the women’s competition (cf. Koning 2011).
Research on ghost games has proven difficult to conduct in the past, as the number of ghost games was hardly sufficient for an academic analysis. Reade, Schreyer, and Singleton (2022), using data from 2003 until shortly before the outbreak of the global corona pandemic, find no significant effect of ghost games on game results in football but a reduction of yellow cards for the away team attributed to referee bias in regular games with crowds supporting the home team. The pandemic permanently changed the data situation, as large crowds were banned in large parts of the world due to massive contact reductions and games of various sports were nevertheless held in front of empty stands for economic reasons.
The first empirical results of the effects of ghost games in the pandemic seasons are already available, especially in football. For example, a significant reduction to the point of negating the home bias in front of empty stands could be shown for the 1st Bundesliga in Germany, which can be explained at least in part by my more equal decisions of the referees (cf. Dilger and Vischer 2022). The results of this work are supported by most other publications on the effects of ghost games in football (see the good overview of early studies by Reade, Schreyer, and Singleton 2022). Scoppa (2021) shows a significant decline in home bias with simultaneous equalisation of the visiting team by the referee in his analysis of the two highest football leagues in Germany, England, France and Italy as well as the first Portuguese league. While Fischer and Haucap (2021) cannot establish a statistically significant change in home bias in the 2nd and 3rd German Bundesliga, their results also confirm the findings for the 1st Bundesliga.
In the NBA playoffs, Price and Yan (2022) find a negation of the home bias. However, the tournament took place within the framework of a player bubble on neutral ground in Orlando and was not played in the respective home venues of the teams. For the MLB playoffs it can only be assumed that ghost games have a negative impact on the offensive performance of home teams (cf. Currea 2021).
Besides well-known sports journalism websites (Jones 2020; Princiotti 2021), there is already one academic study of ghost games in the NFL. Ehrlich et al. (2024) find that the home bias is gone in ghost games but not in semi-ghost games with a (strongly) reduced number of spectators. In the following we can confirm their first result but the second one only under special conditions, not in general. We also look at penalties and can confirm the results of Reade, Schreyer, and Singleton (2022) who find a reduction of the referee bias for home teams without spectators.
3 Hypotheses
We consider the largely spectatorless NFL season 2020 (see Chapter 4) as a natural experiment, assuming that the lack of spectators is the most important difference between this season and the regular seasons 2011 to 2019. This is the first hypothesis, based on the research already presented on other sports:
H1:
Ghost (and semi-ghost) games reduce the home bias in the NFL.
In addition to the game decision, the difference in points is also taken into account in the analysis. Moreover, other statistical indicators are checked for significant changes between the groups under consideration. A variety of game statistics are used to examine the impact of the lack of spectators on the game at the micro level, so that a statement can be made whether ghost games favour NFL offenses and thus favour higher-scoring games or more efficient ball movement.
The behaviour of referees is a recurring focus of research and may explain the home bias. Accordingly, our second hypothesis is as follows:
H2:
The preference given to home teams by NFL referees is negated by ghost games.
4 Data
For the empirical analysis of the ghost games, we compare data from the 13 NFL seasons from 2010 to 2023, which took place under normal audience conditions, with those from 2020. Only the annual 256 regular season games are taken into account, as the seeding mode of the NFL playoffs rewards strong teams with home games, which would distort the data set for this study. The NFL preseason, on the other hand, has too little sporting value to be included in the analysis due to the high injury risk of the sport and the resulting large number of deployments of actual substitute players. Because we are interested in the impact of the home bias in the NFL, we exclude games executed on neutral ground from our data set. There are three ghost games that took place on neutral ground due to COVID-19 regulations. In the other seasons, this affects a total of 34 matches, of which a few were not played at their home stadium due to weather conditions and most due to internationalisation. Thus, we have 3,308 games in the control group.
Ghost games are generally defined as games played in front of no audience. However, due to the highly federal nature of the NFL’s audience regulations during the pandemic, a distinction must be made. Of the 256 games in the 2020 season, 149 were held in front of exclusively empty stands, three of them on neutral ground. Hundred and seven games were played with greatly reduced crowds. The Pittsburgh Steelers game against the Dallas Cowboys in Week 9 represented the peak attendance with 31,700 spectators. This represents 32 % of the total capacity of AT&T Stadium, the Cowboys’ home venue, which is our cut-off value for semi-ghost games. On average, these semi-ghost games were attended by 11,256 spectators, equivalent to 15.4 % stadium occupancy.
When visiting the stadium, fans had to adhere to strict hygiene guidelines and were therefore not allowed to exceed a volume of 70 dB, among other things, while fan sounds recorded in ghost games were also allowed to be played over the loudspeakers at up to 70 dB (cf. NFL Football Operations 2020). Thus, players compared the atmosphere in semi-ghost games with that in training sessions (cf. Cronin and NFL Nation 2020).
We initially apply the statistical analyses exclusively to real ghost games in order to shed light on the differences between ghost games and semi-ghost games in a further step. In the 2021 season, there were still a few games with restrictions due to the COVID-19 pandemic. With 35,242 spectators, the New Orleans Saints versus Green Bay Packers game is the low point here. The next game with a similarly low attendance already has over 45,000 spectators, meaning that we can no longer identify any semi-ghost games in this season.
For the evaluation, the following data was collected, each for home and visiting team and, if meaningful, as a difference of both teams: Score, points scored, pass attempts, passes completed, pass yards, pass touchdowns, interceptions, sacks allowed, sack yards allowed, passer rating, runs, run yards, run touchdowns, penalties, penalty yards, 1st downs, 1st downs by runs, 1st downs by pass and 1st downs by penalty. A large part of the data was aggregated via the paid statistics portal stathead.com. In addition, data from nflpenalties.com for penalties and penalty yards are included. Furthermore, the freely available spectator numbers per game from espn.com are used. All these variables are available for each of the 3,564 games from the 2010 season onwards. The analysis is supported by the statistical data and analysis software Stata.
5 Empirical Results
For an initial overview, the annual course of the home winning percentage in the NFL is examined for the seasons 2010 to 2023, see Figure 1. Due to decisive overtime rules (cf. Martin, Logan, and Powell 2018), draws occur extremely rarely in the NFL. In the 14 seasons considered, 12 games ended without a winner (including one in 2020), which corresponds to a share of 0.34 % of all games. Therefore, this paper focuses on the home win percentage as a measure of home field advantage.
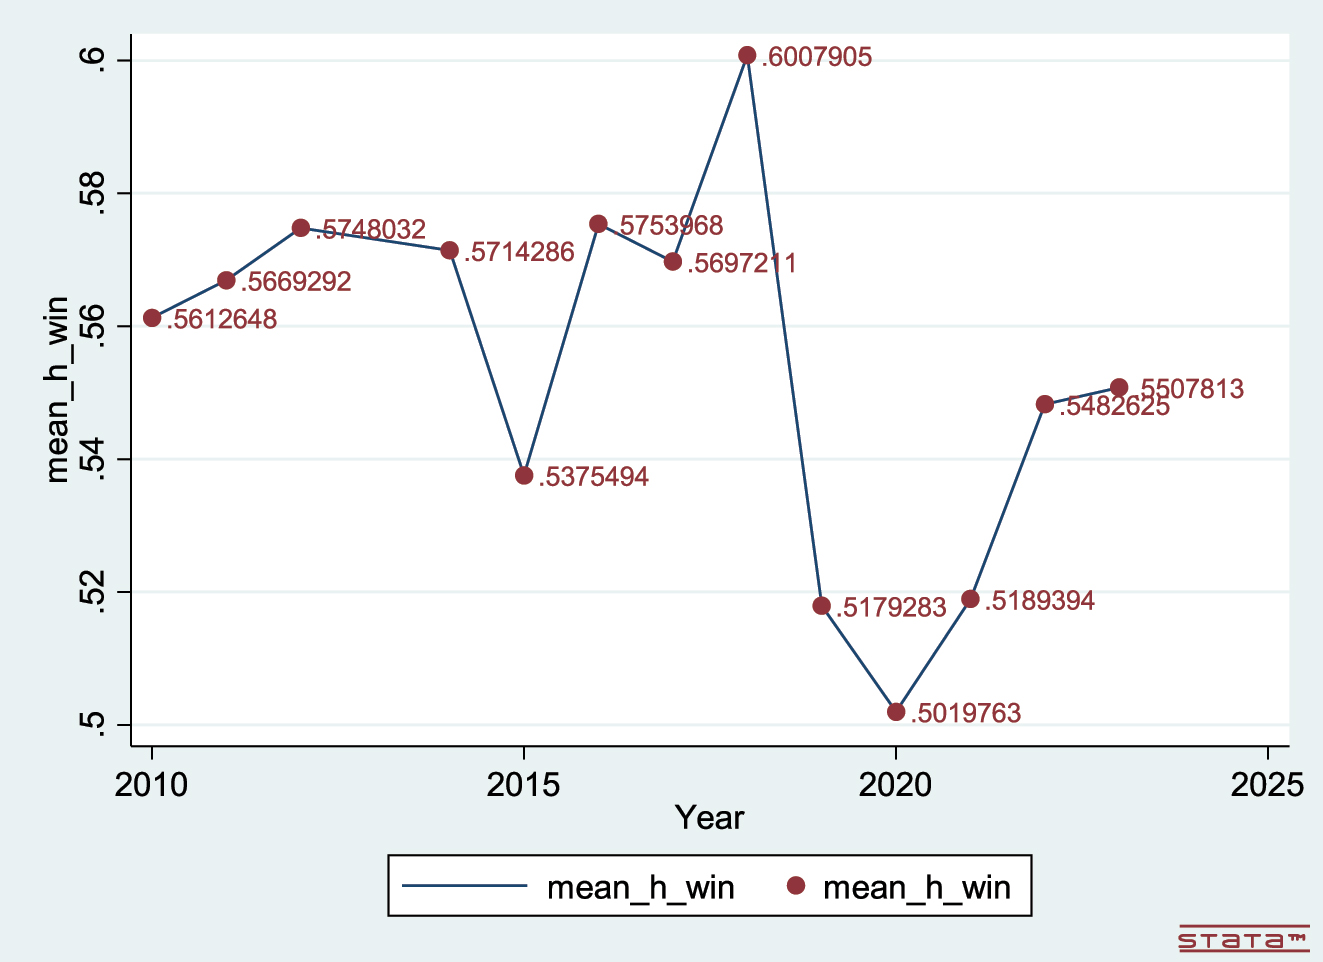
Average share of home wins per Season.
Further, the points difference between the teams and the points scored by both teams per match are considered. Like every difference statistic in this paper, the point difference is calculated by subtracting the points scored by the visiting team from those of the home team (H – A). If the points difference is positive, the home team scored more points per game than the visitors on average in the season under consideration, and vice versa.
In the 10 seasons before corona, home teams scored on average 2.19 points more than their visiting rivals in the regular season (home 23.74 vs. visiting 21.55). During this period, an average of 45.29 points per game was scored. Between 2010 and 2019, the correlation between year and combined points is positive (0.28). This shift in the balance of power between offenses and defences is also perceived in current sports journalism and is primarily attributed to new rules that make the game higher-scoring and thus more spectacular (cf. Clark 2019; Sphigel and Pennington 2019). In the corona season, even more points were scored (49.6 on average), while the average point difference can be described as almost neutral (0.05).
In the seasons 2010 to 2019, an average of 67,806 spectators attended the games. There is a slight decrease between 2016 and 2019, but an overall fairly stable picture of stadium attendance before the pandemic. The games of the 2020 season are to be subdivided. The 107 semi-ghost games were held with an average of 11,255 spectators, while the 146 genuine ghost games were held in front of empty stands by definition. 2021 to 2023 there were 68,791 spectators on average, even more than before the pandemic.
5.1 Descriptive Analysis
Table 1a shows the descriptive data of all seasons and only 2017 to 2023, Table 1b shows these date for the ghost and semi-ghost games in the 2020 season. The mean values, standard deviations, minima and maxima of the respective statistics are shown and the variables are explained in the text below.
Descriptive statistics for seasons 2010–2023 and 2017–2023.
| Season 2010–2023 | Seasons 2017–2023 | |||||||
|---|---|---|---|---|---|---|---|---|
| Mean | SD | Min | Max | Mean | SD | Min | Max | |
| h_win | 0.56 | 0.50 | 0.00 | 1.00 | 0.54 | 0.50 | 0.00 | 1.00 |
| h_points | 23.74 | 10.22 | 0.00 | 70.00 | 23.59 | 10.14 | 0.00 | 70.00 |
| a_points | 21.68 | 9.86 | 0.00 | 59.00 | 22.00 | 9.94 | 0.00 | 59.00 |
| diff_points | 2.06 | 14.45 | −49.00 | 58.00 | 1.59 | 14.30 | −49.00 | 50.00 |
| sum_points | 45.42 | 13.95 | 3.00 | 105.00 | 45.59 | 14.10 | 3.00 | 105.00 |
| diff_passes_compl | 0.22 | 8.88 | −31.00 | 38.00 | 0.36 | 8.82 | −29.00 | 38.00 |
| diff_passes_attemp | −0.23 | 12.98 | −43.00 | 52.00 | 0.08 | 12.61 | −43.00 | 52.00 |
| h_passes_compl% | 0.64 | 0.10 | 0.11 | 0.97 | 0.65 | 0.09 | 0.11 | 0.97 |
| a_passes_compl% | 0.62 | 0.10 | 0.25 | 0.96 | 0.64 | 0.09 | 0.30 | 0.96 |
| diff_passes_compl% | 0.01 | 0.13 | −0.45 | 0.55 | 0.01 | 0.13 | −0.45 | 0.55 |
| h_yards_pass | 234.75 | 77.30 | 12.00 | 522.00 | 231.39 | 77.20 | 12.00 | 498.00 |
| a_yards_pass | 228.56 | 78.33 | 1.00 | 516.00 | 226.62 | 79.02 | 1.00 | 477.00 |
| diff_yards_pass | 6.17 | 100.50 | −364.00 | 365.00 | 4.80 | 101.38 | −364.00 | 365.00 |
| h_passyards_ratio | 6.89 | 1.93 | 1.00 | 15.00 | 6.81 | 1.94 | 1.00 | 15.00 |
| a_passyards_ratio | 6.66 | 2.65 | 0.10 | 116.50 | 6.64 | 1.92 | 0.10 | 14.89 |
| diff_passyards_ratio | 0.24 | 3.31 | −111.11 | 9.82 | 0.17 | 2.73 | −8.94 | 9.20 |
| h_pass_touch | 1.59 | 1.17 | 0.00 | 7.00 | 1.58 | 1.17 | 0.00 | 6.00 |
| a_pass_touch | 1.47 | 1.14 | 0.00 | 7.00 | 1.48 | 1.15 | 0.00 | 6.00 |
| diff_pass_touch | 0.12 | 1.51 | −7.00 | 5.00 | 0.10 | 1.50 | −6.00 | 5.00 |
| diff_interception | −0.03 | 1.44 | −6.00 | 5.00 | −0.05 | 1.38 | −5.00 | 5.00 |
| diff_sacks | −0.12 | 2.53 | −9.00 | 11.00 | −0.09 | 2.59 | −9.00 | 11.00 |
| diff_yards_sack | −0.82 | 18.61 | −87.00 | 77.00 | −0.41 | 19.28 | −82.00 | 77.00 |
| diff_pass_rate | 5.12 | 38.26 | −125.80 | 123.00 | 4.27 | 37.29 | −117.20 | 120.50 |
| diff_rush_yards | 5.76 | 80.07 | −271.00 | 307.00 | 4.91 | 80.41 | −271.00 | 307.00 |
| diff_rush_yards_att | 0.07 | 1.81 | −6.98 | 6.80 | 0.07 | 1.79 | −6.98 | 6.80 |
| h_run_touch | 0.90 | 0.95 | 0.00 | 7.00 | 0.94 | 0.95 | 0.00 | 7.00 |
| a_run_touch | 0.77 | 0.88 | 0.00 | 6.00 | 0.84 | 0.92 | 0.00 | 6.00 |
| diff_run_touch | 0.13 | 1.31 | −6.00 | 5.00 | 0.10 | 1.34 | −6.00 | 5.00 |
| h_penalties | 6.11 | 2.68 | 0.00 | 20.00 | 5.91 | 2.60 | 0.00 | 18.00 |
| a_penalties | 6.46 | 2.78 | 0.00 | 23.00 | 6.36 | 2.72 | 0.00 | 16.00 |
| diff_penalties | −0.35 | 3.53 | −17.00 | 13.00 | −0.44 | 3.37 | −12.00 | 13.00 |
| h_pen_yards | 51.83 | 26.26 | 0.00 | 182.00 | 50.42 | 25.98 | 0.00 | 182.00 |
| a_pen_yards | 55.01 | 27.46 | 0.00 | 200.00 | 53.93 | 27.20 | 0.00 | 166.00 |
| diff_pen_yards | 1.82 | 34.96 | −128.00 | 138.00 | 0.77 | 34.05 | −128.00 | 125.00 |
| sum_penalties | 12.58 | 4.18 | 2.00 | 29.00 | 12.29 | 4.12 | 2.00 | 28.00 |
| sum_pen_yards | 106.92 | 40.86 | 10.00 | 292.00 | 104.48 | 40.96 | 15.00 | 292.00 |
| h_firstdown | 20.39 | 4.94 | 5.00 | 40.00 | 20.57 | 4.87 | 5.00 | 36.00 |
| a_firstdown | 19.55 | 5.05 | 4.00 | 36.00 | 19.75 | 5.13 | 4.00 | 36.00 |
| diff_firstdown | 0.84 | 7.36 | −24.00 | 31.00 | 0.82 | 7.31 | −23.00 | 24.00 |
| h_firstdown_rush | 6.36 | 3.10 | 0.00 | 21.00 | 6.60 | 3.19 | 0.00 | 21.00 |
| a_firstdown_rush | 5.60 | 3.30 | 0.00 | 21.00 | 6.26 | 3.08 | 0.00 | 21.00 |
| h_firstdown_pass | 12.08 | 3.96 | 1.00 | 29.00 | 11.96 | 3.99 | 1.00 | 29.00 |
| a_firstdown_pass | 10.99 | 4.89 | 0.00 | 27.00 | 11.72 | 4.00 | 1.00 | 25.00 |
| h_firstdown_pen | 1.95 | 1.49 | 0.00 | 10.00 | 2.00 | 1.48 | 0.00 | 9.00 |
| a_firstdown_pen | 1.63 | 1.41 | 0.00 | 8.00 | 1.76 | 1.34 | 0.00 | 7.00 |
| N | 3,564 | 1,787 | ||||||
-
N, sample size; SD, standard deviation; Min, minimum; Max, maximum.
Descriptive statistics ghost games and semi-ghost games 2020.
| Ghost games in 2020 | Semi-ghost games in 2020 | |||||||
|---|---|---|---|---|---|---|---|---|
| Mean | SD | Min | Max | Mean | SD | Min | Max | |
| h_win | 0.48 | 0.50 | 0.00 | 1.00 | 0.53 | 0.50 | 0.00 | 1.00 |
| h_points | 23.76 | 9.13 | 0.00 | 56.00 | 26.37 | 10.09 | 3.00 | 52.00 |
| a_points | 24.11 | 9.74 | 3.00 | 48.00 | 25.57 | 10.76 | 0.00 | 49.00 |
| diff_points | −0.35 | 13.97 | −45.00 | 37.00 | 0.80 | 14.77 | −35.00 | 37.00 |
| sum_points | 47.87 | 12.70 | 23.00 | 82.00 | 51.94 | 14.73 | 17.00 | 89.00 |
| diff_passes_compl | −0.84 | 9.40 | −21.00 | 27.00 | −0.36 | 9.08 | −26.00 | 25.00 |
| diff_passes_attemp | −1.00 | 13.07 | −31.00 | 33.00 | −0.38 | 13.43 | −39.00 | 30.00 |
| h_passes_compl% | 0.65 | 0.10 | 0.11 | 0.84 | 0.65 | 0.10 | 0.29 | 0.95 |
| a_passes_compl% | 0.66 | 0.09 | 0.41 | 0.89 | 0.66 | 0.09 | 0.38 | 0.90 |
| diff_passes_compl% | −0.01 | 0.14 | −0.45 | 0.42 | −0.00 | 0.13 | −0.29 | 0.34 |
| h_yards_pass | 224.64 | 75.94 | 12.00 | 434.00 | 249.85 | 84.41 | 48.00 | 481.00 |
| a_yards_pass | 243.62 | 77.47 | 59.00 | 477.00 | 247.10 | 75.28 | 95.00 | 456.00 |
| diff_yards_pass | −18.98 | 103.94 | −364.00 | 195.00 | 2.75 | 97.50 | −250.00 | 318.00 |
| h_passyards_ratio | 6.57 | 1.90 | 1.33 | 11.43 | 7.06 | 1.69 | 2.29 | 12.07 |
| a_passyards_ratio | 6.94 | 1.79 | 2.68 | 12.28 | 7.00 | 1.86 | 3.06 | 11.74 |
| diff_passyards_ratio | −0.37 | 2.62 | −8.56 | 6.08 | 0.05 | 2.43 | −5.13 | 5.22 |
| h_pass_touch | 1.67 | 1.24 | 0.00 | 5.00 | 1.74 | 1.21 | 0.00 | 5.00 |
| a_pass_touch | 1.59 | 1.18 | 0.00 | 6.00 | 1.85 | 1.16 | 0.00 | 5.00 |
| diff_pass_touch | 0.08 | 1.69 | −6.00 | 4.00 | −0.11 | 1.56 | −4.00 | 5.00 |
| diff_interception | 0.02 | 1.25 | −4.00 | 3.00 | 0.07 | 1.44 | −3.00 | 5.00 |
| diff_sacks | −0.18 | 2.52 | −6.00 | 7.00 | −0.47 | 2.33 | −6.00 | 4.00 |
| diff_yards_sack | −0.54 | 19.66 | −51.00 | 54.00 | −2.63 | 16.82 | −53.00 | 35.00 |
| diff_pass_rate | 0.46 | 38.39 | −107.10 | 93.30 | −0.27 | 37.25 | −97.90 | 84.70 |
| diff_rush_yards | 4.73 | 71.81 | −179.00 | 195.00 | −3.21 | 91.89 | −257.00 | 220.00 |
| diff_rush_yards_att | 0.25 | 1.83 | −3.58 | 5.86 | 0.18 | 1.71 | −4.42 | 6.33 |
| h_run_touch | 0.97 | 0.87 | 0.00 | 4.00 | 1.16 | 1.13 | 0.00 | 7.00 |
| a_run_touch | 1.05 | 0.99 | 0.00 | 4.00 | 1.03 | 1.07 | 0.00 | 5.00 |
| diff_run_touch | −0.08 | 1.34 | −4.00 | 4.00 | 0.13 | 1.51 | −3.00 | 5.00 |
| h_penalties | 5.40 | 2.24 | 0.00 | 11.00 | 5.51 | 2.24 | 0.00 | 10.00 |
| a_penalties | 5.95 | 2.46 | 2.00 | 14.00 | 5.63 | 2.47 | 0.00 | 13.00 |
| diff_penalties | −0.55 | 2.98 | −10.00 | 7.00 | −0.11 | 3.08 | −9.00 | 6.00 |
| h_pen_yards | 45.90 | 24.13 | 0.00 | 119.00 | 49.23 | 24.90 | 0.00 | 116.00 |
| a_pen_yards | 51.53 | 25.74 | 10.00 | 132.00 | 48.63 | 23.41 | 0.00 | 141.00 |
| diff_pen_yards | 5.62 | 31.09 | −59.00 | 116.00 | −0.98 | 32.87 | −80.00 | 92.00 |
| sum_penalties | 11.35 | 3.64 | 3.00 | 20.00 | 11.14 | 3.57 | 3.00 | 20.00 |
| sum_pen_yards | 97.43 | 39.02 | 15.00 | 222.00 | 97.86 | 35.42 | 20.00 | 190.00 |
| h_firstdown | 21.18 | 4.70 | 6.00 | 31.00 | 21.77 | 5.47 | 8.00 | 36.00 |
| a_firstdown | 21.93 | 5.06 | 10.00 | 36.00 | 22.03 | 5.05 | 10.00 | 34.00 |
| diff_firstdown | −0.75 | 7.12 | −20.00 | 16.00 | −0.26 | 7.29 | −23.00 | 13.00 |
| h_firstdown_rush | 6.99 | 3.12 | 1.00 | 18.00 | 6.76 | 3.37 | 0.00 | 21.00 |
| a_firstdown_rush | 6.97 | 2.81 | 1.00 | 15.00 | 7.15 | 3.67 | 0.00 | 19.00 |
| h_firstdown_pass | 12.15 | 3.97 | 1.00 | 23.00 | 13.08 | 4.58 | 1.00 | 29.00 |
| a_firstdown_pass | 13.08 | 4.24 | 1.00 | 22.00 | 12.87 | 3.76 | 5.00 | 21.00 |
| h_firstdown_pen | 2.03 | 1.36 | 0.00 | 6.00 | 1.93 | 1.46 | 0.00 | 7.00 |
| a_firstdown_pen | 1.88 | 1.38 | 0.00 | 7.00 | 2.01 | 1.35 | 0.00 | 5.00 |
| N | 146 | 107 | ||||||
-
N, sample size; SD, standard deviation; Min, minimum; Max, maximum.
The binary variable h_win indicates whether the home team won (1) or not (0) in the game under consideration. The points scored by both teams are shown as h_points and a_points. The difference between them shows the variable diff_points, the sum of both scores the variable sum_points. In addition to these variables, statistical difference values of both teams are shown. For this purpose, the respective value of the visiting team is subtracted from that of the home team (H – A). These difference variables are identified by the prefix diff_. The respective statistics for home and visiting teams are also available and can be used for analysis.
At first glance, a decline in the home advantage of about eight percentage points can already be seen (for ghost games compared to all seasons). The visitors’ offences in particular seem to benefit from ghost games, scoring on average 2.43 points more than the long-term average.
5.2 Significance Tests
Two-tailed t-tests of independent samples are conducted for all existing difference variables of the game. This allows the results already presented to be tested and further variables to be included. To test the second hypothesis, a separate look at the referees’ decisions will be made (see Tables 5 and 7 below).
Table 2 shows the results of t-tests of independent samples consisting of either the ghost or the semi-ghost games in 2020 compared to the regular games either in all seasons or 2017–2023. The home win probability and the point difference are significantly lower in ghost games but not in semi-ghost games, while the points scored by the visiting team are strongly and significantly higher both in ghost and semi-ghost games. A significant difference on the points scored by the home team cannot be found for the ghost games but for the semi-ghost games, explaining the difference in the home win probability and point difference.
t-Tests for ghost games compared to regular games.
| (1) | (2) | (3) | (4) | |
|---|---|---|---|---|
| h_win | −0.0818* | −0.0285 | −0.0714* | −0.0181 |
| (−1.95) | (−0.58) | (−1.66) | (−0.36) | |
| h_points | 0.110 | 2.724*** | 0.383 | 2.997*** |
| (0.13) | (2.70) | (0.44) | (2.94) | |
| a_points | 2.663*** | 4.124*** | 2.559*** | 4.020*** |
| (3.22) | (4.27) | (3.01) | (4.06) | |
| diff_points | −2.553** | −1.400 | −2.176* | −1.023 |
| (−2.09) | (−0.99) | (−1.76) | (−0.71) | |
| sum_points | 2.774** | 6.848*** | 2.943** | 7.017*** |
| (2.37) | (5.00) | (2.44) | (4.98) | |
| diff_passes_compl | −1.129 | −0.642 | −1.364* | −0.877 |
| (−1.50) | (−0.74) | -(1.79) | (−1.00) | |
| diff_passes_attemp | −0.809 | −0.192 | −1.219 | −0.602 |
| (−0.74) | (−0.15) | (−1.12) | (−0.48) | |
| diff_passes_compl% | −0.0227** | −0.0186 | −0.0228** | −0.0187 |
| (−2.02) | (−1.43) | (−2.00) | (−1.43) | |
| diff_yards_pass | −26.37*** | −4.643 | −26.19*** | −4.463 |
| (−3.10) | (−0.47) | (−2.98) | (−0.44) | |
| diff_passyards_ratio | −0.638** | −0.216 | −0.604** | −0.182 |
| (−2.27) | (−0.66) | (−2.54) | (−0.67) | |
| diff_pass_touch | −0.0462 | −0.241 | −0.0386 | −0.233 |
| (−0.36) | (−1.63) | (−0.30) | (−1.58) | |
| diff_interception | 0.0614 | 0.116 | 0.0806 | 0.135 |
| (0.50) | (0.81) | (0.67) | (0.97) | |
| diff_sacks | −0.0747 | −0.357 | −0.136 | −0.418 |
| (−0.35) | (−1.44) | (−0.60) | (−1.61) | |
| diff_yards_sack | 0.234 | −1.851 | −0.296 | −2.381 |
| (0.15) | (−1.01) | (−0.18) | (−1.24) | |
| diff_pass_rate | −5.037 | −5.763 | −4.489 | −5.215 |
| (−1.56) | (−1.53) | (−1.39) | (−1.40) | |
| diff_rush_yards | −1.358 | −9.296 | −0.755 | −8.694 |
| (−0.20) | (−1.18) | (−0.11) | (−1.07) | |
| diff_rush_yards_att | 0.191 | 0.119 | 0.205 | 0.133 |
| (1.25) | (0.67) | (1.32) | (0.75) | |
| diff_run_touch | −0.213* | −0.00722 | −0.190* | 0.0160 |
| (−1.93) | (−0.06) | (−1.65) | (0.12) | |
| diff_firstdown | −1.703*** | −1.211* | −1.795*** | −1.303* |
| (−2.74) | (−1.67) | (−2.84) | (−1.78) | |
| N | 3,457 | 3,418 | 1,680 | 1,641 |
-
t-statistics in parentheses, * p < 0.1, ** p < 0.05, *** p < 0.01, (1) seasons 2010–2023 ghost minus regular games, (2) seasons 2010–2023 semi-ghost minus regular games, (3) seasons 2017–2023 ghost minus regular games, (4) seasons 2017–2023 semi-ghost minus regular games.
The point totals of both teams are significantly higher since home teams score at a similar level without spectators (and higher with some spectators) as they do when the stadium is full while visitors score significantly more. In several related statistics, the average difference (H – A) changes in favour of the visiting team at least for the ghost games, while the change of the difference is mostly insignificant for the semi-ghost games. Pass yards per game (diff_yards_pass), completion percentage (diff_passes_compl%) and pass yards per attempt (diff_passyards_ratio) each show a significant reduction in ghost games.
In contrast to the passing game, no significant change in space gained can be observed in the running game. The respective difference statistics rush yards per game (diff_rush_yards) and rush yards per attempt (diff_rush_yards_att) are insignificant. The difference between touchdowns scored via the running game (diff_run_touch) is significant in ghost games.
Overall, a clear trend of an eroding home advantage can be noted. In most difference statistics considered, the respective mean value shifts in favour of the visiting team in the context of ghost games, in many cases significantly.
To take a closer look at the significant changes, we focus in the next step on the indicators of the home and visiting teams for the corresponding variables. Variables for which no significant change could be detected in the difference will not be examined further. For diff_points and sum_points, the two individual components h_points and a_points have already been examined and are therefore also omitted.
Table 3 shows t-tests for equality of means for game statistics whose difference from home and visiting teams proved to be a significant change between the 2020 ghost games and the regular games. Just offensive statistics are represented, so an increase in values can be interpreted as beneficial for the respective team. Only away teams show a significant increase in completion percentage (a_passes_compl%) in ghost and semi-ghost games. The other results can also explain the difference variables, such that the impression already created that visiting teams benefit particularly in the passing game during ghost games is confirmed.
t-Tests for home and away variables.
| (1) | (2) | (3) | (4) | |
|---|---|---|---|---|
| h_passes_compl% | 0.0118 | 0.0147 | −0.000818 | 0.00211 |
| (1.44) | (1.55) | (−0.10) | (0.22) | |
| a_passes_compl% | 0.0345*** | 0.0333*** | 0.0219*** | 0.0207** |
| (4.27) | (3.55) | (2.71) | (2.22) | |
| h_yards_pass | −10.06 | 15.15** | −6.105 | 19.10** |
| (−1.54) | (1.99) | (−0.92) | (2.48) | |
| a_yards_pass | 16.33** | 19.81** | 20.06*** | 23.54*** |
| (2.47) | (2.58) | (2.93) | (2.99) | |
| h_passyards_ratio | −0.331** | 0.152 | −0.248 | 0.235 |
| (−2.02) | (0.80) | (−1.47) | (1.21) | |
| a_passyards_ratio | 0.308 | 0.369 | 0.355** | 0.416** |
| (1.36) | (1.40) | (2.13) | (2.15) | |
| h_pass_touch | 0.0888 | 0.156 | 0.110 | 0.177 |
| (0.90) | (1.36) | (1.09) | (1.53) | |
| a_pass_touch | 0.136 | 0.398*** | 0.148 | 0.410*** |
| (1.42) | (3.57) | (1.50) | (3.60) | |
| h_run_touch | 0.0864 | 0.273*** | 0.0489 | 0.235** |
| (1.09) | (2.93) | (0.60) | (2.47) | |
| a_run_touch | 0.301*** | 0.281*** | 0.240*** | 0.220** |
| (4.08) | (3.28) | (3.05) | (2.42) | |
| h_firstdown | 0.863** | 1.452*** | 0.754* | 1.343*** |
| (2.08) | (2.99) | (1.81) | (2.76) | |
| a_firstdown | 2.569*** | 2.666*** | 2.551*** | 2.648*** |
| (6.08) | (5.43) | (5.83) | (5.24) | |
| N | 3,454 | 3,415 | 1,680 | 1,641 |
-
t-statistics in parentheses, * p < 0.1, ** p < 0.05, *** p < 0.01, (1) seasons 2010–2023 ghost minus regular games, (2) seasons 2010–2023 semi-ghost minus regular games, (3) seasons 2017–2023 ghost minus regular games, (4) seasons 2017–2023 semi-ghost minus regular games.
In terms of 1st downs achieved, the basic tendency of offensively dominated ghost and even semi-ghost games can also be observed. Here, too, visiting teams generally benefit more from the increase than the hosts. In order to examine the strong effect of the ghost games on the 1st downs scored, these are split according to the type of score (passing game, running game or penalty). This also gives a first impression of the change in referee decisions. The results in Table 4 are largely consistent with the conclusions already drawn. Home and visiting teams scored significantly more first downs per ghost and semi-ghost game. Each subgroup of 1st downs, i.e. via the running game, passing game or penalties after referee decisions, also increased on average. Again, visiting teams benefit more from the trend of offensive dominance in ghost games than home teams. The increase in all first downs gained per game is again higher for the visitors than for the hosts.
t-Tests for first down splits.
| (1) | (2) | (3) | (4) | |
|---|---|---|---|---|
| h_firstdown | 0.863** | 1.452*** | 0.754* | 1.343*** |
| (2.08) | (2.99) | (1.81) | (2.76) | |
| a_firstdown | 2.569*** | 2.666*** | 2.551*** | 2.648*** |
| (6.08) | (5.43) | (5.83) | (5.24) | |
| h_firstdown_rush | 0.669** | 0.433 | 0.436 | 0.200 |
| (2.56) | (1.42) | (1.59) | (0.63) | |
| a_firstdown_rush | 1.485*** | 1.662*** | 0.839*** | 1.016*** |
| (5.37) | (5.13) | (3.20) | (3.29) | |
| h_firstdown_pass | 0.110 | 1.043*** | 0.291 | 1.224*** |
| (0.33) | (2.68) | (0.85) | (3.07) | |
| a_firstdown_pass | 2.242*** | 2.029*** | 1.571*** | 1.358*** |
| (5.42) | (4.23) | (4.56) | (3.45) | |
| h_firstdown_pen | 0.0881 | −0.0209 | 0.0277 | −0.0813 |
| (0.70) | (−0.14) | (0.22) | (−0.54) | |
| a_firstdown_pen | 0.265** | 0.398*** | 0.141 | 0.274** |
| (2.22) | (2.87) | (1.21) | (2.04) | |
| N | 3,454 | 3,415 | 1,680 | 1,641 |
-
t-statistics in parentheses, * p < 0.1, ** p < 0.05, *** p < 0.01, (1) seasons 2010–2023 ghost minus regular games, (2) seasons 2010–2023 semi-ghost minus regular games, (3) seasons 2017–2023 ghost minus regular games, (4) seasons 2017–2023 semi-ghost minus regular games.
Unlike in European football, personal penalties are rare in American football. The option of a warning is not available and ejections (comparable to a red card, but the team in question is not outnumbered after being given one) are extremely rare and are not listed in the usual statistics portals. Thus, we concentrate on the statistics penalties and penalty yards, i.e. the number of penalties and the penalty rate, which is quantified by different gradations of space gained for the opponent. In addition to home, away and differential figures, the totals per game are also listed. As before, data from the 2020 season’s genuine ghost games are compared with all other games on a per-game basis. Table 5 presents the results.
t-Tests for Referee decisions.
| (1) | (2) | (3) | (4) | |
|---|---|---|---|---|
| h_penalties | −0.766*** | −0.649** | −0.594*** | −0.477* |
| (−3.37) | (−2.46) | (−2.62) | (−1.82) | |
| a_penalties | −0.562** | −0.888*** | −0.497** | −0.823*** |
| (−2.39) | (−3.24) | (−2.11) | (−3.01) | |
| diff_penalties | −0.205 | 0.238 | −0.0995 | 0.343 |
| (−0.68) | (0.68) | (−0.34) | (1.01) | |
| h_pen_yards | −6.274*** | −2.944 | −5.033** | −1.703 |
| (−2.82) | (−1.14) | (−2.23) | (−0.65) | |
| a_pen_yards | −3.847* | −6.749** | −2.999 | −5.900** |
| (−1.65) | (−2.50) | (−1.26) | (−2.16) | |
| diff_pen_yards | 3.881 | −2.724 | 5.194* | −1.411 |
| (1.31) | (−0.79) | (1.76) | (−0.41) | |
| sum_penalties | −1.336*** | −1.545*** | −1.106*** | −1.315*** |
| (−3.78) | (−3.76) | (−3.09) | (−3.18) | |
| sum_pen_yards | −10.20*** | −9.773** | −8.181** | −7.752* |
| (−2.95) | (−2.43) | (−2.29) | (−1.89) | |
| N | 3,454 | 3,415 | 1,680 | 1,641 |
-
t-statistics in parentheses, * p < 0.1, ** p < 0.05, *** p < 0.01, (1) seasons 2010–2023 ghost minus regular games, (2) seasons 2010–2023 semi-ghost minus regular games, (3) seasons 2017–2023 ghost minus regular games, (4) seasons 2017–2023 semi-ghost minus regular games.
One should remember that under regular conditions, a preference for home teams by referees can be measured (by fewer penalties, see Table 1a). This unequal treatment is considered proven in the NFL, but also in other sports (see Chapter 2). Table 5 shows that significantly fewer penalties are called against both teams in ghost and semi-ghost games than in regular games. This trend has not gone unnoticed by attentive spectators and major sports portals are reporting on it (Seifert 2020).
However, the reduction in penalties and penalty yards is higher for the home than the visiting team in ghost games, although not in the semi-ghost games. Even if the changes in the difference variables are mostly not significant, a reduction or even negation of the referee preference through ghost games cannot be assumed on the basis of the results, although it is known from work on other sports that referees’ decisions can certainly be influenced by spectators.
5.3 Regressions
In order to verify the significance tests carried out up to this point, several regressions are carried out. Table 6 shows the results of binary logistic regressions based on home wins for all seasons and the restricted sample from 2017 to 2023. This type of regression is appropriate due to the binary nature of the home win variable. In addition to the binary variables ghost games and semi-ghost games (“yes” = 1; “no” = 0), only difference variables are included whose changes due to ghost games have already been shown to be significant in t-tests.
Binary logistic regressions for home wins and linear regressions for differences in points.
| (1) | (2) | (3) | (4) | |
|---|---|---|---|---|
| h_win | h_win | diff_points | diff_points | |
| ghostgames01 | −3.472*** | −1.316*** | −7.856*** | 1.196** |
| (0.000) | (0.000) | (0.000) | (0.008) | |
| semighostgames01 | −3.635*** | −1.488* | −8.966** | −0.531 |
| (0.000) | (0.012) | (0.001) | (0.850) | |
| diff_yards_pass | −0.0206*** | −0.0169*** | −0.0260 | −0.0493*** |
| (0.000) | (0.000) | (0.071) | (0.000) | |
| diff_passyards_ratio | 1.066*** | 0.946*** | 1.671* | 3.180*** |
| (0.000) | (0.000) | (0.044) | (0.000) | |
| diff_passes_compl% | 4.483*** | 3.945*** | 20.49** | 8.550*** |
| (0.000) | (0.000) | (0.001) | (0.000) | |
| diff_run_touch | 0.290*** | 0.308*** | 2.953*** | 1.949*** |
| (0.000) | (0.000) | (0.000) | (0.000) | |
| diff_firstdown | 0.219*** | 0.187*** | 0.544*** | 0.701*** |
| (0.000) | (0.000) | (0.000) | (0.000) | |
| _cons | 2.375*** | 0.189* | 6.156*** | −1.876*** |
| (0.000) | (0.021) | (0.000) | (0.000) | |
| N | 3,400 | 1,725 | 3,555 | 1,784 |
| R2 | 0.543 | 0.505 | 0.644 | 0.700 |
| FE | Y | Y | Y | Y |
-
p-values in parentheses, * p < 0.1, ** p < 0.05, *** p < 0.01; FE, season and home team fixed effects; (1) and (3) seasons 2010–2023, (2) and (4) seasons 2010–2023.
The first hypothesis that ghost (and semi-ghost) games reduce the home advantage is confirmed at the significance level of 1 % (for semi-ghost games for the seasons 2017–2023 only at a level of 10 %). The difference variables pass completion percentage, passing touchdowns, running touchdowns and 1st downs scored are highly and positively significant on the probability of a home win, while the difference in pass yards has a significantly negative effect on the home win probability.
We find similar results in linear regressions with the difference in points as the dependent variable. However, the semi-ghost games are no longer statistically significant in the smaller sample (2017–2023). That is in line with the results of Ehrlich et al. (2024) who find no significant difference in scores for games with limited spectators compared to regular games in 2016–2019.
Table 7 shows results of regressions for home team penalties and differences in penalties between home and away teams. The penalties for the home teams significantly decrease (only for the semi-ghost games compared to all seasons the reduction is insignificant) but the differences significantly increase. That means contrary to the t-tests that the referee bias for the home teams is reduced or even disappeared with less or no spectators.
Linear regressions for home team penalties and differences in penalties.
| (1) | (2) | (3) | (4) | |
|---|---|---|---|---|
| h_penalties | h_penalties | diff_penalties | diff_penalties | |
| ghostgames01 | −1.078*** | −2.327*** | 1.462*** | 2.279*** |
| (0.000) | (0.000) | (0.000) | (0.000) | |
| semighostgames01 | −0.564 | −1.798*** | 2.667*** | 3.513*** |
| (0.117) | (0.000) | (0.000) | (0.000) | |
| h_points | −0.00936 | −0.0131 | −0.0243*** | −0.0316*** |
| (0.065) | (0.062) | (0.000) | (0.000) | |
| a_points | 0.0262*** | 0.0217** | 0.0188** | 0.0123 |
| (0.000) | (0.005) | (0.007) | (0.187) | |
| _cons | 5.560*** | 6.961*** | −0.775** | −1.337*** |
| (0.000) | (0.000) | (0.001) | (0.000) | |
| N | 3,558 | 1,787 | 3,555 | 1,784 |
| R2 | 0.192 | 0.177 | 0.153 | 0.144 |
| FE | Y | Y | Y | Y |
-
p-values in parentheses, * p < 0.1, ** p < 0.05, *** p < 0.01; FE, season and home team fixed effects; (1) and (3) seasons 2010–2023, (2) and (4) seasons 2010–2023.
6 Discussion
The main intention of this paper is to explore the impact of ghost games due to the corona pandemic on the home bias in the NFL. In order to do this, a series of significance tests are conducted in a first step to measure and rank the differences between regular and ghost games. The results obtained are then tested in a second step using binary logistic regressions and linear regressions. In this way our first hypothesis that the home bias decreases can be confirmed or conversely the null hypothesis that the home bias does not change under NFL ghost games can be rejected. Conversely to Ehrlich et al. (2024), this is also true for semi-ghost games and statistically stronger in the regressions than in the t-tests. While the home bias vanishes, it is not possible to speak of a bias for visiting teams due to ghost games. Of the 146 ghost games, the visitors won 75. This win probability of 51.3 % does not represent a significant difference to the balanced value of 50 %. The corresponding t-test of a sample set yields a two-sided significance value of p = 0.621.
In addition to the statistical significance explored, a look at the other results of this paper supports the conclusion that NFL home teams suffered a disadvantage in ghost games in the 2020 season compared to the seasons before. Visiting teams can score significantly more points in ghost games than they did before under regular conditions. At the same time, the insignificant and on average only minimal increase in the points scored by the home teams results in a strong shift in the points difference in favour of the away teams. Furthermore, the trend of the disappearing home advantage can also be seen in the game statistics. The differential variables passes completed in per cent, pass yards per play, passing touchdowns and 1st downs scored all change significantly in favour of the visiting team in ghost games. Basically, the passing game of the visiting team benefits from the absence of the (mainly) opposing fans.
Our second hypothesis is that the preference of home teams by referees in the NFL is negated by ghost games. Both teams get less penalties in ghost and semi-ghost games. While the relative effect is unclear in the t-tests, the regressions show that the away team profits more because the referee bias for the home team is lower or non-existent with less or no spectators.
Several national sports media suggest that the league intentionally had fewer penalties imposed by referees (cf. Farmer 2020; Greenberg 2020; Seifert 2020). Fewer penalties were called against offenses in particular, presumably in order to generate higher-scoring and more spectacular games and to counteract the effect of the pandemic-related shortened practice times and the resulting loss of quality.
7 Conclusions
Our study shows that the home bias in the NFL is significantly reduced by ghost and semi-ghost games or even disappears completely, which confirms our first hypothesis. This result is also in line with a large number of analyses of different sports and competitions. Particularly the visitors’ offences benefit from the unusual conditions. The visiting teams can register a clear increase in points scored, which is mainly rooted in a significant increase in the efficiency of their own passing game. There is also evidence for our second hypothesis that the referee bias for the home team because of cheering crowds is reduced or even absent with less or no spectators.
References
Albert, Jim, and Ruud H. Koning, eds. 2007. Statistical Thinking in Sports. Boca Raton, FL: Chapman & Hall/CRC.10.1201/9781584888697Search in Google Scholar
Boyko, Ryan H., Adam R. Boyko, and Mark G. Boyko. 2007. “Referee Bias Contributes to Home Advantage in English Premiership Football.” Journal of Sports Sciences 25 (11): 1185–94. https://doi.org/10.1080/02640410601038576.Search in Google Scholar
Clark, Kevin. 2019. “Can Defenses Keep up in the NFL’s Offensive Revolution?” The Ringer. https://www.theringer.com/nfl/2019/10/2/20894866/nfl-defenses-offensive-revolution (accessed September 11, 2024).Search in Google Scholar
Colella, Fabrizio, Patricio S. Dalton, and Giovanni Giusti. 2021. All You Need Is Love: The Effect of Moral Support on Performance. CentER Discussion Paper 2021-005. Tilburg: Center for Economic Research.Search in Google Scholar
Cronin, Courtney, and NFL Nation. 2020. “Inside NFL’s ‘New Norm’: What Game Day Sounds and Feels like in 2020.” ESPN. https://www.espn.com/nfl/story/_/id/30054399/inside-nfl-new-norm-game-day-sounds-feels-2020 (accessed September 11, 2024).Search in Google Scholar
Currea, Jose. 2021. Effect of COVID-19 in the 2020 MLB Playoffs. Poster Presentation. Tyler, TX: University of Texas at Tyler. https://scholarworks.uttyler.edu/lyceum2021/event/posterpresentations_undergrad/57 (accessed September 11, 2024).Search in Google Scholar
Dilger, Alexander, and Lars Vischer. 2022. “No Home Bias in Ghost Games.” Athens Journal of Sports 9 (1): 9–24. https://doi.org/10.30958/ajspo.9-1-1.Search in Google Scholar
Ehrlich, Justin, Joel Potter, Shane Sanders, and Rodney Paul. 2024. “Spectators or Influencers? The Crowd Effect upon Winning in the NFL: A Natural Experiment.” International Journal of Sport Finance 19 (1): 3–24. https://doi.org/10.32731/ijsf/191.022024.01.Search in Google Scholar
Farmer, Sam. 2020. “NFL Offense Is up, and it Could Be the Result of Something Dramatic We’re Not Seeing.” Los Angeles Times. https://www.latimes.com/sports/story/2020-10-05/nfl-penalties-down-scoring-offense-up-2020 (accessed September 11, 2024).Search in Google Scholar
Fischer, Kai, and Justus Haucap. 2021. “Does Crowd Support Drive the Home Advantage in Professional Football? Evidence from German Ghost Games during the COVID-19 Pandemic.” Journal of Sports Economics 22 (8): 982–1008. https://doi.org/10.1177/15270025211026552.Search in Google Scholar
Greenberg, Neil. 2020. The NFL is Enjoying a Scoring Boom: You Can Thank the Officiating. Washington Post. https://www.washingtonpost.com/sports/2020/10/02/nfl-holding-penalties-scoring (accessed June 30, 2022).Search in Google Scholar
Jones, Marshall B. 2016. “Injuries and Home Advantage in the NFL.” SpringerPlus 5: 1734. https://doi.org/10.1186/s40064-016-3432-6.Search in Google Scholar
Jones, Jonathan. 2020. No Fans Allowed? How Home-Field Advantage Could Be Affected in NFL Season Without Full Stadiums. CBS Sports Digital. https://www.cbssports.com/nfl/news/no-fans-allowed-how-home-field-advantage-could-be-affected-in-nfl-season-without-full-stadiums (accessed September 11, 2024).Search in Google Scholar
Koning, Ruud H. 2011. “Home Advantage in Professional Tennis.” Journal of Sports Sciences 29 (1): 19–27. https://doi.org/10.1080/02640414.2010.516762.Search in Google Scholar
Losak, Jeremy M., and Joseph Sabel. 2021. “Baseball Home Field Advantage without Fans in the Stands.” International Journal of Sport Finance 16 (3): 148–62. https://doi.org/10.32731/ijsf/163.082021.04.Search in Google Scholar
Martin, Renee H., Timmons Logan, and Megan O. Powell. 2018. “A Markov Chain Analysis of NFL Overtime Rules.” Journal of Sports Analytics 4 (2): 95–105. https://doi.org/10.3233/JSA-170198.Search in Google Scholar
NFL Football Operations. 2020. NFL’s COVID-19 Protocols. NFL. https://operations.nfl.com/inside-football-ops/nfl-covid-19-protocols (accessed May 2, 2021).Search in Google Scholar
Price, Michael, and Jun Yan. 2022. “The Effects of the NBA COVID Bubble on the NBA Playoffs: A Case Study for Home-Court Advantage.” American Journal of Undergraduate Research 18 (4): 3–14. https://doi.org/10.33697/ajur.2022.051.Search in Google Scholar
Princiotti, Nora. 2021. “What Happened to NFL Home-Field Advantage?” The Ringer. https://www.theringer.com/nfl/2021/1/6/22216167/nfl-playoffs-home-field-advantage-covid-19-restrictions (accessed September 11, 2024).Search in Google Scholar
Reade, James, Dominik Schreyer, and Carl Singleton. 2022. “Eliminating Supportive Crowds Reduces Referee Bias.” Economic Inquiry 60 (3): 1416–36. https://doi.org/10.1111/ecin.13063.Search in Google Scholar
Rickman, Neil, and Robert Witt. 2008. “Favouritism and Financial Incentives: A Natural Experiment.” Economica 75 (298): 296–309. https://doi.org/10.1111/j.1468-0335.2007.00605.x.Search in Google Scholar
Schwartz, Barry, and Stephen F. Barsky. 1977. “The Home Advantage.” Social Forces 55 (3): 641–61. https://doi.org/10.2307/2577461.Search in Google Scholar
Scoppa, Vincenco. 2021. “Social Pressure in the Stadiums: Do Agents Change Behavior without Crowd Support?” Journal of Economic Psychology 82: 102344. https://doi.org/10.1016/j.joep.2020.102344.Search in Google Scholar
Seifert, Kevin. 2020. “How the NFL Is Manipulating Games in 2020: Fewer Holding Calls, Faster Games and Way More Offense.” ESPN. https://www.espn.com/nfl/story/_/id/30003263/how-nfl-manipulating-scoring-2020-fewer-holding-calls-faster-games-way-more-offense (accessed September 11, 2024).Search in Google Scholar
Sphigel, Ben. 2020. Twitter. https://twitter.com/benshpigel/status/1305267158658813952 (accessed June 30, 2022).Search in Google Scholar
Sphigel, Ben, and Bill Pennington. 2019. “How Offense Took over the N.F.L.” New York Times. https://www.nytimes.com/2019/01/19/sports/nfl-offense-records.html (accessed November 13, 2023).Search in Google Scholar
Steinfeld, Henry, Sören Dallmeyer, and Christoph Breuer. 2022. “The Silence of the Fans: The Impact of Restricted Crowds on the Margin of Victory in the NBA.” International Journal of Sport Finance 17 (3): 165–77. https://doi.org/10.32731/ijsf/173.082022.04.Search in Google Scholar
Vergin, Roger C., and John J. Sosik. 1999. “No Place like Home: An Examination of the Home Field Advantage in Gambling Strategies in NFL Football.” Journal of Economics and Business 51 (1): 21–31. https://doi.org/10.1016/S0148-6195(98)00025-3.Search in Google Scholar
© 2024 the author(s), published by De Gruyter, Berlin/Boston
This work is licensed under the Creative Commons Attribution 4.0 International License.
Articles in the same Issue
- Frontmatter
- Editorial
- Guest Editorial
- Special Issue Articles
- Is Blood Thicker than Water? The Impact of Player Agencies on Player Salaries: Empirical Evidence from Five European Football Leagues
- When Colleagues Come to See Each Other as Rivals: Does Internal Competition Affect Workplace Performance?
- Pregnancy in the Paint and the Pitch: Does Giving Birth Impact Performance?
- An Empirical Estimation of NCAA Head Football Coaches Contract Duration
- Race, Market Size, Segregation and Subsequent Opportunities for Former NFL Head Coaches
- Football Fans’ Interest in and Willingness-To-Pay for Sustainable Merchandise Products
- Change in Home Bias Due to Ghost Games in the NFL
- Consumer Perceptions Matter: A Case Study of an Anomaly in English Football
- Talent Allocation in European Football Leagues: Why Competitive Imbalance May be optimal?
- Data Observer
- SOEP-LEE2: Linking Surveys on Employees to Employers in Germany
- The IAB-SMART-Mobility Module: An Innovative Research Dataset with Mobility Indicators Based on Raw Geodata
- Miscellaneous
- Annual Reviewer Acknowledgement