Distributions of As, Pb, Sn and Zn as minor elements between iron silicate slag and copper in equilibrium with tridymite in the Cu–Fe–O–Si system
-
Taufiq Hidayat
 ,
Jiang Chen
,
Jiang Chen

Abstract
The distributions of arsenic, lead, tin and zinc between iron silicate slag and copper in equilibrium with tridymite in the Cu–Fe–O–Si system have been experimentally determined at selected oxygen partial pressures (P(O2)) at temperatures of 1 523 K and 1 573 K. The experimental technique involved high temperature equilibration in a sealed silica ampoule to minimize the vaporization of minor elements, rapid quenching of the condensed phases, and the direct composition measurements of the condensed phases using microanalysis techniques. The effective P(O2)s of the samples were determined based on the measured Cu2O concentrations in slag. The new experimental data resolve discrepancies found in previous studies and have been used in the development of a new thermodynamic database of the Cu–Fe–O–Si system containing minor elements.
1 Introduction
The distribution of minor elements between gas, slag, matte, metal and solid phases is one of the important parameters in the high temperature production of copper. From a processing perspective it is desirable to preferentially recover valuable minor elements in the matte or metal products and to discard undesirable minor elements through slagging or volatilization. Arsenic, lead, tin and zinc elements are commonly part of the latter group.
There are a number of studies that have been carried out to experimentally investigate the distributions of As, Pb, Sn and Zn between liquid iron silicate slag and copper. Nagamori et al. [1] investigated the distributions of Pb and As between slag and copper at T = 1473 K and 1573 K. Pure fayalite slags (5 g) having initial Fe/SiO2 ratios between 1.51 and 1.97 were equilibrated with metallic copper (4–8 g) containing less than 0.5–0.6 wt.% of combined minor elements. Equilibrations were carried out for 10–20 h under CO/CO2 atmosphere in alumina crucibles (20 mm-internal diameter × 33 mm-height) resulting in the Al2O3 dissolution of 2.7–26.3 wt.% in the slag. Each equilibration was followed by air cooling of the sample and manual separation of the slag and copper phases. Arsenic in both phases was measured titrimetrically, while lead in both phases was measured by atomic absorption. Using a similar approach, Nagamori et al. [2] also investigated the distribution of Sn between slag and copper.
In their study on the equilibria between liquid copper and calcium ferrite slag, Takeda et al. [3] also reported experimental data of the distributions of As, Pb, Sn and Zn between liquid copper and iron silicate slag. The equilibrations between the copper and iron silicate slag were conducted in a silica crucible at T = 1 523 K under CO/CO2/N2 atmosphere for 24 –30 h. The concentrations of minor elements in the copper and slag phases were chemically analyzed by the atomic absorption method.
Lynch [4] experimentally studied the distribution of As between iron silicate slag and copper. A silica crucible (22 mm-internal diameter × 76 mm-height) was used to contain 60 g of slag and 40 g of copper alloy containing 3 – 5 wt.% arsenic. The mixture was equilibrated at temperatures between 1 473 K and 1 536 K and P(O2) = 10–10 atm for 2 – 24 h. The copper and slag phases were collected using silica tube and iron tube, respectively. The atomic absorption method was used to analyze these phases.
Jimbo et al. [5] equilibrated 30 g of Cu–As alloy and 25 g of pre-melted iron silicate slag in a silica crucible (25 mm-internal diameter × 50 mm-height). The equilibrations were carried out at T = 1 473 K and 1 523 K for 48 h in CO/CO2 atmospheres corresponding to P(O2) between 10–7.2 atm and 10–10.7 atm. At the end of the equilibrations, the samples were quenched in water and the copper and slag phases were physically separated. Arsenic levels in copper and in slag were determined by atomic absorption spectrometry and colorimetry, respectively. The experimental results were reported in the form of ð%AsÞ=αAs versus P(O2), where ð%AsÞ and αAs are the mass percent and activity of As minor element in copper, respectively.
Surapunt et al. [6] equilibrated 5 g iron silicate slag and 10 g Cu–Zn–Fe alloy in an iron crucible at T = 1 523 K. The iron crucible (10 mm-internal diameter × 70 mm-height) was placed in a vacuum-sealed quartz ampoule. After 3 h of equilibration, the ampoule was cooled in water. Based on FactSage predictions using the latest optimized database from PYROSEARCH [7, 8, 9, 10, 11], the reported compositions correspond to P(O2) between 10–11.1 atm and 10–11.4 atm.
Kim and Sohn [12] equilibrated 9 g of Cu, 25 mg of minor element (Pb, As) and 6 g of pre-melted slag with initial Fe/SiO2 ratio of 1.37 in a silica crucible at T = 1 523 K and P(O2) between 10–6.3 atm and 10–12 atm for 24 h. Each sample was solidified by combination of cooling under flowing nitrogen and quenching in water. Slag and copper phases were then physically separated. The Pb and As concentrations in both phases were determined using direct-current plasma spectroscopy.
Kaur et al. [13] investigated the distribution of Pb between ferrous calcium silicate slag and copper at T = 1 573 K and P(O2) = 10–6 atm. Equilibrations were performed using 5 g of slag and 7 g of copper mixtures in magnesia crucibles for 4– 16 h. The slag and copper compositions were analyzed using an inductively coupled plasma atomic emission spectroscopy technique.
The distribution behavior of Pb between iron silicate slag and copper was studied by Heo et al. [14]. A magnesia crucible was used to equilibrate 5 g of slag and 8 g of metal at 1 473 K and P(O2) = 10–10 atm. After 6 h of equilibration, each sample was cooled using Ar gas and dipped into brine solution. The compositions of metal and slag phase were analyzed using an inductively coupled plasma spectrometry. The resulting slag was found to contain around 0.7 wt.% MgO.
Tin distribution between CaO-containing silicate slag and copper was experimentally measured by Anindya et al. [15]. MgO crucibles (5 ml) were used to equilibrate 5 g of slag and 5 g of copper at 1573 K and P(O2) between 10–6 and 10–8.5 atm for 16 h. The Sn in the slag or copper was kept at concentration of 1 wt.%. Each sample was cooled naturally and physical separation of slag and copper phases in each sample was carried out manually. Both phases were analyzed by using inductively coupled plasma atomic emission spectrometry.
Avarmaa et al. [16] equilibrated 250 mg of slag and 250 mg master alloy containing 1 wt.% Sn in an alumina crucible at T = 1 573 K and P(O2) between 10–5 and 10–10 atm for 16 h. After equilibration, the samples were rapidly quenched into an ice–water mixture. Electron probe X-ray microanalysis (EPMA) was used to determine the compositions of copper and slag phases. The concentration of Al2O3 in the slag phase was reported to be around 16 wt.%.
Van den Bulck et al. [17] investigated the distribution of tin between copper and CaO-containing slag. Experiments were carried out by placing 50 mg oxide powders and 60 mg alloy in vacuum sealed SiO2 ampoules. In every equilibration run, pre-melting of the sample was carried out at 1 623 K for 30 min followed by equilibration of the sample at 1 573 K for 12 h. After each equilibration, the sample was quenched into water. The compositions of the condensed phases were analyzed using EPMA. Based on FactSage predictions using the PYROSEARCH database [7, 8, 9, 10, 11], the reported condensed phase compositions correspond to P(O2) between 10–5.4 atm and 10–5.65 atm.
Klemmettinen et al. [18] investigated the behavior of tin distribution between copper and Al2O3-containing slag. A similar experimental technique to that used by Avarmaa et al. [16] was employed in this study.
In general, all of these studies can be divided into two different groups, i. e.: (1) Experimental studies involving manual separation of phases followed by bulk chemical analysis technique [1, 2, 3, 4, 5, 6, 12, 13, 14, 15]; and (2) Experimental studies involving direct measurement of phases compositions using microanalysis [16, 17, 18].
There are several limitations attributed to the first group of studies, such as: (1) The use of large sample size (10 to 100 g) may lead to slow equilibration; (2) the slow solidification process employed to cool down the samples after equilibration may alter the composition of the phases; and (3) complete manual separation of equilibrium phases may not be achieved leading to uncertainties in the measured composition of the phases. Moreover, the bulk chemical analysis does not allow evaluation of internal concentration gradients in the phases.
In the second group of studies, the use of small samples in equilibration experiments, rapid quenching and microanalysis resolve the aforementioned issues. Most of the previous studies on minor element distribution between liquid copper and slag were performed with slags containing Al2O3 [16, 18] or CaO [17]. There is no experimental study in this group dedicated to the measurement of the distribution of As, Pb, Sn and Zn between liquid copper and “pure” iron silicate slag.
In the present study, a systematic experimental investigation has been performed to determine the distributions of As, Pb, Sn and Zn between liquid copper and iron silicate slag at T = 1 523 K and 1 573 K. The present study has been carried out to support the development of a thermodynamic database that can be used for the evaluation and simulation of the high-temperature pyrometallurgical production, refining and recycling of copper.
2 Experimental procedure
In general, the experimental technique used in the present study is based on the general approach developed by the authors [19, 20] involving high temperature equilibration, rapid quenching and direct composition measurement of the condensed phases using microanalysis. The equilibrium achievement was confirmed based on a 4-points test approach [20], which includes: (1) Evaluation of the effect of equilibration time; (2) Assessment of the homogeneity of the equilibrium phases; (3) Tests of the effects of direction of approach toward the equilibrium point; and (4) Systematic analysis of reactions specific to the system.
Starting materials used in the experiments were analytically pure oxide and metal powders (purity above 99.5 wt.%) which were thoroughly mixed using an agate mortar and pestle. The mixtures were then pelletized under pressure. The initial mixtures were selected to obtain samples with a final phase assemblage of slag, copper and tridymite phases. Each pellet weighed approximately 0.5 g and contained 30% of metallic powder and 70% of oxide powders. The concentration of Zn minor element in the mixture was less than 4 wt.%, while the concentrations of As, Pb and Sn were each less than 1 wt.%. The Cu2O concentrations in the initial mixture were varied to achieve different Cu2O concentrations in the final slag.
Each pellet was placed in a closed-end tube made of quartz. The residual air within the tube was flushed using argon gas. The tube was then evacuated using a vacuum pump and was sealed using an oxy–hydrogen hand torch. The mixture in the sealed tube/ampoule was equilibrated in a vertical impervious alumina ceramic tube in an electrically heated resistance furnace. The temperature inside the alumina tube was controlled within ±1 K by an alumina-shielded B-type working thermocouple placed immediately adjacent to the sample. The working thermocouple was periodically calibrated against a standard thermocouple. The overall temperature accuracy is estimated to be within 5 K or better.
The use of a sealed quartz ampoule greatly reduces the volatilizations of As, Pb, Sn and Zn into the atmosphere. However, micro-cracks may be present in the ampoule either from defects in the initial quartz material, from thermal stress occurring during ampoule heating, from partial crystallization of the ampoule material into tridymite, or from partial dissolution of the ampoule material by the molten slag. The presence of the micro-cracks means that the system was not strictly gas-tight. Mixtures of 5 vol.% CO–Ar, 20 vol.% CO–Ar and CO2 gases (supplied by Coregas Pty Ltd, Yennora, Australia) were used as a precaution to protect the sample from oxidation by oxygen which may enter into the ampoule through the micro-cracks. The relative gas flow rates of the CO–Ar and CO2 were set to be as close as possible to the target P(O2) of the closed system. The required proportions of gases (shown in Table 1) were determined using FactSage thermodynamic software [21] and were regulated by U-tube capillary flow-meters.
Gas mixtures used in the equilibration experiments of the Cu–Fe–O–Si–(As–Pb–Sn–Zn) system.
| No | Temp (K) | Target Log10 [P(O2), atm] | Proportion (vol.%) (total pressure 1 atm) | ||
|---|---|---|---|---|---|
| 5 vol.%CO–Ar | 20 vol.%CO–Ar | CO2 | |||
| 1 | 1 523 | –7.0 | 0.298 | – | 0.702 |
| 2 | 1 523 | –8.0 | 0.573 | – | 0.427 |
| 3 | 1 523 | –9.0 | – | 0.515 | 0.485 |
| 4 | 1 523 | –10.0 | – | 0.771 | 0.229 |
| 5 | 1 573 | –5.0 | 0.079 | – | 0.921 |
| 6 | 1 573 | –6.0 | 0.214 | – | 0.786 |
| 7 | 1 573 | –7.0 | 0.462 | – | 0.538 |
| 8 | 1 573 | –8.0 | – | 0.404 | 0.596 |
After the equilibration process, each sample was rapidly quenched by dropping the sample into a bucket of cold water. Good quenching was achieved by placing a steel block inside the quenching bucket in order to break the ampoule and hence releasing the sample into the quenching medium. The quenched sample was dried, mounted in epoxy resin, and polished using SiC paper and diamond paste using an automatic polisher TegraPol-31 (Struers, Denmark). The polished sample was then washed, dried and carbon coated using QT150TES carbon coater (Quorum Technologies, UK).
A JEOL JXA 8200L (trademark of Japan Electron Optics Ltd., Tokyo) electron probe X-ray microanalyzer (EPMA) with wavelength dispersive detectors (WDD) and Duncumb–Philibert ZAF correction procedure was used to measure the concentrations of major and minor components in different phases that were above the detection limit of the EPMA measurement. The detection limits of the EPMA measurement for As, Pb, Sn and Zn were estimated to be between 185 and 318 ppm [22]. The EPMA was operated at an acceleration voltage of 15 kV and a probe current of 15 nA. Pure metals, pure oxides and pure silicates in Charles M. Taylor block and other purchased reference materials from Structure Probe, Inc. (Pennsylvania, USA) were used as standards. The EPMA does not provide information on the proportions of the same element having different oxidation states. Hence, the concentration of major components in the slag and solid oxide phases were recalculated to selected oxidation states for convenience of presentation and to unambiguously report the composition of phases, i. e. the Cu, Fe and Si are expressed as Cu2O, FeO and SiO2.
Laser ablation inductively coupled plasma mass spectrometry (LAICPMS), which consists of an NWR193 Laser Ablation System (Electro Scientific Industries Inc, Portland, USA) and an Agilent 8800 ICP–MS (Agilent Technologies, Santa Clara, USA), was used to measure the arsenic concentration in the slag because it was below the detection limit of the EPMA. Two certified synthetic glass NIST610 and NIST612 reference materials were used as standards. The detection limit of the LAICPMS measurement for As was estimated to be 0.11 ppm [22]. The detection limit, reproducibility and accuracy of the LAICPMS measurement were improved through procedures described in a previous article by the authors [22].
High-resolution microstructural analysis of the copper and slag phases in a few samples revealed the presence of micro-heterogeneity formed during the quenching process [23]. In the presence of micro-heterogeneity, representative composition of the condensed phases was obtained by performing micro-analysis with a relatively large take-off area between 5 and 50 μm. Each phase composition was obtained from EPMA measurements at selected locations, i. e. in areas where all phases co-existed, which was repeated at least 5 times. The As concentration in each sample was also acquired from LAICPMS measurements at the same locations and with the same number of repetitions. The concentrations of major components in the slag phase have the highest uncertainties compared to the concentration of components in the metal and tridymite phases. The standard deviations of the measured major components in the slag phase are provided in bracket next to their concentrations in Table 2.
The effective oxygen partial pressures (P(O2)) in equilibrium with the condensed phases within the closed system were derived from the measured Cu2O concentrations in the slag phase based on the following reaction:
The activity of Cu in the metal phase was close to unity and the activity coefficient of Cu2O in the slag relative to pure liquid standard state was obtained from FactSage with the PYROSEARCH database [7, 8, 9, 10, 11]. Based on the activity values of Cu in the metal phases and Cu2O in the slag phase, the P(O2) of the samples were determined as follows:
where Keq is the equilibrium constant for reaction (1), which is equal to 6 675.2 at T = 1 523 K and 3 570.4 at T = 1 573 K [7, 8, 9, 10, 11]. The derived effective oxygen partial pressure (P(O2)) for each sample in logarithmic scale is shown in Table 2.
3 Results
An example of the microstructure of the quenched slag/copper/ tridymite sample in the Cu–Fe–O–Si–(As–Pb–Sn–Zn) system taken using a scanning electron microscope (SEM) in backscattered electron (BSE) mode is provided in Fig. 1. The measured compositions of the slag, copper and tridymite phases from the equilibration experiments are provided in Table 2.
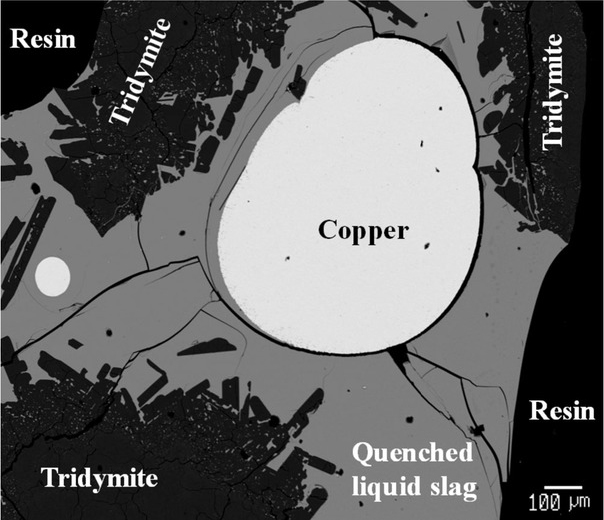
Back-scattered electron image of quenched slag/copper/tridymite sample after equilibration at T = 1523 K.
In the investigated conditions, the As dissolved preferentially into the copper phase rather than into the slag phase. The copper phase dissolved between 0.35 wt.% and 1.18 wt.% As, while the slag phase dissolved between 1.5 ppm and 637 ppm As.
The Pb distributed preferentially into the slag phase at P(O2) above 10–9 atm. The maximum concentrations of Pb in the copper and slag phases were 0.58 wt.% and 0.80 wt.%, respectively.
The Sn was found to distribute preferentially into the copper phase rather than into the slag phase at P(O2) below 10–7 atm. More Sn was found in the slag phase at more oxidizing condition. The concentration of Sn in the copper phase was between 0.13 wt.% and 1.14 wt.%, while the concentration of Sn in the slag phase was between 0.052 wt.% and 1.32 wt.%.
At P(O2) above 10–9 atm, the concentration of Zn in the slag phase was higher than that in the copper phase. The copper phase contained between 0.08 wt.%– 0.13 wt.% Zn, while the concentration of zinc in the slag phase was between 0.12 wt.% –1.50 wt.%.
4 Discussion
4.1 Major components equilibria
Figure 2a and b shows the comparison of the concentrations of FeO in the tridymite-saturated slag calculated using Fact-Sage with the PYROSEARCH database [7, 8, 9, 10, 11] and experimental data for the system without and with As, Pb, Sn and Zn minor elements [23, 24, 25] at T = 1 523 K and 1573 K. The composition of the tridymite-saturated slag moved towards lower FeO or higher SiO2 concentrations in the presence of Pb and Zn as can be seen in Fig. 2a. The relatively preferential dissolution of Pb and Zn in slag increased the stability of the slag phase relative to the solid tridymite phase. The presence of As and Sn minor elements in the system did not significantly affect the composition of slag at tridymite saturation as shown in Fig. 2b; this is due to the low solubility of As and Sn in the slag.
![Fig. 2 Concentrations of “FeO” in the slag phase in the gas/slag/copper/tridymite equilibria of the Cu–Fe–O–Si–(As–Pb–Sn–Zn) system at a range of P(O2) at: (a) T = 1523 K; and (b) T = 1573 K. Previous experimental data are from [23, 24, 25]. Calculated lines are from FactSage using the PYROSEARCH database [7, 8, 9, 10, 11].](/document/doi/10.1515/ijmr-2020-7857/asset/graphic/j_ijmr-2020-7857_fig_002.jpg)
Concentrations of “FeO” in the slag phase in the gas/slag/copper/tridymite equilibria of the Cu–Fe–O–Si–(As–Pb–Sn–Zn) system at a range of P(O2) at: (a) T = 1523 K; and (b) T = 1573 K. Previous experimental data are from [23, 24, 25]. Calculated lines are from FactSage using the PYROSEARCH database [7, 8, 9, 10, 11].
Measured compositions of slag, copper and tridymite phases from the gas/slag/copper/tridymite equilibria in the Cu-Fe-O-Si-(As-Pb-Sn-Zn) system.
| No | Temp (K) | Derived Log10 [P(O2), atm] | Equilib. time (h) | Phase | Normalized Oxide Composition (wt.%)† | Old Total†† | Me in Copper (wt.%) | Me in Slag (ppm) | Log10[LMeslag\copper] | |||||||||||
|---|---|---|---|---|---|---|---|---|---|---|---|---|---|---|---|---|---|---|---|---|
| “Cu2O” | “FeO” | SiO2 | As† | Pb† | Sn† | Zn† | As‡ | Pb† | Sn† | Zn† | As | Pb | Sn | Zn | ||||||
| 1 | 1523 | –6.8 | 24 | Slag | 7.4 (0.09) | 59.8 (0.08) | 32.8 (0.04) | 99.7 | 0.94 | – | – | – | 111 | – | – | – | –1.93 | – | – | – |
| Tridymite | 0.07 | 1.63 | 98.3 | 100.2 | ||||||||||||||||
| 2 | 1523 | –6.9 | 24 | Slag | 6.7 (0.16) | 60.2 (0.15) | 33.0 (0.05) | 97.4 | 0.58 | – | – | – | 76.1 | – | – | – | –1.88 | – | – | – |
| Tridymite | 0.09 | 0.68 | 99.2 | 101.4 | ||||||||||||||||
| 3 | 1523 | –8.0 | 24 | Slag | 3.4 (0.06) | 60.8 (0.10) | 35.8 (0.09) | 100.9 | 1.18 | – | – | – | 22.8 | – | – | – | –2.71 | – | – | – |
| Tridymite | 0.02 | 0.92 | 99.1 | 101.4 | ||||||||||||||||
| 4 | 1523 | –9.1 | 24 | Slag | 1.80 (0.14) | 60.7 (0.24) | 37.5 (0.19) | 101.3 | 0.50 | – | – | – | 1.5 | – | – | – | –3.52 | – | – | – |
| Tridymite | 0.02 | 0.72 | 99.3 | 101.1 | ||||||||||||||||
| 5 | 1523 | –6.9 | 24 | Slag | 7.1 (0.14) | 57.5 (0.04) | 35.5 (0.16) | 98.6 | – | 0.08 | 0.48 | – | – | 8000 | 4535 | – | – | 1.00 | –0.03 | – |
| Tridymite | 0.05 | 0.67 | 99.3 | 102.0 | ||||||||||||||||
| 6 | 1523 | –7.6 | 24 | Slag | 4.5 (0.06) | 59.0 (0.24) | 36.4 (0.24) | 97.8 | – | 0.07 | 0.64 | – | – | 5400 | 2606 | – | – | 0.89 | –0.39 | – |
| Tridymite | 0.03 | 0.32 | 99.6 | 101.8 | ||||||||||||||||
| 7 | 1523 | –7.8 | 24 | Slag | 3.9 (0.22) | 60.1 (0.29) | 36.0 (0.15) | 100.0 | – | 0.23 | 0.60 | – | – | 7 800 | 1829 | – | – | 0.53 | –0.52 | – |
| Tridymite | 0.20 | 0.55 | 99.2 | 101.7 | ||||||||||||||||
| 8 | 1523 | –8.9 | 36 | Slag | 2.1 (0.29) | 60.3 (0.47) | 37.6 (0.61) | 99.5 | – | 0.58 | 0.96 | – | – | 6300 | 780 | – | – | 0.04 | –1.09 | – |
| Tridymite | 0.05 | 0.72 | 99.2 | 101.1 | ||||||||||||||||
| 9 | 1523 | –9.4 | 24 | Slag | 1.54 (0.23) | 60.3 (0.20) | 38.2 (0.12) | 101.1 | 0.45 | 1.14 | – | – | 5 500 | 580 | – | – | 0.09 | –1.29 | – | |
| Tridymite | 0.02 | 0.93 | 99.0 | 101.1 | ||||||||||||||||
| 10 | 1523 | –7.1 | 24 | Slag | 6.6 (0.37) | 57.9 (0.40) | 35.5 (0.24) | 97.7 | – | – | – | 0.09 | – | – | – | 15000 | – | – | – | 1.22 |
| Tridymite | 0.16 | 0.87 | 99.0 | 102.6 | ||||||||||||||||
| 11 | 1523 | –7.7 | 24 | Slag | 4.2 (0.23) | 60.4 (0.32) | 35.4 (0.19) | 98.4 | – | – | – | 0.08 | – | – | – | 4800 | – | – | – | 0.78 |
| Tridymite | 0.09 | 0.88 | 99.0 | 101.3 | ||||||||||||||||
| 12 | 1523 | –8.2 | 24 | Slag | 3.2 (0.10) | 59.7 (0.26) | 37.1 (0.16) | 99.8 | – | – | – | 0.11 | – | – | – | 10500 | – | – | – | 0.98 |
| Tridymite | 0.01 | 0.66 | 99.3 | 100.5 | ||||||||||||||||
| 13 | 1523 | –9.1 | 24 | Slag | 1.80 (0.06) | 61.0 (0.14) | 37.2 (0.14) | 99.9 | – | – | – | 0.08 | – | – | – | 1200 | – | – | – | 0.18 |
| Tridymite | 0.07 | 0.61 | 99.3 | 102.1 | ||||||||||||||||
| 14 | 1523 | –10.5 | 24 | Slag | 0.84 (0.04) | 60.5 (0.09) | 38.7 (0.07) | 100.8 | – | – | – | 0.13 | – | – | – | 1500 | – | – | – | 0.06 |
| Tridymite | 0.04 | 0.85 | 99.1 | 100.1 | ||||||||||||||||
| 15 | 1573 | –5.0 | 24 | Slag | 26.0 (0.21) | 45.3 (0.31) | 28.7 (0.19) | 99.8 | 0.35 | – | 0.13 | – | 637 | – | 13274 | – | –0.74 | – | 1.01 | – |
| Tridymite | 0.09 | 0.36 | 99.6 | 101.1 | ||||||||||||||||
| 16 | 1573 | –5.5 | 24 | Slag | 17.4 (1.20) | 50.5 (0.68) | 32.1 (0.62) | 98.8 | 0.40 | – | 0.18 | – | 449 | – | 10254 | – | –0.95 | – | 0.76 | – |
| Tridymite | 0.12 | 0.32 | 99.6 | 100.2 | ||||||||||||||||
| 17 | 1573 | –5.5 | 24 | Slag | 16.2 (0.49) | 52.1 (0.33) | 31.6 (0.25) | 99.7 | 0.46 | – | 0.26 | – | 199 | – | 8706 | – | –1.36 | – | 0.53 | – |
| Tridymite | 0.08 | 0.41 | 99.5 | 99.9 | ||||||||||||||||
| 18 | 1573 | –6.9 | 24 | Slag | 5.8 (0.25) | 58.1 (0.22) | 36.1 (0.07) | 100.8 | 0.42 | – | 0.27 | – | 11.7 | – | 1227 | – | –2.56 | – | –0.34 | – |
| Tridymite | 0.01 | 0.61 | 99.4 | 100.8 | ||||||||||||||||
| 19 | 1573 | –8.1 | 24 | Slag | 2.8 (0.06) | 59.5 (0.02) | 37.7 (0.08) | 100.6 | 0.51 | – | 0.39 | – | 3.7 | – | 525 | – | –3.14 | – | –0.87 | – |
| Tridymite | 0.02 | 0.79 | 99.2 | 100.8 | ||||||||||||||||
Note: †=EPMA measurement; ‡=LAICPMS measurement; ††=“Old total” is the original sum of wt.% of oxides given by EPMA before it is normalized; [LMeslag\copper] = wt.% minor element in slag/wt.% minor element in copper; The standard deviations of the measured major components in the slag phase are provided in bracket next to their concentrations.
4.2 Distribution of arsenic as a minor element between iron silicate slag and copper
The distribution of a minor element (Me) between slag and copper is determined by the following equilibrium:
where the valence of Me in the slag is 2v and the oxide is expressed in mono cation form (MeOv). The equilibrium constant of reaction (3) is expressed as:
where a is the activity of a component in each phase, γ is the activity coefficient of a component in each phase. ðnTÞ and [nT] are the total mole number of components in 100 g of slag and 100 g of copper, respectively. ð%MeÞ and [%Me] are weight percents of Me in slag and metal, respectively.
The relationship between the distribution ratio of Me between slag and copper as a function oxygen partial pressure is obtained by rearranging Eq. (4) as follows:
The valence of Me (2v) in the slag can be derived from the slope of the logarithmic value of LMeslag/copper versus logarithmic value of P(O2) provided the activity coefficients of the species do not change in the investigated composition range.
The logarithmic values of LAsslag/copper versus Log10[P(O2), atm] from the present and previous studies [1, 3, 4, 5] are provided in Fig. 3. The present experimental results show increasing LAsslag/copper with increasing P(O2). The present data show a clear trend of decreasing LAsslag/copper with increasing temperature. The slope of Log10[LAsslag/copper] versus Log10[P(O2), atm] of approximately 0.75 indicates that As dissolves in the slag predominantly in the form of As3+.
![Fig. 3 Logarithmic value of distribution ratio of As as a minor element between iron silicate slag and copper as a function of Log10[P(O2), atm] at the gas/slag/copper/tridymite equilibria in the Cu–Fe–O–Si–(As) system. Previous experimental data are from [1, 3, 4, 5]. Calculated lines are from FactSage using the PYROSEARCH database [7, 8, 9, 10, 11].](/document/doi/10.1515/ijmr-2020-7857/asset/graphic/j_ijmr-2020-7857_fig_003.jpg)
Logarithmic value of distribution ratio of As as a minor element between iron silicate slag and copper as a function of Log10[P(O2), atm] at the gas/slag/copper/tridymite equilibria in the Cu–Fe–O–Si–(As) system. Previous experimental data are from [1, 3, 4, 5]. Calculated lines are from FactSage using the PYROSEARCH database [7, 8, 9, 10, 11].
A majority of experimental data show increasing oxidation of As into the slag phase with increasing oxygen partial pressure, except those from Nagamori et al. [1]. The experimental data from Nagamori et al. [1] do not show a clear trend and the Log10[LAsslag/copper] fluctuates between –1.5 and –3.0.
The trend of Log10[LAsslag/copper] versus Log10[P(O2), atm] reported by Takeda et al. [3] is in agreement with the present study. The absolute values of LAsslag/copper at T = 1 573 K reported by Takeda et al. [3] are higher by approximately 1 Logarithmic unit scale than those obtained in the present study for the same temperature.
There is no information on the influence of oxygen partial pressure on the [LAsslag/copper] from Lynch and Schwartze [4] since the experiments were carried out only at P(O2) = 10–10 atm. Lynch and Schwartze [4] shows an increase of LAsslag/copper with increasing temperature which is the opposite to that observed in the present study.
Jimbo et al. [5] reported the ð%AsÞ=αAs as a function of P(O2) at low As concentrations in copper. The LAsslag/copper was recalculated from the ð%AsÞ=αAs as follow:
where γAs is the coefficient activity of As at infinite dilute condition, which is constant and not affected by change in As concentration in the copper phase, MCu and MAs are atomic mass of Cu and As, respectively. The γAs values were taken from latest optimization of the Cu–As system [8], i. e. 2.01 × 10⁻³ at T = 1 473 K and 2.34 × 10⁻³ at T = 1523 K. The LAsslag/copper values calculated from the data reported by Jimbo et al. [5] are of the same order of magnitude with those obtained in the present study. Although the data reported by Jimbo et al. [5] are scattered, a similar trend to that of the present study is observed, which is increasing LAsslag/copper with increasing P(O2) and decreasing temperature.
The present experimental data have been used in the optimization of the PYROSEARCH database [7, 8, 9, 10, 11]. It can be seen that the lines calculated by FactSage using the PYROSEARCH database [7, 8, 9, 10, 11] reproduce the relationships between LAsslag/copper with P(O2) and temperature obtained by the present study.
4.3 Distribution of lead as a minor element between iron silicate slag and copper
Figure 4 shows the logarithmic of LPbslag/copper as a function of Log10[P(O2), atm]. The line from the present study gives a similar slope to those of Takeda et al. [3] and FactSage predicted lines [7, 8, 9, 10, 11]. The slope between Log10[LPbslag/copper] versus Log10[P(O2), atm] of approximately 0.4 indicates that Pb in the slag presents predominantly in the form of PbO.
![Fig. 4 Logarithmic value of distribution ratio of Pb as a minor element between iron silicate slag and copper as a function of Log10[P(O2), atm] at the gas/slag/copper/tridymite equilibria in the Cu–Fe–O–Si–(Pb) system. Previous experimental data are from [1, 3, 12, 13, 14]. Calculated line is from FactSage using the PYROSEARCH database [7, 8, 9, 10, 11].](/document/doi/10.1515/ijmr-2020-7857/asset/graphic/j_ijmr-2020-7857_fig_004.jpg)
Logarithmic value of distribution ratio of Pb as a minor element between iron silicate slag and copper as a function of Log10[P(O2), atm] at the gas/slag/copper/tridymite equilibria in the Cu–Fe–O–Si–(Pb) system. Previous experimental data are from [1, 3, 12, 13, 14]. Calculated line is from FactSage using the PYROSEARCH database [7, 8, 9, 10, 11].
The Pb distribution to the slag phase increases with increasing oxygen partial pressure; this is in agreement with the trends from previous studies by Nagamori et al. [1], Take-da et al. [3] and Kim and Sohn [12]. The LPbslag/copper from the present study at T = 1523 K is of the same order of magnitude as those from Nagamori et al. [1] at T = 1473 K and Kim and Sohn [12] at T = 1523 K.The LPbslag/copper from Heo et al. [14] at T = 1473 K is slightly higher than that of the present study, while LPbslag/copper from Takeda et al. [3] and Kaur et al. [13] at T = 1523 K is significantly lower than that of the present study. The FactSage predicted line using the PYROSEARCH database [7, 8, 9, 10, 11] describes the present experimental data.
4.4 Distribution of tin as a minor element between iron silicate slag and copper
The logarithmic values of LSnslag/copper versus Log10[P(O2), atm] from the present and previous studies [2, 3, 15, 16, 17, 18] are provided in Fig. 5. All experimental data show increasing Sn distribution to the slag phase with increasing oxygen partial pressure. Most of the studies show similar slope of Log10[LSnslag/copper] versus Log10[P(O2), atm] between 0.5 and 0.6, which indicates that Sn dissolves in the slag predominantly in the form of SnO in this range of oxygen pressures. The present study shows a decrease in LSnslag/copper with increasing temperature; the present trend is in agreement with the trend obtained by Nagamori and Mackey [2].
![Fig. 5 Logarithmic value of distribution ratio of Sn as a minor element between iron silicate slag and copper as a function of Log10[P(O2), atm] at the gas/slag/copper/tridymite equilibria in the Cu–Fe–O–Si–(Sn) system. Previous experimental data are from [2, 3, 15, 16, 17, 18]. Calculated lines are](/document/doi/10.1515/ijmr-2020-7857/asset/graphic/j_ijmr-2020-7857_fig_005.jpg)
At T = 1 523 K, the LSnslag/copper reported by Takeda et al. [3] is in good agreement with the present experimental data. At T = 1 573 K, the LSnslag/copper reported by Nagamori and Mackey [2], Anindya et al. [15], Avarmaa et al. [16], Van den Bulck et al. [17] and Klemettinen et al. [18] are in the same order of magnitude with that from the present study; it appears that addition of up to 20 wt.% Al2O3 or 13.8 wt.% CaO into the slag did not significantly affect the LSnslag/copper. Difference in LSnslag/copper is only observed in the experimental data reported by Anindya et al. [15] for slag phase containing 21.9 wt.% CaO. The PYROSEARCH database [7, 8, 9, 10, 11] describes the relationships between LSnslag/ copper with P(O2) and temperature obtained by the present study.
4.5 Distribution of zinc as a minor element between iron silicate slag and copper
Figure 6 shows the logarithmic value of LZnslag/copper as a function of Log10[P(O2), atm]. The slope of the line from present study is similar to those of Takeda et al. [3] and FactSage predicted lines. The slope of Log10[LZnslag/copper] versus Log10[P(O2), atm] indicates that Zn in the slag predominantly exists in the form of ZnO.
![Fig. 6 Logarithmic value of distribution ratio of Zn as a minor element between iron silicate slag and copper as a function of Log10[P(O2), atm] at the gas/slag/copper/tridymite equilibria in the Cu–Fe–O–Si–(Zn) system. Previous experimental data are from [3, 6]. Calculated line is from Fact-Sage using the PYROSEARCH database [7, 8, 9, 10, 11].](/document/doi/10.1515/ijmr-2020-7857/asset/graphic/j_ijmr-2020-7857_fig_006.jpg)
Logarithmic value of distribution ratio of Zn as a minor element between iron silicate slag and copper as a function of Log10[P(O2), atm] at the gas/slag/copper/tridymite equilibria in the Cu–Fe–O–Si–(Zn) system. Previous experimental data are from [3, 6]. Calculated line is from Fact-Sage using the PYROSEARCH database [7, 8, 9, 10, 11].
The present experimental data and previous data from Takeda et al. [3] show the Zn distribution to the slag phase increases with increasing oxygen partial pressure. The LZnslag/copper at T = 1523 K from Takeda et al. [3] is consistently higher than the present study by approximately 0.75 logarithmic scale. The experimental data by Surapunt et al. [6] at T = 1 473 K is at the lowest possible P(O2) where iron is presence and gives the lowest LZnslag/copper. The LZnslag/copper calculated using FactSage with the PYROSEARCH database [7, 8, 9, 10, 11] is similar to the LZnslag/copper experimentally determined by Takeda et al. [3].
Under the investigated conditions, most of the Zn was dissolved in the slag phase and significantly lower Zn was dissolved in the copper phase. It was desired to measure this low concentration of Zn in the copper phase using the LAICPMS. However, due to the absence of an appropriate matrix matching standard for the LAICPMS, the Zn concentration in the copper phase was measured using the EPMA. The measurement results obtained from EPMA of the present study may contain higher uncertainties due to the low concentration level of Zn in the copper phase.
The improved experimental technique has been used in the present study to investigate the distribution behavior of minor elements between iron silicate slag and copper. The present experimental data show clear trends of the effect of oxygen partial pressure on the distributions of As, Pb, Sn and Zn between slag and copper, as well as the effect of temperature on the distributions of As and Sn between slag and copper. However, accurate determination of the distribution of Zn between iron silicate slag and copper requires further investigation. The present experimental data have been used in the development a new thermodynamic database of the Cu–Fe–O–Si system containing minor elements.
5 Conclusions
The distribution coefficients of As, Pb, Sn and Zn as minor elements between iron silicate slag and copper in equilibrium with tridymite in the Cu–Fe–O–Si system have been experimentally determined at 1 523 K and 1 573 K. A closed system equilibration was employed to minimize the vaporization of the minor elements. The effective P(O2)s of the samples were derived based on the activity of Cu in the metal and Cu2O in the slag of the closed-system. Under the investigated conditions, the arsenic was found to preferentially dissolve into the copper phase rather than into the slag phase. The As distribution towards the slag phase increases with increasing oxygen partial pressure and decreasing temperature.
Higher concentrations of Pb and Zn were found in the slag than in the copper phase. More Pb and Zn distributed into the slag with increasing P(O2). Tin was found to preferentially dissolve into the copper phase at P(O2) below 10–7 atm and preferentially dissolve into the slag phase at P(O2) above 10–7 atm. With increasing temperature, more Sn distributed into the copper than into the slag.
The new data for the As, Pb and Sn from the present study resolve the discrepancies found in previous studies and have been used in the revision of the copper-containing thermodynamic database. However, further investigation is required to accurately determine the distribution of Zn between iron silicate slag and copper. The present study is a part of a larger integrated experimental and thermodynamic modeling research program to revise the thermo-chemistry of complex copper smelting multicomponent metal/matte/ slag systems.
The authors would like to thank the Australian Research Council Linkage program LP140100480, Anglo American Platinum, Altonorte Glencore, Atlantic Copper, Aurubis, BHP Billiton Olympic Dam Operation, Boliden, Kazzinc Glencore, PASAR Glencore, Outotec Oy (Espoo), Penoles, Rio Tinto Kennecott and Umicore for the financial and technical support for this research. The authors acknowledge the support of the Australian Microscopy and Microanalysis Facility (AMMRF) at the Centre for Microscopy and Microanalysis at The University of Queensland. The authors also acknowledge the scientific and technical assistance of Dr Charlotte Allen at the Centre of Analytical Research Facilities at Queensland University of Technology, Brisbane, Australia. Thanks also to Mr Hong Wee Kor for his help in the preparation of this article.
References
[1] M. Nagamori, P.J. Mackey, P. Tarassoff: Metall. Trans. B 6 (1975) 295. DOI:10.1007/BF0291357310.1007/BF02913573Search in Google Scholar
[2] M. Nagamori, P.J. Mackey: Metall. Trans. B 8 (1977) 39. DOI:10.1007/BF0265634910.1007/BF02656349Search in Google Scholar
[3] Y. Takeda, S. Ishiwata, A. Yazawa: T. Jpn. I. Met. 24 (1983) 518. DOI:10.2320/matertrans1960.24.51810.2320/matertrans1960.24.518Search in Google Scholar
[4] D.C. Lynch, K.W. Schwartze: Can. Metall. Q. 20 (1981) 269. DOI:10.1179/00084438179527022810.1179/000844381795270228Search in Google Scholar
[5] I. Jimbo, S. Goto, O. Ogawa: Metall. Trans. B 15 (1984) 535. DOI:10.1007/bf0265738510.1007/bf02657385Search in Google Scholar
[6] S. Surapunt, Y. Takeda, K. Itagaki: Shigen-to-Sozai 111 (1995) 553. DOI:10.2473/shigentosozai.111.55310.2473/shigentosozai.111.553Search in Google Scholar
[7] T. Hidayat, D. Shishin, S. Decterov, E. Jak: Calphad 58 (2017) 101. DOI:10.1016/j.calphad.2017.06.00310.1016/j.calphad.2017.06.003Search in Google Scholar
[8] D. Shishin, E. Jak: Calphad 60 (2018) 134. DOI:10.1016/j.calphad.2017.12.00510.1016/j.calphad.2017.12.005Search in Google Scholar
[9] D. Shishin, T. Hidayat, J. Chen, P.C. Hayes, E. Jak: Calphad 65 (2019) 16. DOI:10.1016/j.calphad.2019.01.01610.1016/j.calphad.2019.01.016Search in Google Scholar
[10] D. Shishin, T. Hidayat, J. Chen, P.C. Hayes, E. Jak: J. Chem. Thermodyn. 135 (2019) 175. DOI:10.1016/j.jct.2019.02.02910.1016/j.jct.2019.02.029Search in Google Scholar
[11] D. Shishin, P.C. Hayes, E. Jak: Development and Applications of Thermodynamic Database in Copper Smelting. In Copper 2019, The Metallurgy and Materials Society. Vancouver, BC, Canada, (2019).Search in Google Scholar
[12] H.G. Kim, H.Y. Sohn: Metall. Mater. Trans. B 29 (1998) 583. DOI:10.1007/s11663-998-0093-z10.1007/s11663-998-0093-zSearch in Google Scholar
[13] R.R. Kaur, D.R. Swinbourne, C. Nexhip: Min. Proc. Ext. Met. 118 (2009) 65. DOI:10.1179/174328509X38389010.1179/174328509X383890Search in Google Scholar
[14] J.H. Heo, S.-S. Park, J.H. Park: Metall. Mater. Trans. B 43 (2012) 1098. DOI:10.1007/s11663-012-9701-z10.1007/s11663-012-9701-zSearch in Google Scholar
[15] A. Anindya, D.R. Swinbourne, M.A. Reuter, R.W. Matusewicz: Min. Proc. Ext. Met. 122 (2013) 165. DOI:10.1179/1743285513Y.000000004310.1179/1743285513Y.0000000043Search in Google Scholar
[16] K. Avarmaa, S. Yliaho, P. Taskinen: Waste Manage. 71 (2018) 400. PMid:29032002; DOI:10.1016/j.wasman.2017.09.03710.1016/j.wasman.2017.09.037Search in Google Scholar PubMed
[17] A. Van den Bulck, S. Turner, M. Guo, A. Malfliet, B. Blanpain: The Distribution of Sn Between CaO–CuOx–FeOy–SiO2 Slag and Copper Metal at 1300 8C. In Extraction 2018, The Minerals, Metals & Materials Society. Ottawa, Canada, (2018) 1083. DOI:10.1007/978-3-319-95022-8_8710.1007/978-3-319-95022-8_87Search in Google Scholar
[18] L. Klemettinen, K. Avarmaa, H. O’Brien, P. Taskinen: Minerals 9 (2019) 1. DOI:10.3390/min901003910.3390/min9010039Search in Google Scholar
[19] E. Jak, P.C. Hayes, H.-G. Lee: Korean J. Min. Mat. Inst. 1 (1995) 1.10.1007/BF03055319Search in Google Scholar
[20] E. Jak: Integrated experimental and thermodynamic modelling research methodology for metallurgical slags with examples in the copper production field. In 9th Intl. Conf. on Molten Slags, Fluxes and Salts (MOLTEN12), The Chinese Society for Metals. Beijing, China, (2012) W077.Search in Google Scholar
[21] FactSage 7.0, FactSage thermochemical software. http://www.factsage.com/ 2015.Search in Google Scholar
[22] J. Chen, C.M. Allen, T. Azekenov, L.A. Ushkov, P. Hayes, E. Jak: Quantitative determination of trace/ultra trace elements concentration in slag and matte generated in copper smelting using microanalysis techniques. In Copper 2016, The Mining and Materials Processing Institute of Japan (MMIJ) and Japan Mining Industry Association (JMIA). Kobe, Japan, (2016).Search in Google Scholar
[23] T. Hidayat, H.M. Henao, P.C. Hayes, E. Jak: Metall. Mater. Trans. B 43 (2012) 1034. DOI:10.1007/s11663-012-9683-x10.1007/s11663-012-9683-xSearch in Google Scholar
[24] T. Hidayat, P.C. Hayes, E. Jak: Metall. Mater. Trans. B 49 (2018) 1766. DOI:10.1007/s11663-018-1285-910.1007/s11663-018-1285-9Search in Google Scholar
[25] T. Hidayat, J. Chen, P.C. Hayes, E. Jak: Metall. Mater. Trans. B 50 (2018) 229. DOI:10.1007/s11663-018-1448-810.1007/s11663-018-1448-8Search in Google Scholar
© 2021 Walter de Gruyter GmbH, Berlin/Boston
Articles in the same Issue
- Contents
- Original Contributions
- Distributions of As, Pb, Sn and Zn as minor elements between iron silicate slag and copper in equilibrium with tridymite in the Cu–Fe–O–Si system
- Short Communications
- Free vibration analysis and selection of composite for high strength and stiffness using multi-attribute decision making
- Metallurgical and wear study of MWCNT-reinforced h-AMMC fabricated through microwave hybrid sintering
- Effects of microstructure and lattice misfit on creep life of Ni-based single crystal superalloy during long-term thermal exposure
- Fracture toughness assessment at different regions in an inertial friction welded Ti-5Al-2Sn-2Zr-4Mo-4Cr alloy plate
- Microstructure and mechanical property improvement of dissimilar metal joints for TC4 Ti alloy to Nitinol NiTi alloy by laser welding
- The influence of gadolinium on Al–Ti–C master alloy and its refining effect on AZ31 magnesium alloy
- Effect of adding rare-earth cerium on the microstructure and acid rain corrosion resistance of the ADC12 alloy
- Effect of TiO2 crystal form on the denitration performance of Ce–W–Ti catalyst
- Notifications
- Deutsche Gesellschaft für Materialkunde / German Materials Science Society