Bubble Trajectory in a Bubble Column Reactor using Combined Image Processing and Artificial Neural Network
-
Balachandar Chidambaram


Abstract
The applications of Bubble column reactors in gas-liquid multiphase reactions are widely observed in process industries. Biochemical reactions such as wet oxidation and algae bio-reactions are carried out in bubble column reactors. In this article, an image processing based comprehensive algorithm is developed to identify the trajectory of bubbles in a bubble column reactor. Photographs of bubbles moving up in a bubble column reactor are recorded for different velocities using a high speed camera. An algorithm is developed to plot the trajectory of the bubble. The developed algorithm can be used with experimental and numerical results to trace the trajectory of bubbles. The algorithm is applied to the results of volume of fluids (VOF) simulation to identify the bubble path in Newtonian and non-Newtonian fluids. Based on the algorithm, numerical results obtained on Newtonian fluids are used to train an Artificial Neural Network (ANN) to find the temporal position of the bubble. Superficial fluid velocities, nozzle diameter and time are the input parameters. The trained Levenberg-Marquardt based neural network can find the position of the bubble at any instant of time. The designed algorithm can study the dynamics and position of a bubble in process applications carried out in a bubble column reactor.
1 Introduction
Multiphase reactors are mainly classified into three categories: the trickle bed reactor (fixed or packed-bed), fluidized bed reactor, and bubble column reactor. Bubble column reactors are multiphase reactors in which the bubble, the mobile phase moves inside an immobile fluid. Extensive research in bubble column reactors is available in literature because of its wide applications in chemical, petrochemical and biochemical industries. Practical examples of the reactions taking place in bubble column reactors are oxidation reactions, chlorination reactions, hydro treating and conversion of petrochemical residues, fermentation and biological waste water treatment. It is essential to study the bubble dynamics in all these processes to arrive at optimal parameters to have an efficient heat and mass transfer process.
Image processing techniques are widely used to study the hydrodynamics of a two phase flow. Kumar and Kannan (1994) used image enhancement and segmentation techniques and developed a method to determine the bubble size and area in a two phase swirling flow. Images were pre-processed using background noise subtraction, contrast enhancement and gray level thresholding. Guo et al. (2010) proposed an algorithm using non-linear weighted statistics to detect edges of a gray image. Wavelet analysis was used to extract the interface in multiphase flows. They detailed about the influence of filler length and threshold. A modified Gaussian function was suggested to weigh possible interface non-linearity’s detected on different scales. When compared to that of widely used Canny edge detection operator, this new algorithm could identify edges precisely even with strong noise and light reflection. Hsieh, Wang, and Pan (1997) developed an image processing technique based on gray level to understand the variations in two phase flow patterns and its thermal hydraulic behavior in a loop. do Amaral et al. (2012) used image processing techniques on high-speed video to understand the dynamics of horizontal two-phase slug flows. A new technique that automatically estimates bubble parameters such as dimensions, frequency and velocity, etc. through video analysis of high-speed camera measurements in horizontal pipes was elaborated in the article. Uchimura et al. (1998) developed a real time neutron radiography (RTNR) that encompasses the use of image processing to visualize the gas-liquid metal (two phase) interfacing, where the dynamic motion of bubbles inside liquid metal could not be observed optically. Noise reduction, pipe–fluid interface determination, and image smoothing procedures were part of the proposed image enhancement technique.
Bian, Dong, and Wang (2011) reconstructed a 3D image of a single rising bubble in water using digital image processing. The analysis was useful to process engineers as the evaluation of volumetric information provided a good understanding of the heat transfer phenomenon. Liu et al. (2012) developed a novel method for in-line measurements of particle dimensions, velocity and concentration in a dilute solution. It also included trajectory analysis of two-phase particulate flow. The image pre-processing formulation included stitching, illumination correction, binarization, de-noising and the elimination of unreal and defocused particles. The top-hat transformation was found to be very effective for the binarization of images with non-uniform background illumination. Particle trajectories measured within a certain exposure time were used to obtain particle size and velocity. Yun-long and Hong-wei (2012) implemented line-correlation algorithm to analyze the gas-liquid two-phase flow patterns based on variation coefficient of image connected regions. Shi, Wei, and Pang (2014) developed an algorithm based upon the modified optical flow to solve problem faced in using bilateral-filter and multi-resolution analysis of PIV image processing. Principle of multilayer segments was used to design the algorithm. This new algorithm was helpful as image noise was reduced and details of image boundary were maintained with no abruptness. Recently, the use of image processing to study the liquid film hold up in mini and micro channels was discussed by Seshadri, Mahadevan, and Muniyandi (2015).
Extensive applications of image processing in two phase flows can be seen from the above literature review. However, a comprehensive and concise algorithm which can be applied to any fluid is to be developed to identify the bubble trajectory in a bubble column reactor. Based on the available technical background and taking into consideration this prevailing research gap, a note on applying image processing to understand mobile phase parameters was presented by Iyer et al. (2013). Present work is a result of understanding of the potential of image processing in bubble column reactors presented by Iyer et al. (2013). The work concentrates on developing a simple algorithm to trace the path of a bubble in a bubble column reactor. Designed algorithm can be used with both numerical and experimental results. The photographs of the bubbles taken are processed through image processing techniques. A greater insight into the image processing technique used can be obtained from “Digital Image Processing using Matlab” by Gonzalez, Woods, and Eddins (2004). The algorithm is implemented using Matlab Toolbox given by Thompson and Shure (1995).
Artificial Neural Network (ANN) is a machine learning algorithm used to predict outcomes based on training the network from a set of known results (Hagan, Demuth, and Beale 1996). The potential of ANN for application in two phase flows was shown by Mi, Ishii, and Tsoukalas (1998). More specifically, Amiri et al. (2012) developed a neural network that could predict the bubble size distribution in a bubble column reactor. In the present work, an ANN is trained by image processing results of numerical simulations. The superficial fluid velocities, nozzle diameter and time are the input parameters to determine the position of a bubble in Cartesian coordinates at a specified time. The predicted position using ANN is in good agreement with the actual transient position of the bubble determined by high speed video. Thus, the present work introduces a method that could predict the bubble position and bubble dynamics for various bubble column reactor applications.
2 Methodology
2.1 Experimental setup
Figure 1 shows the experimental setup comprising a bubble column reactor, which is a cuboid (30×30×70 cm) made of acrylic sheet with one face open. Acrylic sheet is chosen because it has a refractive index closer to that of water, the immobile phase of the present experiment. The fabricated bubble column reactor is sealed using a strong adhesive and is periodically checked for leaks. Graduated scale is kept beside the vertical column to infer the bubble position from photograph. Pumping of air into the bubble column reactor is accomplished by using an air pump as a pumping device. Air pump used has a power rating of 27 W and a discharge rating of 160 LPH. A flow control valve is used to control the flow rate through the needle. A Rotameter is connected in series with the control valve to measure the inlet flow rate of gas. The rotameter withstands a maximum pressure of 100 psi and has an accuracy of ±0.1. Uniform lighting is accomplished to get good quality images. Bubbles are recorded using BASLER acA2000 Monochrome CMOS high speed camera with a Navitar (Zoom 7000) lens. The images are captured at the rate of 1,500 fps with a 32×32 size resolution. Acquisition rate is adjusted to get a focused view of the rising bubbles. The image captured is later analyzed frame by frame using Stream Pix Software. Offline image processing techniques are used using Matlab toolbox in the analyzed frame and the bubble path is determined. Experiments are carried out at 28 °C.
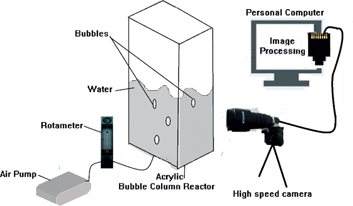
Experimental setup.
2.2 Numerical model
CFD simulations are carried out in ANSYS FLUENT © using Volume of Fluids method (VOF). VOF technique is based on surface tracking technique applied to a fixed Eulerian space. This technique is used to find the phase fraction, a physical quantity that can be considered as a prime factor to distinguish the distributed gas held up in a bubble column reactor. A rectangular mesh of uniform sizing is used. Optimal mesh size is arrived based on a grid independence test. The governing equations solved are shown in Table 1. Numerical model is validated with experimental results in terms of bubble diameter. The models are found to be in close agreement with experimental results with an accuracy of 96 %. The average bubble diameter for a given superficial air flow rate is taken as the argument for validation. The surface tension between air and water is taken to be 0.0174 N/m. PISO algorithm is used for pressure-velocity coupling and a second order upwind scheme is used for determination of momentum and volume fraction.
Governing equations.
| Continuity equation | |
| Momentum equation | |
| VOF mixture density equation | |
| Mixture velocity equation |
In the equations, ρk is the density, uk is the velocity, αk is the void fraction of the kth phase. Here Fs is the continuum surface vector, S is the surface deformation tensor and ∇ is the differential operator in 2D. The properties of the fluids are given in the Table 2.
Properties of fluids.
| Density of air (kg/m3) | 1.225 |
| Density of water (kg/m3) | 988.2 |
| Viscosity of air (Pa s) | 1.7894e-5 |
| Viscosity of water (Pa s) | 0.001 |
| Surface tension (N/m) | 0.0728 |
In the present work, Reynolds number and Weber number for a rising bubble are determined in terms of bubble diameter, velocity of the bubble, liquid density, liquid viscosity and surface tension of the liquid. Analysis and bubble trajectory determination is done for bubble with Reynolds number and weber number only in the range 8–1,800 and 0.023 to 1.9 respectively.
2.3 Image processing
2.3.1 Image pre-processing
Image processing has gained importance as a tool in various fields in the recent times. Present work uses image processing as a tool to trace the path of a bubble in a bubble column reactor with different flow rates. Noises arising due to angle of focusing camera while capturing the image, medium of travel (air or water) etc. can deteriorate the quality of the image. So noises should be eliminated to get accurate pictures. Though a uniform lighting is ensured throughout the experiment, yet some problems are faced in analyzing the captured images. Reflection of light through the bubble surface varies significantly with time. The bubble position is found to influence the reflection. The bubble is observed to undergo a rotation as it moves higher. So the amount of reflection also changes continuously. There is a need to develop a comprehensive algorithm to remove these noises. Image segmentation methods based on histogram equalization is used. Since the bubble is not homogenous in the present case, the histogram equalization resulted in images with loss of information as shown in Figure 2. The white object inside the vertical column indicates the bubble.
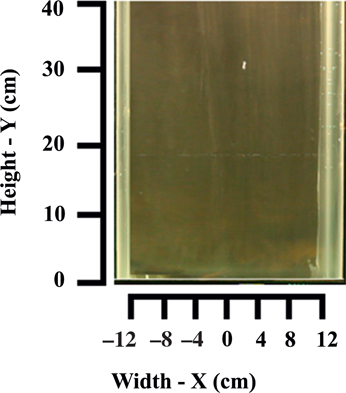
Image after histogram equalization.
2.3.2 Adaptive thresholding and edge detection
The segmentation methods are inadequate in detecting the edges with loss of information. Hence there is a requirement to develop a better algorithm that contrasts the bubble from its surroundings without losing any information. The loss of information may lead to a wrong assumption in the shape of the bubble. The moving bubble is not exactly circular and it varies as shown in Figure 3. The bubbles appear as vertically stretched in Figure 3 than they are observed from visual observation. It is presumed to be a result of high exposure time. However, it plays a little role in bubble trajectory determination as the algorithm depends on evaluating the centroid of the bubble (discussed in following section) which doesn’t change. Cheng and Burkhardt (2006) developed an algorithm for bubble tracking based on the assumption that bubble shape is circular. An adaptive thresholding strategy is developed with considerable trial and error and this method is used to distinguish the bubble from its surroundings. In contrast to the conventional thresholding technique, the adaptive thresholding uses two threshold limits. This thresholding can be generalized as shown in eq. (5).
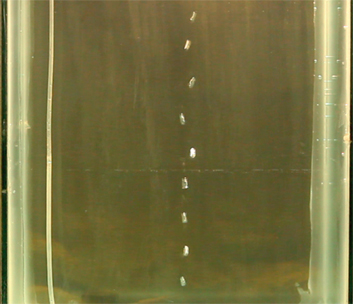
Image indicating non spherical bubbles.
Here f(x,y) is the image intensity of the output image and I and is the intensity value of the considered image. The value of “a” and “b” is found from extensive trial and error and is found to be 0.3 and 0.9 respectively.
Shape of the bubble can be identified by using boundary/edge detection technique. The Canny edge detection operator is useful in determining the bubble edge/boundary. The edge detected image is shown in Figure 4. In general edge detection methods are validated empirically by visual observation. In the present work, the edge detection methods are validated by measuring the maximum diameter of the edge detected bubble and the unprocessed image obtained from the high speed camera. Comparison is done with several images and the present method is found to approximate the maximum diameter obtained on unprocessed images in all the cases. Moreover the performance characteristics of Canny edge detector is compared with other edge detectors using statistical validation methods discussed in Yitzhaky and Peli (2003). It is found that canny edge detection is the most accurate method in determining the bubble edge boundary.

Processed image.
Once the bubble is determined, the problem of finding the position of bubbles arises. Since bubble appears as a continuously distributed dark portion in the image, the position has to be quantified. The second difficulty is tracking. Generally, template or contour matching technique is used to determine the subsequent bubbles. The bubble is found to follow a spiral trajectory as it rises higher. So the shape of the bubble changes continuously. In the present work an algorithm is developed that uses image registration. Image registration combines the bubble movement at various intervals in a single image. Then the centroid of the bubble is determined. Centroid in the present work is taken to be the geometric center of the bubble. An algorithm is developed to determine the centroid of all the bubbles obtained after image registration.
2.3.3 Image registration
The high speed camera image is continuously recorded in Streampix software. The frames corresponding to different time intervals are then taken and are processed separately. Image registration is the process of combining one image over the other. In the present work, spatial transformation based on image alignment is used to combine frames taken at different intervals. Image registration is used on both numerical and experimental images.
The number of images taken for image registration depends on the velocity of the bubble. The number is taken in such a way that a single bubble emerges out of the nozzle in the first image and reaches the top of water level in the column in the last image. The numerical images can also be converted to binary images using the same technique discussed earlier, so that the path of the bubble is determined for the numerical results. Figure 5 shows the experimental and numerical results taken at the specified time interval and the image at the right end shows the image obtained after registration.
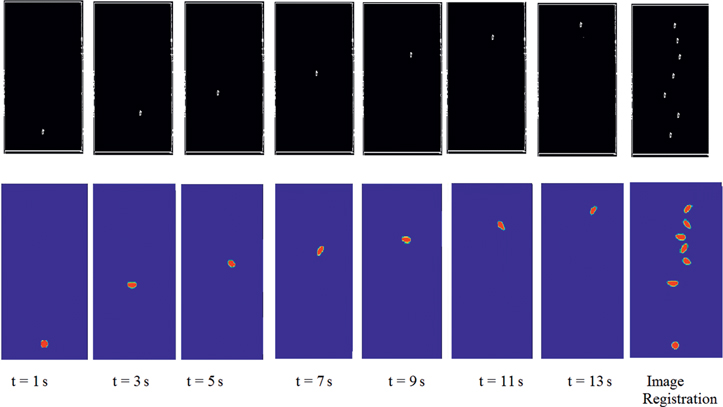
Image registration in experimental (top row) and numerical (bottom row) results are for nozzle dia 1.5 mm and air velocity 0.2 m/s with water as immobile fluid.
2.3.4 Bubble trajectory determination
Image registration results in an image, highlighting the bubble at different intervals of time. But, the plotting of trajectory is important to understand the dynamic nature of the bubble. So a centroid identification based technique is used to draw the trajectory of the bubble from the nozzle tip to the end of the bubble column reactor. In this process, the image obtained after registration in the preceding section is converted to a binary image. The centroid of bubble at each end is determined and the bubble area is replaced by the centroid. This is achieved by demarcating the bubble boundaries using the gradient operator. The intensity gradient is found to have a steep increase at the edges because of the contrasted bubble and the neighboring region. So the left and right most pixel on the boundary are tested for every bubble and the horizontal and vertical pixel distances are calculated. This is accomplished using the distance transform that uses quasi-Euclidean approach to determine the distances. This leads to the determination of centroids. The centroid of the bubble is saved as a function of time. So the centroid of the bubble can be represented by eq. (6)
In cases of multiple bubbles at high gas velocities, the calculation is done for the first bubble from the top surface of the bubble column reactor. This reduces the necessity to track every bubble. This method of analysis is meaningful, as in the present study, uniform velocity is maintained. In order to qualitatively display the trajectory in a graph, a Bezier curve is used to approximate the path of the bubble. The x-y Bezier curve is drawn in Matlab based on the data points containing the Cg of the bubble at various time durations. The Bezier curve is found to be a good approximation of the bubble trajectory as shown in Figure 6.
Trajectory of bubble.
3 Results and discussion
3.1 Analysis of image processing results
The image processing algorithm developed is used to study the trajectory of bubble in various experimental and numerical cases comprising of different nozzle diameters and superficial fluid velocities. The analysis is also carried on the bubble motion in a CMC solution which is an example of non-Newtonian fluid with the aid of numerical analysis. With these results it is possible to study the difference in patterns observed in various cases in Newtonian and Non-Newtonian fluids.
In both numerical and experimental cases, it is found that the bubble took a spiral path. It was observed that, with the increase in velocity, the bubble diameter decreases and the bubble frequency increases. It is also found that bubbles sequentially followed the same path as that of the topmost bubble. Since the present analysis is carried out in laminar regime under low velocities and the velocity is maintained constant throughout the analysis, bubble coalescence or natural splitting during the movement are not considered. With the increase in velocities, it is observed from the analysis that the spiral diameter increases and the bubble takes sharp turns dynamically as shown in Figure 7. This can be reasoned out based on the resultant drag force and reduced diameters of the bubble at higher superficial velocities. Analysis is also carried out for different nozzle diameters (0.5–3 mm). It is observed that with increase in diameter of the nozzle and keeping the velocity constant, the diameter of the bubble formed increases. Larger bubble from the bigger nozzle follows a spiral path, but the diameter of the path decreases. Thus, it was observed from numerical simulation of water, as the diameter of the nozzle is increased, the bubble trajectory limits the pattern of a straight line as shown in Figure 8.
Effect of velocity. (a) 1.5 m/s. (b) 0.2 m/s.
Effect of nozzle diameter. (A) 0.5 mm (B) 3 mm.
To study the variation in the bubble movement in Newtonian and Non-Newtonian fluid, an example of CMC solution is used. Properties of CMC solution used are shown in Table 3. The observations are similar for CMC solution as in Figure 9. The difference noted in the trajectory is for the same nozzle diameter and superficial gas velocity, the path of the bubble is less spiral for CMC than the case of water. This has been proved in the earlier research works. So with the present technique the analysis can be still extended to precisely study the effect in different fluids.
Properties of carboxymethyl cellulose (CMS) solution.
| Zero shear viscosity (μ0) | 0.0377 (Pa s) |
| Surface tension (α) | 0.072 (N/m) |
| Time constant (λ) | 0.512(s) |
| Power law index, (n) | 0.89 |
| Density (ρ) | 1,000 (kg/m5) |
Bubble trajectory in (A) Water (B) CMC solution.
It can be seen that the bubble trajectory depends on varied characteristics such as nozzle diameter, velocity and nature of fluids. Transient movement and the bubble position has to be accomplished for analysis in chemical and process engineering. The image processing algorithm described above gives the qualitative measurement of the bubble trajectory. The quantitative measurement of the position of the bubble in a particular instant can be obtained from the X (horizontal) and Y (vertical) axis measurements at a given time interval. However, if the position is approximated for various parameters, it shall be of immense use to process engineers. So an attempt is made in the present work to create a Neural Network based on the set of 300 numerical simulations for various parameters carried out taking water and CMC as fluids.
3.2 Construction of artificial neural network
Artificial Neural networks are soft computing and machine learning based tool that have been used as an effective prediction and decision making tools in the past. In ANN, a network is trained based on a proved set of results. Based on training, the designed neural network will quantify or predict the results for different input parameters which are within the range as used for training. The structure of an ANN comprises of interconnected neurons. Neurons are assigned a weight based on a certain learning algorithm. Initially the weight of the neuron is random. The weights are adjusted so that an accurate correspondence between the actual and predicted output is obtained.
In the present work, input parameters considered are inlet nozzle diameter and superficial velocity of fluids. These are the geometric and flow parameters. However, because of the transient/dynamic state of bubble motion a third input parameter time is considered to determine the position of the bubble at any instant. Since the numerical simulations are run in a 2 D environment, the position of a bubble at any instant is given by its X and Y axis representing the horizontal and vertical directions which are the predicted parameters. 80 % of the numerical data is used for training the ANN and the rest 20 % is used for validation and testing. Sigmoid transfer function is used. The signal is trained using Levenberg-Marquardt back propagation algorithm to minimize the error in the assignment of weights. The network is trained by varying the number of hidden neurons. It is optimized to obtain minimal error. The optimal number of neurons is found to be 28. Regression coefficient for ANN indicates the precision of the ANN. The regression coefficient in the present case is found to be 0.992. Bias- variance study is performed on the ANN to test its accuracy. The bias is 0.23 % and the variance is found to be 2 % showing good accuracy of the trained ANN. The design of the tested ANN is shown in Figure 10 and the regression plots are shown in Figure 11.
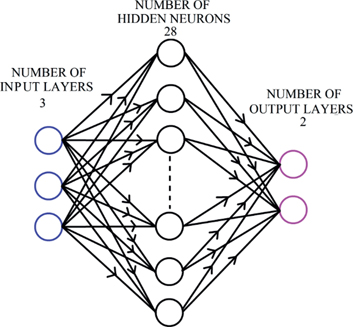
Structure of ANN.
Regression plot.
3.3 Artificial neural network -results
Figure 10 indicates the structure of neural network. Each neuron in the ANN poses a weight and an activation function. The input neuron stores the value of 3 input parameters. The hidden layer performs the transformation of input functions to output by considering the effect of each neuron in the input layer. The output layer scales the hidden layer activations to the required output which are X and Y coordinates.
The dynamic position is determined precisely from the ANN and the example is shown in Table 4. The +ve X direction shows that the bubble is on the right hand side of the camera and – ve shows the left hand side of the camera in the bubble column reactor. The table shows that the ANN predicted value and the actual (both experimental and numerical) value are in good agreement. Hence this method of analysis is of good use to determine the approximate bubble position in chemical processes. To further validate the ANN results, ANN results are compared with actual ones (high speed camera results) for various Reynolds number and is shown in Figure 12. It can be seen that ANN data points accurately fit with the actual ones, indicating the accuracy of ANN prediction.
Example of bubble of bubble trajectory predicted using ANN (origin imagined at nozzle).
| Time (s) | X (ANN) (cm) | Y (ANN) (cm) | X (Actual) (cm) | Y (Actual) (cm) |
|---|---|---|---|---|
| 0.5 | 0.5 | 0.5 | 0.6 | 0.5 |
| 1 | –5 | 1.3 | –5 | 1.2 |
| 1.5 | +5.2 | 4.1 | +5.2 | 4.1 |
| 2 | –3.5 | 6.2 | –3 | 6.3 |
| 2.5 | +4 | 9.3 | +4 | 9.5 |
| 3 | +0.5 | 10 | +0.7 | 10.6 |
| 3.5 | +0.3 | 12.3 | +0.3 | 13 |
Validation of ANN predicted trajectory.
Though in this analysis, the ANN study has been restricted for fluid, yet it paves way for further study in the field that comprising different fluids of power law indices. The same can be used for process engineering applications to determine the bubble position at any instant for different nozzle diameters and velocities. Nozzle diameter and gas flow rate is given as input parameters in the designed ANN. A difference in fluid (or fluid properties) requires training the ANN with data set pertaining to that particular fluid to arrive at an accurate answer. The advantage of ANN is obtaining accurate trace of the bubble with limited set of numerical and experimental results. In cases where there is a requirement of extensive study of the effect of various parameters numerical analysis becomes computationally expensive and is time expensive. ANN brings in the advantage of learning based decision making (an Artificial Intelligence strategy) that necessitates limited set of simulation for training. Trajectory for other parameters is arrived based on the trained ANN and thus the need for extensive numerical simulation is reduced saving the computational efforts otherwise required.
The present method can be applied to 3 D bubble. But in the case of experimental results, training of ANN becomes complex since, the image processing algorithm becomes complex. In the case of multiple bubble flow, a similar difficulty is observed. However, ANN can be applied to 3 D and multiple bubble flow based on the numerical results. There is a need for increasing the scope of training data set to include multiple bubbles. Nevertheless, the technique poses the potential versatility to be extended to 3D bubbles and multiple bubbles in the future.
4 Conclusion
The present work deals with the development of a quantitative measurement for the determination of bubble trajectory using a hybrid image processing-ANN algorithm. The devised image processing algorithm is applied on both numerical and experimental results for various nozzle diameters and superficial gaseous velocities. ANN is used to determine the instantaneous position of the bubble. ANN is trained based on the results of numerical simulations after the implementation of image processing algorithm. Thus the image processing algorithm along with ANN can be effectively utilized in process industries to determine the dynamic position of the bubble. This method of analysis can be further extended to study the difference in bubble position/trajectory in various power law fluids.
Funding statement: Funding: SASTRA University, (Grant / Award Number: ‘R&M/0029/SOME-006/2012–13’).
Nomenclature
- Cg
Centroid of the bubble (m)
- u
Fluid velocity (m/s)
- t
time (s)
- α
Phase fraction
- ρ
Fluid density (kg/m3)
- µ
Fluid viscosity (kg/(s m))
- Subscripts
- m
mixture phase
- k
kth phase
References
1. Amiri, S., Mehrnia, M.R., Barzegari, D., Yazdani, A., 2012. Determination of bubble size distribution in a bubble column reactor using artificial neural network. Asia Pacific Journal of Chemical Engineering 7, 613–623.10.1002/apj.615Suche in Google Scholar
2. Bian, Y., Dong, F., Wang, H., 2011. Reconstruction of rising bubble with digital image processing method. Instrumentation and Measurement Technology Conference (I2MTC), 2011 IEEE.10.1109/IMTC.2011.5944123Suche in Google Scholar
3. Cheng, D., Burkhardt, H., 2006. Template-based bubble identification and tracking in image sequences. International Journal of Thermal Science 45, 321–330.10.1016/j.ijthermalsci.2004.08.008Suche in Google Scholar
4. do Amaral, C.E., Alves, R.F., da Silva, M.J., Arruda, L.V., Dorini, L.B., Morales, R.E., 2012. Bubble identification based on high speed videometry data: algorithm and validation. Progress in pattern recognition, image analysis, computer vision, and applications, Springer, 870–876.10.1007/978-3-642-33275-3_107Suche in Google Scholar
5. Gonzalez, R.C., Woods, R.E., Eddins, S.L., 2004. Digital Image Processing using MATLAB, Chennai, Tamil Nadu, India: Pearson Education India.Suche in Google Scholar
6. Guo, F., Yang, Y., Chen, B., Guo, L., 2010. A novel multi-scale edge detection technique based on wavelet analysis with application in multiphase flows. Powder Technology 202(1), 171–177.10.1016/j.powtec.2010.04.035Suche in Google Scholar
7. Hagan, M.T., Demuth, H.B., Beale, M.H., 1996. Neural Network Design, Pws Pub, Boston.Suche in Google Scholar
8. Hsieh, C., Wang, S., Pan, C., 1997. Dynamic visualization of two-phase flow patterns in a natural circulation loop. International Journal of Multiphase Flow 23, 1147–1169.10.1016/S0301-9322(97)00026-8Suche in Google Scholar
9. Iyer, K., Shridharani, S., Arunkumar, S., Venkatesan, M., 2013. Application of image processing for a bubble column reactor. IEEE International Conference on Computational Intelligence and Computing Research (ICCIC), 2013.10.1109/ICCIC.2013.6724169Suche in Google Scholar
10. Kumar, R., Kannan, S., 1994. Drop size measurement in a two-phase swirling flow using image processing techniques. International Journal of Heat Mass Transfer 37, 559–570.10.1016/0017-9310(94)90128-7Suche in Google Scholar
11. Liu, H., Chen, X., Cai, X., Yu, F., 2012. In-line measurement of size, concentration and velocity of drops from gas-liquid cyclone separator based on trajectory image processing. CIESC Journal 6, 013.Suche in Google Scholar
12. Mi, Y., Ishii, M., Tsoukalas, L., 1998. Vertical two-phase flow identification using advanced instrumentation and neural networks. Nuclear Engineering and Design 184, 409–420.10.1016/S0029-5493(98)00212-XSuche in Google Scholar
13. Seshadri, A., Mahadevan, S., Muniyandi, V., 2015. Measurement of liquid film thickness in air – water two phase flows in conventional and mini channels using image processing. Korean Journal of Chemical Engineering 32, 826–836.10.1007/s11814-014-0246-5Suche in Google Scholar
14. Shi, B., Wei, J., Pang, M., 2014. A modified optical flow algorithm based on bilateral-filter and multi-resolution analysis for PIV image processing. Flow Measurement and Instrumentation 38, 121–130.10.1016/j.flowmeasinst.2014.05.005Suche in Google Scholar
15. Thompson, C.M., Shure, L., 1995. Image processing toolbox [for use with Matlab].Suche in Google Scholar
16. Uchimura, K., Harvel, G.D., Matsumoto, T., Kanzaki, M., Chang, J.-S., 1998. An image processing approach for two-phase interfaces visualized by a real time neutron radiography technique. Flow Measurement and Instrumentation 9, 203–210.10.1016/S0955-5986(98)00030-2Suche in Google Scholar
17. Yitzhaky, Y., Peli, E., 2003. A method for objective edge detection evaluation and detector parameter selection. IEEE Transactions on Pattern Analysis and Machine Intelligence 25, 1027–1033.10.1109/TPAMI.2003.1217608Suche in Google Scholar
18. Yun-long, Z., Hong-wei, L., 2012. The analysis of gas-liquid two-phase flow patterns based on variation coefficient of image connected regions and line-correlation algorithm. Energy Procedia 17, 933–938.10.1016/j.egypro.2012.02.190Suche in Google Scholar
©2017 by De Gruyter
Artikel in diesem Heft
- Bubble Trajectory in a Bubble Column Reactor using Combined Image Processing and Artificial Neural Network
- Non-linear Radiation Effects in Mixed Convection Stagnation Point Flow along a Vertically Stretching Surface
- Mixing Behaviors of Jets in Cross-Flow for Heat Recovery of Partial Oxidation Process
- Selective Hydrogenation of 4’,4”(5”)-Di-Tert-Butyldibenzo-18-Crown-6 Ether over Rh/γ-Al2O3 Nanocatalyst
- Titania-Loaded Coal Char as Catalyst in Oxidation of Styrene with Aqueous Hydrogen Peroxide
- A Study of the Soft-Sphere Model in Eulerian-Lagrangian Simulation of Gas-Liquid Flow
- Conceptual Approach in Multi-Objective Optimization of Packed Bed Membrane Reactor for Ethylene Epoxidation Using Real-coded Non-Dominating Sorting Genetic Algorithm NSGA-II
- Kinetics of Extraction of Tributyl phosphate (TBP) from Aqueous Feed in Single Stage Air-sparged Mixing Unit
- Viscous Dissipation Effects in Water Driven Carbon Nanotubes along a Stream Wise and Cross Flow Direction
- Evaluation of Mixing and Mixing Rate in a Multiple Spouted Bed by Image Processing Technique
- A Parametric Study of Biodiesel Production Under Ultrasounds
- Numerical Study of MHD Viscoelastic Fluid Flow with Binary Chemical Reaction and Arrhenius Activation Energy
- CFD Analysis and Design Optimization in a Curved Blade Impeller
- Bio-Oil Heavy Fraction as a Feedstock for Hydrogen Generation via Chemical Looping Process: Reactor Design and Hydrodynamic Analysis
- Upgrading of Heavy Oil in Supercritical Water using an Iron based Multicomponent Catalyst