Hydrothermal green synthesis of silver nanoparticles using Pelargonium/Geranium leaf extract and evaluation of their antifungal activity
-
Mojgan Mohammadlou
Mojgan Mohammadlou received her BSc degree in food engineering from Sahand University of Technology. For her BSc thesis, she worked with Assistant Professor Hoda Jafarizadeh-Malmiri on the preparation of a new pomegranate product. She received her MSc degree in chemical engineering from Sahand University of Technology, Iran, in 2015. The present study is the results of her master’s thesis supervised by Assistant Professors Hafez Maghsoudi and Hoda Jafarizadeh-Malmiri. Her field of interest is green synthesis of metal nanoparticles and evaluation of their antimicrobial activity.
Hoda Jafarizadeh-Malmiri holds BSc and MSc degrees in food engineering (Iran). He received his PhD in food science from Universiti Putra Malaysia in 2012. His PhD thesis was on shelf-life extension of banana using edible coating conjugated with silver nanoparticles. He joined Sahannd University of Technology, Iran, in 2012 and is currently working as an Assistant Professor in the Faculty of Chemical Engineering. He is the head of the Food Research Institute. His fields of interest include nanobiotechnology, food biotechnology, green processes, and organic and inorganic nanoparticle synthesis.
 and
Hafez Maghsoudi
and
Hafez Maghsoudi
Hafez Maghsoudi received his MSc and PhD degrees in chemical engineering from Sharif University of Technology, Iran, in 2007 and 2013, respectively. His MSc and PhD theses were about natural gas sweetening by amine absorption and membrane processes, respectively. He joined Sahannd University of Technology, Iran, in 2013 and is currently working as an Assistant Professor in the Faculty of Chemical Engineering. His research interests include synthesis and application of nanoparticles, zeolites, and inorganic membranes in the field of gas separation especially, gas sweetening.

Abstract
Silver nanoparticles (AgNPs) were synthesized using Pelargonium/Geranium leaf extract via a hydrothermal method. The effects of the Pelargonium/Geranium leaf extract concentration (PLEC) and the amount of 1 mm AgNO3 solution on the center of the broad emission peak (λmax) and the color of the synthesized AgNP solution were investigated by using response surface methodology. The main reducing and stabilizing compounds of Pelargonium/Geranium leaf extract were identified by Fourier transform-infrared and gas chromatography. Spherical AgNPs with an average size of 29 nm were successfully fabricated at the optimal synthesis conditions using 9.8 ml of 1 mm AgNO3 solution and 0.1 ml of 0.62 g/100 ml PLEC. AgNPs were determined to have a polydispersity index value of 0.413 and a ζ potential of +0.6 mV. The antifungal activity of fabricated AgNPs was tested against Aspergillus flavus and Aspergillus terreus, and found to posses a significant inhibitory effect against these microorganisms.
1 Introduction
Over the past decade, scientists have paid special attention to the nanotechnology field, which deals with reactions either in the atomic or the molecular level [1]. Synthesis of noble metal nanoparticles (NPs) using biological experimental and industrial processes, as an important branch of nanotechnology, has developed in recent years [2]. These noble metal NPs show more attractive physico-chemical attributes that cannot be observed at the individual molecule and in the bulk metals [3]. In nanobiotechnology research, silver NPs (AgNPs) have received much attention owing to their unique physical, chemical, and biological properties as well as their applicability in many different areas, such as food packaging, biolabeling, and medicine [4]. Moreover, AgNPs have been widely used in many different industries owing to their excellent antimicrobial properties. In fact, they have shown excellent antifungal, antiviral, and antibacterial activities [5], [6]. AgNPs can be produced by numerous chemical and physical techniques, such as chemical reduction, photochemical method, ultraviolet (UV) irradiation, electron irradiation, microwave irradiation, and sonoelectrochemical methods [5]. Some of these synthesis methods may be used to produce pure and well-defined AgNPs. However, these techniques are expensive, unsustainable, and energy consuming. Furthermore, these methods are toxic to the environment due to use of chemical materials as reducing and/or stabilizing agents that generate large amounts of hazardous by-products [2], [4].
For the past few years, synthesis of AgNPs by using microorganisms (e.g. yeast, fungi, and bacteria), plant extracts, and enzymes has been suggested as a possible eco-friendly alternative to chemical and physical methods [7], [8], [9]. Green synthesis of NPs using plant extracts has received great attention due to their progressive advantages, including low cost, scalability, and safety. Plant extracts also offer the additional advantage of short development and production times [10], [11], [12].
Several biomolecules found in plants have potential to reduce Ag+ ions from AgNO3 to AgNPs. In fact, the process of reduction is extracellular and fast, leading to the easy biosynthesis of AgNPs [13]. Plant biomolecules, including sugars, proteins, terpenoids, polyphenols, phenolic acids, and alkaloids, play an important role in the bioreduction of metal ions and the formation of NPs [14]. Recently, AgNPs of various sizes and morphologies have been synthesized by using different plant extracts [15], [16], [17]. For example, stable monodispersed spherical AgNPs with an average diameter of 10 nm were obtained by using aqueous sorghum bran extracts [18]. The aqueous AgNO3 solution, after reacting with Cassia auriculata leaf extract, led to rapid formation of highly stable AgNPs with diameter ranging from 20 to 40 nm [4]. AgNPs have been synthesized by treating silver ions with Capsicum annuum L. leaf extract, which led to spherical and polycrystalline AgNPs with an average diameter of 10 nm [19].
Pelargonium/Geranium belongs to the family Geraniaceae, and is an aromatic plant highly used in cosmetics, in sanitary products, and also in food preparation. The plant is commonly called rose geranium or rose scented geranium, and there are about 300 Geranium species [20], [21]. Several flavonoids such as isorhamnetin aglycone, quercetin 3-O-glucoside, kaempferol 3-O-rhamnoside-glucoside, kaempferol 3,7-di-O-glucoside, quercetin 3-O-pentose and kaempferol 3-O-glucoside, quercetin 3-O-rhamnoside-glucoside, quercetin 3-O-pentoside-glucoside, and myrisetin 3-O-glucoside-rhamnoside flavonoids were identified in Geranium leaf methanolic and aqueous extracts [22].
Therefore, the main objectives of the present study were to (i) analyze and use aqueous Pelargonium/Geranium leaf extract for AgNP synthesis using gas chromatography- mass spectrometry (GC-MS) and Fourier transform-infrared spectroscopy (FT-IR), (ii) study the effects of Pelargonium/Geranium leaf extract and aqueous AgNO3 solution concentrations on the particle size and concentration of the fabricated AgNPs, and (iii) evaluate the antifungal properties of the synthesized AgNPs.
2 Materials and methods
2.1 Materials
Pelargonium/Geranium was purchased from a local market in Tabriz, Iran. Silver salt (AgNO3) was purchased from Dr. Mojallali (Dr. Mojallali Chemical Complex Co., Tehran, Iran). Standard solution of AgNPs (with particle size of 10 nm and concentration of 1000 ppm) was obtained from Tecnan-Nanomat (Navarra, Spain).
Aspergillus flavus (PTCC 5004) and Aspergillus terreus (PTCC 5021) were purchased from microbial Persian type culture collection (PTCC, Tehran, Iran). Potato dextrose agar (PDA) as culture medium was provided by Oxoid Ltd. (Hampshire, UK).
2.2 Preparation of the Pelargonium/Geranium extract
The leaves of Pelargonium/Geranium were washed thoroughly two to three times with tap water, followed by washing with double-distilled water to remove any impurity, and then shade-dried for 1 week to completely remove the moisture. The resulting dried leaves were powdered using a domestic miller (MX-GX1521; Panasonic, Tokyo, Japan). Finally, 1 g of the powdered leaf was boiled for 5 min in 100 ml of deionized (DI) water and then filtered through Whatman no. 1 filter paper. The filtered Pelargonium/Geranium extract was stored in the refrigerator at 4°C.
2.3 Synthesis of AgNPs using Pelargonium/Geranium leaf extract
According to the literature, silver nitrate solution (1 mm) was prepared by dissolving 0.017 g of its powder in 100 ml of DI water [4], [18], [19]. Different amounts of AgNO3 solution (9.5–20.5 ml) were mixed with 0.1 ml of Pelargonium/Geranium leaf extract with different concentrations (0.400–1.100 g/100 ml) and then the mixture solutions were kept in autoclave at 15 psi pressure and 121°C temperature for 15 min.
2.4 Analysis
2.4.1 Pelargonium/Geranium leaf extract:
The contribution of the possible functional groups in Pelargonium/Geranium leaf extract for the formation of AgNPs was evaluated using FT-IR analysis. The FT-IR spectra of Pelargonium/Geranium leaf extract were recorded on a Bruker Tensor27 spectrometer (Bruker, Karlsruhe, Germany) using KBr pellets in the 4000–400 cm−1 region.
The chemical composition of the Pelargonium/Geranium leaf extract was analyzed using a GC-MS system (Agilent 6890; Agilent, Santa Clara, CA, USA). For this analysis, a GC-MS system with a 30 m×0.25 mm HP-5 capillary column coupled with a HP 5989A mass spectrometer was operated in electron ionization mode at 70 eV. Helium was used as the carrier gas.
NP formation is greatly influenced by the pH value of a plant extract. The size, shape, and yield of NPs are mainly affected by the change in the charge in the natural phytochemicals existing in an extract, as their capability to bind and reduce metal cations is a function of pH [14]. The pH of Pelargonium/Geranium leaf extract was measured with a pH meter (DELTA 320; Delta, Shanghai, China).
2.4.2 Synthesized AgNPs:
The formation of AgNPs was monitored at regular intervals by scanning the reacting mixture under a spectrophotometer due to their surface plasmon resonance (SPR). In order to characterize the SPR of AgNP solutions, the absorption spectra of the solutions were taken with using Jenway UV-visible (UV-Vis) spectrophotometer 6705 (Jenway Ltd., Essex, UK) in a 1-cm optical path quartz cuvette. It can be observed that broad emission peaks (λmax) are centered (380–450 nm) due to the excitation of surface plasmon vibration bands, and this is responsible for the striking yellow-brown color of AgNPs in various media [23].
The appearance of gray color is evidence that the AgNPs form in the reaction mixture as a result of the reduction of the Ag+ to Ag0. Thus, during AgNP synthesis, the color of the resulting solution is changed from colorless to yellowish brown, and by increasing the concentration of the formed AgNPs, the intensity of the solution color increases. In fact, the color change is expected to arise due to the SPR of AgNPs [24]. In order to measure the color of AgNP solutions, the absorbances of the solutions were measured at 420 nm using the spectrophotometer. The color values of samples, as ICUMSA (International Commission for Uniform Methods of Sugar Analysis) unit (IU), were calculated using the following equation [Eq. (1)]:
where b is path length of light (in cm) and C is the dry substances content (in g/ml), which was measured using a 0–32° Brix scaled digital refractometer (Palette PR-32; Atago Co. Ltd., Tokyo, Japan) and was equal to 1.332° Brix.
UV-Vis spectroscopy measurements can also be used to evaluate the concentration of AgNP solution. In fact, the absorbance of the AgNP solution is proportional to the concentration of the formed AgNPs. To measure the concentration of synthesized AgNPs, the standard curve has been established using several serial dilute solutions of AgNPs (10–1000 ppm) from standard solution of AgNPs (1000 ppm). The concentration of the sample was obtained by comparison of the absorbance of the synthesized NPs with the standard curve.
A dynamic light scattering (DLS) particle size analyzer (Nanotrac Wave; Microtrac, San Diego, CA, USA) was utilized to estimate the mean particle size of the synthesized AgNPs. DLS is a diagnostic tool for particle size distribution in solutions or colloidal suspensions that has been widely used in science and industry [25], [26]. Polydispersity index (PDI) is a dimensionless approximation that describes the homogeneity of NPs. Its value changes from 0 to 1, and smaller values correspond to a narrower and finer particle size distribution [27].
The ζ potential of the formed AgNPs is a measure of the electric charge at the surface of NPs, which is an indirect measure of their physical stability. The ζ potential of green synthesized AgNPs was determined at 25°C using DLS (Nanotrac Wave, Microtrac). Water was used as dispersant, and measurements were carried out in triplicates. The morphological evaluation of the synthesized AgNPs was performed by transmission electron microscopy (TEM; CM120; Philips, Amsterdam, Netherlands) with an acceleration voltage of 120 kV. For the TEM measurements, a drop of solution containing AgNPs was deposited on a carbon-coated copper grid.
The antifungal assay of the synthesized AgNPs was performed based on the inhibition in radial mycelial growth of Aspergillus flavus and Aspergillus terreus on the poured and dried plates with PDA incorporated with AgNPs. The diameter of the plates was 90 mm. According to Maqbool et al., an agar disk (5-mm diameter) from a pure culture of the fungus was placed in the center of PDA plates (control) and those amended with AgNPs and leaf extract, and the plates were then incubated at ambient temperature (26±2°C) for 1 week [28]. Daily radial measurements of mycelial growth were taken until the fungus reached the edge of the control plates (7 days). The antifungal properties of AgNPs were expressed as inhibition of the fungal hyphae growth (mm).
2.5 Experimental design and statistical analysis
Response surface methodology (RSM) using a central composite design (CCD) with two independent variables (synthesis parameters), namely Pelargonium/Geranium leaf extract concentration (PLEC) (0.4–1.1 g/100 ml) (X1) and amount of 1 mm AgNO3 solution (9.5–20.5 ml) (X2), was applied to determine the least mean λmax (Y1) and the highest color (Y2) of the AgNP solution.
As compared to other experimentation methodologies, which were established on classical one-variable-a-time optimization, RSM has several advantages including creating numerous valuable data using a small run of experiments and the ability of estimating the interactions of independent variables with the response variables. Therefore, it is a proper method that can be used to optimize the main independent parameters of the process to obtain a product with desired attributes [29]. The selected synthesis parameters were studied at five different levels, i.e. central point (X1: 0.750 g, X2: 15.000 ml), level –1 (X1: 0.400 g, X2: 15.000 ml), level 1 (X1: 1.100 g, X2: 15.000 ml), level –α (X1: 0.502 g, X2: 11.110 ml), and level α (X1: 0.997gr, X2: 18.889 ml). In order to estimate the pure error, a central point was repeated for five times [27]. Therefore, 13 experimental runs, including four factorial points (levels ±1), four star points (levels ±α), and five central points were generated using the software Minitab v.16 statistical package (Minitab Inc., PA, USA) (Table 2). All experiments were carried out throughout 1 day by using one block. A second-order polynomial equation [Eq. (2)] was used to correlate the mean λmax (Y1) and the highest color (Y2) of the AgNP solution to the studied synthesis variables.
where Y is the response variable; A0 is a constant; A1, A2 correspond to the linear terms; A11, A22 represent the quadratic terms; and A12 indicates the interaction terms. The suitability of the model was studied accounting for the coefficient of determination (R2) and the adjusted coefficient of determination (R2-adj). Analysis of variance was also carried out to provide the significance determinations of the resulting models in terms of p-value and F-ratio. High values of the F-ratio and small p-values (<0.05) were considered as statistically significant. Based on the fitted polynomial equations, three-dimensional surface plots and two-dimensional contour plots were designed to better visualize the independent variable interactions [30]. In order to obtain the optimum levels of PLEC and the amount of AgNO3 solution with the desired response variables, numerical multiple response and graphical optimizations were used [31]. In fact, optimal values for the synthesis parameters were obtained by estimating the resulting surface plots with limitations on the responses of a minimum value for the λmax (AgNP size) as well as a maximum value of the AgNP solution color. For verification of the validity of the statistical experimental approaches, three additional approval tests were performed at obtained optimum synthesis conditions.
3 Results and discussion
3.1 Characterization of the Pelargonium/Geranium leaf extract
FT-IR measurement was performed to identify the responsible biomolecules in the Pelargonium/Geranium leaf extract for reduction and stability of the bioreduced AgNPs. In the FT-IR spectrum (Figure 1), several absorption peaks were centered at 616.94, 1637.52, 2043.77, and 3452.89 cm−1, which were in the region range of 400–4000 cm−1. The widest spectrum absorption was observed at 3452.89 cm−1, which is attributed to the stretching vibrations of OH (hydroxyl groups) responsible for reducing the Ag+ ions to atoms. Furthermore, the suppressed bands at 1637.52 cm−1, stretching vibration of C=C (alkane groups), are responsible for stabilizing the NPs. The spectrum absorption at 616.94 cm−1 corresponded to the ring and skeletal modes of the main components.
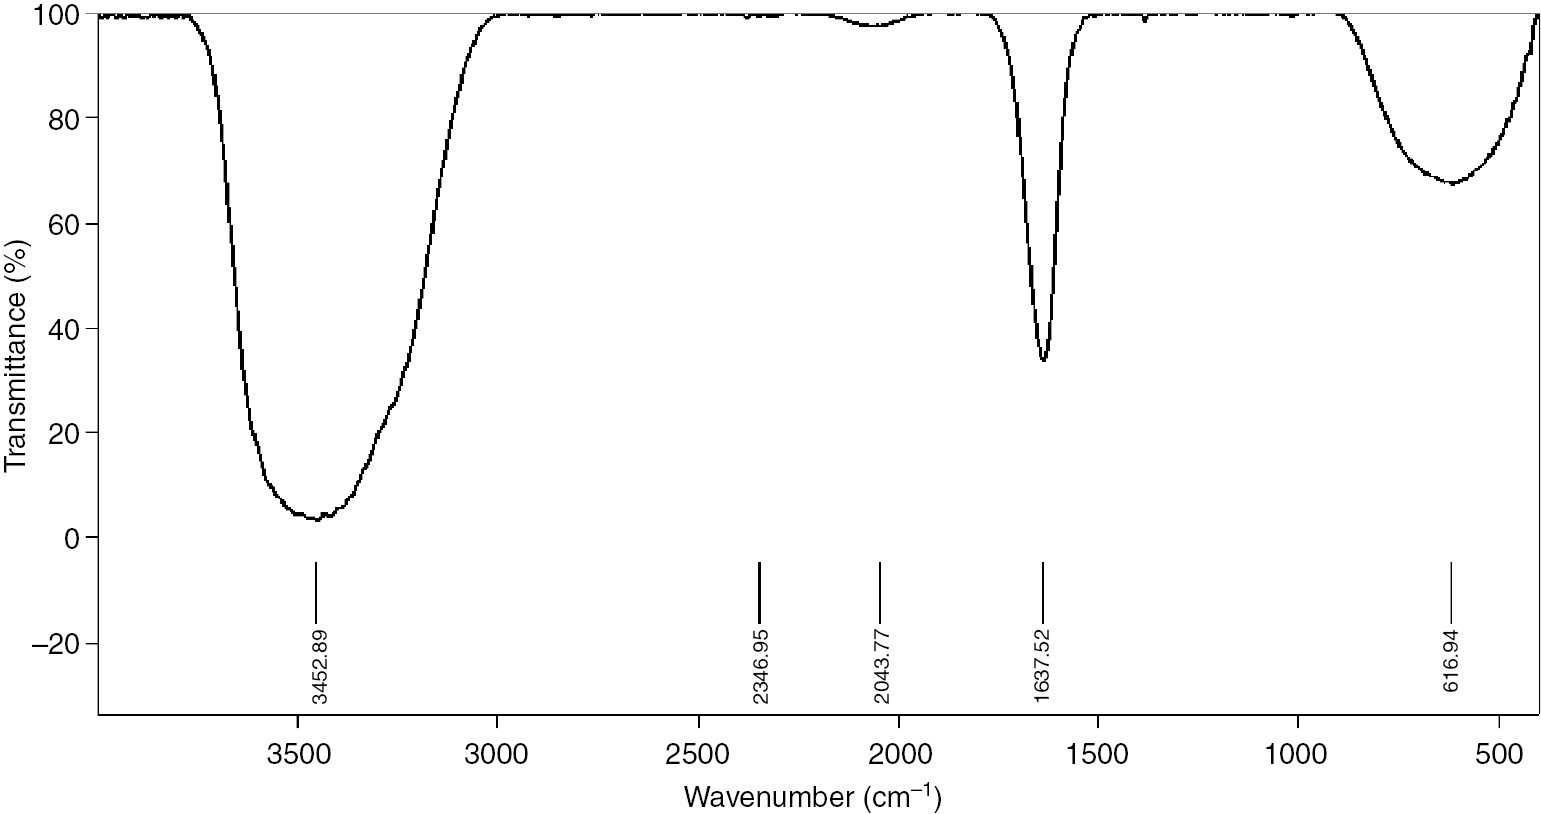
FT-IR spectrum of Pelargonium/Geranium leaf extract.
GC-MS analysis (Table 1) was also used to identify the active ingredients in the leaf extracts that were responsible for the synthesis of AgNPs. It was found that there were approximately 13 active compounds recorded within 32 min of retention time. However, there were eight prominent compounds found at different peaks of the chromatogram. These included tannins, flavonoids, phenolic acid, cinnamic acid, coumarin, monoterpenes, and sesquiterpenes, which may influence the reduction process and the stability of the synthesized AgNPs. The obtained results were in agreement with the results of the FT-IR analysis. These findings show that the main reducing (flavonoids, phenolic acid, and cinnamic acid) and stabilizing (monoterpenes and sesquiterpenes) compounds of the leaf extract had OH and C=C groups in their chemical structures, respectively.
Main reducing and stabilizing compounds of Pelargonium/Geranium leaf extract.
| Name/molecular formula | Structural formula | Retention time (min) | Main fragments |
|---|---|---|---|
| Tannin, C76H52O46 | 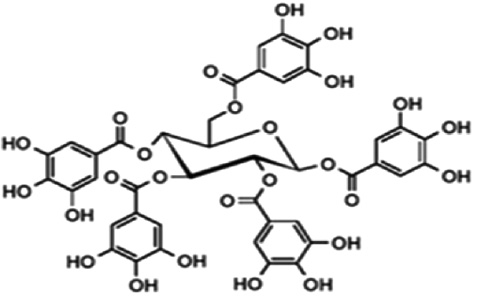 | 35 | 1701.2 |
| Flavonoids |  | 18.2 | 302, 268, 191.62 |
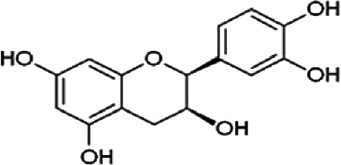 | 17.1 | 289, 254.74, 178.87 | |
| Sesquiterpenes | Three isoprenea units, sesquiterpenes may be linear (acyclic) or contain rings | 15.3 | 204 |
| Phenolic acid, C9H10O4 | 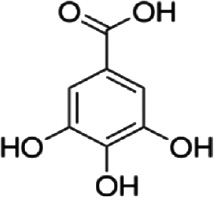 | 14.6 | 182.17, 137, 135 |
| Cinnamic acid, C9H8O2 | 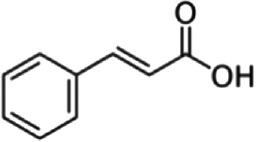 | 12 | 148.16, 103 |
| Coumarin, C9H6O2 | 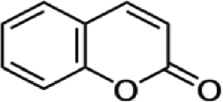 | 11.6 | 146.14, 130 |
| Monoterpenes | Two isoprene units, monoterpenes may be linear (acyclic) or contain rings | 10.8 | 136 |
aIsoprene: 
The mean pH of leaf extracts was about 5.15, indicating that Pelargonium/Geranium leaf extract is an acidic solution. The reason for this can be traced back to Table 1, which shows that extracts contain large amounts of phenolic and cinnamic acids. The AgNO3 solution was colorless (Figure 2A), whereas the leaf extract was light yellow (Figure 2B).

Color and appearance of the AgNO3 solution (A), Pelargonium/Geranium leaf extract (B), and synthesized AgNPs using Pelargonium/Geranium leaf extract (C).
3.2 Fitting the response surface models
According to the design of the experiments, second-order polynomial models were fitted using the response variables obtained from the experimental runs (Table 2). The predictable regression coefficients and the corresponding significance of regressions for final reduced models are given in Table 3. In the final reduced models, insignificant effects were removed. However, the non-significant main term of the studied independent variables could not be removed from the model, if either their quadratic or interaction effects were significant (p<0.05) (Tables 3 and 4) [31]. The F-ratio and p-values of the all terms in the obtained final reduced models, evaluating their effectiveness, are also shown in Table 4.
CCD and response variables for AgNP synthesis.
| Sample no. | PLEC (g/100 ml) | Amount of AgNO3 (ml) | λmax (nm) | Color (IU) | ||
|---|---|---|---|---|---|---|
| Exp | Pre | Exp | Pre | |||
| 1 | 0.400 | 15.000 | 402 | 402.640 | 58.411 | 56.775 |
| 2 | 0.502 | 11.110 | 403 | 403.728 | 84.238 | 82.381 |
| 3 | 0.502 | 18.889 | 402 | 403.374 | 50.545 | 58.282 |
| 4 | 1.100 | 15.000 | 407 | 407.969 | 87.975 | 84.709 |
| 5 | 0.750 | 15.000 | 406 | 405.304 | 68.867 | 70.742 |
| 6 | 0.750 | 15.000 | 406 | 405.304 | 71.161 | 70.742 |
| 7 | 0.750 | 20.500 | 406 | 404.608 | 78.771 | 68.472 |
| 8 | 0.750 | 15.000 | 406 | 405.304 | 71.128 | 70.742 |
| 9 | 0.750 | 15.000 | 406 | 405.304 | 76.077 | 70.742 |
| 10 | 0.750 | 15.000 | 406 | 405.304 | 68.605 | 70.742 |
| 11 | 0.750 | 9.500 | 407 | 406.522 | 107.607 | 110.874 |
| 12 | 0.997 | 11.110 | 408 | 408.495 | 108.721 | 108.016 |
| 13 | 0.997 | 18.889 | 405 | 406.142 | 63.262 | 72.150 |
PLEC, Pelargonium/Geranium leaf extract concentration; IU, ICUMSA (International Commission for Uniform Methods of Sugar Analysis) unit; Exp, experimental values of studied responses; Pre, predicted values of studied responses.
Regression coefficients, R2, R2-adj, and p-values for the final reduced models.
| Regression coefficient | λmax (nm) | Color (IU) |
|---|---|---|
| A0 (constant) | 384.479 | 3.076 |
| A1 (main effect) | 41.815 | −1.575 |
| A2 (main effect) | 0.595 | −0.048 |
| A11 (quadratic effect) | −13.426 | – |
| A22 (quadratic effect) | – | −0.007 |
| A12 (interaction effect) | −1.000 | 0.172 |
| R2 | 98.83 | 98.68% |
| R2-adj | 98.05 | 97.79% |
| Lack of fit | – | 0.03 |
| p-Value (regression) | – | 0.968 |
A1 and A2 are the coefficients of main effects of Pelargonium/Geranium leaf extract concentration and amount of 1 mm AgNO3 solution, respectively.
A11 and A22 are the coefficients of quadratic effects of Pelargonium/Geranium leaf extract concentration and amount of 1 mm AgNO3 solution, respectively.
A12 is the coefficient of intraction effect of Pelargonium/Geranium leaf extract concentration and amount of 1 mm AgNO3 solution.
The significance probability of regression coefficients for the final reduced models.
| Main effects | Quadratic effects | Interaction effects | |||
|---|---|---|---|---|---|
| X1 | X2 | ||||
| λmax (Y1, nm) | |||||
| p-Value | 0.000 | 0.006 | 0.000 | NS | 0.001 |
| F-value | 163.90 | 17.21 | 73.24 | NS | 35.15 |
| Color (Y2, IU) | |||||
| p-Value | 0.023 | 0.339a | NS | 0.015 | 0.004 |
| F-value | 9.22 | 1.08 | NS | 11.20 | 21.22 |
X1, Pelargonium/Geranium leaf extract concentration; X2, amount of 1 mm AgNO3 solution; NS, not significant (p>0.05). aNot significant but should be kept due to its significant quadratic and intraction effects.
It should be noted that the resulting models were significant only in the defined ranges for the studied independent variables, and they may not be used to predict the responses out of these ranges [32], [33].
As the overall model performance could be manifested in coefficients of determinations, the resulting rather high values for R2 and R2-adj verified the fitness of the proposed models. Moreover, the achieved insignificant lack of fits for the proposed final models confirm their sufficient fitness to the synthesis parameter effects (Table 3). As clearly observed in Table 4, the synthesis parameters have significant (p<0.05) effects on all the studied characteristics of synthesized AgNPs.
3.2.1 λmax
The λmax of the obtained AgNPs ranged from 402 to 408 nm (Table 2). In all cases, λmax was obtained in a favorable range for AgNPs using UV-Vis analysis [34].
The results also demonstrated that the synthesis variables had significant (p<0.05) effects on the λmax (Y1) variations (Table 4). In fact, the particle size of the synthesized AgNPs can be manifested in the λmax of the AgNPs. It is well known that the longer wavelengths in absorption spectra of metal NPs are correlated to their bigger size [34]. The AgNP size changes could also be explained as a function of PLEC and the amount of AgNO3 solution. As shown in Figure 3A, at low and constant PLEC, λmax increases by increasing the amount of AgNO3 in the mixture reaction, resulting in the production of bigger-sized AgNPs. This can be explained by the fact that at a low PLEC, the alkene groups of monoterpenes and sesquiterpenes had weak binding ability with Ag+. This behavior creates a layer around the AgNPs that acts as a capping agent to decrease AgNP agglomeration and increase their stability in the medium. The obtained results are in agreement with the findings of Zhang et al., who investigated the amount of AgNO3 solution on λmax and size of NPs. Based on their study, by increasing the AgNO3 volume, the surface plasmon peak of AgNPs trended to red-shift and the particle size was increased [35].
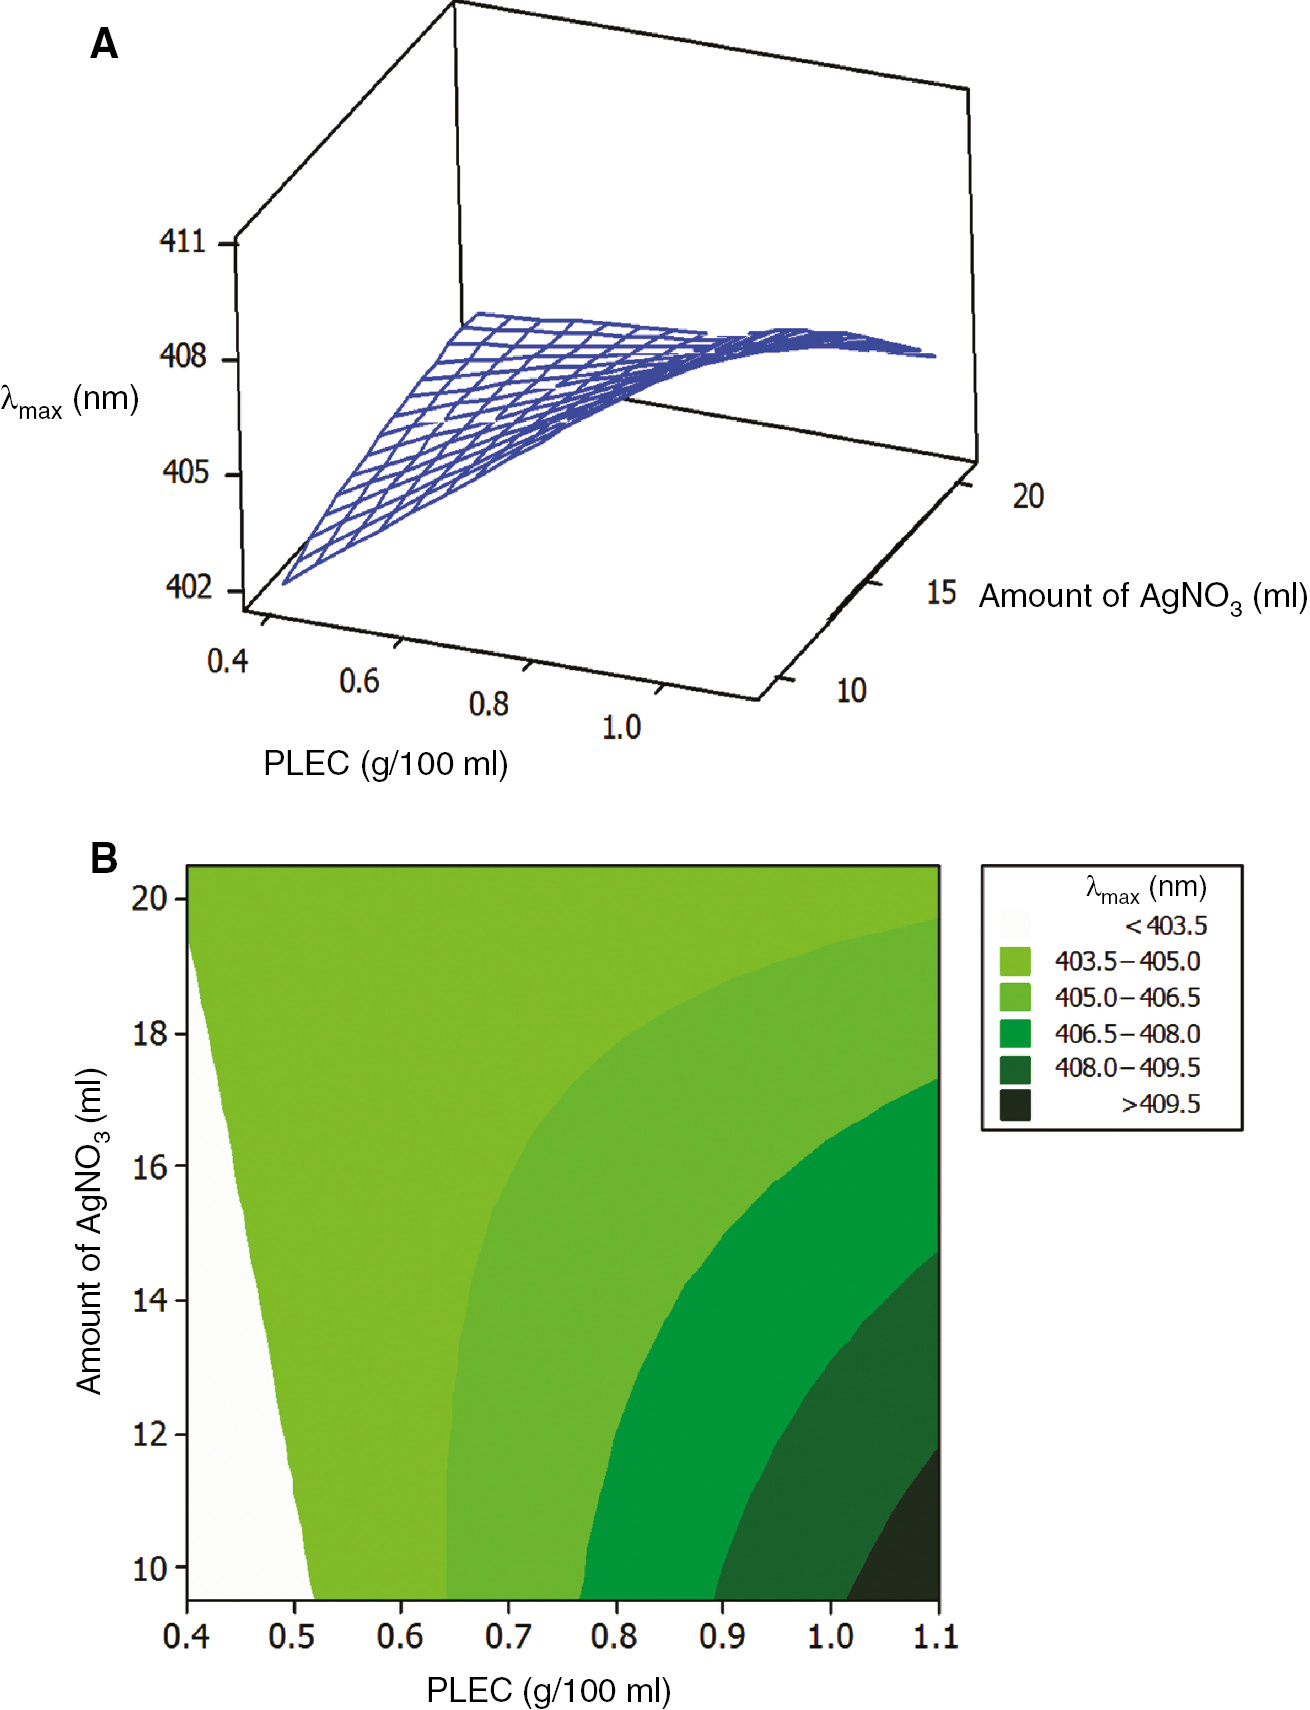
Surface (A) and contour (B) plots for λmax of the synthesized AgNP solution as a function of the amount of AgNO3 (ml) and PLEC (g/100 ml).
On the other hand, at high and constant PLEC, by increasing the amount of the AgNO3 solution, the size of AgNPs was decreased (Figure 3A). Due to the presence of high concentration of stabilizing agents in the extract, upon the addition of low amounts of AgNO3 solution, silver ions caused repulsion and capping agents had strong binding with AgNPs. As shown in Figure 3A, by increasing the PLEC at constant high and low amounts of AgNO3 solution, the size of AgNPs were constant and increased, respectively. At high amounts of AgNO3 by increasing the PLEC, due to the presence of more stable compounds, the λmax and NP size remained constant. The obtained results also indicated a significant (p<0.05) interaction between the amount of AgNO3 solution and the PLEC on changing AgNP size (Table 4).
As clearly observed in Figure 3B, the minimum achievable λmax (405 nm) could be at low amounts of AgNO3 solution and PLEC. The individual optimum conditions indicated that the maximum (Y1=405 nm) was predicted at PLEC of 0.62 g/100 ml and 9.8 ml of AgNO3 solution.
3.2.2 Color of AgNP solution
Based on the results, the synthesis variables had a significant (p<0.05) effect on the color of the AgNP solution (Y2) variations (Table 4). Thus, the AgNP solution color changes could also be explained as a function of PLEC and the amount of AgNO3. As shown in Figure 4, at low and constant amounts of PLEC, by increasing the amount of AgNO3 the intensity of the mixture color decreased, denoting the production of a smaller number of AgNPs in the medium. The result can be explained by the fact that in the small amounts of dried powder, reducing agents can react with Ag+ completely. In fact, after complete reduction, by increasing the amount of AgNO3 solution, the amount of silver ions increased while the number of synthesized AgNPs was constant, and their concentration decreased due to an increase in the volume of the AgNP solution. On the other hand, at high and constant PLEC, increasing the amount of AgNO3 had no significant effect on the color of mixture (Figure 4A). Due to high concentration of reducing agents in the extract, small amounts of AgNO3 solution rapidly reduced the free silver ions to form AgNPs, which, in turn, changed the color of the mixture solution from yellow to dark gray (Figure 2C). The presence of surface plasmon vibration bands due to the formation of AgNPs could change the color of mixture to dark gray [23]. By increasing the amount of AgNO3 solution, the number of synthesized AgNPs was increased. However, due to the high intensity of mixture color, these changes could not be visualized. As clearly observed in Figure 4A, at constant low and high amounts of AgNO3 solution, by increasing the concentration of PLEC, the color of mixture was constant (at low concentrations) and increased (at high concentrations), respectively. At low amount of AgNO3, by increasing the PLEC concentration, all of the silver ions were sharply reduced to AgNPs and the color of the solution turned into dark gray. Due to low concentration of silver ions, further increase in the concentration of PLEC did not result in any significant (p<0.05) effect on the concentration of the formed AgNPs and the color of mixture. At high amounts of AgNO3 solution, an increase in the concentration of PLEC could lead to increase in the concentration of synthesized AgNPs and color intensity of the solution. Bindhu and Umadevi also indicated that by increasing the concentration of dried hemp extract, the concentration of synthesized AgNPs increased, which was observable by the color change of the solution [36].

Surface (A) and contour (B) plots for AgNP solution color as function of the amount of AgNO3 (ml) and PLEC (g/100 ml).
The obtained results also indicated a significant (p<0.05) synergistic effect of the amount of AgNO3 solution and the concentration of PLEC on the AgNP solution color (Table 4).
As shown in Figure 4B, the maximum AgNP concentration of 100.73 ppm and color intensity of 1.98 IU could be achieved at high and low concentrations of PLEC and the amount of AgNO3 solution, respectively. The individual optimum conditions showed that the maximum color was predicted using 0.62 g/100 ml of PLEC of and 9.8 ml of AgNO3 solution.
3.3 Optimization of processing parameters for the synthesized AgNPs
The optimum conditions for AgNP synthesis would be achieved when the process resulted in the formation of the smallest mean particle size (λmax) with the highest number of AgNPs (color) in the solution. Graphical optimization based on an overlaid contour plot was used to find the optimum region for synthesis parameters to produce AgNPs with the minimum particle size and the maximum AgNP solution color (Figure 5). The white area in Figure 5 indicates the desired PLEC and AgNO3 solution levels to obtain the optimum AgNPs. The quartiles of AgNP solution color were considered as their accepted higher levels. The first quartile of the mean particle size was also selected as its desired low level. As shown in Figure 5, the most desirable AgNPs were obtained from the synthesis conditions with AgNO3 solution and PLEC of less than 16 ml and 0.9 g/100 ml, respectively.

Overlaid contour plot of λmax and color of AgNP solution with acceptable levels as a function of the amount of AgNO3 (ml) and PLEC (g/100 ml).
Numerical multiple optimizations were also used to find the optimum levels of the studied variables. The results also suggested that the synthesis conditions with AgNO3 solution of 9.8 ml and PLEC of 0.62 g/100 ml would give the most desirable AgNPs with λmax and mixture solution color of 405 nm and 1.98 IU, respectively. Furthermore, the overall closeness between the predicted and experimental values of the responses could be concluded from the p-values of t-test analysis between them (1.00 for both responses). Moreover, three AgNP solutions were prepared according to the recommended optimal levels by numerical multiple optimization and were characterized in terms of studied physicochemical properties. The measured experimental values for the λmax and AgNP solution color for these three AgNP solution samples were 405±2.33 nm and 1.98±0.6 IU, respectively. The insignificant differences found between the predicted and experimental values of the optimum suggested sample was reconfirmed by the adequacy of the final reduced models fitted by RSM.
3.4 Physico-chemical characteristics of synthesized AgNPs at optimum synthesis conditions
By synthesis of the AgNPs at obtained optimum conditions, the colorless reaction mixture was turned into dark gray solution (Figure 2C). The color change occurred due to the presence of the active molecules in the leaf extract, which could reduce the silver metal ions into AgNPs. Formation of AgNPs from 1 mm solution of AgNO3 could be evaluated by using UV-Vis spectral analysis. Metal NPs have free electrons, the combined vibration of which in resonance with the light wave gives rise to an SPR absorption band [37]. As clearly observed in Figure 6A, an SPR spectrum for AgNPs was achieved at 405 nm.

SPR spectrum (A) and particle size distribution (B) of the synthesized AgNPs at obtained optimum synthesis conditions.
The average particle size and the PDI, as a relative width of the size distribution, were determined using DLS measurements. DLS could also be used to determine the particle size distribution of the synthesized NPs in the suspension. At the optimum synthesis condition, the particle size of AgNPs ranged between 22 and 36 nm, with an average size of 29 nm. The PDI value of the synthesized AgNPs was 0.413 at obtained optimum synthesis condition, and its particle size distribution is shown in Figure 6B.
The ζ potential value of +0.6 mV for synthesized AgNPs at the optimum conditions showed that the capping biomolecules around the AgNPs are primarily composed of positively charged groups that are also responsible for the moderate stability of the NP [38]. TEM analysis was performed to evaluate the shape and microstructure of the synthesized AgNPs. A representative TEM image of the synthesized AgNPs is shown in Figure 7. As clearly observed, the synthesized NPs were dispersed with spherical structures. In fact, spherical NPs were more abundant than other shapes of NPs.

TEM image of the synthesized AgNPs at obtained optimum conditions.
3.5 Antifungal activity of synthesized AgNPs at optimum synthesis conditions
The effects of synthesized AgNPs on mycelial growth of Aspergillus flavus and Aspergillus terreus during an incubation period of 7 days are shown in Figure 8A and B, respectively. As shown in Figure 8, the growth of A. flavus and A. terreus mycelia were significantly (p<0.05) inhibited by the presence of AgNPs as compared to the control plates and those amended with only Pelargonium/Geranium leaf extract. This result indicated that the synthesized AgNPs had high antifungal activity, and this was in line with the findings of Shankar et al., who indicated that AgNPs synthesized with Pelargonium/Geranium extract ranged in size from 16 to 40 nm and had a strong detrimental effect on the fungus Fusarium oxysporum [39]. According to Kim et al., AgNPs affect fungal cells by attacking their membranes and then disrupting the membrane potential [40]. Lamsal et al., with the aid of microscopic observations, indicated that the synthesized NPs caused antimicrobial effects not only on fungal hyphae but also on conidial germination [41]. It also seems that the high antifungal properties of AgNPs could be related to their chelating character and capability to modify the concentrations of ions existing in the growth media (e.g. Ca2+), essential minerals, and trace elements, which are all important for microbial growth especially for filamentous fungal growth.
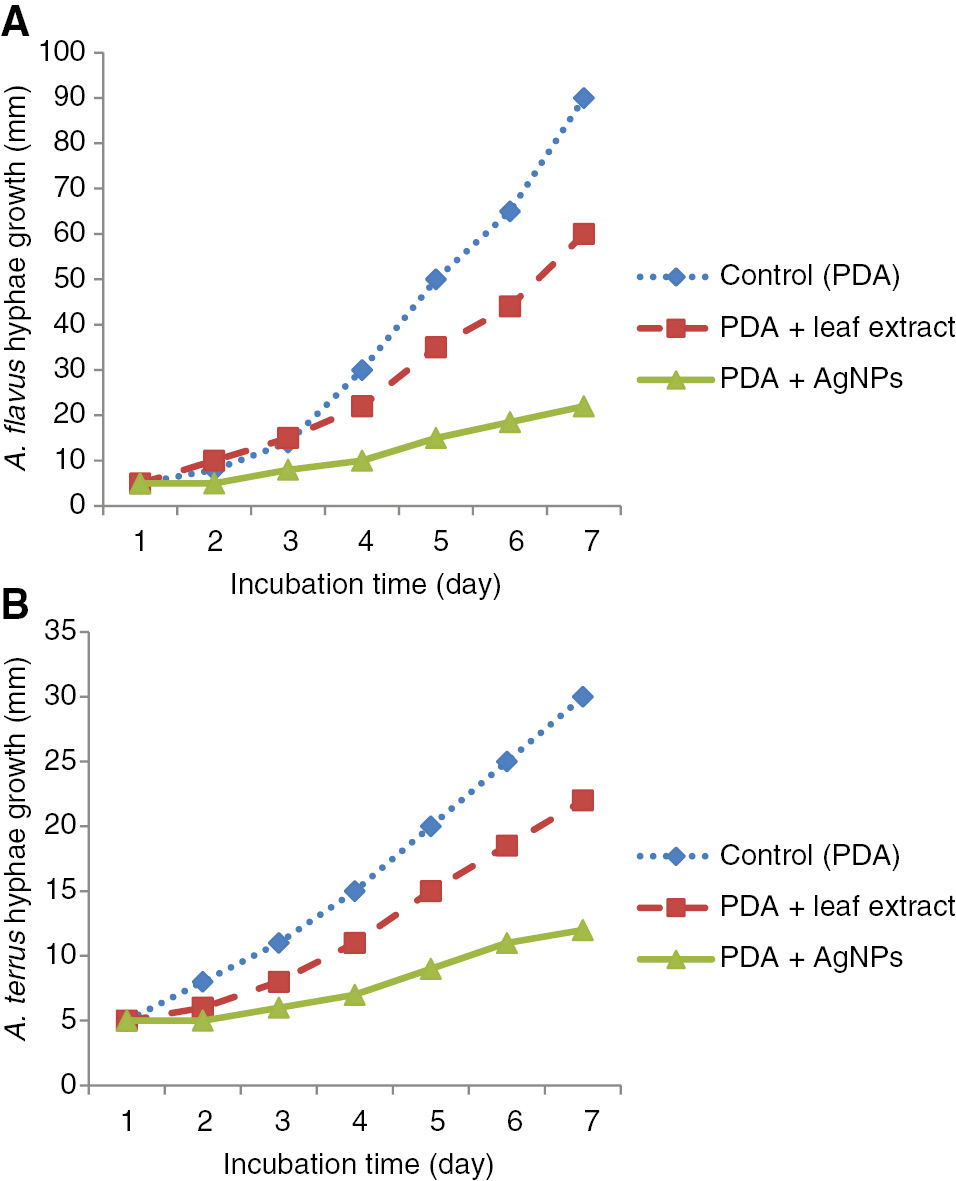
Antifungal activity of the synthesized AgNPs at obtained optimum conditions against Aspergillus flavus (A) and Aspergillus terreus (B). Data are the mean value of three replicates (each replicate contains four plates).
4 Conclusions
A simple, one-step green approach was developed for synthesis of AgNPs without using any toxic chemicals. Pelargonium/Geranium leaf extract acted mainly as a reducing agent to fabricate AgNPs with small particle size and narrow size distribution. RSM was successfully applied to develop empirical models for the λmax and the color of the synthesized AgNP solution, as a function of PLEC and the amount of 1 mm AgNO3 solution. The results indicated the usefulness of CCD for studying the effects of the synthesis conditions on the dependent variables and to optimize them in order to obtain the most desirable AgNPs. These green synthesized AgNPs showed a stronger fungicidal effect on A. flavus and A. terreus.
About the authors

Mojgan Mohammadlou received her BSc degree in food engineering from Sahand University of Technology. For her BSc thesis, she worked with Assistant Professor Hoda Jafarizadeh-Malmiri on the preparation of a new pomegranate product. She received her MSc degree in chemical engineering from Sahand University of Technology, Iran, in 2015. The present study is the results of her master’s thesis supervised by Assistant Professors Hafez Maghsoudi and Hoda Jafarizadeh-Malmiri. Her field of interest is green synthesis of metal nanoparticles and evaluation of their antimicrobial activity.

Hoda Jafarizadeh-Malmiri holds BSc and MSc degrees in food engineering (Iran). He received his PhD in food science from Universiti Putra Malaysia in 2012. His PhD thesis was on shelf-life extension of banana using edible coating conjugated with silver nanoparticles. He joined Sahannd University of Technology, Iran, in 2012 and is currently working as an Assistant Professor in the Faculty of Chemical Engineering. He is the head of the Food Research Institute. His fields of interest include nanobiotechnology, food biotechnology, green processes, and organic and inorganic nanoparticle synthesis.
Hafez Maghsoudi received his MSc and PhD degrees in chemical engineering from Sharif University of Technology, Iran, in 2007 and 2013, respectively. His MSc and PhD theses were about natural gas sweetening by amine absorption and membrane processes, respectively. He joined Sahannd University of Technology, Iran, in 2013 and is currently working as an Assistant Professor in the Faculty of Chemical Engineering. His research interests include synthesis and application of nanoparticles, zeolites, and inorganic membranes in the field of gas separation especially, gas sweetening.
Acknowledgments
The authors would like to acknowledge the Iran Nanotechnology Initiatives Council for funding (grant no. 84004) the development of an innovative methodology for safety assessment of industrial nanomaterials.
References
[1] Elsupikhe RF, Shameli K, Ahmad MB, Ibrahim NA, Zainudin N. Nanoscale Res. Lett. 2015, 10, 302–310.10.1186/s11671-015-0916-1Search in Google Scholar PubMed PubMed Central
[2] Udayasoorian C, Kumar R, Jayabalakrishnan M. Dig. J. Nanomater. Biostruct. 2011, 6, 279–283.Search in Google Scholar
[3] Kasthuri J, Veerapandian S, Rajendiran N. Colloids Surf. B Biointerfaces 2009, 68, 55–60.10.1016/j.colsurfb.2008.09.021Search in Google Scholar PubMed
[4] Okafor F, Janen A, Kukhtareva T, Edwards V, Curley M. Int. J. Environ. Res. Public Health 2013, 10, 5221–5238.10.3390/ijerph10105221Search in Google Scholar PubMed PubMed Central
[5] Vivek R, Thangam R, Muthuchelian K, Gunasekaran P, Kaveri K, Kannan S. Process Biochem. 2012, 47, 2405–2410.10.1016/j.procbio.2012.09.025Search in Google Scholar
[6] Mohammadlu M, Maghsoudi H, Jafarizadeh-Malmiri H. Int. Food Res. J. 2016, 23, 446–463.Search in Google Scholar
[7] Pandian M, Marimuthu R, Natesan G, Rajagopal RE, Justin J, Mohideen A. Am. J. Nanosci. Nanotechnol. 2013, 1, 57–64.10.11648/j.nano.20130102.13Search in Google Scholar
[8] Bhainsa KC, D’Souza S. Colloids Surf. B Biointerfaces 2006, 47, 160–164.10.1016/j.colsurfb.2005.11.026Search in Google Scholar PubMed
[9] Singaravelu G, Arockiamary J, Kumar VG, Govindaraju K. Colloids Surf. B Biointerfaces 2007, 57, 97–101.10.1016/j.colsurfb.2007.01.010Search in Google Scholar PubMed
[10] Ramteke C, Chakrabarti T, Sarangi BK, Pandey RA. J. Chem. 2012, 2013, 1–7.10.1155/2013/278925Search in Google Scholar
[11] Jain D, Daima HK, Kachhwaha S, Kothari S. Dig. J. Nanomater. Bios. 2009, 4, 557–563.Search in Google Scholar
[12] Gnanajobitha G, Annadurai G, Kannan C. Int. J. Pharm. Sci. Res. 2012, 3, 323–330.Search in Google Scholar
[13] Roopan SM, Madhumitha G, Rahuman AA, Kamaraj C, Bharathi A, Surendra T. Ind. Crops Prod. 2013, 43, 631–635.10.1016/j.indcrop.2012.08.013Search in Google Scholar
[14] Makarov V, Love A, Sinitsyna O, Yaminsky SMI, Taliansky M, Kalinina N. Acta Nat. 2014, 6, 35–44.10.32607/20758251-2014-6-1-35-44Search in Google Scholar
[15] Logeswari P, Silambarasan S, Abraham J. J. Saudi Chem. Soc. 2015, 19, 311–317.10.1016/j.jscs.2012.04.007Search in Google Scholar
[16] Marchiol L, Mattiello A, Pošćić F, Giordano C, Musetti R. Nanoscale Res. Lett. 2014, 9, 101–112.10.1186/1556-276X-9-101Search in Google Scholar PubMed PubMed Central
[17] Rodríguez-León E, Iñiguez-Palomares R, Navarro RE, Herrera-Urbina R, Tánori J, Iñiguez-Palomares C, Maldonado A. Nanoscale Res. Lett. 2013, 8, 318–327.10.1186/1556-276X-8-318Search in Google Scholar PubMed PubMed Central
[18] Njagi EC, Huang H, Stafford L, Genuino H, Galindo HM, Collins JB, Hoag GE, Suib SL. Langmuir 2010, 27, 264–271.10.1021/la103190nSearch in Google Scholar PubMed
[19] Li S, Shen Y, Xie A, Yu X, Qiu L, Zhang L, Zhang Q. Green Chem. 2007, 9, 852–858.10.1039/b615357gSearch in Google Scholar
[20] Benazir J, Suganthi R, Chandrika P, Mathithumilan B. J. Med Plants Res. 2013, 7, 2815–2822.Search in Google Scholar
[21] Rabesiaka J, Pierre H, Razanamparany B. J. Food Process. Technol. 2012, 4, 208–214.Search in Google Scholar
[22] Boukhris M, Simmonds MS, Sayadi S, Bouaziz M. Phytother. Res. 2013, 27, 1206–1213.10.1002/ptr.4853Search in Google Scholar PubMed
[23] Han JW, Gurunathan S, Jeong JK, Choi YJ, Kwon DN, Park JK, Kim JH. Nanoscale Res. Lett. 2014, 9, 459–473.10.1186/1556-276X-9-459Search in Google Scholar PubMed PubMed Central
[24] Gurunathan S, Kalishwaralal K, Vaidyanathan R, Venkataraman D, Pandian SRK, Muniyandi J, Hariharan N, Eom SH. Colloids Surf. B Biointerfaces 2009, 74, 328–335.10.1016/j.colsurfb.2009.07.048Search in Google Scholar PubMed
[25] Li Z, Wang Y, Shen J, Liu W, Sun X. Opt. Lasers Eng. 2014, 56, 94–98.10.1016/j.optlaseng.2013.12.004Search in Google Scholar
[26] Saxena A, Tripathi R, Singh R. Dig. J. Nanomater. Bios. 2010, 5, 427–432.Search in Google Scholar
[27] Anarjan N, Jafarizadeh-Malmiri H, Nehdi IA, Sbihi HM, Al-Resayes SI, Tan CP. Int. J. Nanomed. 2015, 10, 1109–1118.10.2147/IJN.S72835Search in Google Scholar PubMed PubMed Central
[28] Maqbool M, Ali A, Ramachandran S, Smith DR, Alderson PG. Crop Prot. 2010, 29, 1136–1141.10.1016/j.cropro.2010.06.005Search in Google Scholar
[29] Anarjan N, Jafarizadeh-Malmiri H, Ling TC, Tan CP. Int. J. Food Prop. 2014, 17, 937–947.10.1080/10942912.2012.685680Search in Google Scholar
[30] Anarjan N, Tan CP, Ling TC, Lye KL, Jafarizadeh-Malmiri H, Nehdi IA, Cheah YK, Mirhosseini H, Baharin BS. J. Agric. Food Chem. 2011, 59, 8733–8741.10.1021/jf201314uSearch in Google Scholar PubMed
[31] Anarjan N, Mirhosseini H, Baharin BS, Tan CP. Food Chem. 2010, 123, 477–483.10.1016/j.foodchem.2010.05.036Search in Google Scholar
[32] Jafarizadeh Malmiri H, Osman A, Tan CP, Abdul Rahman R. J. Food Process. Preserv. 2012, 36, 252–261.10.1111/j.1745-4549.2011.00583.xSearch in Google Scholar
[33] Anarjan N, Jaberi, S. Yeganeh-Zare S, Banafshehchin E, Rahimirad A, Jafarizadeh-Malmiri H. J. Am. Oil Chem. Soc. 2014, 91, 1397–1405.10.1007/s11746-014-2482-6Search in Google Scholar
[34] Kannan N, Mukunthan K, Balaji S. Colloids Surf. B Biointerfaces 2011, 86, 378–383.10.1016/j.colsurfb.2011.04.024Search in Google Scholar PubMed
[35] Zhang Y, Cheng X, Zhang Y, Xue X, Fu Y. Colloids Surf. A 2013, 423, 63–68.10.1016/j.colsurfa.2013.01.059Search in Google Scholar
[36] Bindhu M, Umadevi M. Spectrochim. Acta A 2013, 101, 184–190.10.1016/j.saa.2012.09.031Search in Google Scholar PubMed
[37] Dubey SP, Lahtinen M, Sillanpää M. Colloids Surf. A 2010, 364, 34–41.10.1016/j.colsurfa.2010.04.023Search in Google Scholar
[38] Mittal AK, Bhaumik J, Kumar S, Banerjee UC. J. Colloid Interface Sci. 2014, 415, 39–47.10.1016/j.jcis.2013.10.018Search in Google Scholar PubMed
[39] Shankar SS, Ahmad A, Sastry M. Biotechnol. Progr. 2003, 19, 1627–1631.10.1021/bp034070wSearch in Google Scholar PubMed
[40] Kim SW, Kim KS, Lamsal K, Kim YJ, Kim SB, Jung M, Sim SJ, Kim HS, Chang SJ, Kim JK, Lee YS. J. Microbiol. Biotechnol. 2009, 19, 760–764.Search in Google Scholar
[41] Lamsal K, Kim SW, Jung JH, Kim YS, Kim KS, Lee YS. Mycobiology 2011, 39, 194–199.10.5941/MYCO.2011.39.3.194Search in Google Scholar PubMed PubMed Central
©2017 Walter de Gruyter GmbH, Berlin/Boston
This article is distributed under the terms of the Creative Commons Attribution Non-Commercial License, which permits unrestricted non-commercial use, distribution, and reproduction in any medium, provided the original work is properly cited.
Articles in the same Issue
- Frontmatter
- In this issue
- Review
- Biomass processing into ethanol: pretreatment, enzymatic hydrolysis, fermentation, rheology, and mixing
- Original articles
- Shora (Capparis petiolaris) fruit mediated green synthesis and application of silver nanoparticles
- Hydrothermal green synthesis of silver nanoparticles using Pelargonium/Geranium leaf extract and evaluation of their antifungal activity
- Green synthesis of gold nanoparticles using quail egg yolk and investigation of potential application areas
- Low temperature green synthesis of LaAlO3 using microcrystalline LaOCl and amorphous Al2O3 precursors derived from spray pyrolysis
- Intensification of enzyme catalysed synthesis of hexyl acetate using sonication
- The development and numerical simulation of a plasma microreactor dedicated to chemical synthesis
- Ultrasound promoted green synthesis of benzofuran substituted thiazolo[3,2-b][1,2,4]triazoles
- Solventless synthesis of solketal with commercially available sulfonic acid based ion exchange resins and their catalytic performance
- Investigation on the conversion of rapeseed oil via supercritical ethanol condition in the presence of a heterogeneous catalyst
- Investigation on drying characteristics of high titanium slag using microwave heating
- Effects of waste eggshells and SiC addition in the synthesis of aluminum hybrid green metal matrix composite
- Conference announcements
- 4th International Conference Implementation of Microreactor Technology in Biotechnology (IMTB 2017), Bled, Slovenia, April 23–26, 2017
- 7th Advances in Microfluidics & Nanofluidics (AMN)/9th International Symposium on Microchemistry and Microsystems (ISMM)/5th Asia-Pacific Chemical and Biological Microfluidic Conference (APCBM)/8th Australia New Zealand Nano-Microfluidics Symposium (ANZNMF) (Hobart, Australia, June 26–29, 2017)
- Book review
- Alternative energy sources for green chemistry