Bank Syndication – A Premise for Increasing Bank Performance or Diversifying Risks?
-
Dan Costin Nitescu
 and
Cristian Marius Anghel
and
Cristian Marius Anghel


Abstract
The objective of this research is to identify whether the risks associated with bank syndications can contribute to the increase or decrease in bank profitability and also whether bank syndications can contribute to the dispersion of risks associated with this activity, within the three most important financial markets: the USA, Europe, and China. To identify the interdependencies between bank profitability and risk diversification, the article analyses a panel vector autoregression estimated over the period 2008–2020 and a quantile regression. The factors considered are consistent with the relationship between risk and return in bank syndications: return factors (return on assets, volume of syndicated loans) and risk factors (non-performing loans, foreign exchange rate, interest rate). The results of the research reflect that risks assumed in bank syndications can be dispersed among syndicate participants and also bank syndications contribute to bank profitability. The results of this research can be further utilized to develop risk management capabilities and adjust financial mechanisms to manage vulnerabilities in the dynamic context of crises.
1 Introduction
Bank loan syndication represents a financial mechanism that has a synergetic role. It strongly supports the strategic perspective as one of the most frequent and complex financial mechanisms to structure finance for the most significant projects and corporate customers (Aramonte et al., 2022). Technology also transforms the syndication process of the loans (e.g., Distributed Ledger Technologies, Smart Contracts, Artificial Intelligence, integrated platforms), (“Clifford Chance”, 2021), as support for automatizing, improved negotiation, execution, and management of the loans.
The bank loan syndication process emphasizes a “technical” and “cultural” approach. Syndication activities involve strategic perspectives related to the customers, specific projects, coordination, and convergent interests of banks. A leading financial institution, known as the lead arranger, is coordinating the syndicate of banks. Participating banks are the institutions that receive the invitation and agree to be part of the syndicate (Howcroft et al., 2014). The agent is also responsible for the initial transaction, obtaining participation from other banks, documentation, collateral assignment and distribution of borrower payments, fees, compliance reporting, repayments throughout the life of the loan, loan monitoring, and general reporting for all lending parties. Underwriting bank or agent bank may be other roles required, depending on the operationalization and negotiations within the syndicate of banks.
Considering that, bank lending carries a certain degree of risk that cannot be completely avoided. Taking into account the fact that syndicated loans involve the granting of large amounts of money to a borrower, the probability of nonrepayment can significantly affect the financial situation of the bank or banks involved. For this reason, it is necessary to know whether this type of lending may contribute to the diversification of risks between the parties involved or to the increase in bank profitability. Or may it contribute to both?
Also, in assessing the relationship between syndicated loans and bank profitability, we must take into account whether there is a direct relationship between the two variables or an indirect one influenced by other macroeconomic variables. This is important to be able to determine whether only controlling the volume of syndicated loans can improve or worsen the bank’s health or whether other economic variables that may influence the bank’s health should also be considered and controlled.
Strengthening the performance of financial and banking systems, together with streamlining risk management mechanisms, in the context of public-private coordination, are critical ingredients for managing vulnerabilities and turning them into potential opportunities (Oh & Park, 2021). The impact of banking risks on bank performance is not always reflected directly and immediately. The diversity of risk categories, the emergence of new threats, as well as the amplification of existing ones makes the relationship between risk and returns a subject of concern for all stakeholders.
This article proposes a multidimensional perspective to identify and quantify the macroeconomic factors that impact bank profitability as well as the interdependencies among these factors for the three global players: the USA, the European Union, and China. Thus, a Panel Autoregressive Vector and quantile regression are used to identify the influence of risk factors on bank profitability factors and the relationships between these factors. The factors considered are divided into two categories: factors specific to bank profitability: return on assets, cost-to-income ratio, net interest margin, and factors associated with risk: non-performing loans, exchange rate volatility, and volume of syndicated loans. As a novelty, the research is conducted for 30 countries globally, representing 63% of the global GDP in 2021, according to Table A1, presented in Annex 1. The results of the research confirm that bank profitability is impacted by the degree of bank health, in which deteriorating bank health negatively affects profitability and slows economic growth, (Plosser & Santos, 2018). Also in syndicated loans, banks with low capital levels negatively impact the riskiness of the participation ratio in syndicated loans.
The research is structured in 5 parts. Section 2 provides an overview of the most important as well as the most recent studies on bank syndication. Section 3 presents the research methodology and Section 4 highlights the estimation of models utilized, the tests performed for each model and the relationships between variables. Section 5 presents the discussions based on the results obtained from the model-specific tests, as well as the economic implications of the relationships between variables. Section 6 highlights the authors’ conclusions and the implications of the results for policymakers.
2 Theoretical Background
Structuring funding in the form of bank syndications is a complex process involving several lending institutions with different governance systems, separate risk departments, different sector exposures, and a variety of financial resources attracted. They need to be harmonized to finance a project or a borrower, to share the risks and the related revenues. Alongside the technical banking component, harmonizing interests is a sensitive process, particularly in an unfavorable economic context, materialized in a single credit agreement, signed by all participating institutions.
The reputation of the main arrangers is essential to overcome problems of information asymmetry. In particular (Chaudhry & Kleimeier, 2015), the moral hazard problem resulting from information asymmetries between borrowers and syndicates can only be mitigated by the most reputable arrangers. When arrangers have an informational advantage over participants, both moral hazard and adverse selection problems arise. Here, adverse selection problems arise only in the case of loans to opaque borrowers, where participants expect arrangers to behave opportunistically. Only the most reputable arrangers can mitigate this adverse selection problem.
The purpose of syndicated financing is diverse, ranging from the acquisition of companies to investment projects, refinancing and restructuring of financial debt, and providing blended funding, working capital, or financial support for investments.
The increased volume of riskier syndicated loans is ceded by banks to financial intermediaries, thereby transferring credit risk to other parts of the financial system, (Aramonte et al., 2022; Basten & Mariathasan, 2018; Heider et al., 2019). All of the studies by the authors mentioned above emphasize shorter and different periods for their surveys and their analysis is/are focused on a single country or a small number of countries.
The impact of the epidemic, which spread swiftly through travel and transportation channels, has been exacerbated by the interconnection of the world economy (International Labour Organization, 2020). Global supply chains (GSCs), which connected production in several places throughout the world, and international trade have both been directly impacted by the pandemic. GSCs frequently use just-in-time production methods, which reduce inventory and only make things when needed, and they also rely on specialized suppliers, sometimes concentrated in particular areas.
As a result, coronavirus disease 2019 COVID-19-related production disruptions that started in one place have spread throughout supply chain networks, affecting both intra- and inter-industry globally. The implementation of worldwide lockdown measures has caused supply-side constraints to swiftly turn into demand-side problems. As a result, COVID-19 has had an impact on the economy and society at every level of supply chains, from those that extract raw materials to those that assemble, and finally, distribution and sales.
The interbank market’s network structure is also formed by the syndicated loan market, demonstrating that bank-to-bank connections constitute a crucial means of financial institution contagion.
Large financial institutions play a major role in the highly interconnected networks of the world’s most powerful economies. These networks then interact with numerous small and medium-sized financial institutions through deposit markets, insurance, derivatives, and syndicated loan markets.
As a result, this entire network of connections is known as the core-periphery link, and it serves two purposes: first, it can lead to systemic instability by concentrating the majority of the resources of systemically important banks, leaving the rest of the financial banking system susceptible to failure; second, it can help mitigate mild shocks.
Banks have the option to make investments in hazardous or conservative assets, and they are funded by deposits or by mutual loans on the interbank market. Therefore, when financial crises strike and banks have a lot of investments in risky assets, they must sell these assets quickly and at a low price. If a bank’s portfolio is primarily composed of risky assets, this can result in significant losses for the bank and possibly bankruptcies.
In this case, the core-periphery structure of interbank markets supports equilibrium risk-taking through incentives for banks to take high levels of risk together.
In financial markets, the division of risk between systemically important banks and non-systemically important banks forms a network called the core periphery. Systemically important banks are thus in equilibrium during financial crises, because they are the only ones that can issue liabilities that can maintain their value, as these are implicitly guaranteed by governments.
EU banks have inherited cumbersome and costly branch structures created as part of the pre-global financial crisis expansion cycle, (Altavilla et al., 2018; 2021). Due to institutional and regulatory features (Miricescu, 2015; Miricescu et al., 2016), the sector has proven unable to generate a healthy and systematic flow of bank consolidations and exits. The research of these authors emphasizes a more limited perspective of the study, being concentrated at the level of a single bank, or a small group of countries, over shorter periods and using regressions based on a conditional analysis of the dependent variable. Thus, for better precision of the results obtained, aggregate-level estimates on groups of countries or a larger number of banks are needed.
Consequently, fewer banks in the EU were resolved or liquidated than in the United States following the financial crisis. The European banking sector remained much more fragmented than in the United States.
In the resolution of bad loans at the European level, the legal infrastructure played an important role, (Angelini et al., 2017; Granja & Leuz, 2020; Kasinger et al., 2021; Suarez & Sànchez-Serrano, 2021). These studies have either a theoretical approach that is not based on econometric analysis or present limitations because the estimates are short-term and do not reflect the long-term impact of NPLs on the financial system or do not reflect whether the COVID-19 pandemic has led to increased risks of NPL levels, compared to previous crises.
European banks rarely rely on external liquidations or sales of NPLs, amid substantial legal obstacles. In the case of US banks, these mechanisms are predominantly used.
Strong financial sectors can enhance capital allocation, better mobilize savings into profitable investments, and promote economic stability (Aller et al., 2015; Sperlich & Sperlich, 2014). From the standpoint of the relationship between risk and profitability, the aforementioned writers’ research uses different variables and shows distinct groupings of countries. They also carry out essential tasks for trade, like lending money to businesses (which promotes expansion and commerce) and investing in infrastructure (which facilitates the operation of energy, transportation, and communication networks).
Centrally positioned banks in syndicated loan networks have more access to information and sway over the syndicated loan market (Oh and Park, 2021). In terms of loan portfolio diversity, banks with greater network centrality are more inclined to seek diversification, and during times of market volatility, this diversification is more likely to grow. Additionally, the returns of banks with high centrality are higher than those of banks with low centrality. Since a bank’s network centrality is crucial to its loan portfolio strategy, credit market participants also find this centrality to be relevant. Diversification and centrality thus showed a negative association in the core group, but a positive correlation in the periphery group, suggesting that a bank’s success in a syndicated loan hierarchy is correlated with its position in the hierarchy. The study is restricted to the US market and does not emphasize the connection between lending processes and bank performance.
In the market for syndicated loans, banks spread out the risks among the other banks involved in the syndication, but as institutions get more alike, the financial sector’s variety is also diminished (Cai et al., 2018). This study’s shortcomings include its exclusive emphasis on the US market and its restriction to two banks.
Diversifying risk and so improving the granularity of a lender’s loan portfolio are the main reasons for syndicating loans in the current market (Dentons, 2023; Goodman et al., 2023). Leveraging income and lowering capital weight while fostering and preserving customer connections are additional factors for lenders who offer loan participation. Lenders who buy loan participations are encouraged to join a syndicate group in order to gain access to the experience and transaction flow of seasoned lenders. US lenders and foreign lenders from nations like Germany, France, Canada, and England make up the bulk of important participants in loan syndication in the United States. They act as both agency and participant lenders. In contrast to our analysis, which is based on an economic model and includes 30 nations, the study lacks an econometric model and is restricted to the US market.
Syndicated term loans make up a significant portion of the U.S. capital markets, with over $500 billion in outstanding loans (Payden & Rygel, 2013). This asset class serves as a link between the public and private debt markets and is an alternative to conventional fixed-rate high-yield bonds. Syndicated term loan financing has expanded access to capital markets for numerous firms worldwide by fulfilling this function. In contrast to many other conventional fixed-income investment categories, syndicated loans have shown themselves to be a desirable asset class with low correlations to other assets, moderate return volatility, and an alluring risk/return profile. Compared to the model employed in our article, the study’s weaknesses stem from the fact that it is not based on a complete econometric model.
Lead banks are able to recognize economically substantial loan origination fees through syndicated lending. Therefore, by starting more loans and/or collecting greater front-end costs, syndicated lending gives banks the chance to increase reported earnings (Ertan, 2022). Given the size of a syndicated loan arrangement, syndicated lending is also associated with the bank’s top management and is impacted by executive incentives that impact company financial reporting goals. As a result, syndicated lending offers the chance to increase profits in order to satisfy market demands and fund manager pay. The study concludes that syndicated lending has the ability to increase earnings, which is consistent with our study findings, despite the drawbacks of just focusing on the US market.
According to the literature study, the empirical models employed contained the following factors in order to analyze the relationship between profitability and risk: return on assets, non-performing loans, interest rate, currency rate, and volume of syndicated loans.
The pertinent gaps and limitations identified in the associated literature are addressed in our work.
3 Research Methodology
The research is based on data extracted from 30 countries, covering a span of 12 years, from 2008 to 2020. The sample of countries is significant, being selected from the European Union, the UK, the USA, and China.
In conducting this research, the necessary information has been extracted from the World Bank and The Global Economy financial reports, for each country included in the study (The Global Economy, 2023; World Bank, 2023a, b). The selection was based on specific countries because they played and continue to play a significant role in the world economy, from an economic perspective, registering an overall GDP of around 63% at the end of 2020.
In this sense, for each banking system of the selected countries data series with an annual frequency have been collected: return on assets; syndicated loans; non-performing loans; exchange rate and interest rate.
To identify the optimal analysis methodology, the characteristics of all the variables included in the model were evaluated. The estimation of the regression model involved the testing of specific hypotheses and the validation of the specific characteristics of the data series. To obtain economically and statistically relevant results we have chosen to analyze the effects on the dependent variable return on assets.
The methodology used had 390 observations. The hypotheses proposed in the study were verified using the Eviews 14 program and the panel data methodology.
In selecting the chosen countries, we aimed to obtain a comparable level of data for the sample of countries, at the global level - Western Europe, Eastern Europe, the UK, the USA, and China. Within the selected sample of countries, there are included strong banking systems such as the USA, China, Germany, Germany, France, England, Spain, and Italy.
Considering the gaps mentioned in previous studies, our research covers the entire period 2008–2020, starting from the global financial crisis, followed by the sovereign debt crisis, the zero interest rate periods, and followed as well by the beginning of the COVID-19 pandemic. It represents a unique and dynamic period with strong challenges and changes in the international financial sector. Thus, the study aims to highlight whether bank syndications contribute to the increase in bank performance or to the diversification of risks given the evolution of the relationships between the variables used.
The fundamental question of this research, as a starting point: Can bank syndications have a contribution to increasing the bank’s performance or to diversifying risks?
Five variables were selected and included in the research, as shown in Table 1.
Unit root test results
| ADF FISHER unit root test | ||
|---|---|---|
| Variable | Statistic | Prob. |
| D(L2ROA) | 132.938 | 0.0000 |
| D(L2SL) | 152.117 | 0.0000 |
| D(L2RIR) | 168.988 | 0.0000 |
| L2EXR | 182.333 | 0.0000 |
| L2NPL | 122.043 | 0.0000 |
Source: author’s own calculations.
To highlight the intercorrelations between the indicators used, two hypotheses were formulated:
H1: Can syndicated loans contribute to the diversification of risks between parties implied in the syndication or they can increase the bank’s profitability or both?
H2: The relationship between syndicated loans and bank profitability is influenced by other macroeconomic variables or not?
To identify the impact of the macroeconomic indicators used on the dependent variable Return on Assets (ROA), as well as the relationships between the variables used in the short, medium, and long run, the panel data regression, the vector autoregressive distributed lag model ARDL and quantile regression were used.
Considering that previous related studies use regression models based on conditional mean analysis of the dependent variable, our research uses quantile regression. This type of regression allows modeling the quantities of the dependent variable (Return On Assets), providing estimates of the linear relationship between a given quantity of the dependent variable and the independent variables used.
The VECM model allows us to understand the interdependencies between the variables used, at different points in time, both in the short run and especially in the long run, for variables that are cointegrated.
Since some of the variables were stationary at the I(0) level the rest became stationary by applying the first difference I(1). To be able to highlight the impact both in the short and long run, we used the PMG ARDL model. Also in addition to the PMG ARDL model, we used quantile regression to provide robustness to the results obtained and to capture more precisely the impact of each independent variable on some of the quantiles of the dependent variable.
The research contributes to the literature by identifying the interdependencies and propagation of short-, medium-, and long-term shocks between bank performance indicators that can be assimilated into risk management.
Given the fact that all variables used for this research are stationary at level I(0) or becoming stationary at level I(1) of the process, subsequently, then we resort to panel autoregressive distributed lag (ARDL) proposed by Pesaran et al. (1999). The benefit and the superiority of the panel ARDL model are that it can be applied regardless of whether the selected variables in the model are purely I(0) or purely I(1) or partly integrated.
Starting with the ARDL model general form:
where
Adapting our model ARDL (2,2,2,2,2), to (Chu & Sek, 2014) model, it reflects:
constant term;
Based on the ARDL (2,2,2,2,2) model, we can calculate the long-run coefficient.
If the ARDL is as follows the general formula:
where
PMG Estimator
The unrestricted specification, for the ARDL system of equations for our 12-year analysis period, was: t = 1, 2, …, 12, time periods and i = 1, …, 30 countries for the dependent variable Y is:
where X
i,t–j
is the (k × 1) vector of explanatory variables for group i and
The PMG restriction is that the elements of
In PMG, all of the dynamics and ECM terms are free to change. For both stationary and non-stationary regressors, the parameter estimates of the PMG model are asymptotically normal and consistent under certain regularity assumptions. The PMG estimations necessitate choosing the right lag length for the variables that have been chosen. The Akaike Information Criterion (AIC) and the Schwarz Bayesian Criterion (SBC) are used to make the choice.
3.1 Quantile Regression Model
One method for examining shifts in distributions and calculating the impact of an independent variable on a result is quantile regression, which yields estimates of these impacts at various y-distribution points, such the 5th, 25th, 95th, and so on. Hence, quantile regression enables us to comprehend how an independent variable influences not only the average but also the full range of an outcome.
The quantile regression model equation for the τth quantile is:
This indicates that the beta coefficients are now functions that depend on the quantile rather than constants. With the exception of lowering the median absolute deviation, the procedure for determining the values for these betas at a specific quantile value is nearly identical to that for standard linear quantization.
The check function, ρ, assigns unequal weights to the error based on the quantile and the error’s overall sign. In mathematics, ρ looks like this:
In this instance, the max function yields the biggest value enclosed in parenthesis, and u represents the error of a single data point. Accordingly, the check function multiplies the error by τ if it is positive and by (1 − τ) if it is negative.
Estimation of all models was done using Eviews 14.
4 Model Estimation and Relationships Between Variables
4.1 Database Description
The Return on Assets (ROA), the dependent variable utilized in the two empirical models, compares a company’s profit (net income) with the amount of assets invested in order to determine its financial standing. A percentage is used to represent this ratio. In the models, the variable is called “ROA.”
The independent variables in the models are as follows:
The ratio of new syndicated borrowing volume by private enterprises in sectors other than banking, holding corporations, and insurance to GDP is known as SYNDICATED_LOAN_VOLUME (SL). Percentages are used to express this ratio.
The quantity of local currency units that can be exchanged for one US dollar is known as the exchange rate (ER). Additionally, percentages are used to describe this ratio.
NON-PERFORMING LOANS (NPL): The ratio of bank non-performing loans to total gross loans is calculated by dividing the whole loan portfolio value (including nonperforming loans before the deduction of certain loan-loss provisions) by the value of nonperforming loans. Percentages are used to express it.
When a bank or other financial institution charges interest to borrowers when they borrow money, or when borrowers pay interest to the bank when they hold money in an account, the interest rate (L2RIR) is the percentage.
In this analysis, we started from the premise of whether syndicated loans contribute to the increase of bank performance, to the diversification of risks or to both. In this context, the variables chosen and used in the research provide the most complete picture of the relationship between profitability, risks, and syndicated loans. Because the relationship between profitability and risks is a complex one, the variables used include, in addition to the relationship between profitability and syndicated loans, a series of risks that affect bank profitability, these being the macroeconomic variable NPL together with two other variables associated with market risk - exchange rate and interest rate. The return on assets (ROA) ratio is commonly used as a means of analyzing bank profitability because cash flow analysis is difficult to construct accurately and this ratio is considered to be a very important profitability ratio because it indicates the profit per dollar earned by a bank from its assets.
The liaison and interconnections between the five selected indicators offer both a tactical and strategic dimension, representing the best and most integrated perspective regarding profitability and risk. The indicators strongly influence the decisions at the bank’s level, as well as at the systemic level, at the macro level.
The sample of countries for the empirical study has relevant geopolitical, economic and financial representation, being specific to the three global players, the US, Europe and China. Along with the US and China, the countries included in the analysis, related to the European continent: Austria, Belgium, Bulgaria, Croatia, Republic of Cyprus, Czech Republic, Denmark, Estonia, Finland, France, Germany, Greece, Hungary, Ireland, Italy, Latvia, Lithuania, Luxembourg, Malta, Netherlands, Poland, Portugal, Romania, Slovakia, Slovenia, Spain, Sweden, United Kingdom.
4.2 Justification of Models Utilized in the Estimation
Following unit root tests, it can be noticed that the variables Return on assets, Syndicated loans, Non-performing loans, Exchange rate, and Interest rate are not all integrated of order I(0). As a consequence we applied the first difference, for the variables: return on assets, syndicated loans, and interest rate, and all of them become stationary of order I(1). This result can be seen in Table 1.
From Table 1 we can notice that the variables (return on assets, syndicated loans, and interest rate) have become stationary after applying the first difference and having the p-value less than 5%. The variables exchange rate and non-performing loans were stationary without applying the first difference, having the p-value less than 5% from the start. The conclusion from this table is that all variables are stationary.
Also according to the descriptive statistics for variables, from Table 2, for all variables Jarque–Bera probability is higher than 5% meaning that all variables are normally distributed.
Variables descriptive statistics results
| D(L2ROA) | D(L2SL) | L2NPL | L2EXR | D(L2RIR) | |
|---|---|---|---|---|---|
| Mean | 1.18357 | 1.397981 | 0.64035 | 0.456221 | 0.523699 |
| Median | 1.159289 | 1.419204 | 0.642886 | 0.46536 | 0.521138 |
| Maximum | 2.120188 | 2.340535 | 1.678953 | 1.260122 | 1.35215 |
| Minimum | 0.162962 | 0.307866 | −0.83687 | −0.42684 | −0.05284 |
| Std. Dev. | 0.395276 | 0.374847 | 0.45385 | 0.285551 | 0.257365 |
| Skewness | 0.005573 | −0.11774 | −0.24671 | −0.10421 | 0.119405 |
| Kurtosis | 2.471118 | 2.500984 | 3.053983 | 3.063437 | 2.59526 |
| Jarque-Bera | 3.847803 | 4.186441 | 3.387579 | 0.652639 | 3.036617 |
| Probability | 0.146036 | 0.123289 | 0.183822 | 0.721575 | 0.219082 |
| Sum | 390.5781 | 461.3336 | 211.3155 | 150.5528 | 172.8205 |
| Sum Sq. | 513.6805 | 691.1632 | 203.0832 | 95.51169 | 112.2977 |
| Sum Sq. Dev. | 51.40397 | 46.22777 | 67.76733 | 26.82643 | 21.79183 |
Source: author’s own calculations.
To be able to measure the risk we also included in this model two market risk variables: exchange rate and interest rate. Taking into account that according to the five analysis criteria, three of them (LR, Final Prediction Error – FPE, and AIC Akaike information criterion) indicate that the optimal number of lags is lag no. 2, results are presented in Table 3.
Lag order selection criteria results
| Lag order selection criteria | |||||||
|---|---|---|---|---|---|---|---|
| Variables: D(ROA) D(SL) EXR NPL D(RIR) | |||||||
| Lag | LogL | LR | FPE | AIC | SC | HQ | |
| 0 | Observations: 330 | −575.355 | NA | 2.32 × 10⁻⁵ | 3.517301 | 3.574863 | 3.540261 |
| 1 | 448.9796 | 2011.42 | 5.43 × 10⁻⁸ | −2.53927 | −2.193898* | −2.401506* | |
| 2 | 483.2852 | 66.32426* | 5.13 × 10⁻⁸* | −2.595668* | −1.962486 | −2.343101 | |
| Observations: 330 | |||||||
* = the right number of lags which must be selected according to our variables used and the number of years analyzed. Source: author’s own calculations.
Based on the ADF Fisher Unit Root Test, Variable Descriptive Statistics, and Lag Order Selection Criteria results, we put the variables into a regression model and the results are presented in Table 4.
Panel least squares regression model results
| Dependent variable: D(l2ROA) | ||||
|---|---|---|---|---|
| Method: Panel least squares | ||||
| Variable | Coefficient | Std. error | t-Statistic | Prob. |
| D(L2SL) | 0.066451 | 0.039391 | 1.686951 | 0.00000 |
| L2NPL | −0.013702 | 0.032471 | −0.42198 | 0.0000 |
| D(L2RIR) | 0.124041 | 0.05834 | 2.12617 | 0.0342 |
| L2EXR | −0.009985 | 0.049382 | −0.20221 | 0.0000 |
| C | 0.165385 | 0.083495 | 1.980772 | 0.0485 |
| Observations | 330 | |||
| R-squared | 0.570646 | Mean dependent var | 1.177703 | |
| Adjusted R-squared | 0.56402 | S.D. dependent var | 0.386927 | |
| S.E. of regression | 0.255483 | Akaike info criterion | 0.126692 | |
| Sum squared resid | 21.14798 | Schwarz criterion | 0.195767 | |
| Log likelihood | −14.90424 | Hannan–Quinn criter. | 0.154245 | |
| F-statistic | 86.12427 | Durbin–Watson stat | 0.612897 | |
| Prob(F-statistic) | 0.00000 | |||
Source: author’s own calculations.
As can be seen from the regression model, all variables are significant with a p-value less than 5%. Thus at a 1% increase in NPL volume, we can notice a 0.014% decrease in Return on Assets. This means that when a bank cannot recover its non-performing loans, it has the option to recover the assets pledged as collateral or sell the loans to collection agencies. However, if there are too many non-performing loans on a bank’s balance sheet, it means that the bank is facing cash flow problems because it is no longer earning income from lending.
About syndicated loans, we can observe that when the volume of syndicated loans increases by 1%, the Return on Assets increases by 0.07%, meaning that the level of income collected by the participating banks increases as a result of the interest rates, fees, and commissions charged on the loan and the syndication process.
Regarding the interest rate, the regression model reflects that for a 1% increase in interest rate, the return on assets increases by 0.124%, meaning that a higher interest rate will increase banks’ earnings.
For a 1% increase in exchange rate, the return on assets decreases by 0.01. A declining exchange rate decreases the purchasing power of income and capital gains derived from any returns and foreign exchange volatility also harms the return on banks’ assets.
Also about this regression model we can observe that according to R-squared, 57% of the variability observed in the return on assets variable is explained by the regression model. According to the F-statistic which is 86.12%, it proves that the regression model is effective in its explanation of the variation in the return on assets dependent variable and vice versa.
Based on the results from the regression model in Table 4, we can use the Autoregressive distributed lag (ARDL) model because all variables have become stationary and it allows us to estimate both short-run and long-run relationships between the profitability and risk variables included in this model, (Table 4). To be able to measure the risk we also included in this model two market risk variables: exchange rate and interest rate.
To be able to explain the relationships between variables other than the mean of the data, we used quantile regression to be able to understand results that are not normally distributed and whose relationships with the predictor variables are non-linear.
We tested also using the two-stage least square model and obtained similar results with Panel Least Squares regression, in Table 4. In the 2 SLS test, as instrumental variables, we used the lags of the independent variables because they are not correlated with the errors in the present, being exogenous variables. We can notice from these results that are similar results and variable signs with the Panel Least Squares model, (Annex 2 – Table A2).
We can also note that the equation is valid and the variables used are significant as in the Panel Least Squares regression with a probability below the 5% threshold, and the R-squared value of this model is 99.65% above the 50% threshold.
Regarding the endogeneity we used the Hausman test, (Annex 2 – Table A3) which indicated that the probability obtained is 99.97%, being above the 5% threshold that the Panel Least Squares regression is efficient and this is also supported by the heteroskedasticity test, (Annex 2 – Table A4) for both Panel Least Squares regression and 2SLS which indicated that the Panel Least Squares model should be chosen because it does not present heteroskedasticity with a probability of 44.83%.
The cointegration test was used to identify the significance of variables in the short and long term and at the level presented in Table 5. All variables are statistically insignificant in the short run and become statistically significant in the long run.
Autoregressive distributed lag (ARDL) cointegration test results
| Dependent variable: D(L2ROA) | ||||
|---|---|---|---|---|
| Method: ARDL | ||||
| Variable | Coefficient | Std. error | t-Statistic | Prob. |
| Long-run (pooled) coefficients | ||||
| L2SL | 1.427405 | 0.000575 | 2484.446 | 0.0000 |
| L2NPL | 0.17903 | 0.000349 | 512.7505 | 0.0000 |
| L2EXR | 0.783078 | 0.000117 | 6675.762 | 0.0000 |
| L2RIR | −1.189242 | 0.000564 | −2107.18 | 0.0000 |
| Short-run (mean-group) coefficients | ||||
| COINTEQ | −0.166588 | 0.055886 | −2.98087 | 0.0031 |
| D(L2ROA(−1)) | 0.222397 | 0.08611 | 2.582723 | 0.0102 |
| D(L2SL) | 0.446696 | 0.20091 | 2.223362 | 0.0268 |
| D(L2SL(−1)) | −0.619108 | 0.234418 | −2.64104 | 0.0086 |
| D(L2NPL) | −0.366554 | 0.219945 | −1.66657 | 0.0964 |
| D(L2NPL(−1)) | 0.108659 | 0.171104 | 0.635044 | 0.5258 |
| D(L2EXR) | 0.134596 | 0.109263 | 1.231852 | 0.2187 |
| D(L2EXR(−1)) | −0.054726 | 0.090387 | −0.60546 | 0.5452 |
| D(L2RIR) | 0.004301 | 0.029916 | 0.143762 | 0.8858 |
| D(L2RIR(−1)) | −0.083385 | 0.029228 | −2.85294 | 0.0046 |
| C | −0.045802 | 0.016112 | −2.84279 | 0.0047 |
| Selected model: PMG (2,2,2,2,2) | ||||
Source: author’s own calculations.
Taking into account the optimal number of lags and the fact that this number of lags is valid for each of the five selected variables, the ARDL model will display ARDL (2,2,2,2,2), agreeing with the optimal number of lags selected for each of the five variables used.
Analyzing the evolution of the variables in the long term, we can highlight that all variables become statistically significant, registering p-values below the 5% significance. For a 1% increase in the volume of syndicated loans, the return on assets has increased by 1.43%, meaning that syndicated loans increase banks’ profitability for banks implied in the syndication process due to the interest rate, fees, and commissions charged on the loan and for the syndication process.
For a 1% increase in the exchange rate, the return on assets has increased by 0.78%, meaning that banks that have more foreign currency assets than foreign currency liabilities are likely to face a positive impact on their net worth income in the event of foreign currency appreciation.
For the same 1% increase in the volume of non-performing loans, the return on assets has increased by 0.179%, meaning that not all non-performing loans are bad loans till the end, and reducing the number of non-performing loans has a positive impact and increases the bank profitability.
For the 1% increase in interest rate, the return on assets decreases by 1.19% meaning that in the long run banks’ income will decrease because have invested besides loans, in bonds and other debt securities which lose value when the interest rate has increased.
Regarding the relationship between the variables, considering that some of the variables were stationary from the beginning I(0) and others became stationary after applying the first difference I(1), we applied the Kao cointegration test (Table 6) to check the long-run relationships between the variables.
Kao cointegration test results
| Kao residual cointegration test | ||
|---|---|---|
| Series: D(L2ROA) D(L2SL) L2NPL L2EXR D(L2RIR) | ||
| t-statistic | Prob. | |
| ADF | −5.2382 | 0.0000 |
| Residual variance | 0.027898 | |
| HAC variance | 0.030019 | |
Source: author’s own calculations.
According to Table 6, we can observe that the p-value for the Kao Cointegration Test is less than 5% meaning the variables are cointegrated and there are long-run relationships between variables.
Also in addition to see the relationships between the variables involved in the study and how they influence each one in the medium and long term, we used the Granger causality pairs test in Table 7.
Pairwise granger causality tests results
| Pairwise Granger causality tests | |||
|---|---|---|---|
| Null hypothesis | Obs | F-statistic | Prob. |
| D(L2SL) GC D(L2ROA) | 270 | 0.3344 | 0.7161 |
| D(L2ROA) GC D(L2SL) | 1.67856 | 0.1886 | |
| L2NPL (GC) D(L2ROA) | 270 | 0.04663 | 0.0045 |
| D(L2ROA) GC L2NPL | 0.93087 | 0.3955 | |
| L2EXR (GC) D(L2ROA) | 270 | 1.31124 | 0.0012 |
| D(L2ROA) GC L2EXR | 1.14273 | 0.3205 | |
| D(L2RIR) (GC) D(L2ROA) | 270 | 3.40497 | 0.0347 |
| D(L2ROA) GC D(L2RIR) | 1.54852 | 0.2145 | |
| L2NPL GC D(L2SL) | 270 | 0.57075 | 0.5658 |
| D(L2SL) GC L2NPL | 1.39244 | 0.2503 | |
| L2EXR (GC) D(L2SL) | 270 | 0.26602 | 0.0166 |
| D(L2SL) GC L2EXR | 0.8308 | 0.4368 | |
| D(L2RIR) (GC) D(L2SL) | 270 | 0.14835 | 0.0001 |
| D(L2SL) GC D(L2RIR) | 1.23227 | 0.2933 | |
| L2EXR GC L2NPL | 270 | 0.09491 | 0.9095 |
| L2NPL GC L2EXR | 0.83091 | 0.4368 | |
| D(L2RIR) (GC) L2NPL | 270 | 9.10152 | 0.0002 |
| L2NPL (GC) D(L2RIR) | 0.17444 | 0.0021 | |
| D(L2RIR) (GC) L2EXR | 270 | 0.53383 | 0.0470 |
| L2EXR GC D(L2RIR) | 0.64526 | 0.5253 | |
Source: author’s own calculations.
Variables with p-values less than 5% have an impact on the other variables, according to Table 7, and the linkages between the variables. By affecting the demand for foreign currency, the interest rate affects the exchange rate. Therefore, a higher interest rate will draw in international investors and raise demand and value, all of which will help the exchange rate rise.
There is also a two-way association between interest rates and the amount of non-performing loans, with p-values less than 5%. It implies that the number of non-performing loans may rise as a result of increased interest rates, company failures, or individual financial difficulties. It also illustrates how rising non-performing loan volumes are driving up bank loan interest rates, which hurts bank profitability and raises inflation expenses.
Interest rates and syndicated loans are related in that a high interest rate will make borrowing more expensive, which means the borrower will pay more over the course of the loan, raising the monthly rate.
Exchange rates and syndicated loans have an indirect relationship, which means that interest rates affect currency demand, which in turn affects foreign exchange. High interest rates draw in foreign investors, which raises the demand for and value of the currency. This, in turn, raises exchange rates; conversely, low interest rates cause the relative worth of the currency to fall.
The interest rate and return on assets have a direct relationship, meaning that when long-term rates rise more quickly than short-term rates, the return on loans rises as well, ultimately increasing profitability.
Exchange rate shocks can impact banks’ lending ability if they have significant foreign currency exposures on their balance sheets, which is consistent with the idea that exchange rates and return on assets are related (Agarwal, 2018). In the event that the domestic currency depreciates, a bank that has more foreign currency-denominated liabilities than foreign currency-denominated assets could experience negative shocks to its net worth and be forced to make loans. Additionally, in the event of foreign currency appreciation, banks with a higher proportion of foreign currency-denominated assets than foreign currency-denominated liabilities are likely to see an increase in profitability and a beneficial impact on their net income.
The fact that banks primarily make money from the interest they charge on loans highlights the relationship between non-performing loans and return on bank assets. If they are unable to collect the interest owed on non-performing loans and the number of non-performing loans is high, they will have less money available to make new loans and cover operating expenses, which will result in lower loan income and, ultimately, lower profitability.
The interest rate, fees, and commissions for banks that are implied in the syndication process, as well as other variables used in this study like the exchange rate, interest rate, and the amount of non-performing loans, all have an impact on the direct relationship between syndicated loans and return on assets for banks.
Beyond that, we used for market risk two variables to measure this risk: the interest rate and the exchange rate. To highlight the risk implied by syndicated loans in Figure 1, we can notice that the standard deviation for this variable represents the statistical measure of the volatility market of syndicated loans in our case. According to this fact, standard deviation for the syndicated loans variable has a low value being 0.375 meaning that this variable has low volatility, being less riskier. This fact implies that in syndicated loans, the risks are distributed among the banks involved in the syndication process regardless of whether they are from the same country or different geographical regions.
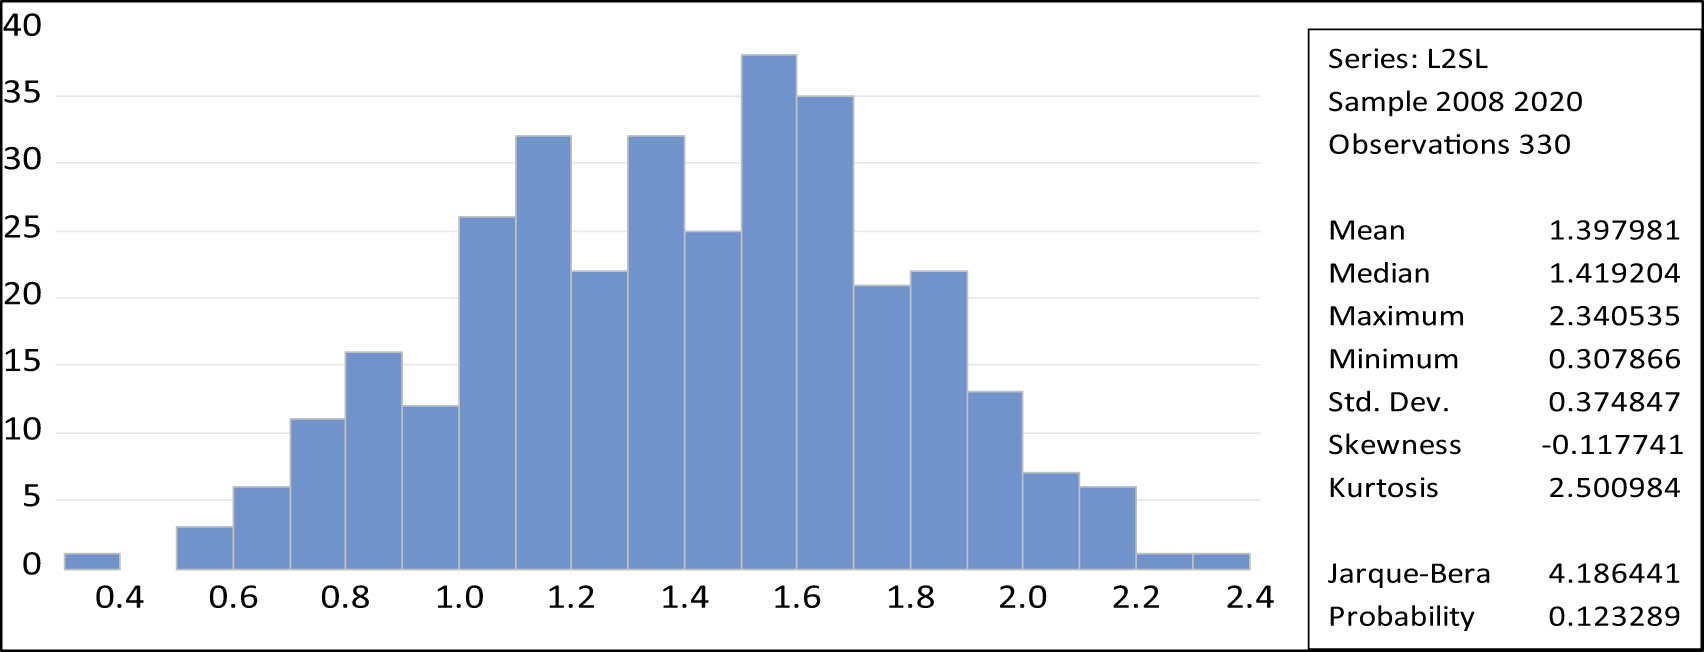
Standard deviation for syndicated loans. Source: author’s own calculations.
In addition to having a comprehensive image of the effects of the independent variables on the dependent variable and supporting the results based on the ARDL model, we also used the quantile regression model (Figure 2).
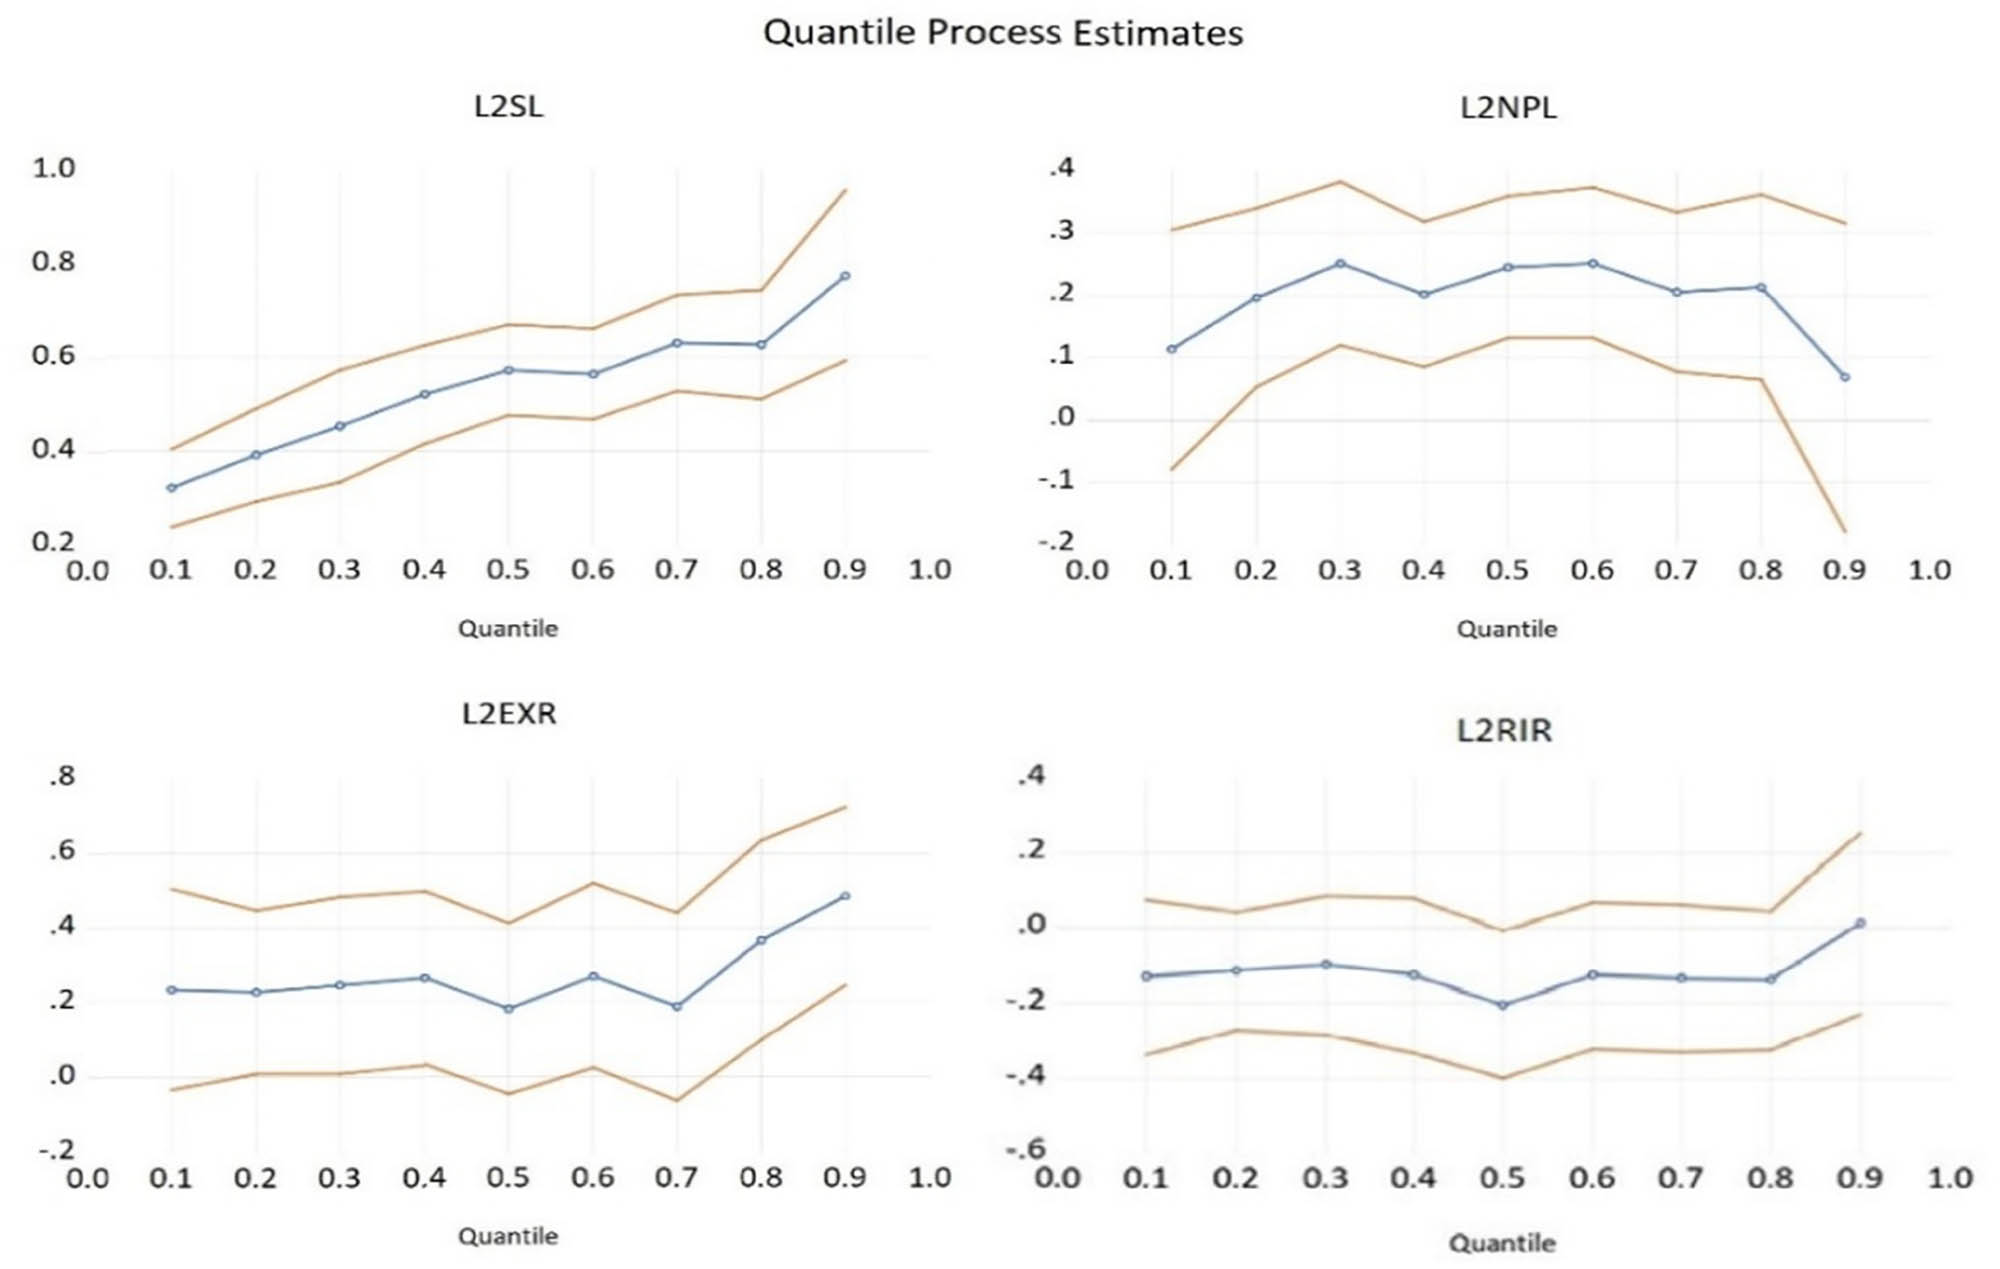
Quantile regression process estimates results. Source: author’s own calculations.
According to Figure 2, we can observe that syndicated loans have a positive and upward trend on the return on assets dependent variable starting from the 10th quantile with 0.32% to the 90th quantile becoming 077%, this evolution is also influenced by other variables used in this research.
The trend of the level of NPL is upward and also downward starting from the 10th quantile from 0.11% to the 30th quantile, being 0.25%. From the 40th quantile decreases to 0.20%. From the 50th quantile, the trend will go up from 0.24% to the 60th quantile becoming 0.25%, and decrease again to 0.20% in the 70th quantile, increase again to the 80th quantile becoming 0.21%, and again decrease to 0.06% in the 90th quantile. This evolution means that when the level of NPL is high banks will have less money available to originate new loans and pay operating costs, and this will lead to lower loan income and hence lower banks’ profitability. Also reducing the level of NPL has positive effects on banks’ income increasing profitability.
The impact of the exchange rate on dependent variable return on assets has upward and downward trends, starting from the 10th quantile with 0.24% becoming in the 50th quantile to 0.18%, and going up again to 0.49% in the 90th quantile. This evolution means that banks that have more foreign currency assets than foreign currency liabilities are likely to face a positive impact on their net worth income in the event of foreign currency appreciation, and in the event of depreciation banks with more foreign currency liabilities than foreign currency assets face a negative impact on their net worth income.
The impact of interest rate on dependent variable return on assets has upward and downward positive and negative trends, starting from the 10th quantile with −0.13% going down to the 50th quantile being −0.20% and going up to a positive and upward trend to the 90th quantile becoming 0.01%. This means that in periods when interest rates are low or negative in the medium or long term, this leads to a decrease in net interest income, leading to a decrease in net interest margins and, implicitly, to a decrease in bank profitability.
Based on these results obtained from the quantile regression model and from the Dynamic Panel Autoregressive Distributed Lag Stationarity model we did robustness tests to support the PMG ARDL model and quantile regression findings and these new results are presented in Tables 8 and 9.
Panel fully modified least squares (FMOLS) results
| Dependent variable: D(L2ROA) | ||||
|---|---|---|---|---|
| Method: Panel fully modified least squares (FMOLS) | ||||
| Variable | Coefficient | Std. error | t-statistic | Prob. |
| D(L2SL) | 0.486595 | 0.040215 | 12.0999 | 0.0000 |
| L2NPL | 0.332822 | 0.056586 | 5.881673 | 0.0000 |
| L2EXR | 0.158706 | 0.029945 | 5.299878 | 0.0000 |
| D(L2RIR) | −0.39886 | 0.056403 | 7.071615 | 0.0000 |
| R-squared | 0.691488 | Mean dependent var | 279.213 | |
| Adjusted R-squared | 0.687543 | S.D. dependent var | 239.74 | |
| S.E. of regression | 143.9196 | Sum squared resid | 5709625 | |
| Long-run variance | 1014.158 | |||
Source: author’s own calculations.
Panel dynamic least squares (DOLS) results
| Dependent variable: D(L2ROA) | ||||
|---|---|---|---|---|
| Method: Panel dynamic least squares (DOLS) | ||||
| Variable | Coefficient | Std. error | t-statistic | Prob. |
| D(L2SL) | 0.386595 | 0.040215 | 9.08117 | 0.0000 |
| L2NPL | 0.232822 | 0.056586 | 4.371594 | 0.0000 |
| L2EXR | 0.108706 | 0.029945 | 4.294258 | 0.0000 |
| D(L2RIR) | −0.297152 | 0.056403 | 6.071615 | 0.0000 |
| R-squared | 0.593128 | Mean dependent var | 288.7381 | |
| Adjusted R-squared | 0.324475 | S.D. dependent var | 266.7498 | |
| S.E. of regression | 224.7246 | Sum squared resid | 5663527 | |
| Long-run variance | 7029.6772 | |||
Source: author’s own calculations.
From Table 8, we can observe that the results support findings from the ARDL model and quantile regression on the long rung having the p-value for all variables less than 5% meaning all variables are significantly statistical and also the R-squared is 69.15% higher than 50% meaning the model is good and robust. Speaking about the variables results obtained in Panel Fully Modified Least Squares (FMOLS) we see that they support also findings from the ARDL model and quantile regression. From the variables, we can see that when syndicated loans rise by 1%, the dependent variable returns on assets rise by 0.49%. For the rising with the same 1% of the level of non-performing loans, the return on assets variable is rising with 0.33%. Also, for the 1% increase of the exchange rate variable, the return on assets is rising with 0.16%. For the real interest variable we can observe that for a 1% increase, the return on assets is going down with 0.4% being in line with results from PMG ARDL model and quantile regression model.
Also, the results from Table 9 – Panel Dynamic Least Squares (DOLS) – support our findings obtained from the ARDL model and quantile regression model in the long run. All the variables registering have a p-value less than 5% and an R-squared being 59%, over 50%, which means the model is a robust one. The variables support the results from the ARDL model and the quantile regression model. From the variables coefficients it is reflected that when the syndicated loans rise by 1%, the return on assets variable rises by 0.39%. Also in the long run when the level of non-performing loans rises by 1%, the return on assets rises by 0.23%. For the 1% increase of the exchange rate variable, the return on assets rises by 10.87% and when the interest rate rises by 1% the return on assets goes down by 0.3%.
All these results are in line with findings from the ARDL model and quantile regression model.
We used FMOLS and DOLS as robustness tests, because the FMOLS estimation takes into account the perturbative parameters and possible autocorrelation and heteroscedasticity phenomena of the residuals. This estimation also corrects for the endogeneity of the explanatory variables. In addition, to ensure a double dose of robustness of the results, together with the FMOLS estimation we also used the DOLS estimation to remove the correlation between the regression and the error term.
The heterogeneity and persistence of the short-run dynamics can generate substantial variability in the point estimates of the single-equation cointegrating vector. Thus these estimators are quite sensitive to the investigated and limited period of the observations obtained, as well as to the particular case investigated. As a result of this, FMOLS estimation for panel regression offers the advantage of correcting for serial correlation and endogeneity biases of ROA and SL variables. The DOLS estimation also provides very precise estimates, and the results of this estimation show standard asymptotic distributions, which are the closest to the exact sampling distributions, corresponding to small sample sizes as observations.
5 Results and Discussions
Analyzing syndicated loans and the relationship between profitability and risk reflects that banks, globally, need to keep their costs under control to remain profitable and subsequently to be able to diversify the risks they take.
The main risks that can directly affect bank performance, reflected by the ROA indicator, are credit risk, liquidity risk, and capital risk.
First, credit risk affects the lending bank when the borrower is no longer financially able to fulfill the contractual obligations specified and negotiated in the credit agreement at the time the credit is granted. Thus, this type of risk becomes a major and costly one for every bank and pays a heavy price for the bank implied, through the borrower’s inability to repay it and its transformation into a non-performing loan. In addition, the more banks accumulate a higher volume of non-performing loans, this affects their ability to cope with major economic shocks and to be credible in the banking market when applying for interbank loans. Thus, this credit risk in the absence of a very well-developed risk management system can have catastrophic consequences in a bank facing these problems which together with the occurrence of unforeseen shocks can lead directly to the emergence of the bank and contaminate other banks in the system through interbank linkages.
Second, liquidity risk directly affects bank profitability when banks are unable to repay loans, which will reduce the volume of cash inflows. This in the event of external shocks that generate sudden and massive capital withdrawals by depositors, coupled with reduced cash inflows and the maintenance of high provisions to cover loan losses will affect the ability of banks to withstand different shocks.
In case of shocks, unhealthy banks easily go to bankruptcy as was the case in America in 2008 – when the global financial crisis led to the bankruptcy of some banks of systemic importance or the restructuring of others, and in 2023 the case of the bankruptcy of American banks: Silicon Valley Bank and Signature Bank.
Thus after the global financial crisis of 2008, banking regulators in many countries increased liquidity requirements in order not to face the bankruptcy of other systemically important banks, such as the US investment bank Lehman Brothers.
Capital risk is the risk that a bank does not have sufficient capital in the event of shocks to absorb the losses caused by these shocks and to protect its creditors against these losses. In the case of all banks, the level of capital held and subsequently increased helps to maintain the existing market share and to increase it, and in the event of shocks or financial crises, the higher the level of capital held, the better the banks can withstand the various shocks they go through.
The introduction of financial market reforms in the wake of the 2008–2009 global financial crisis also attempted to increase the capital requirements and regulatory capital holdings of financial institutions. Consequently, a number of moves into assets with reduced risk weights helped to support these increases. Therefore, early markers of strong banking stability include the portfolio’s holding of assets with lower risk weights and the satisfaction of higher regulatory capital requirements.
Basel III was implemented in 2010 with the goal of preventing future financial crises similar to the 2008–2009 global economic crisis. It raised the buffer capital to 2.5% and the capital requirements to 4.5% common equity of total risk-weighted assets. Compared to the 2008–2009 global financial crisis, banks were better funded during the COVID-19 pandemic, and the ensuing reforms helped them withstand the pandemic shock.
Compared to the pre-crisis years, the total amount of lending decreased and syndicated loans began to decline during and after the 2008 financial crisis. The government boosted consumer confidence by boosting Federal Deposit Insurance Corporation (FDIC) insurance and guaranteeing funds, while the Federal Reserve Board (FED) decreased interest rates and enhanced liquidity during the rapid recovery in the United States. The bank’s revenue from syndicated loans and all other loans has decreased as a result of those actions, which have stimulated borrowing and economic activity by lowering interest rates, both short-term and long-term, through quantitative easing (Antwi, 2019; Aramonte et al., 2022; Ertan, 2022; Puspitasari et al., 2021).
Because higher sovereign losses resulted in higher syndicated loan interest rates and lower short- and medium-term profitability, banks with greater exposure to other banks experienced a greater decline in the volume of syndicated loans at the country-borrower level during the 2009 European Sovereign Debt Crisis than did banks with less exposure. Stronger performance acted as a counterforce to rising loan spreads during the 2020 sanitary crisis, as evidenced by the inverse relationship between banks’ COVID-19 exposure and return on assets. It showed that banks with strong performance in syndication reduced exposure even when returns were lower during the financial crisis (De Marco, 2014; Hasan et al., 2021; Howcroft et al., 2014).
The findings are consistent with our investigation. This demonstrated that, during non-crisis times, syndicated loans can diversify risks among participating banks in the syndication process and boost banks’ returns thanks to syndication fees and commissions. Other factors considered in this study, such as the exchange rate, interest rate, and amount of non-performing loans, also have an impact on the relationship between syndicated loans and profitability. These factors indirectly affected the relationship between syndicated loans and banks’ return on assets.
In the short run, there is a negative and nearly zero correlation between return on assets and non-performing loans. The accumulation of non-performing loans turns positive and slightly increases over the medium and long term, indicating that banks have decreased the amount of non-performing loans and that their profitability has somewhat increased. This has a major effect on banks’ revenue (Ashar, 2019; Balgova et al., 2017).
Because they are subject to less stringent capital requirements, banks with high levels of financial health and low non-performing loan levels are better able to identify, screen, and keep an eye on high-risk borrowers.
We discovered evidence indicating that regulatory variations among nations may have an impact on the composition of international loan syndicates when we examined the capital requirements that participating banks and lead (arranger) banks must adhere to. Strictly regulated banks, for instance, are more likely to be involved in syndicates started by arranger institutions with laxer controls.
There are significant ramifications for participants and policymakers from the discovery that low-reputation arrangers, in particular, act opportunistically and cause unfavorable selection issues. To effectively control their risk exposure in syndicated loans, participating banks must accurately predict the conduct of an arranger. Policymakers must understand that the reputation of the lead arrangers determines the exposure and contribution of arrangers to the total systemic risk of the credit market. Therefore, while a policy to restrict the opportunistic behavior of lead arrangers with low average reputations might not work, a uniform regulation to reduce this risk might have asymmetrical consequences.
Due to more stringent restrictions, the significance of participating in syndicated loans decreases as bank health deteriorates due to the buildup of non-performing loans. There is an indirect correlation between the number of syndicated loans and the number of non-performing loans. The relationship between banks’ financial health and the strictness of capital regulation must be used to view and evaluate this situation. To increase their Tier 1 capital, banks with low capital levels have a detrimental impact on the riskiness of their participation ratio in syndicated loans (Begley et al., 2017; Gao & Jang, 2021; Plosser & Santos, 2018).
Additionally, given that not all non-performing loans are poor loans until the very end, our findings suggest that there may be a long-term positive correlation between non-performing loans and profitability. By promptly identifying troubled borrowers, renegotiating loan terms before clients default, and identifying underperforming loans, it may be able to lower the amount of non-performing loans.
The 2008 financial crisis, the 2009 euro debt crisis, and the 2020 sanitary crisis have all had an impact on the currency rate. Trade and financial flows were disrupted by the 2008 financial crisis, which also resulted in significant balance of payments gaps that accelerated depreciation and increased exchange rate volatility. While the global instability in foreign exchange markets has subsided in comparison to the 2007–2009 era, the euro’s exchange rate against other currencies has remained incredibly volatile during the European sovereign debt crisis. After governments announced policies and economic measures to cope with the economic conditions of the COVID-19 pandemic crisis, the currencies of China, the US, and Europe recovered from the COVID-19 pandemic’s impact (Ehrmann et al., 2014; Kaendera et al., 2009).
Banks’ returns on assets are negatively and statistically significantly impacted by exchange rate volatility during times of crisis, which lowers bank profitability and raises the number of non-performing loans. In addition to times of crisis, low exchange rate volatility lowers the amount of non-performing loans and increases bank profitability. Banks with a higher ratio of foreign currency assets to foreign currency liabilities are likely to see a positive impact on their net worth income in the event of foreign currency appreciation. (Keshtgar et al., 2020; Osundina et al., 2016).
Our study highlights that banks with more foreign currency assets than foreign currency liabilities are likely to experience a positive impact on their net worth income in the event of foreign currency appreciation and boost their profitability. This is supported by the positive relationship between the exchange rate and profitability in both long-term and noncrisis periods.
The 2008 financial crisis, the 2009 European sovereign debt crisis, and the 2020 pandemic all had an impact on the link between interest rates and profitability. Bank profitability was negatively impacted in the short and long term by lowering interest rates toward zero. Inflation has led to increased deposit interest rates, a declining net interest margin, less lending, and decreased bank profitability in the post-crisis era.
Banks have been more profitable, both in terms of results and balance sheet components, thanks to the strategic direction of syndicated loans for synergistic projects, particularly during periods of low profitability.
Because syndicated loans provide exposure to new clients, such as those in emerging markets and alternative industries, where better margins can be attained, they help reach revenue growth goals. According to the literature, banks also choose syndicated loans because it takes time to enter new markets and acquire the skills required for bilateral lending (Howcroft et al., 2014).
According to our research, ROA profitability rises by 1.43% for every 1% increase in syndicated loans (SL).
As demonstrated by the rise in syndicated loan volume following the global financial crisis, followed by a slight slowdown during the COVID-19 pandemic crisis and then another increase, this is economically necessary and demonstrates that increasing the volume of syndicated loans plays a significant role in increasing bank profitability.
The market for syndicated loans (SL) has expanded dramatically in recent years; between 1995 and 2012, its global volume increased 160% to $3.5 trillion.
The total number of lenders in the syndicated loan market has increased marginally over the past ten years, increasing by 1.3% annually between 2015 and 2022. Rising borrower demand, portfolio diversification, and the pursuit of yield are all responsible for that growth.
Although it is not impervious to changes, the syndicated loan market has historically shown a fair amount of consistency and resilience (Cheriyan et al., 2024). The market saw a significant drop in 2020, mostly as a result of the COVID-19 pandemic, even if its overall volume has increased slightly over the long run. However, syndicated loan activity has recovered to prepandemic levels with obvious growth prospects, despite the ongoing uncertainty in the global economy. Since the pandemic-induced downturn, corporate and commercial syndicated loan issuance volumes have increased by 4% globally. As of 2022, the United States accounted for over 53% of the $5.1 trillion worldwide deal volume.
As an alternative to corporate bonds or bilateral loans, syndicated loans benefit both lenders and borrowers by resolving several common issues in credit markets, including information asymmetry, market matching issues, and moral hazard (Dawkins et al., 2019; White & Case, 2025). With around $800 billion (roughly €720 billion) raised in 2017, syndicated loans are a major source of funding in Europe. This capital is utilized for a variety of corporate objectives, including refinances, with about 60% going to project finance and infrastructure (PF/INFRA) and leveraged buy-outs (LBOs). Corporate purchases and mergers are other significant motivator. PF/INFRA-related lending was approximately €35 billion (approximately 4% of the total syndicated debt market for all purposes across Europe), while LBO-related lending in six countries – England, France, Germany, Spain, the Netherlands, and Poland – was approximately €58 billion in 2017 alone.
Due to tightened margins and interest rate decreases in Europe and the UK, European syndicated loan issuance in 2024 almost surpassed the market’s full-year 2023 estimates. Many borrowers’ financing prices decreased as a result, which sparked a surge in refinance activity. The S&P estimates that during the first nine months of 2024, corporations refinanced around €10.5 billion of private debt in Europe through the BSL and high-yield bond markets, obtaining median interest rate savings of 138–150 basis points.
According to the China Banking Association, the total amount of outstanding loans (SL) held by Chinese banks at the end of June 2016 was $919.4 billion, up from $57.4 billion the year before (Savage & Baldwin, 2023; Xiaotian et al., 2022). Additionally, the Association reported that SLs accounted for 11.35% of all business bank credit, a rise of less than 10% in just 10 years.
The Chinese banking industry, which has supplied more than 60% of the funding, has supported the enormous growth and globalization of the Chinese industrial sector. As a result, Chinese commercial banks have become more international. The Chinese government’s 2013 Belt and Road initiative, which aims to improve infrastructure and trade connectivity between nations in Asia, Europe, and Africa, has the potential to significantly increase SL.
For rising and developing economies, cross-border syndicated loans are a vital source of funding. Because they spread via the lender network, large-scale shocks in the cross-border syndicated loan market represent a danger to the stability of the global financial system and further curtail credit flows to emerging nations.
A distinct buildup of systemic risks is reflected in the setting of multiple and overlapping crises, as well as the time lag that exists at both the macro and micro levels. Additionally, the interconnection may transmit the risks and, in certain cases, help mitigate them.
According to Altinoglu and Stiglitz (2023), interconnectedness alters risk-taking, and as a result, the institutions that grow in size and connectivity are the ones whose portfolios contain a high proportion of hazardous assets. Additionally, even though smaller, peripheral institutions do not directly profit from the bailout, the implicit insurance offered by a systemically important bank’s liabilities permits them to hold excessively risky assets. In this situation, interconnectedness can result in widespread excessive risk-taking, raising the possibility of a crisis.
Because systemically important banks are implicitly insured by the government, smaller, non-systemic institutions at the periphery invest in their liabilities to get insurance against stress risk. This strengthens interconnectedness because of interbank risk-sharing.
Given that excessive risk-taking and interconnection are implied to be intricately entwined and mutually reinforcing, and that this dynamic exacerbates systemic risk, optimum policymaking is crucial in this situation.
Thus, by restricting interbank lending to banks with high levels of hazardous assets in their portfolios, macroprudential rules can limit lending to banks that have direct or indirect exposure to risky banks.
The academic literature’s network models indicate the global financial system’s resilience and fragility (Conesa et al., 2020). Shocks spread throughout the network of cross-border loans, especially through co-borrowing agreements, according to an examination of syndicated cross-border lending to emerging and developing nations since 1993. These are mostly motivated by the major actors holding key positions within the network, such as the major international banks from the US, Europe, and Japan.
International trade and global supply chains (GSCs), which link production in several locations worldwide, have been directly impacted by the COVID-19 pandemic. GSCs frequently utilize just-in-time production methods, which reduce inventories and only create goods when needed, and they frequently rely on specialist suppliers, which are occasionally concentrated in particular areas (ECB, 2024). Because of this, production interruptions caused by COVID-19, which start in one place, spread throughout supply chain networks, and have a significant impact both within and between industries globally.
Demand for products began to rebound in 2020 as consumption patterns changed, with contact-based services consumption being limited by containment efforts related to the pandemic and widespread government financial assistance to lessen the impact of the COVID-19 epidemic. Because products have a larger trade intensity than services, this change in demand patterns boosted trade’s robust recovery, which surpassed its pre-pandemic level.
The answers to the two hypotheses formulated in the methodology section are as follows:
Hypothesis H1 is true. Based on our results, syndicated loans can support risk diversification between parties implied in the syndication and increase profitability. The validation is also based on our standard deviation measurement on the syndicated loans variable, by including in the analysis two risk variables, such as exchange rate and interest rate.
Hypothesis H2 is true. The relation between syndicated loans and profitability is also influenced by other variables used in this study such as exchange rate, interest rate, and the level of NPL. Also, the economic crisis during the period analyzed impacted indirectly the relationship between syndicated loans and return on assets for banks, through the rest of the variables used in this research.
Banking organizations should balance performance and risk when participating in a bank syndicate. Diversification of related risks and the efficiency of risk management mechanisms, such as collateralization and longer loan duration, contribute to increased profitability. At the same time, the large size of the syndicate involved in the lending process reduces profitability and the risks assumed by each lender.
To digitize and streamline certain processes in syndicated lending such as loan negotiation, execution, administration, and trading, the world of financial technology development has focused on creating technology solutions suitable for syndicated loans – these being distributed ledger technology (DLT) and smart contracts, along with artificial intelligence.
Thus, smart contracts offer the advantages of allowing smooth automation of data flows and payments along with compliance checks for certain commitments such as compliance with contractual terms or compliance certificates.
Once the contractual conditions have been fulfilled, smart contracts are automatically executed, requiring very little human intervention or administration and thus contributing to increased efficiency and reduced costs involved in the syndicated loan process.
The adoption and use of AI bring with it multiple challenges. Thus the ability of AI to evolve and use complex statistical algorithms can make decision-making processes completely non-transparent which can contribute to discriminatory decisions, this being an issue that financial services regulators need to be very careful about.
Financial institutions also need to ensure that by using AI it does not become anti-competitive in terms of pricing, favoring certain price categories, and to prevent the risk of market abuse from arising as it becomes increasingly difficult to distinguish between information that is publicly available and information that is not publicly available.
The study covers a unique period, a very dynamic context of multiple crises from 2008 to 2020. Three classes of indicators are analyzed via specific methodologies and instruments, offering different angles: performance indicators, risk, and macroeconomic indicators. The most important global players, the US, Europe, and China are carefully analyzed within the study.
The regional differences are emphasized via a multidimensional approach.
The structures of the banking sectors within the USA, Europe, and China are different, being tailored to the specificities of their respective economies. The funding is different. US funding is based more on the capital markets, and Europe is banco-centric. China is funding the economy more via the banking system. The banking cultures are different, customer behaviors are different in each region.
Regulatory arbitrage may be observed between the USA, Europe, and China, not a unitary framework in the adoption of Basel regulations. The central banks in the USA, Europe, and China are adjusting, differently and diversely, their policy instruments to meet the objectives and ensure financial stability.
The rationale behind structuring syndicated loans within the specific geographies or cross regions is different. It is connected with understanding the key drivers, such as risk orientation, diversification, and mitigation or profit orientation.
Other fundamentals for bank syndications are also linked with the global changing environment and geopolitics. Geopolitics influences the ownership and strategic interests of banking organizations.
Policy design and orientation should also consider specific answers to relevant questions:
How to exit a syndication, if one of the members of the syndicate is part of a country put under restrictions/blacklisted?
How to pay coupons to bonds, issued to finance a bank syndicate, if the issuer is a bank from an unfriendly country?
Regional variations include all the aspects mentioned.
The study adds value via two fundamental aspects. The study is in line with the results from relevant research, including a documented syllabus and extracting important aspects. But also the study adds relevant extra value, complexity, and perspectives, to future policy design.
The main topic- syndication represents a key instrument. The strategic orientation of syndicated loans for synergistic projects, especially in unprofitable periods, has increased the banks’ profitability, both on the results and balance sheet components, as reflected by the study.
Our research provides input for policy design, being anchored in such a large selection of countries, relevant number of indicators, and critical period. The results offer strategic insight for the short, medium, and long term.
The article stress on the geopolitical risk relevance. Geopolitics influences shareholding structures and strategic interests of banking organizations. It offers different fundamentals for bank syndications. The article is very much anchored within the new geopolitical context of 2025.
It also provides a way to understand, based on scientific research, the governance systems and mechanisms of banks, from the USA, Europe, and China. Either to target returns or to diversify risks. Two fundamental indicators for the banking business, that need continuous screening, due to the changing contexts and diverse risk amplification factors.
Our study managed to reflect cultural approaches, and behaviors influenced by a diversity of factors, in a dynamic crisis context.
Securitization is a hot topic on the decision-maker's tables. It is linked to syndication, which involves selling part of the risk to other counterparties. Regulators analyze various scenarios to calibrate securitization in the international markets and mitigate arbitrage.
The simplification of the reporting frame, the inclusion of the proportionality principle, the avoidance of granularity, and the adaptation of the format to market conditions, represent parts of the conversation linked, at the regulatory level, with securitization.
Another relevant aspect is the simplification of the due diligence requirement, especially concerning risk retention and adaptation to the position within the securitization. Lack of proportionality invites various unpleasant situations (high yielded securitization preference).
Another relevant topic for policy design is risk management. Risk categories, risk amplification, risk culture. We stress the geopolitical risk relevance. Geopolitics influences shareholding structures and strategic interests of banking organizations. It offers different fundamentals for bank syndications. Friends shoring, and nearshoring are also concepts linked with the context, that influence and change the rationale of a syndication transaction.
How to exit a syndicate, if one of the members of the syndicate is part of a country put on the restrictions/blacklisted? How to repay/refinance a member of a syndication, if that member is owned by an unfriendly shareholder/country?
How to pay coupons to bonds, issued to finance a bank syndicate, if the issuer is a bank from an unfriendly country?
How should be reshaped the compliance criteria, the CFT/AML (Counter Fighting Terrorism/Anti Money Laundering) provisions, to operate a cross-border syndicate of banks, within an area that became a conflict area, after the syndicate was lending a large amount of money?
The context and the momentum are relevant to drawing conclusions and support building new approaches for policies, instruments, and mechanisms. Those aspects will also be tackled within our next research studies.
As bank syndicates operate with larger volumes of funding, concerns should also affect the fundamentals of financial stability. The sector and country exposures, sovereign risk approach, the liquidity of a specific banking market, and the relationship analyzed in our empirical study, between various indicators, should also be revisited.
Is it desirable to reduce the diversity of the financial sector by using more syndicated loans? The liaison between the micro and macro perspectives may also represent concerns for policymakers. Decisions at a bank level focused on the evolution and deterioration of specific indicators should be harmonized with the decision-making process in other financial institutions, with the vision of authorities. What are the key strategic trade-offs?
Who owns the customer within a syndicate, who is in charge, and who is responsible for managing bad customer relationships?
All those considerations influence the rationale and indicators taken into consideration within our research and are linked with the results of our research. And are relevant for all the stakeholders of the financial markets.
6 Conclusions
The research addresses specific gaps and limitations within the related literature. It enhances the scientific literature by using an extended sample of 30 countries, globally spanned, a full set of banking indicators, over a critical period of 12 years, including three economic crises: the 2008 financial crisis, the 2009 European sovereign debt crisis, and then the sanitary crisis.
The research adds value to the existing literature and supports future policies by rigorously investigating the relationship between the profitability and risk of syndicated loans. The results are supported and validated based on two regressions (a panel regression and a quantile regression), an Autoregressive Distributed Lag Stationarity model, as well as two robustness tests for each of the models used.
The research emphasizes that in the short and medium term, the impact of all variables on the dependent variable Return on Assets was influenced by unique economic conditions, specific to the period analyzed. The impact of the high volatility of the exchange rate, the increase in the level of non-performing loans, and the shocks and monetary policies applied to interest rates have had an impact on the level of syndicated loans, reducing the volume of lending but also eroding profitability.
The research has highlighted that bank syndications contribute to the increase in bank profitability and risk dispersion among participating banks.
There is a straightforward strategic approach that banking organizations should enter into more business relationships and follow a better risk diversification matrix. The beneficial ingredients and specific drivers relevant to each banking institution make a tailor-made implementation process.
Bank-to-bank relationships and linkages represent essential channels for contagion and for opportunities, as well. The syndication represents a strategic piece of the financial system, a sort of global asset class, and acts as a bridge between private and public debt markets. Via syndication of loans, know-how from a bank is transferred to other banks. Complex funding structures, various mixes of collaterals, and different risk approaches are parts of the syndication deals, supporting various sectors of an economy. The orientation of the syndicated loans changes the shape of a sector, of an economy. The importance of understanding the rationale of the syndications, and the relationships between banking indicators represent other key aspects of this research.
The perception of risks, collectively, within a syndicate of banks, following specific crises explains the orientation of the funding, the critical importance of local savings, and the low appetite for foreign loans.
Regulatory arbitrage influences the syndication global market. Financial institutions with strict regulations participate more in syndicates initiated by arranger banks that are subject to less stringent regulations. Cross-border syndicated loans are an essential source of finance for emerging and developing economies.
The new mix of funding resources, involving debt provided via multilateral financial institutions, debt provided by local banks, and non – and refundable funding provided via governmental programs, represents a new approach developed in the multiple crisis context. As threats are propagated through the network of lenders, they may rapidly reduce the flows to emerging economies, affecting the stability of the financial systems.
Regarding risk diversification, the research reflects that syndicated loans reduce related risks by increasing the number of participating lenders and efficiently monitoring those risks. When granting syndicated loans, banks should aim to strike a balance between profitability and risk diversification.
The overlapping of crises, the dynamics and amplitude of the changes in economies, banking sectors, and societies invite a critical analysis to identify new anchors that need to be sustainably connected. From macro and micro perspectives, performance, and risk sharing, represent critical highlights for the three global actors, the USA, Europe, and China.
Building risk management capabilities within a dynamic crisis context, testing and adjusting financial mechanisms represent strong catalyzers to manage vulnerabilities and transform them into potential opportunities for all stakeholders.
The bank syndication processes, mixing cultural, technical, and strategic ingredients, invite further analysis, connecting the micro and macro perspectives. The emerging risk categories, such as geopolitical, technological, and climate/environmental, add extra concern for researchers, bankers, and authorities. Their impact must be analyzed together with market risk as part of future research.
Acknowledgments
I would like to thank to Professor Dan Costin Nitescu for all his guidance, support and patience throughout this research.
-
Funding information: Authors state no funding involved.
-
Author contributions: All authors took responsibility for the entire content of this manuscript and agreed to submit it to the journal, reviewed all results, and approved the final version of the manuscript. DCN and CMA performed the tests and simulations, within the models used. DCN and CMA also prepared the manuscript with contributions from both co-authors.
-
Conflict of interest: Authors state no conflict of interest.
-
Data availability statement: The datasets generated during and/or analyzed during the current study are available from the corresponding author upon reasonable request.
-
Article note: As part of the open assessment, reviews and the original submission are available as supplementary files on our website.
Appendix
Annex 1
Countries by GDP in 2021
| C_id | Country name | Year | Value (trillions USD) | Percentage (%) |
|---|---|---|---|---|
| 1 | AUSTRIA | 2021 | 479.3 billions | 0.49 |
| 2 | BELGIUM | 2021 | 600.7 billions | 0.62 |
| 3 | BULGARIA | 2021 | 84.04 billions | 0.09 |
| 4 | CHINA | 2021 | 17.82 trillions | 18.27 |
| 5 | CROATIA | 2021 | 69.08 billions | 0.07 |
| 6 | CYPRUS | 2021 | 29.48 billions | 0.03 |
| 7 | CZECH REPUBLIC | 2021 | 281.8 billions | 0.29 |
| 8 | DENMARK | 2021 | 405.7 billions | 0.42 |
| 9 | ESTONIA | 2021 | 37.19 billions | 0.04 |
| 10 | FINLAND | 2021 | 296.8 billions | 0.30 |
| 11 | FRANCE | 2021 | 2.959 trillions | 3.03 |
| 12 | GERMANY | 2021 | 4.279 trillions | 4.39 |
| 13 | GREECE | 2021 | 214.7 billions | 0.22 |
| 14 | HUNGARY | 2021 | 182.1 billions | 0.19 |
| 15 | IRELAND | 2021 | 513.4 billions | 0.53 |
| 16 | ITALY | 2021 | 2.155 trillions | 2.21 |
| 17 | LATVIA | 2021 | 39.44 billions | 0.04 |
| 18 | LITHUANIA | 2021 | 66.8 billions | 0.07 |
| 19 | LUXEMBOURG | 2021 | 85.58 billions | 0.09 |
| 20 | MALTA | 2021 | 18.09 billions | 0.02 |
| 21 | NETHERLANDS | 2021 | 1.03 trillions | 1.06 |
| 22 | POLAND | 2021 | 681.3 billions | 0.70 |
| 23 | PORTUGAL | 2021 | 255.5 billions | 0.26 |
| 24 | ROMANIA | 2021 | 285.8 billions | 0.29 |
| 25 | SLOVAKIA REPUBLIC | 2021 | 118.6 billions | 0.12 |
| 26 | SLOVENIA | 2021 | 61.83 billions | 0.06 |
| 27 | SPAIN | 2021 | 1.446 trillions | 1.48 |
| 28 | SWEEDEN | 2021 | 639.7 billions | 0.66 |
| 29 | UNITED KINGDOM | 2021 | 3.142 trillions | 3.22 |
| 30 | UNITED STATES | 2021 | 23.32 trillions | 23.91 |
| Total percentage of countries’ shares of global GDP | 63.16 | |||
| Global GDP (2021) = 97.53 trillions USD | ||||
Source: Authors own calculations based on World Bank data.
Annex 2
Panel two-stage regression results
| Dependent variable: D(L2ROA) | ||||
|---|---|---|---|---|
| Method: Panel two-stage EGLS | ||||
| Instrument specification: C L2NPL(0) L2NPL(−1) D(L2RIR(0)) D(L2RIR(−1)) L2EXR(0) L2EXR(−1) | ||||
| Variable | Coefficient | Std. error | t-statistic | Prob. |
| D(L2SL) | 0.010376 | 0.00137 | 7.582442 | 0.0000 |
| L2NPL | −0.014271 | 0.01993 | −703.4168 | 0.0000 |
| D(L2RIR) | 0.004035 | 0.00138 | 2.920214 | 0.0037 |
| L2EXR | −2.162402 | 0.00939 | −230.3961 | 0.0000 |
| R-squared | 0.996492 | Mean dependent var | 0.965955 | |
| Adjusted R-squared | 0.996466 | S.D. dependent var | 0.069435 | |
| S.E. of regression | 0.004128 | Sum squared resid | 0.007053 | |
| Durbin–Watson stat | 0.248927 | Second-Stage SSR | 0.402421 | |
| Instrument rank | 8 | Prob(J-statistic) | 0.000109 | |
| Observations: 418 | ||||
Source: author’s own calculations.
Hausman test results
| Cross-section random | |||
|---|---|---|---|
| Test summary | Chi-Sq. statistic | Chi-Sq. d.f. | Prob. |
| Cross-section random | 0.135179 | 5 | 0.9997 |
Source: author’s own calculations.
Panel least squares heteroskedasticity results
| Panel least squares cross-section heteroskedasticity LR test | |||
|---|---|---|---|
| Value | df | Probability | |
| Likelihood ratio | 332.006 | 30 | 0.4483 |
Source: author’s own calculations.
References
Agarwal, I. (2018). Banks’ foreign currency exposure and the real effects of exchange rate shocks. 2018 Paris Finance Meeting EUROFIDAI-AFFI. Retrieved from: https://foster.uw.edu/wp-content/uploads/2019/10/Banks-Foreign-Currency-Exposure-and-the-Real-Effects-of-Exchange-Rate-Shocks.pdf.Search in Google Scholar
Aller, C., Ductor, L., & Herrerias, M. J. (2015). The world trade network and the environment. Energy Economics, 52, 55–68. doi: 10.1016/j.eneco.2015.09.008.Search in Google Scholar
Altavilla, C., Bochmann, P., De Ryck, J., Dumitru, A., Grodzicki, M., Kick, H., Fernandes, C., Mosthaf, J., O’Donnell, C., & Palligkinis, S. (2021). Measuring the cost of equity of euro area banks. ECB Occasional Paper. Retrieved from https://papers.ssrn.com/sol3/papers.cfm?abstract_id=3797125.10.2139/ssrn.3797125Search in Google Scholar
Altavilla, C., Boucinha, M., & Peydró, J. L. (2018). Monetary policy and bank profitability in a low interest rate environment. Economic Policy, 33(96), 531–586. doi: 10.1093/epolic/eiy013.Search in Google Scholar
Altinoglu, L., & Stiglitz, E. J. (2023). Why highly interconnected financial institutions generate systemic risk. Retrieved from https://blogs.lse.ac.uk/businessreview/2023/06/20/why-highly-interconnected-financial-institutions-generate-systemic-risk/.Search in Google Scholar
Angelini, P., Bofondi, M., & Zingales, L. (2017). The origins of Italian NPLs. Preliminary paper. Retrieved from https://www.bis.org/events/conf170623/acharya_pres.pdf.Search in Google Scholar
Antwi, F. (2019). Capital adequacy, cost income ratio and performance of banks in Ghana. International Journal of Academic Research in Business and Social Sciences, 9(10), 168–184. doi: 10.6007/IJARBSS/v9-i10/6471.Search in Google Scholar
Aramonte, S., Lee, S. J., & Stebunovs, V. (2022). Risk taking and low longer-term interest rates: Evidence from the US syndicated term loan market. Journal of Banking & Finance, 138, 105511. doi: 10.1016/j.jbankfin.2019.02.010.Search in Google Scholar
Ashar, J. (2019). What are the solutions for non performing loans (NPLs)? CFO Executive Dialogue. Retrieved from https://the-cfo.io/2019/11/07/what-are-the-solutions-for-non-performing-loans-npls/.Search in Google Scholar
Balgova, M., Plekhanov, A., & Skrzypinska, M. (2017). Reducing non-performing loans: Stylized facts and economic impact. European Bank for Reconstruction and Development. ms., EBRD and Oxford. Retrieved from https://www.ebrd.com/documents/admin/reducing-nonperforming-loans-stylized-facts-and-economic-impact.pdf.Search in Google Scholar
Basten, C., & Mariathasan, M. (2018). How banks respond to negative interest rates: Evidence from the Swiss exemption threshold. Retrieved from https://papers.ssrn.com/sol3/papers.cfm?abstract_id=3164780f.10.2139/ssrn.3164780Search in Google Scholar
Begley, T. A., Purnanandam, A., & Zheng, K. (2017). The strategic underreporting of bank risk. The Review of Financial Studies, 30(10), 3376–3415. doi: 10.1093/rfs/hhx036.Search in Google Scholar
Cai, J., Eidam, F., Saunders, A., & Steffen, S. (2018). Syndication, interconnectedness, and systemic risk. Journal of Financial Stability, 34, 105–120.10.1016/j.jfs.2017.12.005Search in Google Scholar
Chaudhry, S. M., & Kleimeier, S. (2015). Lead arranger reputation and the structure of loan syndicates. Journal of International Financial Markets, Institutions and Money, 38, 116–126.10.1016/j.intfin.2015.05.021Search in Google Scholar
Cheriyan, J., Craig, C., Seibold, S., & Skouloudi, G. (2024). Modernizing corporate-loan operations. Retrieved from https://www.mckinsey.com/industries/financial-services/our-insights/modernizing-corporate-loan-operations#/.Search in Google Scholar
Chu, J. F., & Sek, S. K. (2014). Investigating the relationship between inflation and growth: Evidence from panel ARDL models. AIP Conference Proceedings, 1605(1), 943–948. doi: 10.1063/1.4887717.Search in Google Scholar
Clifford Chance. (2021). The digital future of syndicated loans. Retrieved from: https://www.cliffordchance.com/briefings/2021/06/the-digital-future-of-syndicated-loans.html.Search in Google Scholar
Conesa, M., Lotti, G., & Powell, A. (2020). Resilience and fragility in global banking: Impacts on emerging economies. IDB Working Paper Series. Retrieved from https://publications.iadb.org/en/resilience-and-fragility-in-global-banking-impacts-on-emerging-economies.10.18235/0002504Search in Google Scholar
Dawkins, R., Drury, D., Law, E., Bretz, O., Leppard, M., & Bardel, H. (2019). EU loan syndication and its impact on competition in credit markets. Retrieved from https://kromannreumert.com/files/media/document/EU%20loan%20syndication%20and%20its%20impact%20on%20competition%20in%20credit%20markets.pdf.Search in Google Scholar
De Marco, F. (2014). Bank lending and the sovereign debt crisis. Manuscript, Boston College. Retrieved from https://finance.unibocconi.eu/sites/default/files/files/media/attachments/DeMarco_SovCrisis20150108092957.pdf.10.2139/ssrn.2673967Search in Google Scholar
Dentons. (2023). Special problems of syndicated loans and multi-tiered financings. Retrieved from https://www.dentons.com/en/insights/articles/2023/august/30/special-problems-of-syndicated.Search in Google Scholar
ECB. (2024). Global trade in the post-pandemic environment. Retrieved from https://www.ecb.europa.eu/press/economic-bulletin/focus/2024/html/ecb.ebbox202401_01∼d1c3b1b0a5.en.html.Search in Google Scholar
Ehrmann, M., Osbat, C., Stráský, J., & Uusküla, L. (2014). The euro exchange rate during the European sovereign debt crisis–Dancing to its own tune? Journal of International Money and Finance, 49, 319–339.10.1016/j.jimonfin.2014.06.008Search in Google Scholar
Ertan, A. (2022). Real earnings management through syndicated lending. Review of Accounting Studies, 27(4), 1157–1198.10.1007/s11142-021-09607-7Search in Google Scholar
Gao, J., & Jang, Y. (2021). What drives global lending syndication? Effects of cross-country capital regulation gaps. Review of Finance, 25(2), 519–559. doi: 10.1093/rof/rfaa019.Search in Google Scholar
Goodman, G. A., Fennell, G., & Linder, J. (2023). Special problems of syndicated loans and multi-tiered financings. Retrieved from https://www.dentons.com/en/insights/articles/2023/august/30/special-problems-of-syndicated.Search in Google Scholar
Granja, J., & Leuz, C. (2020). The death of a regulator: Strict supervision, bank lending and business activity. National Bureau of Economic Research. Retrieved from https://www.nber.org/papers/w24168.Search in Google Scholar
Hasan, I., Politsidis, P. N., & Sharma, Z. (2021). Global syndicated lending during the COVID-19 pandemic. Journal of Banking & Finance, 133, 106121.10.1016/j.jbankfin.2021.106121Search in Google Scholar
Heider, F., Saidi, F., & Schepens, G. (2019). Life below zero: Bank lending under negative policy rates. The Review of Financial Studies, 32(10), 3728–3761. doi: 10.1093/rfs/hhz016.Search in Google Scholar
Howcroft, B., Kara, A., & Marques-Ibanez, D. (2014). Determinants of syndicated lending in European banks and the impact of the financial crisis. Journal of International Financial Markets, Institutions and Money, 32, 473–490. doi: 10.1016/j.intfin.2014.07.005.Search in Google Scholar
International Labour Organisation. (2020). The effects of COVID‑19 on trade and global supply chains. Retrieved from https://www.google.com/url?sa=t&source=web&rct=j&opi=89978449&url=https://www.ilo.org/media/399131/download&ved=2ahUKEwi9yNSd4PCKAxWG97sIHcUpG0kQFnoECAQQAQ&usg=AOvVaw1fcBn9nOY7neCwvXcyRxGV.Search in Google Scholar
Kaendera, S., Dixit, S. V. S., & Ltaifa, N. B. (2009). Impact of the global financial crisis on exchange rates and policies in sub-Saharan Africa. International Monetary Fund. Retrieved from https://www.imf.org/external/pubs/cat/longres.aspx?sk=23445.10.5089/9781462389889.087Search in Google Scholar
Kasinger, J., Krahnen, J. P., Ongena, S., Pelizzon, L., Schmeling, M., & Wahrenburg, M. (2021). Non-performing loans- New risks and policies? NPL resolution after COVID-19: Main differences to previous crises. SAFE White Paper. Retrieved from https://www.europarl.europa.eu/RegData/etudes/STUD/2021/651387/IPOL_STU(2021)651387_EN.pdf.Search in Google Scholar
Keshtgar, N., Pahlavani, M., & Mirjalili, S. H. (2020). The impact of exchange rate volatility on banking performance (case of Iran). International Journal of Business and Development Studies, 12(1), 39–56. doi: 10.22111/ijbds.2020.5436.Search in Google Scholar
Miricescu, E. C. (2015). The correlation of sovereign rating and bonds’ interest rate in EU member states. Transylvanian Review of Administrative Sciences, 11(45), 136–148.Search in Google Scholar
Miricescu, E. C., Țâțu, L., & Cornea, D. (2016). The determinants of the sovereign debt rating: Evidence for the Eeuropean Union Countries. Economic Computation & Economic Cybernetics Studies & Research, 50(1), 175–188.Search in Google Scholar
Oh, G., & Park, A. Y. (2021). Lending diversification and interconnectedness of the syndicated loan market. Frontiers in Physics, 8, 581994. doi: 10.3389/fphy.2020.581994.Search in Google Scholar
Osundina, C. K., Ademola, O. J., Olamide, J. O., & Moses, O. I. (2016). Exchange rate volatility and banks performance: Evidence from Nigeria. IIARD International Journal of Economics and Business Management, 2(4), 1–11.Search in Google Scholar
Payden & Rygel. (2013). A primer on syndicated term loans. Retrieved from https://www.payden.com/pdf/hy_primer_1-13.pdf.Search in Google Scholar
Pesaran, M. H., Shin, Y., & Smith, R. P. (1999). Pooled mean group estimation of dynamic heterogeneous panels. Journal of the American statistical Association, 94(446), 621–634.10.1080/01621459.1999.10474156Search in Google Scholar
Plosser, M. C., & Santos, J. A. (2018). Banks’ incentives and the quality of internal risk models. Federal Reserve Bank of New York. Retrieved from https://www.newyorkfed.org/medialibrary/media/research/staff_reports/sr704.pdf.Search in Google Scholar
Puspitasari, E., Sudiyatno, B., Aini, N., & Anindiansyah, G. (2021). The relationship between net interest margin and return on asset: Empirical study of conventional banking in Indonesia. Academic Journal of Interdisciplinary Studies, 10(3), 362–374. doi: 10.36941/ajis-2021-0090.Search in Google Scholar
Savage, R., & Baldwin, C. (2023). China lent $1.34 trln in 2000-2021, focus shifts from Belt and Road to rescue finance-report. Retrieved from https://www.reuters.com/world/china/china-lent-134-trln-2000-2021-focus-shifts-belt-road-rescue-finance-report-2023-11-06/.Search in Google Scholar
Sperlich, Y., & Sperlich, S. (2014). Income inequality in the South-South integration. Journal of Economic Integration, 29(4), 726–758. doi: 10.11130/jei.2014.29.4.726.Search in Google Scholar
Suarez, J., & Sànchez-Serrano, A. (2021). Approaching non-performing loans from a macroprudential angle. ESRB: Advisory Scientific Committee Reports. Retrieved from https://www.esrb.europa.eu/pub/pdf/asc/esrb.asc181001_7_ApproachingNPLsmacroprudentialangle.en.pdf.Search in Google Scholar
The Global Economy. (2023). Economic Data > Indicators > Countries > Annual Frequency [online]. https://www.theglobaleconomy.com/download-data.php [14 February 2023].Search in Google Scholar
White & Case. (2025). Old dog, new tricks: The evolution of syndicated loan markets. Retrieved from https://www.whitecase.com/insight-our-thinking/european-leveraged-finance-2025-old-dog-new-tricks.Search in Google Scholar
World Bank. (2023a). Data Bank > Data Base > Global Financial Development > Country > Series > Time [online]. https://databank.worldbank.org/source/global-financial-development [18 February 2023].Search in Google Scholar
World Bank. (2023b). Data Bank > Data Base > World Development Indicators > Country > Series > Time [online]. https://databank.worldbank.org/source/world-development-indicators [18 February 2023].Search in Google Scholar
Xiaotian, W., Barakat, A., & Webb, R. (2022). Why do Chinese banks extend cross-border syndicated loans? Retrieved from https://papers.ssrn.com/sol3/papers.cfm?abstract_id=2984605.Search in Google Scholar
© 2025 the author(s), published by De Gruyter
This work is licensed under the Creative Commons Attribution 4.0 International License.
Articles in the same Issue
- Research Articles
- Research on the Coupled Coordination of the Digital Economy and Environmental Quality
- Optimal Consumption and Portfolio Choices with Housing Dynamics
- Regional Space–time Differences and Dynamic Evolution Law of Real Estate Financial Risk in China
- Financial Inclusion, Financial Depth, and Macroeconomic Fluctuations
- Harnessing the Digital Economy for Sustainable Energy Efficiency: An Empirical Analysis of China’s Yangtze River Delta
- Estimating the Size of Fiscal Multipliers in the WAEMU Area
- Impact of Green Credit on the Performance of Commercial Banks: Evidence from 42 Chinese Listed Banks
- Rethinking the Theoretical Foundation of Economics II: Core Themes of the Multilevel Paradigm
- Spillover Nexus among Green Cryptocurrency, Sectoral Renewable Energy Equity Stock and Agricultural Commodity: Implications for Portfolio Diversification
- Cultural Catalysts of FinTech: Baring Long-Term Orientation and Indulgent Cultures in OECD Countries
- Loan Loss Provisions and Bank Value in the United States: A Moderation Analysis of Economic Policy Uncertainty
- Collaboration Dynamics in Legislative Co-Sponsorship Networks: Evidence from Korea
- Does Fintech Improve the Risk-Taking Capacity of Commercial Banks? Empirical Evidence from China
- Multidimensional Poverty in Rural China: Human Capital vs Social Capital
- Property Registration and Economic Growth: Evidence from Colonial Korea
- More Philanthropy, More Consistency? Examining the Impact of Corporate Charitable Donations on ESG Rating Uncertainty
- Can Urban “Gold Signboards” Yield Carbon Reduction Dividends? A Quasi-Natural Experiment Based on the “National Civilized City” Selection
- How GVC Embeddedness Affects Firms’ Innovation Level: Evidence from Chinese Listed Companies
- The Measurement and Decomposition Analysis of Inequality of Opportunity in China’s Educational Outcomes
- The Role of Technology Intensity in Shaping Skilled Labor Demand Through Imports: The Case of Türkiye
- Legacy of the Past: Evaluating the Long-Term Impact of Historical Trade Ports on Contemporary Industrial Agglomeration in China
- Unveiling Ecological Unequal Exchange: The Role of Biophysical Flows as an Indicator of Ecological Exploitation in the North-South Relations
- Exchange Rate Pass-Through to Domestic Prices: Evidence Analysis of a Periphery Country
- Private Debt, Public Debt, and Capital Misallocation
- Impact of External Shocks on Global Major Stock Market Interdependence: Insights from Vine-Copula Modeling
- Informal Finance and Enterprise Digital Transformation
- Wealth Effect of Asset Securitization in Real Estate and Infrastructure Sectors: Evidence from China
- Consumer Perception of Carbon Labels on Cross-Border E-Commerce Products and its Influencing Factors: An Empirical Study in Hangzhou
- How Agricultural Product Trade Affects Agricultural Carbon Emissions: Empirical Evidence Based on China Provincial Panel Data
- The Role of Export Credit Agencies in Trade Around the Global Financial Crisis: Evidence from G20 Countries
- How Foreign Direct Investments Affect Gender Inequality: Evidence From Lower-Middle-Income Countries
- Big Five Personality Traits, Poverty, and Environmental Shocks in Shaping Farmers’ Risk and Time Preferences: Experimental Evidence from Vietnam
- Academic Patents Assigned to University-Technology-Based Companies in China: Commercialisation Selection Strategies and Their Influencing Factors
- Review Article
- Bank Syndication – A Premise for Increasing Bank Performance or Diversifying Risks?
- Special Issue: The Economics of Green Innovation: Financing And Response To Climate Change
- A Bibliometric Analysis of Digital Financial Inclusion: Current Trends and Future Directions
- Targeted Poverty Alleviation and Enterprise Innovation: The Mediating Effect of Talent and Financing Constraints
- Does Corporate ESG Performance Enhance Sustained Green Innovation? Empirical Evidence from China
- Can Agriculture-Related Enterprises’ Green Technological Innovation Ride the “Digital Inclusive Finance” Wave?
- Special Issue: EMI 2025
- Digital Transformation of the Accounting Profession at the Intersection of Artificial Intelligence and Ethics
- The Role of Generative Artificial Intelligence in Shaping Business Innovation: Insights from End Users’ Perspectives and Practices
- The Mediating Role of Climate Change Mitigation Behaviors in the Effect of Environmental Values on Green Purchasing Behavior within the Framework of Sustainable Development
- Special Issue: The Path to Sustainable And Acceptable Transportation
- Factors Influencing Environmentally Friendly Air Travel: A Systematic, Mixed-Method Review
- Special Issue: Shapes of Performance Evaluation - 2nd Edition
- Redefining Workplace Integration: Socio-Economic Synergies in Adaptive Career Ecosystems and Stress Resilience – Institutional Innovation for Empowering Newcomers Through Social Capital and Human-Centric Automation
- Knowledge Management in the Era of Platform Economies: Bibliometric Insights and Prospects Across Technological Paradigms
- The Impact of Quasi-Integrated Agricultural Organizations on Farmers’ Production Efficiency: Evidence from China