Estimating kaolinite crystallinity using near-infrared spectroscopy: Implications for its geology on Earth and Mars
-
Maxime Pineau
 ,
Fabien Baron
,
Fabien Baron

Abstract
Kaolinite is an Al-rich phyllosilicate commonly observed on Earth as a product of the chemical weathering of aluminosilicates. It has also been detected on the martian surface by orbital remote sensing observations. While the determination of the geological processes of formation of terrestrial kaolinite (i.e., hydrothermal activity, continental surface weathering, diagenesis) involves the coupling of field observation and multiple laboratory measurements, only geomorphology and associated minerals are generally available to determine their geological origin on Mars. Kaolinite crystallinity depends on many physicochemical parameters reflecting its conditions of crystallization. To determine if the near-infrared (NIR) spectral signature of kaolinite enables estimation of its crystallinity and furthermore if this method can be used to identify the geological processes involved in kaolinite formation, we carried out an in-depth analysis of NIR spectra of reference terrestrial kaolinites that formed in various geological contexts. We calculated second and third derivatives for each spectrum to highlight subtle variations in the spectral properties of kaolinite. This allowed the identification of 27 spectral contributions for the 4500 and 7000 cm−1 Al-OH-related regions of absorption bands. The position shifts and shape variations of these spectral contributions were intimately linked to variations of crystallinity, which was qualitatively estimated using Hinckley and Liétard XRD (dis)order indices. The results obtained show that the NIR signature of kaolinite is influenced by the stacking disorder of layers that has some influence on the vibrations of the interfoliar and inner Al-OH groups. Our study also confirms that: (1) well-ordered kaolinites are not restricted to hydrothermal deposits; (2) kaolinites from a similar sedimentary or pedogenetic context often display contrasting degrees of crystalline order; and (3) poorly ordered kaolinites are more likely to have a sedimentary or pedogenetic origin. Finally, this work highlights that obtaining spectra with sufficient spectral resolution could help to estimate the crystallinity of kaolinite and, in the best cases, its geological origin, both on Earth and Mars, especially with in situ NIR measurements.
Introduction
Kaolinite is a 1:1 dioctahedral triclinic phyllosilicate [Al2Si2O5(OH)4] (e.g., Bish 1993 and references therein). Kaolinite is the most common polymorph of kaolin-group minerals. It has two monoclinic polymorphs: dickite and nacrite that mainly form in diagenetic and hydrothermal contexts (Swindale 1975; Buatier et al. 1996; Beaufort et al. 1998). In addition, kaolinite also has a hydrated monoclinic polymorph called halloysite [Al2Si2O5(OH)4.2H2O] (Beaufort et al. 1998). In kaolinite, each layer is composed of two superposed sheets: one of silica tetrahedra and one of alumina octahedra, the sheets being linked to each other by hydrogen bonds. Hydroxyls (OH) in kaolinite can be classified into two categories: (1) the inner-surface hydroxyls located on the basal surface of the alumina octahedra sheet that bond to the bridging oxygen atoms of the silica tetrahedra sheet of the adjacent layer: hereafter named “interfoliar-OH” for simplicity, and (2) the inner hydroxyls bonded to the alumina octahedra sheet and located inside the hexagonal cavity formed by the silica tetrahedra: hereafter named “inner-OH” (e.g., Bish 1993 and references therein) (Fig. 1). On Earth, kaolinite is observed in various geological contexts (Balan et al. 2014; Dill 2016). It can crystallize at the expense of primary minerals during the chemical weathering of silicates (mostly micas and feldspars) or precipitate from dissolved ions in fluids. It is observed in regoliths formed under climate and/or geomorphologic context that promotes a high-water regime at the origin of intense leaching, as under tropical climates. It can precipitate in sediments due to diagenetic reactions. Finally, it is also commonly observed in hydrothermal contexts. The geological processes promoting kaolinite crystallization are obvious in active systems where kaolinite is currently forming but less clear in fossil systems. The geological origin (continental weathering, diagenesis of sediments, hydrothermal activity) of kaolinite can be tentatively inferred by combining several macro- to micro-scale observations: geomorphological context, associated mineralogy, trace elements analysis (Dill et al. 1997), oxygen and hydrogen isotopy (e.g., Sheppard 1977; Boulvais et al. 2000; Gaudin et al. 2015), in-depth study of its crystallinity (e.g., Hinckley 1962; Liétard 1977; Estéoule-Choux 1981; Brindley et al. 1986; Delineau et al. 1994), among others.
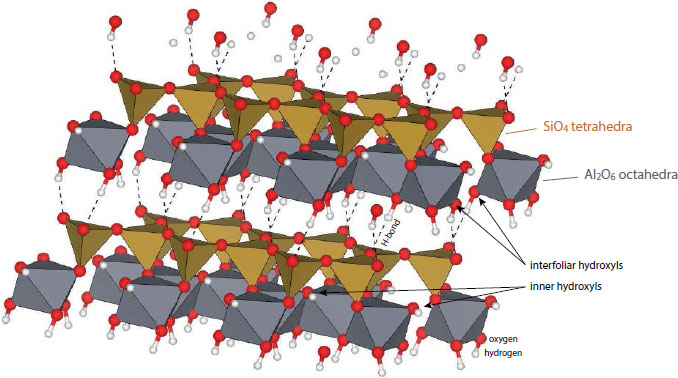
Schematic ideal structure of kaolinite. Modified after the model of Bish (1993) that takes the well-ordered kaolinite from Warsaw Geodes, Keokuk Region, Iowa, U.S.A., as reference. Structural model was obtained using VESTA software (Momma and Izumi 2011). Iron atoms can substitute for aluminum atoms in the octahedral sheets (not represented here).
Kaolin-like mineral phases, generically called “kaolinite,” have also been observed on the surface of Mars, from orbital detections only (Mustard et al. 2008; Carter et al. 2013; Ehlmann and Edwards 2014) by near-infrared remote sensing from the hyperspectral imager Compact Reconnaissance Imaging Spectrometer for Mars, onboard Mars Reconnaissance Orbiter (CRISM/ MRO) (Murchie et al. 2007). Determination of the geological origins of kaolinite has been mainly inferred from analysis of the geomorphological contexts and associated mineralogy from orbit. Apart from some localities where martian kaolinite has been detected in hydrothermal-driven contexts [Cross crater, Ehlmann et al. (2016); Kashira crater, Goudge et al. (2015b); Nili Fossae region, Ehlmann et al. (2009); Noctis Labyrinthus, Thollot et al. (2012)], this mineral is broadly detected in outcrops of sedimentary deposits where Fe/Mg-smectites-rich units are covered by Al-phyllosilicates-rich and kaolinite-rich units [Mawrth Vallis, Bishop et al. (2008), Loizeau et al. (2012), McKeown et al. (2009); Nili Fossae, Gaudin et al. (2011); Valles Marineris, Le Deit et al. (2010, 2012), Loizeau et al. (2018); global detections, Carter et al. (2015)]. Such occurrences of extensive exposures of Al-clays covering Fe/Mg-clays were interpreted as pedogenic paleoprofiles; major pieces of evidence of a former wetter and warmer climate in the past aqueous history of Mars (e.g., Carter et al. 2015). However, similar vertical successions of Al-clays over Fe/Mg-clays have also been interpreted by other authors as the product of hydrothermal events (e.g., Ehlmann et al. 2009). However, such controversy could, in some case, be solved by the study of mineral parageneses. For instance, kaolinite associated with jarosite, alunite, and opaline silica will be indicative of a hydrothermal-driven context, or at least of acid-saline origin on Earth (e.g., Swayze et al. 2014) or Mars (e.g., Ehlmann et al. 2016). In addition, for geologic systems with episodic activity, several generations of kaolins can be superimposed over time. Thus, it is not uncommon to observe the development of weathering kaolins from previous kaolins that formed in hydrothermal or even pedogenetic contexts (e.g., Balan et al. 2005b; Allard et al. 2020; Gaudin et al. 2020). Hence, the simple identification of kaolinite on a martian or a terrestrial outcrop is not enough to unambiguously interpret its geologic origin.
Kaolinite crystallinity has been suggested to reflect the physicochemical conditions where it forms, and thus its geological conditions of formation (Cases et al. 1982; Brindley et al. 1986; Balan et al. 2014; Dill 2016). Several physicochemical parameters affect the structural order of kaolinite, such as the temperature of formation (Dill 2016), pH of fluids (Fialips et al. 1999, 2000), chemical reaction kinetics and alteration process duration (Chittleborough and Walker 1988; Miyawaki et al. 1992; Fialips et al. 1999; Ryu et al. 2010), dissolution-reprecipitation processes (Beaufort et al. 1998; Cuadros et al. 2014), crystal chemistry of the altered primary minerals (Hughes and Brown 1979; Fialips et al. 1999), the presence of impurities (Mestdagh et al. 1980; Petit and Decarreau 1990; Allard et al. 1994; Clozel et al. 1994; Balan et al. 1999, 2000) or the association with organic matter (Dill 2016). In addition to providing information about the genesis process, the crystallinity of kaolinite particles is of great interest in the exploitation of this type of ore deposits. Industrial uses of exploited kaolins depend on their purity and their crystallinity because they affect the resulting physicochemical properties of the manufactured materials (Cases et al. 1982; Dubois et al. 1995; Murray 1999; Ndlovu et al. 2015; Weck et al. 2015; Awad et al. 2017). For example, a rather high crystallinity is required for paper manufacture (Murray and Lyons 1955; Baker and Uren 1982; Bundy and Ishley 1991).
Kaolinite crystalline order can be estimated using X-ray diffraction (XRD) (e.g., Hinckley 1962; Liétard 1977) or mid-infrared spectroscopy (MIR) (e.g., Farmer and Russel 1967; Brindley et al. 1986). However, this estimation via these analytical methods can be influenced by several external parameters. For MIR spectroscopy, samples are often prepared as KBr pellets, a procedure that can force the particles orientations and therefore influence the assessment of disorder degree (Bell et al. 1991; La Iglesia and Aznar 1996). XRD analyses need sample preparation, sample purification if desired, sometimes long-time acquisition and the determination of the crystallinity XRD indices are affected by the presence of minerals whose XRD peaks can be superimposed to the ones used for their calculation (e.g., kaolinite with quartz; Aparicio and Galán 1999). Contrary to these methods, near-infrared (NIR) spectroscopy presents numerous advantages for estimating kaolinite crystallinity. NIR spectroscopy can be used in remote sensing data (e.g., orbital data acquired at the martian surface) or by field spectrometers, if the spectral resolution, pixel purity, or surface mixing are moderate.
Overall, the crystallinity of kaolinite provides information on syn-genetic and post-genetic physicochemical conditions. Thus, the aim of this study is to investigate the near-infrared signature of kaolinite to see if this can be used as a proxy for its crystallinity. Ultimately, the comprehension of such a relationship could promote the use of NIR spectra of kaolinite as a proxy for the reconstruction of geological histories on both Earth and Mars (e.g., Swayze et al. 2014). The next section is a detailed background about the meaning of “crystallinity” for kaolinite and the information that can be obtained thereon using various analytical methods.
Background
The crystallinity of kaolinite
The term “crystallinity” refers to the regularity of the ordered atomic arrangement in a crystal. For kaolinite, it particularly refers to its structural order that is affected by different types of extended defects (e.g., stacking faults) and point defects (e.g., impurities, atomic interstitials, vacancies). Kaolinite is known to undergo structural defects such as stacking faults (Noble 1971; Bookin et al. 1989; Plançon et al. 1989; Artioli et al. 1995) or replacement of a kaolinite layer by a dickite layer (Beaufort et al. 1998; Balan et al. 2011). Impurities can also be incorporated as substitutions during crystal growth [e.g., Fe(III), Mestdagh et al. (1980), Cases et al. (1982), Gaite et al. (1993, 1997), Delineau et al. (1994), Balan et al. (1999, 2000), Petit et al. (1999); or Cr(III), Gaite and Mosser (1993)]. Natural radiations have also been shown to induce electronic point defects that are able to strongly modify the local degree of disorder in kaolinite (Gaite et al. 1997). It has been suggested that structural defects of kaolinite can be related to the condition of genesis of kaolinite or post-genesis phenomena (e.g., Brindley et al. 1986; see other references in the introduction section). For instance, acidic pH was related to the formation of well-crystallized kaolinites in hydrothermal experiments (Fialips et al. 2000).
Crystallinity of kaolinite has been investigated through several methods: e. g., X-ray diffraction (XRD) (Hinckley 1962; Fleurence and Nicolas 1964; Noble 1971; Hughes and Brown 1979; Brindley et al. 1986; Plançon et al. 1988, 1989; Plançon and Zacharie 1990; Amigo et al. 1994; Aparicio and Galán 1999; Aparicio et al. 2006); infrared and Raman spectroscopy (Parker 1969; Crowley and Vergo 1988; Paroz and Frost 1998; Shoval et al. 1999a, 1999b; Balan et al. 2014); scanning electron microscopy (SEM) (Fleurence and Nicolas 1964; Estéoule-Choux 1981); and electron paramagnetic resonance (EPR) (Mestdagh et al. 1980; Clozel et al. 1994; Gaite et al. 1997; Balan et al. 1999). Details are given below on XRD and near-infrared (NIR) spectroscopy, as these are the two methods used in this study. Generally, the estimation of crystallinity of kaolinite using the near-infrared spectrum is based on relative band depth or band depth ratios of the observed spectral features known as the “1.4 and 2.2 μm doublets” detailed in the following section, “Near-infrared signature of kaolinite” (Crowley and Vergo 1988; Clark et al. 1990; Cudahy et al. 2008; Laukamp et al. 2013). However, these spectral criteria are (1) user-dependent notably for determining the spectral continuum and anchor points during band depth calculations, and (2) sensitive to mineral mixing because many hydrated phases such as Al-smectites, hydrated silica, or sulfates are responsible for absorptions in these spectral ranges (Hunt and Salisbury 1970; Hunt et al. 1973; Hunt 1977). Hence, we propose here to investigate NIR spectral contributions with a new method minimizing the effects of mineral mixing and that is independent of spectral continuum (see “Material and methods: Infrared spectroscopy” section).
X-ray diffraction crystallinity indices: The Hinckley and Liétard Indices
Kaolinite crystallinity has been widely studied through X-ray diffraction patterns analysis and modeling, and several indices of crystallinity were proposed on this basis (Fleurence and Nicolas 1964; Noble 1971; Liétard 1977; Hughes and Brown 1979; Brindley et al. 1986; Plançon et al. 1988, 1989; Plançon and Zacharie 1990; Amigo et al. 1994; Aparicio and Galán 1999; Aparicio et al. 2006). In this study, we decide to use the two indices the most commonly used in the literature: the Hinckley Index (Hinckley 1962) and the Liétard Index (Liétard 1977). This combination can indeed provide complementary information on kaolinite disorder (see below).
The Hinckley Index (HI) consists of the ratio between (1) the sum of the A and B parameters, respectively, corresponding to the intensity of the (110) and (110,111) X‑ray diffraction peaks, measured from a background traced between the (020)/(110) inter-peak base and the (110,111)/(111) base-peak, and (2) the At parameter corresponding to the intensity of the (110) diffraction peak from the general XRD background (Fig. 2). According to Plançon et al. (1988), the HI is sensitive to the proportion of the well-ordered vs. high-defect kaolinite in a whole sample. The higher the HI, the more abundant the well-ordered kaolinite domains. Overall, HI values can range from <0.5 for poorly ordered kaolinite to 1.5 for well-ordered kaolinite (Aparicio and Galán 1999).
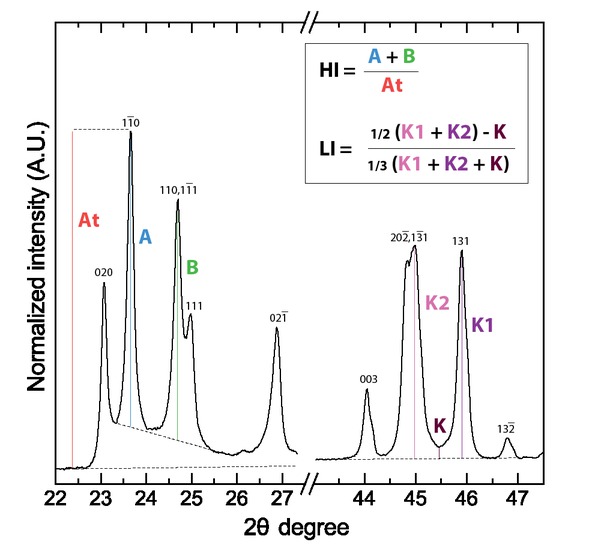
Determination of the Hinckley Index (HI) and Liétard Index (LI) using X-ray diffraction data. Chosen example is a diffractogram of the highly ordered DCV kaolinite sample from Decazeville (France).
The Liétard Index (here abbreviated as “LI” and not “R2” as is usual in the literature, to avoid any confusion with the correlation coefficient R2) is calculated as the ratio between (1) the half of the sum of the K2 and K1 parameters, corresponding, respectively, to the intensity of the (202,131) and (131) diffraction peaks, minus the intensity of the inter-peak between these two reflections corresponding to the parameter K, over the general XRD background, and (2) the third of the sum of the K, K2 (202,131) and K1 parameters (Fig. 2). The LI is defined to determine the presence of random defects in the (ab) plane, which can be interpreted as stacking faults, stacking disorder, or long-range structural imperfection (Liétard 1977; Cases et al. 1982; Gaite et al. 1993, 1997). According to Aparicio and Galán (1999), LI ranges from <0.7 for high-defect kaolinite to 1.2 for low-defect kaolinite.
Near-infrared signature of kaolinite
Near-infrared spectrum of kaolinite is characterized by absorptions in the regions around 7000 cm−1 (1.4 μm) and 4500 cm−1 (2.2 μm) related to Al2-OH vibrations, forming the so-called “1.4 and 2.2 μm doublets” (Fig. 3) [unless specified, all the details about NIR spectral signature of kaolinite are taken from Madejová et al. (2011) and Kloprogge (2019)]. The 7000 cm−1 (1.4 μm) absorption is characterized by a strong absorption near 7065 cm−1 (1.415 μm) that corresponds to the first overtone (2νOH) of the Al2-OH stretching fundamental mode of inner hydroxyl groups (νAl2-OH* = 3620 cm−1). The high-frequency side of this absorption is composed of several weaker absorptions from 7250 to 7100 cm−1 (1.380 to 1.408 μm) that are attributed to the 2νAl2-OH overtones of interfoliar Al2-OH groups (νAl2-OH = 3652–3669–3694 cm−1) (Farmer 1974; Balan et al. 2001). As recently stated by Balan et al. (2021), the overtone bands observed between 7400 and 7300 cm−1 (1.351 to 1.370 μm) are related to the double excitation of OH oscillators. The 4500 cm−1 (2.2 μm) complex absorption is characterized by a strong absorption near 4525 cm−1 (2.209 μm) that corresponds to the combination of Al2-OH stretching (νAl2-OH* = 3620 cm−1) and bending (δAl2-OH* = 915 cm−1) vibrations of the inner hydroxyl groups (Farmer 1974; Balan et al. 2001). The weaker absorptions from 4700 to 4550 cm−1 (2.127 to 2.200 μm) correspond to the combination of Al2-OH stretching (νAl2OH = 3652–3669–3694 cm−1) and bending (δAl2-OH = 935 cm−1) vibrations of the interfoliar OH groups (Farmer 1974; Balan et al. 2001). Following the method of spectral bands assignment of Baron and Petit (2016), we propose that the high-frequency absorptions located between 4850 and 4700 cm−1 (2.062 to 2.128 μm) can be attributed to the combination of Al2-OH stretching (νAl2OH = 3652–3669–3694 cm−1) and Si-O stretching (νSi-O = 1009–1031–1094–1115 cm−1; see Madejová et al. 2011).
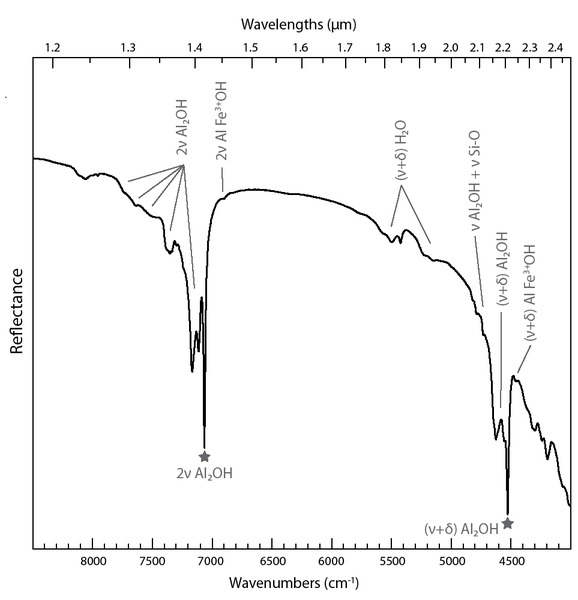
Near-infrared reflectance spectrum of the well-ordered kaolinite sample DCV from Decazeville, France. Vibration modes: ν = stretching; δ = bending. The gray stars indicate absorptions associated to the inner-OH vibrations.
Fe3+ can substitute for Al in the octahedral sheets of kaolinite. It can be incorporated during growth of kaolinite in aqueous solutions (Mestdagh et al. 1980; Petit and Decarreau 1990). Based on chemical analyses, Delineau et al. (1994) have shown that up to ~3 wt% of iron as Fe2O3 can be incorporated in natural kaolinite, while hydrothermal synthesis of Fe(III)-rich kaolinite has led to the formation of kaolinite crystals with up to ~7 wt% of iron (Petit and Decarreau 1990). Fe3+/Al octahedral substitution in kaolinite generates sharp absorptions at low frequency both for the 4500 and 7000 cm−1 features (Delineau et al. 1994; Petit et al. 1999). A combination of AlFe3+-OH stretching (νAlFe3+-OH = 3598 cm−1) and bending (δAlFe3+-OH = 875 cm−1) is responsible of the absorption near 4465 cm−1 (2.240 μm) (Petit and Decarreau 1990; Petit et al. 1999). The absorption near 7015 cm−1 (1.426 μm) is attributed to the 2νAlFe3+-OH overtone (Petit et al. 1999). Also, kaolin-group minerals can exhibit multiple absorptions in the 5000–5600 cm−1 range (1.780–2.000 μm) related to (ν+δ)H2O combination modes due to adsorbed water molecules at their edges (Madejová et al. 2011), but this near-infrared range will not be investigated in the present paper.
Materials and methods
Samples
Twenty-four samples of natural kaolinite were selected from various geological contexts, including hydrothermal deposits, sedimentary/diagenetic contexts, and continental weathering/tropical regoliths (Table 1). All samples were gently grounded into powders using an agate mortar and pestle for X-ray diffraction measurements and NIR Fourier-transform infrared reflectance (FTIR) spectroscopy. XRD and FTIR measurements both confirmed that all samples consist of kaolinite, with quartz and illite in minor quantities (<5 wt%) to avoid any influence on infrared absorption features (Table 1).
Details of the kaolinite samples used in this study
| Geological origin | Sample ID | Locality | HIa | LIb | References |
|---|---|---|---|---|---|
| Hydrothermal | DCV | Decazeville (FR) | 1.60 | 1.37 | Gaite et al. (1993); Balan et al. (1999) |
| GB1Ill | St Austell (U.K.) | 1.27 | 1.13 | Sheppard (1977); Cases et al. (1982); Psyrillos et al. (1998) | |
| Sedimentary | A1 | Manaus (BRZ) | 1.45 | 1.13 | Lucas et al. (1996); Fritsch et al. (2002, 2005, 2011); Balan et al. (2005b, 2007) |
| KGa-1a | Georgia (U.S.A.) | 1.04c | 1.03c | Patterson and Murray (1984); Pruett and Webb (1993); Moll (2001) | |
| KGa-1b | Georgia (U.S.A.) | 1.09d | n.c | Patterson and Murray(1984); Pruett and Webb (1993); Moll (2001) | |
| KGa-2 | Georgia (U.S.A.) | 0.28 | 0.68 | Patterson and Murray (1984); Pruett and Webb (1993); Moll (2001) | |
| BARIll | Charentes (FR) | 0.40 | 0.84 | Allard et al. (1994); Clozel et al. (1994) | |
| PDP3 | Charentes (FR) | 1.21 | 0.98 | Cases et al. (1982); Dubreuilh et al. (1984); Delineau et al. (1994) | |
| CHA2 | Charentes (FR) | 0.34 | 0.54 | Cases et al. (1982); Dubreuilh et al. (1984); Delineau et al. (1994) | |
| LussagnetQtz | Landes (FR) | 0.46 | 0.59 | Cases et al. (1982); Dubreuilh et al. (1984); Delineau et al. (1994) | |
| Pedogenesis | CO2-370 | Curicuriari (BRZ) | 1.04 | 0.94 | Fritsch et al. (2011); Mathian et al. (2020) |
| CO2-410 | Curicuriari (BRZ) | 0.96 | 0.92 | Mathian et al. (2020) | |
| CO2-450 | Curicuriari (BRZ) | 1.02 | 0.92 | Mathian et al. (2020) | |
| P2-150 | Içà Formation (BRZ) | 0.36 | 0.52 | Allard et al. (2020) | |
| P1-300 | Içà Formation (BRZ) | 0.14 | 0.54 | Allard et al. (2020) | |
| MA-BCa 200 | Karnataka (IND) | 0.40 | 0.70 | Mathian et al. (2019) | |
| MA-270 | Karnataka (IND) | 0.51 | 0.62 | Mathian et al. (2019) | |
| MA-BCb 470 | Karnataka (IND) | 0.55 | 0.66 | Mathian et al. (2019) | |
| MA-BCc 540 | Karnataka (IND) | 0.26 | 0.62 | Mathian et al. (2019) | |
| MA-C1-960 | Karnataka (IND) | 0.42 | 0.58 | Mathian et al. (2019) | |
| MA-C3C2-960 | Karnataka (IND) | 0.71 | 0.72 | Mathian et al. (2019) | |
| PénestinIll, Qtz | Pénestin (FR) | 1.51 | 1.26 | Boulvais et al. (2000); Gaudin et al. (2015) | |
| St-MichelIll, Qtz | St-Michel-Chef-Chef (FR) | 1.41 | 1.31 | Boulvais et al. (2000) |
Notes: Other observed mineral phases: Ill = illite; Qtz = quartz. “n.c” = “not calculated.” Country abbrevations: BRZ = Brazil, FR = France, IND = India, U.K. = United Kingdom, U.S.A. = United States of America.
a Hinckley Index (Hinckley 1962).
b Liétard Index (Liétard 1977).
c HI and LI values taken from Gaite et al. (1997).
d HI value taken from Pruett and Webb (1993).
X-ray diffraction
X-ray diffraction measurements have been conducted at the Institut de Minéralogie, de Physique des Matériaux et de Cosmochimie (IMPMC, UMR-CNRS 7590, Sorbonne Université, Paris, France). XRD analysis were performed on powders of the bulk samples with a Panalytical Pro MPD diffractometer with a X’Celerator detector, CoKα radiations in a θ–2θ goniometer geometry. Analyses were performed for a 2θ range of 3 to 90°, with steps of 0.017° and an acquisition time of 250 ms per step. The diffractograms (XRD data are available as Online Materials[1] Table OM1) were used to assess the mineralogical nature of the samples and to determine the degree of crystallinity ordering of kaolinite using the Hinckley Index (HI) (Hinckley 1962) and the Liétard Index (LI) (Liétard 1977). HI and LI were calculated from our XRD data according to the method described above in the background section (Fig. 2; Table 1).
Infrared spectroscopy
Reflectance near-infrared acquisitions have been conducted at the Institut de Chimie des Milieux et des Matériaux de Poitiers (IC2MP, UMR-CNRS 7282, Université de Poitiers, France). NIR spectra were acquired using a Thermo-Nicolet FTIR 6700 spectrometer equipped with a Thermo-Scientific Near-IR Integrating Sphere with an internal InGaAs detector, an internal gold reference material, and a tungsten-halogen white light source. All the setup of the integrating sphere is atmospherically controlled by a constant flow of dry air. Kaolinite powders were deposited onto the sapphire window of the integrating sphere at ambient temperature and humidity. Each spectrum is an accumulation of 100 scans with a spectral resolution of 2 cm−1 in the 4000 to 10 000 cm−1 spectral range (1.0 to 2.5 μm). Near-Infrared raw spectra are available in Online Materials[1] Table OM2.
We focused on the 4500 cm−1 (2.2 μm) and 7000 cm−1 (1.4 μm) absorption regions because they are indicative of metal-OH vibrations and very discriminant for the identification of kaolins (i.e., kaolinite possesses an easily recognizable spectral signature thanks to these absorption bands). As these two absorptions regions are composed of numerous overlapping components that are hardly distinguishable, we investigated their different spectral contributions through second and third derivative analyses (Coyne et al. 1990; Scheinost et al. 1998; Baron and Petit 2016; Belkić and Belkić 2018; Mathian et al. 2018). The two 4500 and 7000 cm−1 absorption regions were isolated from the initial spectra by truncation using two anchor points: at 4400 and 4890 cm−1 (2.045 and 2.273 μm) and at 6860 and 7450 cm−1 (1.342 and 1.458 μm), respectively. These points were also used to define the local baseline. All the following processing steps were done using the OriginPro software. The two absorption bands were interpolated using the exact cubic spline method. This method was used to numerically add points between observation points to gain precision when searching for position and shape of the spectral absorption bands without changing the initial real spectral resolution. As a consequence, the spectrum around 4500 cm−1 increased from 256 to 5120 points and for the one around 7000 cm−1 from 308 to 6140 points; thus, it leads to one data point every 0.1 cm−1. To minimize particle size and light scattering effects on the spectra, we decided to develop spectral criteria from second and third derivative analyses that also have the advantage of being independent from the spectral continuum (e.g., Aucott et al. 1988; Gombás et al. 2003). Second and third derivative analyses were carried out on interpolated spectra using the Savitzky-Golay filter (Savitzky and Golay 1964; Steinier et al. 1972) with a set of 260 points and a polynomial order of three. In the second derivative spectra, the main spectral contributions (abbreviated SC) are highlighted by upward peaks (or local maxima) (Fig. 4). The position and intensity values of these peaks were then extracted and compared to the LI and HI XRD indices related to the crystalline order of kaolinite (see “X-ray diffraction” section). In the third derivative spectra, the position difference between adjacent maxima and minima is related to the inflection points of the second derivative peaks and was used to account for the width of the SC (Fig. 4). Because peaks sharpen with increasing order of derivatives, this value is smaller than the full-width at half maximum (FWHM) of the original peak (Belkić and Belkić 2018). Although this value does not correspond to the original FWHM, it can be used to provide rapid access to an indication of the SC bandwidth and its variation from a sample to another. We propose to call it sharpened peak width (SPW). Ranges of spectral contributions centers, intensity values of the second derivative maxima, and SPW are presented in Table 2. Another version of this Table 2 with nanometers values and second derivative intensity variation in decimal format is available as Online Materials[1] Table OM3 and detailed for each sample in Online Materials[1] Tables OM4, OM5, and OM6.
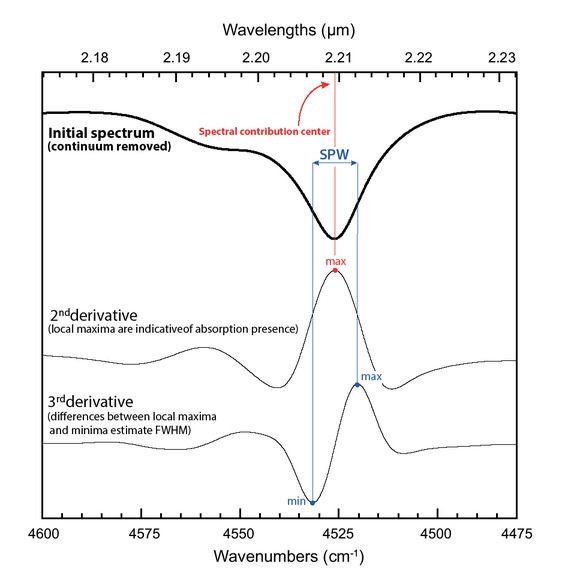
Illustration of the calculations of the spectral contribution center and its SPW in a kaolinite spectrum from the second and third derivatives, respectively. The chosen example is a zoom of the inner-OH vibration at 4525 cm−1 of the spectrum of the well-ordered kaolinite sample DCV from Decazeville, France.
Spectral characteristics of the spectral contributions (SC) measured through the second and third derivative analysis
| Contribution center position (cm−1) |
2nd derivative intensity of center position (a.u.) |
Sharpened peak width (SPW) (cm−1) |
|||||||
|---|---|---|---|---|---|---|---|---|---|
| SC No. | Range | Span | R2w. HI / LI (Corr. Dir.) | Range | Span | R2w. HI / LI (Corr. Dir.) | Range | Span | R2w. HI / LI (Corr. Dir.) |
| 4500 cm−1 absorption | |||||||||
| 1 | 4821.21–4827.07 | 5.86 | 0.03 / 0.06 | 8.8E-6 → 1.6E-4 | 1.5E-4 | 0.84/0.79 (+) | 9.51–22.48 | 12.97 | 0.04 / 0.10 |
| 2 | 4788.65–4792.97 | 4.32 | 0.28 / 0.39 | 2.9E-5 → 2.8E-4 | 2.5E-4 | 0.72 / 0.68 (+) | 9.80–13.74 | 3.94 | 0.02 / 0.00 |
| 3 | 4761.27–4771.74 | 10.47 | 0.64 / 0.79 (–) | –8.1E-6 → 2.2E-5 | 3.0E-5 | 0.02 / 0.01 | 12.87–23.06 | 10.18 | 0.33 / 0.41 |
| 4 | 4732.64–4733.89 | 1.25 | 0.09 / 0.11 | 1.7E-4 → 4.3E-4 | 2.6E-4 | 0.25 / 0.25 | 12.10–13.55 | 1.44 | 0.56 / 0.61 (–) |
| 5 | 4703.24–4708.72 | 5.48 | 0.04 / 0.01 | –8.6E-5 → –6.8E-6 | 7.9E-5 | 0.54 / 0.60 (+) | 11.14–24.88 | 13.74 | 0.55 / 0.56 (+) |
| 6a | 4675.67–4678.65 | 2.98 | 0.00 / 0.00 | –2.0E-4 → –1.4E-4 | 5.9E-5 | 0.49 / 0.48 | 7.01–11.14 | 4.13 | 0.18 / 0.25 |
| 7 | 4642.72–4647.81 | 5.09 | 0.88 / 0.87 (+) | 1.9E-4 → 5.0E-4 | 3.1E-4 | 0.78 / 0.76 (+) | 12.30–14.22 | 1.92 | 0.08 / 0.13 |
| 8 | 4626.10–4630.14 | 4.03 | 0.76 / 0.78 (–) | 2.7E-4 → 5.5E-4 | 2.8E-4 | 0.86 / 0.88 (+) | 10.95–13.55 | 2.59 | 0.44 / 0.45 |
| 9a | 4603.81–4606.69 | 2.88 | 0.24 / 0.39 | –2.3E-5 → 4.9E-5 | 7.1E-5 | 0.06 / 0.03 | 7.01–24.69 | 17.68 | 0.39 / 0.45 |
| 10a | 4586.33–4589.88 | 3.55 | 0.80 / 0.09 | –1.6E-5 → 1.5E-5 | 3.1E-5 | 0.61 / 0.01 | 10.86–13.16 | 2.31 | 0.04 / 0.24 |
| 11 | 4559.14–4561.54 | 2.40 | 0.85 / 0.86 (–) | 3.3E-5 → 4.1E-4 | 3.8E-4 | 0.89 / 0.95 (+) | 15.56–20.27 | 4.71 | 0.19 / 0.24 |
| 12b | 4525.42–4527.06 | 1.63 | 0.01 / 0.01 | 2.2E-3 → 4.5E-3 | 2.3E-3 | 0.38 / 0.38 | 11.24–13.07 | 1.83 | 0.66 / 0.73 (–) |
| 13a | 4482.19–4485.94 | 3.75 | 0.12 / 0.07 | –3.1E-4 → –2.3E-4 | 8.0E-5 | 0.04 / 0.08 | 19.89–26.99 | 7.11 | 0.57 / 0.67 |
| 14c | 4452.60–4464.42 | 11.82 | 0.40 / 0.44 | 1.6E-5 → 5.6E-4 | 5.5E-4 | 0.46 / 0.47 | 10.66–14.41 | 3.75 | 0.01 / 0.03 |
| 15 | 4418.21–4425.32 | 7.11 | 0.01 / 0.01 | –1.4E-5 → 2.8E-5 | 4.2E-5 | 0.09 / 0.09 | 8.55–16.91 | 8.36 | 0.07 / 0.02 |
| 7000 cm−1 absorption | |||||||||
| 16a | 7431.65–7439.18 | 7.52 | 0.45 / 0.38 | –2.8E-5 → 9.9E-6 | 3.8E-5 | 0.28 / 0.28 | 10.70–24.01 | 13.31 | 0.35 / 0.40 |
| 17 | 7387.68–7393.17 | 5.50 | 0.01 / 0.00 | 4.0E-5 → 2.5E-4 | 2.1E-4 | 0.78 / 0.80 (+) | 12.63–24.50 | 11.86 | 0.09 / 0.10 |
| 18 | 7352.67–7359.03 | 6.37 | 0.22 / 0.17 | 2.6E-5 → 9.2E-5 | 6.7E-5 | 0.74 / 0.75 (+) | 11.28–17.55 | 6.27 | 0.58 / 0.49 (–) |
| 19a | 7332.61–7336.85 | 4.24 | 0.18 / 0.22 | 6.1E-6 → 1.3E-4 | 1.3E-4 | 0.84 / 0.86 (+) | 11.57–13.89 | 2.31 | 0.03 / 0.01 |
| 20 | 7299.05–7305.80 | 6.75 | 0.74 / 0.83 (–) | –1.4E-5 → 7.7E-5 | 9.1E-5 | 0.81 / 0.85 (+) | 14.47–18.42 | 3.95 | 0.08 / 0.02 |
| 21 | 7270.12–7276.00 | 5.88 | 0.23 / 0.31 | –8.7E-5 → –3.9E-6 | 8.3E-5 | 0.77 / 0.86 (+) | 8.29–19.87 | 11.57 | 0.15 / 0.12 |
| 22 | 7237.04–7241.18 | 4.15 | 0.23 / 0.26 | 4.3E-7 → 1.2E-4 | 1.2E-4 | 0.01 / 0.01 | 13.69–23.63 | 9.93 | 0.38 / 0.34 |
| 23 | 7167.99–7174.16 | 6.17 | 0.64 / 0.68 (–) | 1.8E-4 → 9.9E-4 | 8.2E-4 | 0.92 / 0.93 (+) | 16.20–32.50 | 16.30 | 0.24 / 0.29 |
| 24 | 7111.38–7122.95 | 11.57 | 0.86 / 0.87 (+) | 1.1E-5 → 1.0E-3 | 1.0E-3 | 0.84 / 0.86 (+) | 18.03–42.14 | 24.11 | 0.11 / 0.17 |
| 25b | 7064.02–7066.14 | 2.12 | 0.32 / 031 | 2.5E-3 → 5.3E-3 | 2.8E-3 | 0.49 / 0.40 | 13.69–15.82 | 2.12 | 0.70 / 0.73 (–) |
| 26c | 7011.17–7016.67 | 5.50 | 0.26 / 0.26 | –7.1E-5 → 3.0E-4 | 3.7E-4 | 0.19 / 0.22 | 14.08–34.82 | 20.73 | 0.01 / 0.00 |
| 27 | 6944.73–6958.61 | 13.89 | 0.15 / 0.25 | –1.8E-5 → 2.8E-5 | 4.7E-5 | 0.08 / 0.13 | 8.29–31.44 | 23.15 | 0.11 / 0.12 |
Notes: For each calculated spectral parameter, correlation value (R2) and direction (negative/positive) are given. Another version of this Table 2 (with nanometers values and second derivative intensity variation in decimal format) is available as Online Materials[1] Table OM3. “Corr. Dir.” = Correlation direction. (–) = negative correlation. (+) = positive correlation. No indication when there is no strong correlation. In italic = correlations calculated by removing the following samples: well-ordered DCV kaolinite sample for intensities, disordered P2-150 & P1-300 kaolinite samples for SPW. Range = range in feature position/2nd derivative intensity/SPW; Span = feature position/second derivative intensity/SPW variation.
a Not observed for all samples.
b Inner hydroxyls Al2OH vibrations.
c Inner hydroxyls AlFe3+OH vibrations.
Results
X-ray diffraction indices
XRD patterns and related indices calculations show that our samples exhibit a wide range of crystallinity from disordered to highly ordered kaolinite (Table 1). HI values range from 0.14 (P1-300 sample) to 1.60 (DCV sample) and LI values from 0.52 (P2-150 sample) to 1.37 (DCV sample). The HI and LI are well correlated (R2 = 0.903; Fig. 5), but the correlation is far from perfect. It shows that although these two different indices give consistent results reflecting global kaolinite crystallinity, they also highlight the presence of several types of defects, as mentioned above (point defects, stacking faults, etc.).
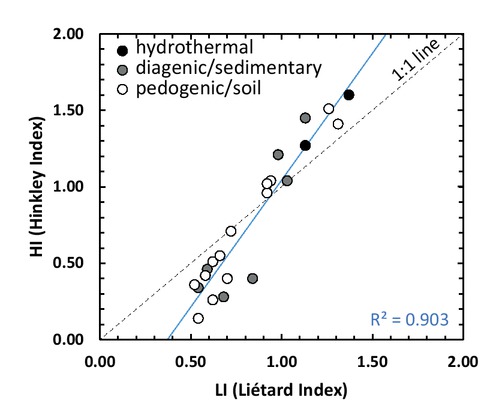
Diagram illustrating the relationship between the Hinckley and Liétard Indices.
We investigated the link between kaolinite crystallinity and its geological context (see Fig. 5). Kaolinite samples from soils have HI values ranging from 0.14 to 1.51 and LI values ranging from 0.52 to 1.31. Sedimentary kaolinites have HI values ranging from 0.28 to 1.45 and LI values ranging from 0.54 to 1.13. Hydrothermal kaolinites have high-HI and -LI values ranging from 1.27 to 1.60 and 1.13 to 1.37, respectively. Consequently, all geological environments can provide highly ordered kaolinite samples: maximum HI and LI are 1.60 and 1.37, respectively for hydrothermal samples, 1.45 and 1.13 for sedimentary contexts, 1.51 and 1.31 for pedogenic samples. By contrast, hydrothermal context is the only geological environment that does not exhibit low-ordered kaolinite; minima HI and LI are 1.27 and 1.13, respectively, when pedogenic and sedimentary contexts exhibit a wide range of kaolinite crystallinities. Hence, only pedogenic and sedimentary contexts provide low-ordered kaolinite.
Near-infrared observations and parameters
NIR spectra of kaolinite show that both the 4500 and 7000 cm−1 regions display complex absorption bands typical of kaolinite. In the Figures 6a and 6b, spectra are colorized and ordered according to LI values, from the least ordered samples (blue spectra at the bottom) to the most ordered one (red spectra at the top). Visually, many absorptions become sharper and more intense with increasing crystallinity. This is clearly visible for absorptions linked to inner-OH vibrations at 4525 and 7065 cm−1, and for absorptions at ~4560, 4630, 4645, 4730, 4790, 4825, 7115, 7170, 7240, 7278, and 7335 cm−1 (pointed with black arrows on Figs. 6a and 6b). Some are so weak on low-crystallinity spectra that they are barely observable. Some of our samples exhibit very weak absorptions at 4465 and 7015 cm−1 (2.240 and 1.426 μm) indicative of Fe3+/Al substitutions (Figs. 6a and 6b). These absorptions are present in both disordered and ordered kaolinite samples, and their intensities and widths do not appear to be related to the crystalline order.
Second derivative curves are plotted in Figures 7a and 7b. Both for the 4500 and 7000 cm−1 absorption regions, second derivative curves show multiple spectral contributions. Identified spectral contributions were numerated from 1 to 27 following increasing wavenumbers. The 4500 cm−1 region displays 15 main spectral contributions (SC1 to SC15), and the 7000 cm−1 one displays 12 main SCs (SC16 to SC27). Visually, the majority of these spectral contributions remain at the nearly same position from one spectrum to another. However, a detailed investigation reveals that their position slightly varies. The position of each spectral contribution was extracted by calculating local maximum. Range and variation values (=span) are given in Table 2 (another version of this Table 2 with nanometers values and second derivative intensity variation in decimal format is available as Online Materials[1] Table OM3). Among the 27 SCs, some show positions that shift over up to 14 cm−1 from one sample to another. SC3, SC14, SC24, and SC27 are the four spectral contributions displaying the larger shifts: 10.5, 11.8, 11.6, and 13.9 cm−1, respectively. The other spectral contributions exhibit smaller shifts down to almost 1 cm−1 (SC4, SC12, SC25). Fe3+Al-OH related spectral contributions exhibit shifts over 11.8 cm−1 (SC14) and 5.5 cm−1 (SC26). In contrast, inner-OH spectral contributions are almost fixed and shift over only 1.6 cm−1 (SC12) and 2.1 cm−1 (SC25). Most SCs on the second derivative curves (Fig. 7) also display important intensity variations (Table 2). This is most striking for SC12, SC14, SC23, SC24, and SC25.
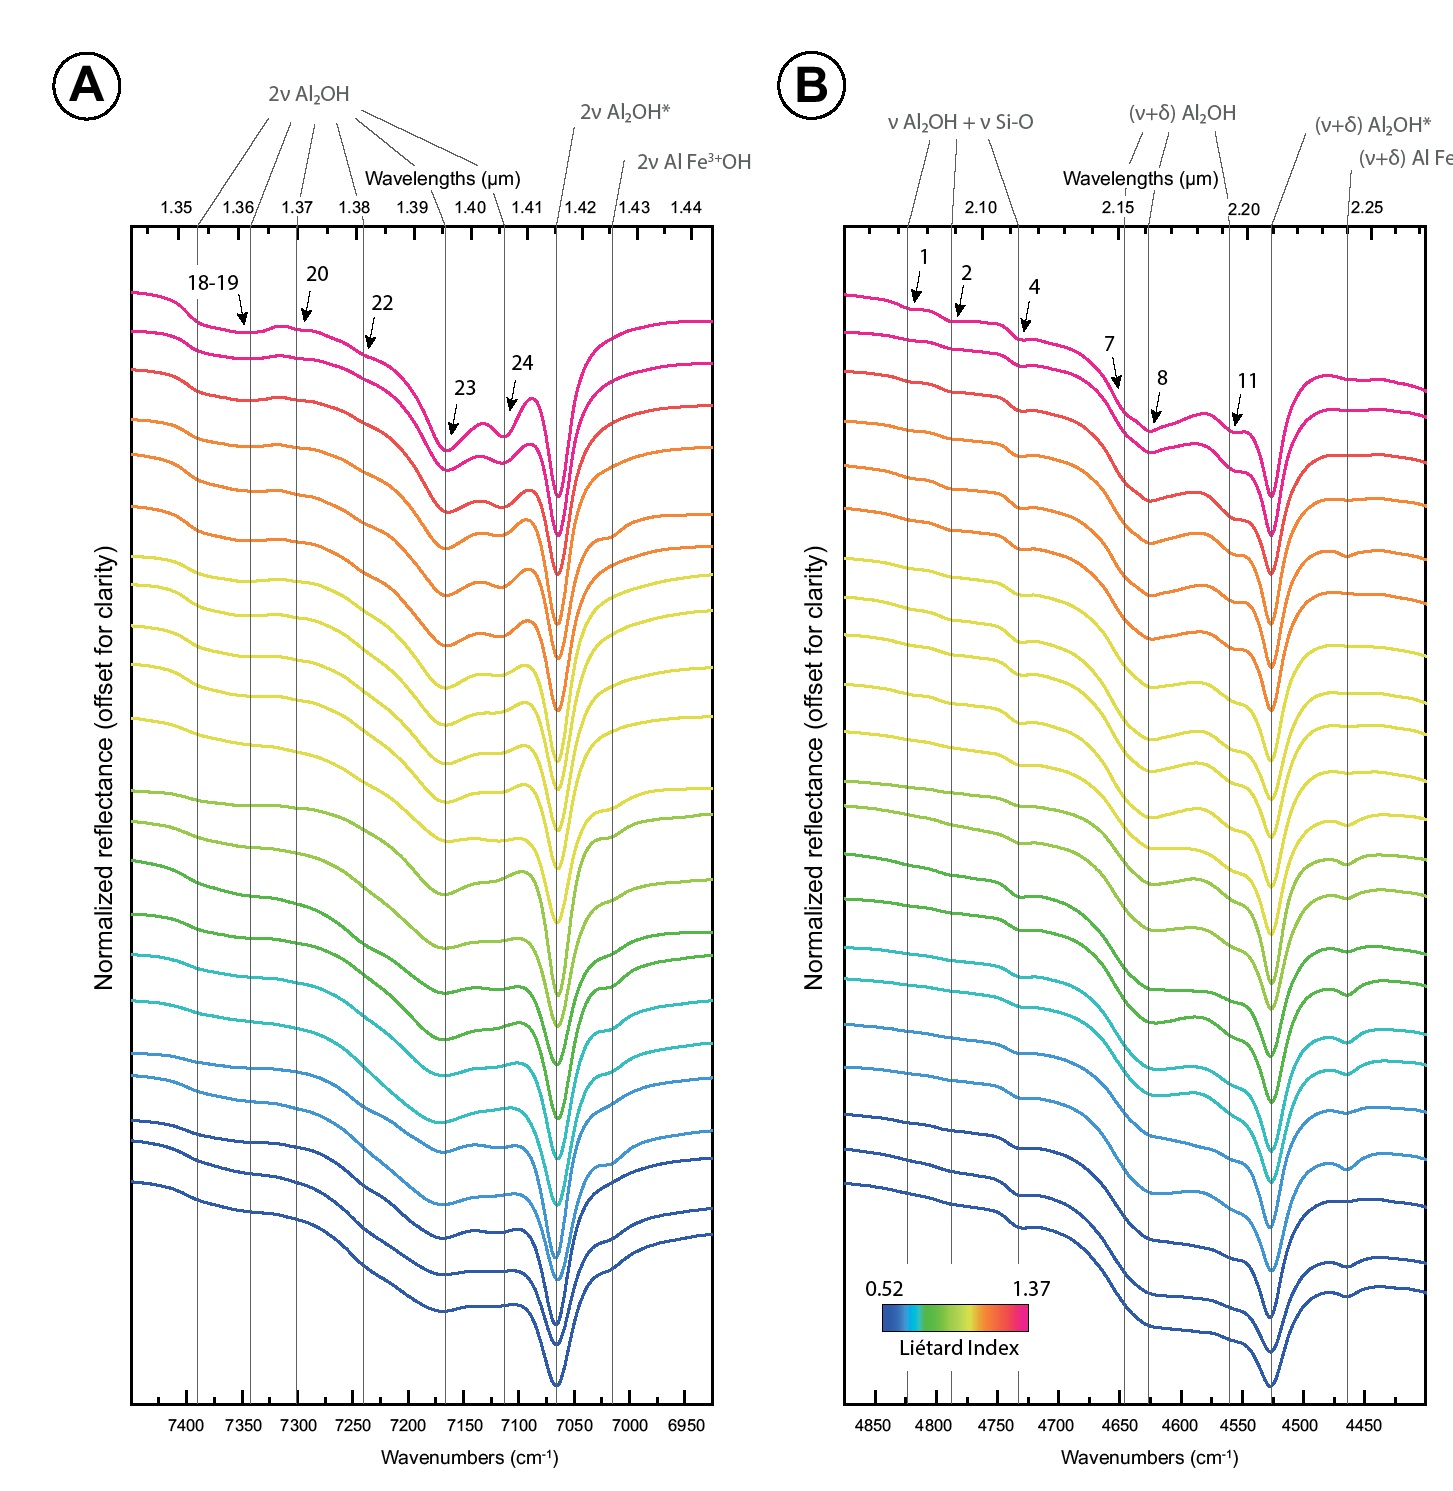
Near-infrared reflectance spectra of the two absorption bands at 7000 cm−1 (a) and 4500 cm−1 (b) of terrestrial kaolinites. Spectra are colorized according to the Liétard Index LI values that increase with the crystalline order (key at bottom of spectral plot). Vibrations modes: ν = stretching; δ = bending. The asterisk indicates absorptions associated to the inner-hydroxyl vibrations. The black arrows point to absorptions that get more complex and/or intense as the crystallinity increases (numbers on top of black arrows indicate the spectral contributions SC identified with second derivatives; see Fig. 7 and Table 2).
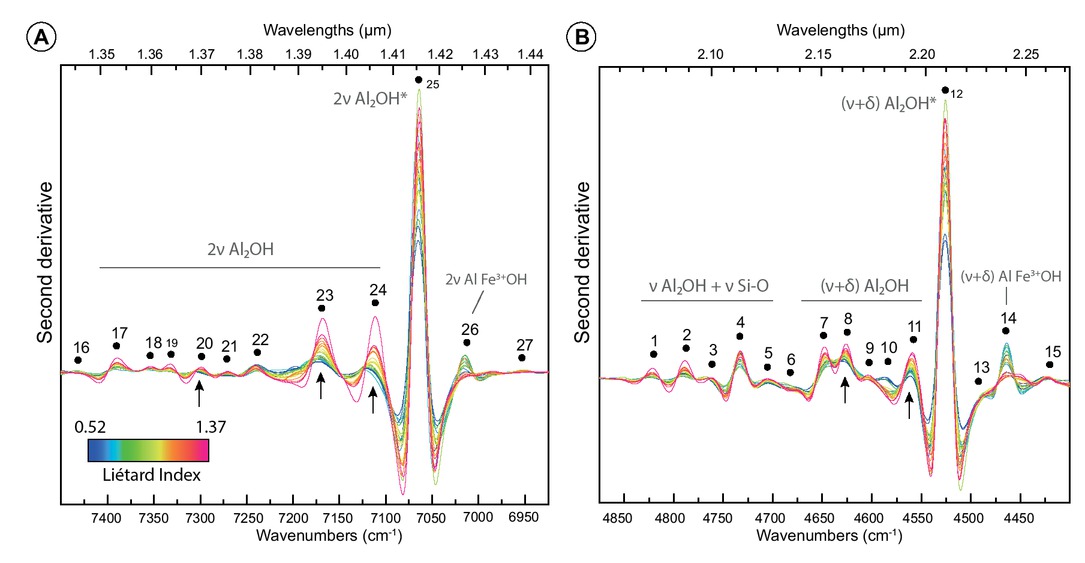
Second derivative spectra of the two absorption bands at 7000 cm−1 (a) and 4500 cm−1 (b) of terrestrial kaolinites. Spectra are colorized according to the Liétard Index LI values that increase with the crystalline order (key at bottom of spectral plot). Vibration modes: ν = stretching; δ = bending. The asterisk indicates absorptions associated to the inner-hydroxyl vibrations. Black dots indicate spectral contributions SC that were found through second derivative analysis. Black arrows point to remarkable “rainbow fan” distribution features caused by second derivative intensity regularly increasing with Liétard Index. Experimental spectral resolution is about 2.0 cm−1, numerically increased resampled to 0.1 cm−1 using the cubic spline interpolation method.
To investigate bandwidth evolution, we estimated the sharpened peak width (SPW) (see Methods section) on the third derivative curves. SPW values and their variations are given in Table 2. SPW values range from 7.0 to 24.1 cm−1. Some SCs values of SPW strongly vary from a sample to another, while others almost do not vary. The strongest SPW variation is observed for SC24: 24.1 cm−1 (18.0 to 42.1 cm−1). The smallest variation is observed for SC4: 1.4 cm−1 (12.1 to 13.5 cm−1). Inner-OH related absorptions at 4525 cm−1 (SC12) and 7065 cm−1 (SC25) vary weakly: over 1.8 cm−1 (SC12) and 2.1 cm−1 (SC25), respectively. The AlFe3+-OH related spectral contributions at 4460 cm−1 (SC14) and 7015 cm−1 (SC26) display contrasting SPW variations. SC14 varies weakly, over 3.8 cm−1, when SC26 varies strongly, over 20.7 cm−1.
In addition, to better understand the spectral evolution of each contribution, we compared the different spectral criteria (position center shifts, second derivative maxima intensities and SPW) between them. The different correlations between spectral parameters, expressed as correlation coefficients R2 based on linear or exponential fits, are presented in the Table 3. Best correlations between second derivative maxima intensities and shifts of the SC position are obtained for eight spectral contributions (interfoliar-OH or OH + lattice vibrations: SC2, SC7, SC8, SC11, SC20, SC23, SC24; inner-OH: SC26) with mostly negative correlations (6 out of 8). This means that, in most cases, when the spectral contribution center shifts toward high wavenumber (i.e., high frequency) its intensity decreases (e.g., 4560 cm−1 SC11 in Fig. 8a; 7170 cm−1 SC23 in Fig. 8b). Concerning correlations between SPW and SC positions, only three spectral contributions display a fairly good correlation: SC3 (R2 = 0.52), SC17 (R2 = 0.43), and SC23 (R2 = 0.73). In this case, correlation direction does not supply additional information as there are two positive correlations and one negative (e.g., 4765 cm−1 SC3 in Fig. 8c; 7170 cm−1 SC23 in Fig. 8d). Only three SCs present significative correlation between their second derivative maxima intensities and SPW values. Among these, the inner-OH related vibrations (SC12 and SC25) show high-R2 values: 0.80 and 0.76, respectively, with both negative correlations: the more intense the spectral contribution, the sharper it is (e.g., 4525 cm−1 SC12 in Fig. 8e; 7065 cm−1 SC25 in Fig. 8f). The SC18 has a R2 equal to 0.42 with a negative correlation too.
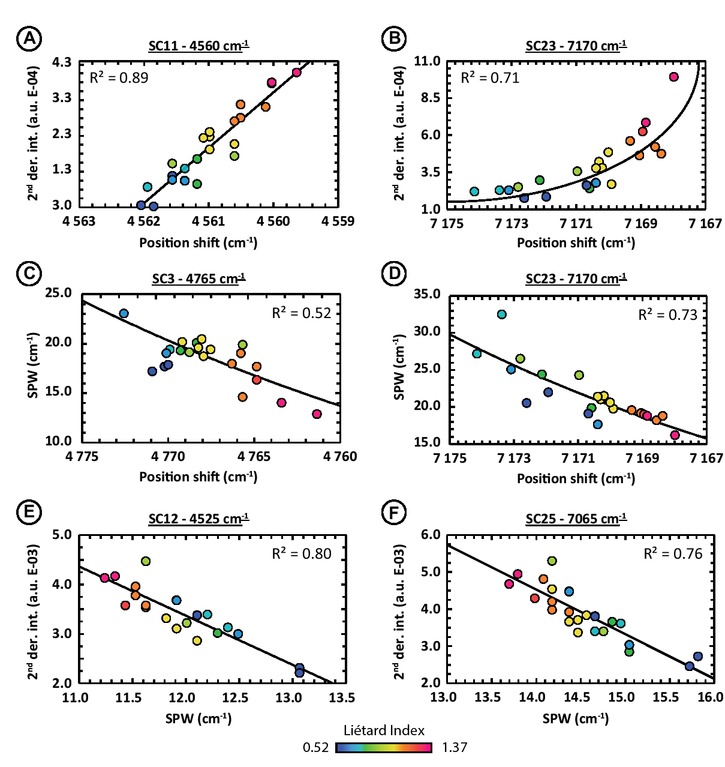
Relationship between the different spectral parameters. (a) Second derivative local maxima intensities as function of the shifts in position of the 4560 cm−1 SC11. (b) Second derivative local maxima intensities as function of the shifts in position of the 7170 cm−1 SC23. (c) SPW values as function of the shifts in position of the 4765 cm−1 SC3. (d) SPW values as function of the shifts in position of the 7170 cm−1 SC23. (e) Second derivative local maxima intensities as function of the SPW values of the 4525 cm−1 SC12. (f) Second derivative local maxima intensities as function of the SPW values of the 7065 cm−1 SC25. Data points are colorized according to the Liétard Index LI values that increase with the crystalline order (key at bottom of spectral plot). Experimental spectral resolution is about 2.0 cm−1, numerically resampled to 0.1 cm−1 using the cubic spline interpolation method.
Correlation coefficients (R2) of variations between spectral parameters
| SC No. | Intensity vs. position center (Corr. dir.) | SPW vs. position center (Corr. dir.) | Intensity vs. SPW (Corr. dir.) |
|---|---|---|---|
| 4500 cm−1 absorption | |||
| 1 | 0.03 | 0.01 | 0.23 |
| 2 | 0.46 (–) | 0.37 | 0.02 |
| 3 | 0.00 | 0.52 (+) | 0.00 |
| 4 | 0.03 | 0.00 | 0.08 |
| 5 | 0.04 | 0.06 | 0.19 |
| 6a | 0.00 | 0.28 | 0.01 |
| 7 | 0.71 (+) | 0.07 | 0.02 |
| 8 | 0.83 (–) | 0.39 | 0.30 |
| 9a | 0.15 | 0.06 | 0.24 |
| 10a | 0.40 | 0.00 | 0.17 |
| 11 | 0.89 (–) | 0.23 | 0.27 |
| 12b | 0.00 | 0.00 | 0.80 (–) |
| 13a | 0.13 | 0.34 | 0.33 |
| 14c | 0.32 | 0.02 | 0.17 |
| 15 | 0.15 | 0.11 | 0.12 |
| 7000 cm−1 absorption | |||
| 16a | 0.41 | 0.06 | 0.16 |
| 17 | 0.00 | 0.43 (–) | 0.13 |
| 18 | 0.36 | 0.05 | 0.42 (–) |
| 19a | 0.45 | 0.10 | 0.06 |
| 20 | 0.80 (–) | 0.01 | 0.03 |
| 21 | 0.12 | 0.01 | 0.32 |
| 22 | 0.13 | 0.00 | 0.35 |
| 23 | 0.71 (–) | 0.73 (+) | 0.31 |
| 24 | 0.89 (–) | 0.15 | 0.10 |
| 25b | 0.09 | 0.18 | 0.76 (–) |
| 26c | 0.55 (+) | 0.04 | 0.30 |
| 27 | 0.07 | 0.02 | 0.23 |
Notes: Corr. dir. = Correlation direction. (–) = negative correlation. (+) = positive correlation. No indication when there is no strong correlation. In italic = calculated on an exponential fit.
a Not observed for all samples.
b Inner hydroxyls Al2OH vibrations.
c Inner hydroxyls AlFe3+OH vibrations.
X-ray diffraction indices vs. near-infrared parameters
Dark arrows in the Figures 7a and 7b point to remarkable features: for some SCs, spectra are arranged into a “rainbow fan,” because of the color code used for Liétard index. This is most striking for SC8, SC11, SC20, SC23, and SC24. This confirms that, as already seen in Figure 6, peak intensity varies according to LI, and hence with crystallinity for some SCs. Some other SCs show important intensity variations, but with less obvious or no relationship with LI. To check for a possible quantitative link between kaolinite near-infrared spectrum and crystallinity based on HI and LI indices, we compared the calculated parameters (intensity, position, and SPW) of all spectral contributions with the values of the XRD indices (HI and LI). We present below only the best correlation cases where NIR parameters and XRD indices are linked. We also present the specific cases of SC12 and SC25 related to inner-OH, as well as SC14 and SC26 related to Fe3+Al-OH vibrations. In parallel, we decided to discard spectral contributions that were absent in too many samples: SC6, SC9, SC10, SC13, SC16, and SC19.
Variations in SC position
In the 4500 cm−1 absorption region, the positions of SC3, SC7, SC8, and SC11 correlate with the Hinckley Index with R2 equal to 0.64, 0.88, 0.76, and 0.85, respectively, and with the Liétard Index with R2 equal to 0.79, 0.87, 0.78, and 0.86. Among them, three spectral contributions, the SC7, SC8, and SC11, show feature position shifts with a low range of variations: 5.1, 4.0, and 2.4 cm−1 each, respectively. Conversely, the SC3 has a wider range of variations, over 10.5 cm−1 (Figs. 9a and 9b). SC7, which displays a varied range of 5.1 cm−1, also shows a high correlation with XRD indices. However, this contribution is not found in all samples, instead of SC8 that is also characterized by both a high R2 and a similar variation range of 4.0 cm−1 (Figs. 9c and 9d). Inner-OH related spectral contribution SC12 displays a small range of about 1.6 cm−1 and a correlation close to zero with HI and LI. The SC14, accounting for octahedral Fe3+Al-OH vibrations, varies over 11.8 cm−1 and has low correlation coefficients: R2 = 0.40 with HI and R2 = 0.44 with LI.
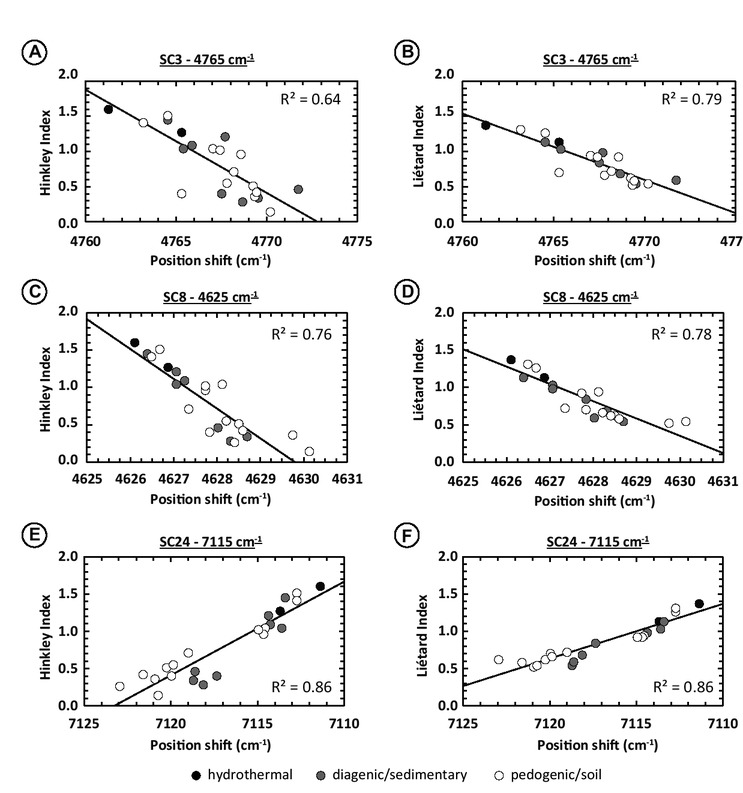
Relationship between the shifts in position of different SCs and XRD indices. (a) Shifts in position of the 4765 cm−1 SC3 as function of the Hinckley Index (HI). (b) Shifts in position of the 4765 cm−1 SC3 as function of the Liétard Index (LI). (c) Shifts in position of the 4625 cm−1 SC8 as function of the HI. (d) Shifts in position of the 4625 cm−1 SC8 as function of the LI. (e) Shifts in position of the 7115 cm−1 SC24 as function of the HI. (f) Shifts in position of the 7115 cm−1 SC24 as function of the LI. Experimental spectral resolution is about 2 cm−1, numerically resampled to 0.1 cm−1 using the cubic spline interpolation method.
In the 7000 cm−1 absorption region, the position of the SC20 has R2 equal to 0.74 and 0.83 with HI and LI, respectively, the SC23 has R2 equal to 0.64 and 0.68, and the SC24 has R2 equal to 0.86 and 0.87. This time, the spectral contribution with the highest R2 among the three (SC24) also displays the largest shift range: 11.6 cm−1 (Figs. 9e and 9f). Inner-OH related spectral contribution SC25 displays low R2 = 0.32 both for the Hinckley and Liétard Index. However, the SC25 varies over a narrow range, only 2.1 cm−1. The octahedral Fe3+Al-OH vibrations SC26 have lower shifts over a rather large range (5.5 cm−1) but very low R2 (0.26 for both HI and LI).
For both the 4500 and 7000 cm−1 absorption regions, the spectral contributions displaying the best correlations in terms of position shifts in parallel with XRD indices’ variations show negative correlation with these; only SC7 and SC24 display positive correlations with HI and LI variations. This means that the higher the Hinckley and Liétard indices, the more ordered the kaolinite, the more the spectral contributions’ center positions shift toward low wavenumbers (i.e., low frequencies) or that these shifts reflect the appearance of new spectral contributions and growth (Swayze et al. 2014; see Fig. 9).
Variations in SC intensity. Second derivative intensities compared with the XRD indices give numerous correlations with high R2. For the 4500 cm−1 absorption region, six spectral contributions have R2 higher than 0.50. Among them, SC11 displays the highest R2 = 0.89 and 0.95 with the Hinckley and Liétard indices, respectively (Figs. 10a and 10b). The other spectral contributions are: SC1 (R2 = 0.84 with HI and 0.79 with LI; excluding DCV sample due to its strong crystallinity this sample is taken out from the overall trend defined by other samples that have more common crystallinities), SC2 (R2 = 0.72 and 0.68; excluding DCV sample), SC5 (R2 = 0.54 and 0.60), SC7 (R2 = 0.78 and 0.76; excluding DCV sample) and SC8 (R2 = 0.86 and 0.88; excluding DCV sample). The SC 14 (Fe3+Al-OH vibrations) has R2 = 0.46 and 0.47 with Hinckley and Liétard Indices. The SC12 (inner-OH) has R2 = 0.38 both for Hinckley and Liétard Indices, thus bad correlations.
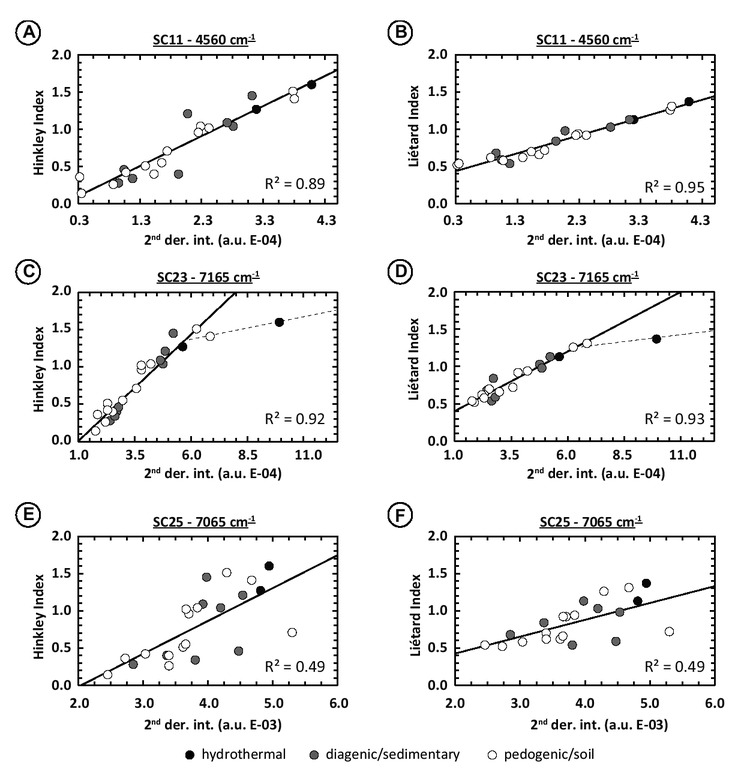
Relationship between the intensity of the second derivative maxima of different SCs and XRD indices. (a) Intensity variation of the 4525 cm−1 SC12 as function of the Hinckley Index. (b) Intensity variation of the 4525 cm−1 SC12 as function of the Liétard Index. (c) Intensity variation of the 7165 cm−1 SC23 as function of the Hinckley Index. (d) Intensity variation of the 7165 cm−1 SC23 as function of the Liétard Index. (e) Intensity variation of the 7065 cm−1 SC25 as function of the Hinckley Index. (f) Intensity variation of the 7065 cm−1 SC25 as function of the Liétard Index. Experimental spectral resolution is about 2 cm−1, numerically resampled to 0.1 cm−1 using the cubic spline interpolation method. Note that correlation coefficients for SC23 are calculated excluding the DCV sample (c and d figure parts). Dashed lines running through the DCV highly ordered sample were drawn to take into account the threshold effect explained in the subsection “Spectral significance of parameters variations” in the “Discussion” section.
Eight spectral contributions with R2 > 0.5 were found within the 7000 cm−1 absorption region. Among them, SC23 shows the highest R2 = 0.92 and 0.93 (excluding DCV sample) with the Hinckley Index and the Liétard Index, respectively (Figs. 10c and 10d). The other spectral contributions are: SC17 (R2 = 0.78 with HI and 0.80 with LI; excluding DCV sample), SC18 (R2 = 0.74 and 0.75), SC19 (R2 = 0.84 and 0.86; excluding DCV sample), SC20 (R2 = 0.81 and 0.85), SC21 (R2 = 0.77 and 0.86), and SC24 (R2 = 0.84 and 0.86; excluding DCV sample). Inner-OH related vibrations (SC25) have coefficients of correlation higher than in the 4500 cm−1 with values of 0.49 with HI and 0.40 with LI (Figs. 10e and 10f). By contrast, Fe3+Al-OH related vibrations (SC26) have lower R2 than in the 4500 cm−1 absorption case with values of 0.19 and 0.22 with the Hinckley and Liétard Index.
For all spectral contributions that show satisfying correlation coefficients, second derivative maxima intensities variations are positively correlated with the XRD indices: the higher the indices (i.e., the more ordered the kaolinite is), the higher the second derivative intensities (Fig. 10), thus the spectral contributions are intense. This explains the fact that the more ordered kaolinite, the more complex its spectrum is with numerous sharp absorption features in the Figures 6 and 7.
Variations in SC width. Sharpened peak width values show few good correlations with the Hinckley and Liétard Indices. Here, the spectral contributions that have SPW correlating better with the XRD indices are the SC12 and SC25, accounting for inner-OH vibrations. Both have similar R2: 0.66 and 0.73 with HI and LI for the SC12 (Figs. 11a and 11b), and of 0.70 and 0.73 for SC25 (Figs. 11c and 11d), calculated excluding P2-150 and P1-300 samples. The other spectral contributions with reasonably high R2 are SC4, SC5, SC8, SC18, and SC22. In the 4500 cm−1 absorption region, SC4 shows R2 = 0.54 and 0.62 with the Hinckley and Liétard Index (Figs. 11e and 11f), SC5 of about 0.55 and 0.56, and the SC8 of about 0.41 and 0.44. In the 7000 cm−1 absorption region, SC18 shows R2 = 0.58 and 0.51 with HI and LI. The spectral contributions associated with octahedral Fe3+Al-OH vibrations have very low R2: 0.15 and 0.30 for SC14 in the 4500 cm−1 absorption region and below 0.01 for both HR and LI for SC26 in the 7000 cm−1 region.
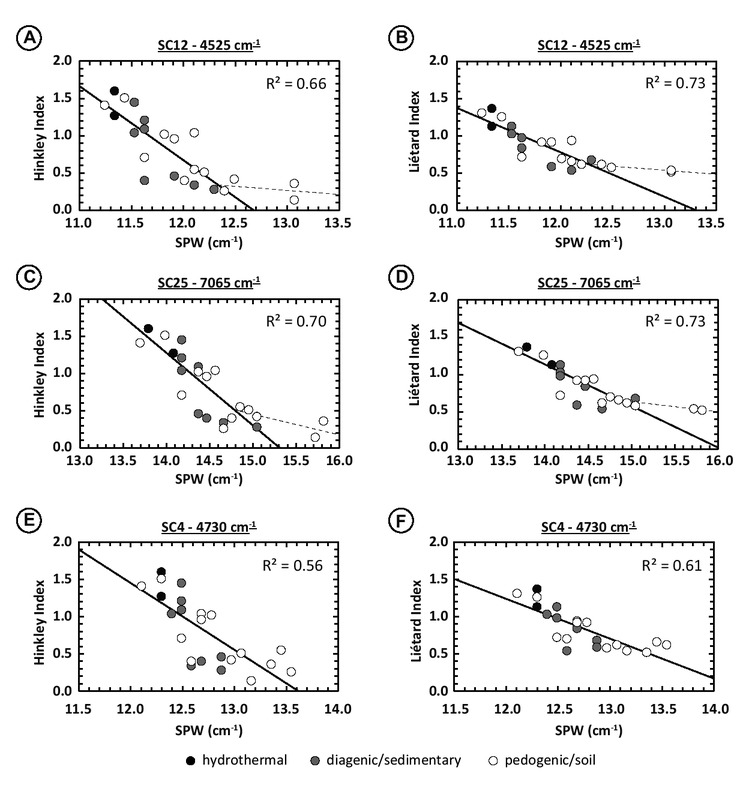
Relationship between the SPW of different SCs and XRD indices. (a) SPW variation of the 4525 cm−1 SC12 as function of the Hinckley Index. (b) SPW variation of the 4525 cm−1 SC12 as function of the Liétard Index. (c) SPW variation of the 7065 cm−1 SC25 as function of the Hinckley Index. (d) SPW variation of the 7065 cm−1 SC25 as function of the Liétard Index. (e) SPW variation of the 4730 cm−1 SC4 as function of the Hinckley Index. (f) SPW variation of the 4730 cm−1 SC4 as function of the Liétard Index. Experimental spectral resolution is about 2 cm−1, numerically resampled to 0.1 cm−1 using the cubic spline interpolation method. Note that correlation coefficients for SC12 and SC25 are calculated excluding the P2-150 and P1-300 samples (a, b, c, and d figure parts). Dashed lines running through the P2-150 and P1-300 poorly ordered samples were drawn to take into account the threshold effect explained in the subsection “Spectral significance of parameters variations” in the “Discussion” section.
All these spectral contributions show a negative correlation between SPW and XRD indices (except SC5): the higher the indices (i.e., the more ordered the kaolinite), the sharper the spectral contributions. This is to be put in parallel with the second derivative intensities variations that present positive correlations: the more ordered the kaolinite is, the more numerous and sharper the spectral contributions are (see Figs. 6 and 7).
Spectral parameters correlations and crystalline order variations. The combination of the best correlated spectral parameters in a diagram with the points colored according to the XRD indices shows a colorimetric evolution linked to crystallinity variations in most cases (Fig. 8), except for the spectral contributions SC17 (SPW vs. position) and SC26 (intensity vs. position). This observation is logical and explained by the fact that the spectral parameters of some SCs vary according to the kaolinite crystalline order as seen by the XRD indices. Such diagrams help to explain the “rainbow patterns” observed in the Figure 6 obtained after second derivative processing for the spectral contributions SC8, SC11, SC20, SC23, and SC24. Among them, the spectral contribution at 7170 cm−1 (SC23) related to interfoliar-OH vibration and forming the reflectance minimum of the high-frequency of the 7000 cm−1 doublets, is the one that presents the highest correlation in its own parameters and in connection with crystallinity variations. Indeed, SC23 position center shifts have R2 equal to 0.64 and 0.68 with HI and LI, R2 = 0.93 and 0.92 for the second derivative intensities, and R2 = 0.24 and 0.29 for the SPW. Therefore, it is not surprising that the combination between these parameters displays good correlations (R2 = 0.71 for intensity vs. position center, 0.73 for SPW and position center, 0.31 for intensity vs. SPW) and related to variations of the Hinckley and Liétard indices (Table 3; Figs. 8b and 8d).
Discussion
Estimating kaolinite crystallinity using NIR spectroscopy
Spectral significance of parameters variations. Lattice vibrations observed by Raman and thermal infrared spectroscopy are well known to be good proxies for order-disorder effects in minerals (Farmer 1974). The expected evolution of a Raman peak or an IR absorption along with an increase in crystallinity is a decrease of the bandwidth and an increase of amplitude, accompanied by a position shift. Thus, when a material is amorphous or disordered (e.g., like glassy material), the lattice vibrations have enlarged bands with low amplitude; a peak is then a bump. Observed in the mid-infrared range, hydroxyl vibrations reflect their close atomic environment in the unit cell of a material. Therefore, the evolution of their spectral properties is similar to those of lattice vibrations and can be interpreted in the same manner to understand crystal ordering. Near-infrared absorptions are overtones of fundamental OH vibrations and/or combinations of fundamentals with lattice vibrations; they can therefore be interpreted in the same way.
Concerning kaolinite, studies of its mid-infrared signature have shown that the absorption becomes more and more intense with an increase in the Hinckley Index value (Kloprogge 2019; and references therein). Likewise, modeling of the kaolinite fundamental OH-vibrations shows simulated spectra, derived from a perfect structure of thin platy particle (Balan et al. 2005a), that differ from the vibrations of natural samples in terms of bandwidth, intensity, and position. In the present study, as the XRD indices increase, the observed decrease in the SPW values (negative correlation) and increasing intensity (positive correlation) tends to reach the characteristic values of these modelized spectra. It, therefore, confirms that when the kaolinite is more ordered, it becomes closer in shape to thin platy particles. Shifts in terms of SCs positions are mainly directed toward low wave-numbers (i.e., low frequencies) as the crystallinity of kaolinite increases. However, no interpretation can be made on this observation of shifts. Indeed, in their study, Balan et al. (2005a) show shifts between simulated MIR spectrum and MIR acquisition on natural samples that can be toward lower and higher wavenumbers, proving that the direction of migration of center position is not correlated to the kaolinite crystalline degree.
For each spectral criterion, we estimated the relevance in estimating the crystallinity of kaolinite by calculating correlation coefficients with linear functions. In the case of intensity and SPW variations, it was necessary to remove one or two samples: the well-ordered DCV kaolinite sample for intensities and the disordered P2-150 and P1-300 samples for SPWs. As observed in Figures 10c, 10d, 11a, 11b, 11c, and 11d, all the samples align well along linear regression curves except these three samples depending on the considered case. These observations can be explained by threshold effects, which would be induced by the fact that X-ray diffraction, and therefore the indices calculated on XRD data, could be less sensitive to larger range ordering than vibrational spectroscopy. Thus, indices developed on near-infrared spectroscopy data would be more accurate to estimate the degree of crystalline order of kaolinite particles than XRD indices do, especially for samples presenting high or low degrees of crystalline order such as those encountered in this study.
Interfoliar hydroxyls groups and stacking order. All results converge to the fact that interfoliar Al2-OH vibrations are well correlated to the Hinckley and Liétard XRD indices. The results show that most of their numerous spectral contributions vary in position, intensity, and width in correlation with the Liétard Index. The Liétard Index estimates the presence of random defects in the c direction, which can be interpreted as stacking faults, stacking disorder or more generally long-range structural imperfection (Liétard 1977; Cases et al. 1982; Gaite et al. 1993, 1997). Defects in the c axis (i.e., stacking faults) induce perturbations of the interfoliar Al2-OH groups. Variations in the position and intensity of the spectral contribution related to interfoliar hydroxyl groups indicate variations in terms of stacking sequence, and hence, they could be used to estimate the degree of long-range crystalline order of kaolinite along the c axis. The results also show that these parameters are also well correlated with the Hinckley Index. The Hinckley Index is sensitive to the proportion of the well-ordered vs. high-defect kaolinite domains in a whole sample. Hence, the Hinckley Index is somehow sensitive in a lesser extent than the LI, to the proportion of kaolinite with or without stacking faults in a whole sample.
Second derivative intensities are efficient in evaluating the kaolinite stacking degree as many spectral contributions are very well correlated with the HI and LI. The characteristics of maxima in the second derivative curves (position and intensity) inform about the presence of inflection points in the reflectance NIR spectra, their intensity, and width (Mathian et al. 2018). Accordingly, second derivative maxima positions and their associated shifts can be used as an indication of the kaolinite stacking order. However, fewer spectral contributions showing position shifts are evidenced compared to the analysis of second derivative intensities (7 against 12). Moreover, out of the seven identified SCs, only two show shift ranges that are sufficient to be used as a proxy of the kaolinite crystallinity: SC3 at 4765 cm−1 (this absorption could be attributed to the combination of OH-stretching and Si-O stretching) and SC24 at 7115 cm−1. Unfortunately, the 4765 cm−1 absorption band is very weak even in a well-crystallized pure kaolinite sample (see Fig. 6a) and thus cannot be used for a reliable index of crystallinity. By contrast, the results indicate that the SC24 at 7115 cm−1 (1.405 μm) is intense in all of our spectra, and its large shift range (11.6 cm−1) make it suitable for a quick estimation of kaolinite stacking order (see Figs. 6b, 9e, and 9f).
Inner-hydroxyls groups and sharpened peak width. Third-derivative minima and maxima do permit calculation of the sharpened peak width (SPW) that is considered herein as a proxy for the full-width at half maximum (FWHM). The results show that SPW variations are better linked to crystallinity degrees when considering the inner-OH vibrations at 4525 and 7065 cm−1 (2.210 and 1.415 μm, respectively). Unlike the other spectral contributions (interfoliar Al2-OH vibrations discussed just above), the inner-Al2-OH vibrations do exhibit correlations between crystallinity and near-infrared signal only with SPW and not on the second derivative intensities and positions. Their SPW decreases with increasing crystallinity: the higher the degree of crystalline order, the narrower the inner-OH vibration band. This, therefore, shows that the inner-OH are also affected by crystallinity variations and, in particular, the stacking order degree. These changes in local symmetries will thus be able to modify the shape of the hexagonal cavity where the inner-OH vibrates. This structural modification should change the vibration properties of inner-OH. However, spectral variations of the inner-Al2-OH absorptions are minor compared to variations in interfoliar-Al2-OH. For example, the variations in the position of inner-OH are of the order of 2 cm−1, whereas they may be several tens of cm−1 for the interfoliar-OH. The same is true for SPW, except that SPW of interfoliar-OH is much less correlated with crystallinity indices than those of inner-OH. This can be explained by the fact that the changes in the volume of the hexagonal cavity are of a lower extent compared to the changes undergone by the OH in the interlayer space as the hexagonal space will only suffer from slight distortions. We can therefore assume that the vibration positions of the inner-OH should also vary according to the crystalline order, but that instrumental constraints (e.g., spectral resolution) do not permit us to detect and quantify them precisely, in contrast to the large variations of interfoliar-OH vibrations that are larger than the spectral resolution.
The case of Fe3+ in kaolinite. Fe3+ substitution in kaolinite has been proposed to increase the proportion of stacking defects, and several authors considered that structural Fe3+ in kaolinite could be used as a relevant proxy to estimate its crystallinity (Mestdagh et al. 1980; Brindley et al. 1986). In particular, the structural iron detected by EPR has been used as a sensitive probe of the degree of local crystalline order and shown to correlate to the Lietard index (Gaite et al. 1997). Besides, the concentration of structural iron was confirmed not to influence the degree of crystalline order in kaolinites from a lateritic profile with similar Fe contents but strongly contrasting crystallinities (Balan et al. 2000). In the NIR spectra of Fe3+-rich kaolinite samples, the absorption bands at 4460 and 7015 cm−1 (SC14 and SC26; 2.242 and 1.426 μm) indicate the presence of Fe3+ substitutions (Figs. 3, 6a, 6b, 7a, and 7b) (Delineau et al. 1994; Petit et al. 1999). Our results suggest that the shifts in position and intensity values of these octahedral AlFe3+-OH-related spectral contributions do not allow one to correctly estimate the crystallinity of our samples as indicated by the relatively low R2 with the HI and LI indices, below 0.50. It can be explained by the fact that the two spectral contributions are related to inner Al-Fe3+-OH vibrations, so to hydroxyls groups that are inside the hexagonal cavity as Al2-OH groups and oriented parallel to the layers (Delineau et al. 1994; Petit et al. 1999). It is, in a way, very similar to the inner Al2-OH vibration bands (at 4525 and 7025 cm−1) that do not largely shift nor have strong intensity variations in relation to crystallinity. Thus, the inner hydroxyls groups, either Al2-OH or AlFe3+-OH, always vibrate in a similar manner and are not very affected by changes of the layers stacking (e.g., Balan et al. 2010). This is why no relation between crystallinity and inner AlFe3+-OH spectral contributions appears. However, a possible link could exist between the crystallinity XRD indices and interfoliar-AlFe3+-OH vibrations. Indeed, these vibrations would be related to the hydroxyls groups that are bridging two adjacent layers: they would react as the interfoliar-Al2-OH groups to changes in stacking order. Unfortunately, it seems that it would be difficult to verify this hypothesis because the interfoliar-AlFe3+-OH vibrations would be located at wave-numbers close to the interfoliar-Al2-OH vibrations. Given the low concentrations of Fe3+ in kaolinite (Delineau et al. 1994; Balan et al. 2000), the AlFe3+-OH vibrations should be very low in intensity compared to the Al2-OH ones, and therefore, drowned out among them. Our observations are somewhat in agreement with the results of Petit and Decarreau (1990) and Balan et al. (2000), suggesting that the presence and proportion of Fe impurities in kaolinite cannot be correlated with the percentage of defects in this mineral. Recently, Cuadros et al. (2019) proposed that the substituted Fe3+ impurities in kaolinite should induce shifts in the OH combination band near 4525 cm−1 (2.210 μm). But, our data on a large set of natural kaolinites from different geological origins show that the 4525 cm−1 SC does not display such a shift, irrespective of the iron content. Thus, even if iron content can disturb the stacking sequence of the layers, it does not imply a systematic change in the vibration frequency of the inner Al2-OH. Significant change in position of the 4525 cm−1 SC of kaolinite may therefore be related to the presence in a small proportion of other clay minerals (e.g., smectites, illites, micas...).
Link between kaolinite crystallinity and geological origin
XRD indices calculations show that kaolinite from the three general geological contexts that we considered in this study exhibit a wide range of HI and LI values, and thus, a wide range of crystallinity. In our sampling set, sedimentary and pedogenic kaolinites range from low-ordered to high-ordered degrees. Hence at first sight, a given crystallinity order cannot be ascribed to a specific geological origin for sedimentary and pedogenic samples. By contrast, our sampling set shows that the two considered hydrothermal samples (DCV and GB 1) are well-ordered kaolinites. Thus, it might be tempting to infer that hydrothermal kaolinites can only be well ordered, and therefore that disordered kaolinites are necessarily of pedogenic or sedimentary origins. Fleurence and Nicolas (1964), by studying French kaolinites, stated that all hydrothermal French kaolinites are well ordered, and that kaolinites from soils are generally poorly crystallized. Estéoule-Choux (1981) described morphological textures of hydrothermal, sedimentary and weathering kaolinites. Overall, she observed that hydrothermal kaolinites are mainly well-crystallized, contrary to kaolinites formed by meteoric alteration that are mainly low-ordered. By using Raman and photoacoustic IR spectroscopy, Shoval et al. (1999b) suggested that hydrothermal kaolinites are of higher crystallinity than sedimentary and/or pedogenic kaolinites. Our study shows that: (1) well-ordered kaolinites are not restricted to hydrothermal deposits, as some are commonly found in pedogenic or sedimentary deposits; (2) kaolinites from a similar sedimentary or pedogenetic context can have contrasting degrees of crystalline order, depending on their local geochemical context, timing and period of crystallization; (3) a poorly ordered kaolinite is more likely to have a sedimentary or pedogenetic origin than a hydrothermal origin. This last conclusion needs nevertheless to be verified on a larger set of kaolinites of hydrothermal origin.
This confirms that well-ordered kaolinites are not restricted to hydrothermal deposits, as some are commonly found in pedogenic or sedimentary deposits. Those observations are common in tropical regoliths, either using petrographical observations, like the presence of defined kaolinite booklets or using spectroscopic methods (Beauvais and Bertaux 2002; Mathian et al. 2019). Structural ordering of kaolinite is often linked to the physicochemical characteristics of their microenvironment of formation (Tardy 1993), as well as to kinetics of crystallization, and in some case also to the type of mineral that is pseudomorphosed (Beauvais and Bertaux 2002). Kaolinites with the low disorder have also been recognized using the same criteria in Earth sedimentary basins (Beaufort et al. 1998).
Application to Mars spectral data
Determining the geological origin of clay minerals is also critical for the understanding of the conditions that prevailed at the surface of Mars. Yet, the application of the present methodology to determine the kaolinite crystallinity is still difficult for orbital data on Mars due to several factors including: (1) the insufficient spectral resolution of current imaging spectrometers; (2) the low signal-to-noise ratio of CRISM spectra in the case of the absorption band located at 7000 cm−1 (1.40 μm); and (3) the possible interference with different, additional hydrated phases favored by low-spatial resolution. However, the use of our NIR criteria may be a useful method in the near future, as the next Mars missions will send rovers on Mars (ESA’s ExoMars 2022 Rosalind Franklin rover, and NASA’s Mars2020 Perseverance rover) equipped with the spectrometers MicrOmega and Super-Cam (Pilorget and Bibring 2013; Fouchet et al. 2015; Bibring et al. 2017; Vago et al. 2017; Wiens et al. 2017). Detection of kaolinite at the two landing sites by CRISM observations has been done recently (Carter et al. 2016; Parente et al. 2019; Tarnas et al. 2019). New observations of these outcrops with the in situ instruments will help to determine their precise mineralogy, the crystallinity of the kaolinite, its genesis, and possibly a hint of the primary minerals that were present before kaolinization.
Conclusions and implications
By using second and third derivative curves of the 4500 cm−1 (2.2 μm) and 7000 cm−1 (1.4 μm) absorption regions of kaolinite near-infrared spectra, we demonstrate that the signature of kaolinite can bring information about its crystallinity when referred to the Hinckley and Liétard XRD Indices.
The resulting NIR indices could be related to shifts in position of some of the spectral contributions as well as the second derivative intensity of local maxima. These two parameters are shown to be mostly correlated to the Liétard Index variations for the interfoliar Al2-OH vibrations. For instance, good matches with the Lietard XRD index are obtained for the 7115 cm−1 (1.405 μm) shifts and for intensity variations of the 4560 cm−1 (2.193 μm) contribution, with correlations of 87% and ~95%, respectively. This observation allows us to assert that it is possible to trace the modification of the interfoliar OH groups configurations by variation of the kaolinite stacking degree, and hence by its crystallinity. The present data, and the use of a third spectral criteria called sharpened peak width (SPW), also reveal that the modifications of the spectral properties of the inner-hydroxyls groups are much weaker than those of interfoliar OH groups because their crystal chemistry environment is more constrained and only slightly affected by stacking defects. It was also possible to discuss the fact that the structural iron content in kaolinite, originating from octahedral substitutions with Al atoms, cannot be clearly used as a proxy for the crystallinity of kaolinite on the basis of NIR data.
The results on spectral criteria vs. geological origin show that the crystallinity of kaolinite can be used as a proxy to determine its geological origin only in a very limited extent. Within the selected set of samples, we show that well-ordered kaolinites can be found in all geological contexts (soils, sediments, hydrothermal alterations). For a given type of environment, either sedimentary or pedogenetic, kaolinites can present various degrees of crystalline order according to their local conditions of formation. In addition, a poorly ordered kaolinite is more likely to have a sedimentary or pedogenetic origin, which will have to be confirmed on a larger set of hydrothermal kaolinites. Accordingly, NIR measurements on the Mars surface with appropriate spectral resolution and quality should allow one in the future to determine the degree of disorder of kaolinite and, in the best case, to constrain its condition of formation in terms of the geological environment, i.e., hydrothermal vs. low-temperature alteration.
Funding statement: We acknowledge the support from the Agence Nationale de la Recherche (ANR, France) under the contract ANR-16-CE31-0012 entitled Mars-Prime and the Centre National de la Recherche Scientifique (CNRS, France). The authors also acknowledge financial support from the European Union (ERDF) and “Région Nouvelle Aquitaine.”
Acknowledgments
We thank Brian Grégoire (IC2MP, Poitiers, France) for his help and advice with NIR analysis of the samples. We also acknowledge L. Delbes and B. Baptiste from the IMPMC X-ray Diffraction platform (Sorbonne Université, Paris, France) for their help with the XRD analyses of the samples. We thank Gregg Swayze, Janice Bishop, and one anonymous reviewer, for their constructive comments that helped improve the manuscript.
-
Manuscript handled by Janice L. Bishop
References cited
Allard, T., Muller, J.-P., Dran, J.-C., and Ménager, M-T (1994) Radiation-induced paramagnetic defects in natural kaolinites: Alpha dosimetry with ion beam irradiation. Physics and Chemistry of Minerals, 21, 85–96.10.1007/BF00205219Search in Google Scholar
Allard, T., Pereira, L., Mathian, M., Balan, E., Taitson Bueno, G., Falguères, C., and do Nascimento, N.R. (2020) Dating kaolinite from the Neogene Içá Formation and overlying laterites, central Amazonia, Brazil: Constraints for a stratigraphic correlation. Palaeogeography, Palaeoclimatology, Palaeoecology, 554, 109818.10.1016/j.palaeo.2020.109818Search in Google Scholar
Amigo, J.M., Bastida, J., Sanz, A., Signes, M., and Serrano, J. (1994) Crystallinity of Lower Cretaceous kaolinites of Teruel (Spain). Applied Clay Science, 9, 51–69.10.1016/0169-1317(94)90014-0Search in Google Scholar
Aparicio, P., and Galán, E. (1999) Mineralogical interference on kaolinite crystallinity index measurements. Clays and Clay Minerals, 47, 12–27.10.1346/CCMN.1999.0470102Search in Google Scholar
Aparicio, P., Galán, E., and Ferrell, R.E. (2006) A new kaolinite order index based on XRD profile fitting. Clay Minerals, 41, 811–817.10.1180/0009855064140220Search in Google Scholar
Artioli, G., Bellotto, M., Gualtieri, A., and Pavese, A. (1995) Nature of structural disorder in natural kaolinites: A new model based on computer simulation of powder diffraction data and electrostatic energy calculation. Clays and Clay Minerals, 43, 438–445.10.1346/CCMN.1995.0430407Search in Google Scholar
Aucott, L.S., Garthwaite, P.H., and Buckland, S.T. (1988) Transformations to reduce the effect of particle size in near-infrared spectra. The Analyst, 113, 1849–1854.10.1039/an9881301849Search in Google Scholar
Awad, M.E., López-Galindo, A., Setti, M., El-Rahmany, M.M., and Iborra, C.V. (2017) Kaolinite in pharmaceutics and biomedicine. International Journal of Pharmaceutics, 533, 34–48.10.1016/j.ijpharm.2017.09.056Search in Google Scholar PubMed
Baker, C.J., and Uren, R.E. (1982) Kaolin in New South Wales (Mineral Resources, no. 44), 231 p. Department of Mineral Resources, Geological Survey of New South Wales.Search in Google Scholar
Balan, E., Allard, T., Boizot, B., Morin, G., and Muller, J.-P. (1999) Structural Fe3+ in natural kaolinites: New insights from electron paramagnetic resonance spectra fitting at X and Q-band frequencies. Clays and Clay Minerals, 47, 605–616.10.1346/CCMN.1999.0470507Search in Google Scholar
Balan, E., Allard, T., Boizot, B., Morin, G., and Muller, J.P. (2000) Quantitative measurement of paramagnetic Fe3+ in kaolinite. Clays and Clay Minerals, 48, 439–445.10.1346/CCMN.2000.0480404Search in Google Scholar
Balan, E., Saitta, A.M., Mauri, F., and Calas, G. (2001) First-principles modeling of the infrared spectrum of kaolinite. American Mineralogist, 86, 1321–1330.10.2138/am-2001-11-1201Search in Google Scholar
Balan, E., Lazzeri, M., Saitta, A.M., Allard, T., Fuchs, Y., and Mauri, F. (2005a) First-principles study of OH-stretching modes in kaolinite, dickite, and nacrite. American Mineralogist, 90, 50–60.10.2138/am.2005.1675Search in Google Scholar
Balan, E., Allard, T., Fritsch, E., Sélo, M., Falguères, C., Chabaux, F., Pierret, M.C., and Calas, G. (2005b) Formation and evolution of lateritic profiles in the middle Amazon basin: Insights from radiation-induced defects in kaolinite. Geochimica et Cosmochimica Acta, 69, 2193–2204.10.1016/j.gca.2004.10.028Search in Google Scholar
Balan, E., Fritsch, E., Allard, T., and Calas, G. (2007) Inheritance vs. neoformation of kaolinite during lateritic soil formation: A case study in the Middle Amazon basin. Clays and Clay Minerals, 55, 253–259.10.1346/CCMN.2007.0550303Search in Google Scholar
Balan, E., Delattre, S., Guillaumet, M., and Salje, E.K.H. (2010) Low-temperature infrared spectroscopic study of OH-stretching modes in kaolinite and dickite. American Mineralogist, 95, 1257–1266.10.2138/am.2010.3447Search in Google Scholar
Balan, E., Fritsch, E., Allard, T., Morin, G., Guillaumet, M., Delattre, S., Blanchard, M., and Calas, G. (2011) Spectroscopic investigation and theoretical modeling of kaolinite-group minerals and other low-temperature phases. Comptes Rendus Geoscience, 343, 177–187.10.1016/j.crte.2010.10.006Search in Google Scholar
Balan, E., Calas, G., and Bish, D.L. (2014) Kaolin-group minerals: From hydrogenbonded layers to environmental recorders. Elements, 10, 183–188.10.2113/gselements.10.3.183Search in Google Scholar
Balan, E., Fritsch, E., Juillot, F., Allard, T., and Petit, S. (2021) Local mode interpretation of the OH overtone spectrum of 1:1 phyllosilicates. European Journal of Mineralogy, 33, 209–220.10.5194/ejm-33-209-2021Search in Google Scholar
Baron, F., and Petit, S. (2016) Interpretation of the infrared spectra of the lizarditenepouite series in the near- and mid-infrared range. American Mineralogist, 101, 423–430.10.2138/am-2016-5352Search in Google Scholar
Beaufort, D., Cassagnabere, A., Petit, S., Lanson, B., Berger, G., Lacharpagne, J.C., and Johansen, H. (1998) Kaolinite-to-dickite reaction in sandstone reservoirs. Clay Minerals, 33, 297–316..10.1180/000985598545499Search in Google Scholar
Beauvais, A., and Bertaux, J. (2002) In situ characterization and differentiation of kaolinites in lateritic weathering profiles using infrared microspectroscopy. Clays and Clay Minerals, 50, 314–330.10.1346/00098600260358076Search in Google Scholar
Belkić, D., and Belkić, K. (2018) Explicit extraction of absorption peak positions, widths and heights using higher order derivatives of total shape spectra by nonparametric processing of time signals as complex damped multi-exponentials. Journal of Mathematical Chemistry, 56, 932–977.10.1007/s10910-017-0852-7Search in Google Scholar
Bell, V.A., Citro, V.R., and Hodge, G.D. (1991) Effect of pellet pressing on the infrared spectrum of kaolinite. Clays and Clay Minerals, 39, 290–292.10.1346/CCMN.1991.0390309Search in Google Scholar
Bibring, J.P., Hamm, V., Pilorget, C., and Vago, J.L. (2017) The MicrOmega investigation onboard ExoMars. Astrobiology, 17, 621–626.10.1089/ast.2016.1642Search in Google Scholar
Bish, D.L. (1993) Rietveld refinement of the kaolinite structure at 1.5 K. Clays and Clay Minerals, 41, 738–744.10.1346/CCMN.1993.0410613Search in Google Scholar
Bishop, J.L., Dobrea, E.Z.N., McKeown, N.K., Parente, M., Ehlmann, B.L., Michalski, J.R., Milliken, R.E., Poulet, F., Swayze, G.A., Mustard, J.F., Murchie, S.L., and Bibring, J.-P. (2008) Phyllosilicate diversity and past aqueous activity revealed at Mawrth Vallis, Mars. Science, 321, 830–833.10.1126/science.1159699Search in Google Scholar
Bookin, A.S., Drits, V.A., Plancon, A., and Tchoubar, C. (1989) Stacking faults in kaolin-group minerals in the light of real structural features. Clays and Clay Minerals, 37, 297–307.10.1346/CCMN.1989.0370402Search in Google Scholar
Boulvais, P., Vallet, J.M., Estéoule-Choux, J., Fourcade, S., and Martineau, F. (2000) Origin of kaolinization in Brittany (NW France) with emphasis on deposits over granite: Stable isotopes (O, H) constraints. Chemical Geology, 168, 211–223.10.1016/S0009-2541(00)00225-4Search in Google Scholar
Brindley, G.W., Kao, C.-C., Harrison, J.L., Lipsicas, M., and Raythatha, R. (1986) Relation between structural disorder and other characteristics of kaolinites and dickites. Clays and Clay Minerals, 34, 239–249.10.1346/CCMN.1986.0340303Search in Google Scholar
Buatier, M.D., Potdevin, J.-L., Lopez, M., and Petit, S. (1996) Occurrence of nacrite in the Lodève Permian basin (France). European Journal of Mineralogy, 8, 847–852.10.1127/ejm/8/4/0847Search in Google Scholar
Bundy, W.M., and Ishley, J.N. (1991) Kaolin in paper filling and coating. Applied Clay Science, 5, 397–420.10.1016/0169-1317(91)90015-2Search in Google Scholar
Carter, J., Poulet, F., Bibring, J.P., Mangold, N., and Murchie, S. (2013) Hydrous minerals on Mars as seen by the CRISM and Table OMEGA imaging spectrometers: Updated global view. Journal of Geophysical Research: Planets, 118, 831–858.10.1029/2012JE004145Search in Google Scholar
Carter, J., Loizeau, D., Mangold, N., Poulet, F., and Bibring, J.P. (2015) Widespread surface weathering on early Mars: A case for a warmer and wetter climate. Icarus, 248, 373–382.10.1016/j.icarus.2014.11.011Search in Google Scholar
Carter, J., Quantin, C., Thollot, P., Loizeau, D., Ody, A., and Lozach, L. (2016) Oxia Planum, a clay-laden landing site proposed for the Exomars Rover Mission: Aqueous mineralogy and alteration scenarios. 47th Lunar and Planetary Science Conference p. 2.Search in Google Scholar
Cases, J.M., Lietard, O., Yvon, J., and Delon, J.F. (1982) Etude des proprietes cristallochimiques, morphologiques, superficielles de kaolinites desordonnees. Bulletin de Minéralogie, 105, 439–455.10.3406/bulmi.1982.7566Search in Google Scholar
Chittleborough, D.J., and Walker, P.H. (1988) Crystallinity of soil kaolinites in relation to clay particle-size and soil age. Journal of Soil Science, 39, 81–86.10.1111/j.1365-2389.1988.tb01196.xSearch in Google Scholar
Clark, R.N., King, T.V.V., Klejwa, M., Swayze, G.A., and Vergo, N. (1990) High spectral resolution reflectance spectroscopy of minerals. Journal of Geophysical Research, 95, 12653.10.1029/JB095iB08p12653Search in Google Scholar
Clozel, B., Allard, T., and Muller, J.P. (1994) Nature and stability of radiation-induced defects in natural kaolinites: New results and a reappraisal of published works. Clays and Clay Minerals, 42, 657–666.10.1346/CCMN.1994.0420601Search in Google Scholar
Coyne, L.M., Bishop, J.L., Scattergood, T., Banin, A., Carle, G., and Orenberg, J. (1990) Near-infrared correlation spectroscopy: Quantifying iron and surface water in a series of variably cation-exchanged montmorillonite clays. In L.M. Coyne, S.W.S. McKeever, and D.F. Blake, Eds., Spectroscopic Characterization of Minerals and their Surfaces, 407–429 p. American Chemical Society.10.1021/bk-1990-0415.ch021Search in Google Scholar
Crowley, J.K., and Vergo, N. (1988) Near-infrared reflectance spectra of mixtures of kaolin-group minerals: use in clay mineral studies. Clays and Clay Minerals, 36, 310–316.10.1346/CCMN.1988.0360404Search in Google Scholar
Cuadros, J., Vega, R., Toscano, A., and Arroyo, X. (2014) Kaolinite transformation into dickite during burial diagenesis. American Mineralogist, 99, 681–695.10.2138/am.2014.4614Search in Google Scholar
Cuadros, J., Mavris, C., Michalski, J.R., Nieto, J.M., Bishop, J.L., and Fiore, S. (2019) Abundance and composition of kaolinite on Mars: Information from NIR spectra of rocks from acid-alteration environments, Riotinto, SE Spain. Icarus, 330, 30–41.10.1016/j.icarus.2019.04.027Search in Google Scholar
Cudahy, T., Jones, M., Thomas, M., Laukamp, C., Caccetta, M., Hewson, R., Rodger, A., and Verrall, M. (2008) Next Generation Mineral Mapping: Queensland airborne HyMap and satellite ASTER surveys, 161 p.Search in Google Scholar
Delineau, T., Allard, T., Muller, J.-P., Barres, O., Yvon, J., and Cases, J.M. (1994) FTIR Reflectance vs. EPR Studies of Structural Iron in Kaolinites. Clays and Clay Minerals, 42, 308–320.10.1346/CCMN.1994.0420309Search in Google Scholar
Dill, H.G. (2016) Kaolin: Soil, rock and ore: From the mineral to the magmatic, sedimentary and metamorphic environments. Earth-Science Reviews, 161, 16–129.10.1016/j.earscirev.2016.07.003Search in Google Scholar
Dill, H.G., Bosse, H.R., Henning, K.H., Fricke, A., and Ahrendt, H. (1997) Mineralogical and chemical variations in hypogene and supergene kaolin deposits in a mobile fold belt the Central Andes of northwestern Peru. Mineralium Deposita, 32, 149–163.10.1007/s001260050081Search in Google Scholar
Dubois, J., Murat, M., Amroune, A., Carbonneau, X., and Gardon, R. (1995) High-temperature transformation in kaolinite: The role of the crystallinity and of the firing atmosphere. Applied Clay Science, 10, 187–198.10.1016/0169-1317(95)00030-8Search in Google Scholar
Dubreuilh, J., Marchadour, P., and Thiry, M. (1984) Cadre géologique et minéralogie des argiles des Charentes, France. Clay Minerals, 19, 29–41.10.1180/claymin.1984.019.1.04Search in Google Scholar
Ehlmann, B.L., and Edwards, C.S. (2014) Mineralogy of the martian surface. Annual Review of Earth and Planetary Sciences, 42, 291–315.10.1146/annurev-earth-060313-055024Search in Google Scholar
Ehlmann, B.L., Mustard, J.F., Swayze, G.A., Clark, R.N., Bishop, J.L., Poulet, F., Des Marais, D.J., Roach, L.H., Milliken, R.E., Wray, J.J., and others (2009) Identification of hydrated silicate minerals on Mars using MRO-CRISM: Geologic context near Nili Fossae and implications for aqueous alteration. Journal of Geophysical Research E Research, 114, 1–33.10.1029/2009JE003339Search in Google Scholar
Ehlmann, B.L., Swayze, G.A., Milliken, R.E., Mustard, J.F., Clark, R.N., Murchie, S.L., Breit, G.N., Wray, J.J., Gondet, B., Poulet, F., and others (2016) Discovery of alunite in Cross Crater, Terra Sirenum, Mars: Evidence for acidic, sulfurous waters. American Mineralogist, 101, 1527–1542.10.2138/am-2016-5574Search in Google Scholar
Estéoule-Choux, J. (1981) Etude en microscopie électronique à balayage de quelques kaolins d’origines différentes: Apports de cette technique pour la compréhension de leurs génèses. Clay Minerals, 16, 279–288.10.1180/claymin.1981.016.3.05Search in Google Scholar
Farmer, V.C. (1974) The Infrared Spectra of Minerals. Mineralogical Society of Great Britain and Ireland.10.1180/mono-4Search in Google Scholar
Farmer, V.C., and Russel, J.D. (1967) Infrared absorption spectrometry in clay studies. Clays and Clay Minerals, 15, 121–142.10.1346/CCMN.1967.0150112Search in Google Scholar
Fialips, C.-I., Petit, S., and Decarreau, A. (1999) Influence du pH, du matériau de départ et de la durée de synthèse sur la cristallinité de la kaolinite. Earth and Planetary Science, 328, 515–520.10.1016/S1251-8050(99)80132-3Search in Google Scholar
Fialips, C., Petit, S., Decarreau, A., and Beaufort, D. (2000) Influence of synthesis pH on kaolinite “crystallinity” and surface properties. Clays and Clay Minerals, 48, 173–184.10.1346/CCMN.2000.0480203Search in Google Scholar
Fleurence, A., and Nicolas, J. (1964) Observations sur la notion d’ordre et de désordre de certains minéraux du groupe de la kaolinite. Bulletin du Groupe Français Des Argiles, 14, 149–162.10.3406/argil.1964.1005Search in Google Scholar
Fouchet, T., Forni, O., Maurice, S., Wiens, R.C., Johnson, J.R., Clegg, S.M., Beck, P., Poulet, F., Gasnault, O., and Meslin, P.Y. (2015) The infrared investigation on the SuperCam instrument for the Mars2020 Rover. 46th Lunar and Planetary Science Conference, 1736, 2 p.Search in Google Scholar
Fritsch, E., Montes-Lauar, C.R., Boulet, R., Melfi, A.J., Balan, E., and Magat, P. (2002) Lateritic and redoximorphic features in a faulted landscape near Manaus, Brazil. European Journal of Soil Science, 53, 203–217.10.1046/j.1351-0754.2002.00448.xSearch in Google Scholar
Fritsch, E., Morin, G., Bedidi, A., Bonnin, D., Balan, E., Caquineau, S., and Calas, G. (2005) Transformation of haematite and Al-poor goethite to Al-rich goethite and associated yellowing in a ferralitic clay soil profile of the middle Amazon Basin (Manaus, Brazil). European Journal of Soil Science, 56, 575–588.10.1111/j.1365-2389.2005.00693.xSearch in Google Scholar
Fritsch, E., Balan, E., Régina Do Nascimento, N., Allard, T., Bardy, M., Bueno, G., Derenne, S., Melfi, A.J., and Calas, G. (2011) Décrypter les processus d’altération en minéralogie et géochimie environnementale: vers un modèle intégré de formation des latérites puis des podzols dans le Haut Bassin amazonien. Comptes Rendus - Geoscience, 343, 188–198.10.1016/j.crte.2010.11.002Search in Google Scholar
Gaite, J.M., and Mosser, C. (1993) Experimental and modelized electron paramagnetic resonance spectra of Cr3+ in kaolinite. Journal of Physics: Condensed Matter, 5, 4929–4934.10.1088/0953-8984/5/28/008Search in Google Scholar
Gaite, J.M., Ermakoff, P., and Muller, J.P. (1993) Characterization and origin of two Fe3+ EPR spectra in kaolinite. Physics and Chemistry of Minerals, 20, 242–247.10.1007/BF00208137Search in Google Scholar
Gaite, J.-M., Ermakoff, P., Allard, T., and Muller, J.-P. (1997) Paramagnetic Fe3+: A sensitive probe for disorder in kaolinite. Clays and Clay Minerals, 45, 496–505.10.1346/CCMN.1997.0450402Search in Google Scholar
Gaudin, A., Dehouck, E., and Mangold, N. (2011) Evidence for weathering on early Mars from a comparison with terrestrial weathering profiles. Icarus, 216, 257–268.10.1016/j.icarus.2011.09.004Search in Google Scholar
Gaudin, A., Ansan, V., and Rigaudier, T. (2015) Mineralogical and δ18O-δD isotopic study of kaolinized micaschists at Penestin, Armorican Massif, France: New constraint in the kaolinization process. CATENA, 133, 97–106.10.1016/j.catena.2015.05.006Search in Google Scholar
Gaudin, A., Ansan, V., Lorand, J.-P., and Pont, S. (2020) Genesis of a florencite-bearing kaolin deposit on ordovician schists at Saint-Aubin-des-Châteaux, Armorican Massif, France. Ore Geology Reviews, 120, 103445.10.1016/j.oregeorev.2020.103445Search in Google Scholar
Gombás, Á., Antal, I., Szabó-Révész, P., Marton, S., and Erõs, I. (2003) Quantitative determination of crystallinity of alpha-lactose monohydrate by near infrared spectroscopy (NIRS). International Journal of Pharmaceutics, 256, 25–32.10.1016/S0378-5173(03)00059-0Search in Google Scholar
Goudge, T.A., Mustard, J.F., Head, J.W., Salvatore, M.R., and Wiseman, S.M. (2015) Integrating CRISM and TES hyperspectral data to characterize a halloysite-bearing deposit in Kashira crater, Mars. Icarus, 250, 165–187.10.1016/j.icarus.2014.11.034Search in Google Scholar
Hinckley, D.N. (1962) Variability in “crystallinity” values among the kaolin deposits of the coastal plain of Georgia and South Carolina. Clays and Clay Minerals, 11, 229–235.10.1346/CCMN.1962.0110122Search in Google Scholar
Hughes, J.C., and Brown, G. (1979) A crystallinity index for soil kaolins and its relation to parent rock, climate and soil maturity. Journal of Soil Science, 30, 557–563.10.1111/j.1365-2389.1979.tb01009.xSearch in Google Scholar
Hunt, G.R. (1977) Spectral signatures of particulate minerals in the visible and near infrared. Geophysics, 42, 501–513.10.1190/1.1440721Search in Google Scholar
Hunt, G.R., and Salisbury, J.W. (1970) Visible and near-infrared spectra of minerals and rocks: I. silicate minerals. Modern Geology, 1, 282–300.Search in Google Scholar
Hunt, G.R., Salisbury, J.W., and Lenhoff, C.J. (1973) Visible and near-infrared spectra of minerals and rocks VI. Additional Silicates. Modern Geology, 4, 85–106.Search in Google Scholar
Kloprogge, J. (2019) Spectroscopic Methods in the Study of Kaolin Minerals and Their Modifications, 428 p. Springer International Publishing.10.1007/978-3-030-02373-7Search in Google Scholar
La Iglesia, A., and Aznar, A.J. (1996) Crystallinity variations in kaolinite induced by grinding and pressure treatments. Journal of Materials Science, 31, 4671–4677.10.1007/BF00366368Search in Google Scholar
Laukamp, C., Ramanaidou, E., and Wells, M., and Yang, K. (2013) Kaolin and smectite group minerals in exploration and discovery. In M. Grafe, C. Klauber, and A. McFarlane, Eds., Clays in the mineral resources value chain: A literature survey. MERIWA Report No. 300, 293–341.Search in Google Scholar
Le Deit, L., Bourgeois, O., Mège, D., Hauber, E., Le Mouélic, S., Massé, M., Jaumann, R., and Bibring, J.P. (2010) Morphology, stratigraphy, and mineralogical composition of a layered formation covering the plateaus around Valles Marineris, Mars: Implications for its geological history. Icarus, 208, 684–703.10.1016/j.icarus.2010.03.012Search in Google Scholar
Le Deit, L., Flahaut, J., Quantin, C., Hauber, E., Mège, D., Bourgeois, O., Gurgurewicz, J., and Massé, M., and Jaumann, R. (2012) Extensive surface pedogenic alteration of the Martian Noachian crust suggested by plateau phyllosilicates around Valles Marineris. Journal of Geophysical Research E: Planets, 117, 1–25.10.1029/2011JE003983Search in Google Scholar
Liétard, O. (1977) Contribution à l’étude des propriétés physico-chimiques, cristallographiques et morphologiques des kaolins. Nancy.Search in Google Scholar
Loizeau, D., Werner, S.C., Mangold, N., Bibring, J.P., and Vago, J.L. (2012) Chronology of deposition and alteration in the Mawrth Vallis region, Mars. Planetary and Space Science, 72, 31–43.10.1016/j.pss.2012.06.023Search in Google Scholar
Loizeau, D., Quantin-Nataf, C., Carter, J., Flahaut, J., Thollot, P., Lozac’h, L., and Millot, C. (2018) Quantifying widespread aqueous surface weathering on Mars: The plateaus south of Coprates Chasma. Icarus, 302, 451–469.10.1016/j.icarus.2017.11.002Search in Google Scholar
Lucas, Y., Nahon, D., Cornu, S., and Eyrolle, F. (1996) Genèse et fonctionnement des sols en milieu équatorial. Comptes Rendus de l’Académie des Sciences.Série 2a: Sciences de la Terre, 322, 1–16.Search in Google Scholar
Madejová, J., Balan, E., and Petit, S. (2011) Application of vibrational spectroscopy to the characterization of phyllosilicates and other industrial minerals. European Mineralogical Union Notes in Mineralogy, 9, 171–226.10.1180/emu-notes.2010.emu9-6Search in Google Scholar
Mathian, M., Hebert, B., Baron, F., Petit, S., Lescuyer, J.L., Furic, R., and Beaufort, D. (2018) Identifying the phyllosilicate minerals of hypogene ore deposits in lateritic saprolites using the near-IR spectroscopy second derivative methodology. Journal of Geochemical Exploration, 186, 298–314.10.1016/j.gexplo.2017.11.019Search in Google Scholar
Mathian, M., Aufort, J., Braun, J.J., Riotte, J., Selo, M., Balan, E., Fritsch, E., Bhattacharya, S., and Allard, T. (2019) Unraveling weathering episodes in Tertiary regoliths by kaolinite dating (Western Ghats, India). Gondwana Research, 69, 89–105.10.1016/j.gr.2018.12.003Search in Google Scholar
Mathian, M., Bueno, G.T., Balan, E., Fritsch, E., Do Nascimento, N.R., Selo, M., and Allard, T. (2020) Kaolinite dating from Acrisol and Ferralsol: A new key to understanding the landscape evolution in NW Amazonia (Brazil). Geoderma, 370, 114354.10.1016/j.geoderma.2020.114354Search in Google Scholar
McKeown, N.K., Bishop, J.L., Noe Dobrea, E.Z., Ehlmann, B.L., Parente, M., Mustard, J.F., Murchie, S.L., Swayze, G.A., Bibring, J.P., and Silver, E.A. (2009) Characterization of phyllosilicates observed in the central Mawrth Vallis region, Mars, their potential formational processes, and implications for past climate. Journal of Geophysical Research E Research, 114, 1–20.10.1029/2008JE003301Search in Google Scholar
Mestdagh, M.M., Vielvoye, L., and Herbillon, A.J. (1980) Iron in kaolinite: II. The relationship between kaolinite crystallinity and iron content. Clay Minerals, 15, 1–13.10.1180/claymin.1980.015.1.01Search in Google Scholar
Miyawaki, R., Tomura, S., Inukai, K., Shibasaki, Y., Okazaki, M., Samejima, S., and Satokawa, S., and S., A. (1992) Formation process of kaolinite from the amorphous mixture of silica and alumina. Clay Science, 8, 273–284.Search in Google Scholar
Momma, K., and Izumi, F. (2011) VESTA 3 for three-dimensional visualization of crystal, volumetric and morphology data. Journal of Applied Crystallography, 44, 1272–1276, doi: 10.1107/S002188981103897010.1107/S0021889811038970Search in Google Scholar
Murchie, S., Arvidson, R., Bedini, P., Beisser, K., Bibring, J.-P., Bishop, J., Boldt, J., Cavender, P., Choo, T., Clancy, R. T., and others (2007) Compact Reconnaissance Imaging Spectrometer for Mars (CRISM) on Mars Reconnaissance Orbiter (MRO). Journal of Geophysical Research, 112, 1–57.10.1117/12.578976Search in Google Scholar
Murray, H.H. (1999) Applied clay mineralogy today and tomorrow. Clay Minerals, 34, 39–49.10.1180/000985599546055Search in Google Scholar
Murray, H.H., and Lyons, S.C. (1955) Correlation of paper-coating quality with degree of crystal perfection of kaolinite. Clays and Clay Minerals, 4, 31–40.10.1346/CCMN.1955.0040105Search in Google Scholar
Mustard, J.F., Murchie, S.L., Pelkey, S.M., Ehlmann, B.L., Milliken, R.E., Grant, J.A., Bibring, J.-P., Poulet, F., Bishop, J., Dobrea, E.N., and others (2008) Hydrated silicate minerals on Mars observed by the Mars Reconnaissance Orbiter CRISM instrument. Nature, 454, 305–309.10.1038/nature07097Search in Google Scholar PubMed
Ndlovu, B., Farrokhpay, S., Forbes, E., and Bradshaw, D. (2015) Characterisation of kaolinite colloidal and flow behaviour via crystallinity measurements. Powder Technology, 269, 505–512.10.1016/j.powtec.2014.09.029Search in Google Scholar
Noble, F.R. (1971) A study of disorder in kaolinite. Clay Minerals, 9, 71–81.10.1180/claymin.1971.009.1.05Search in Google Scholar
Parente, M., Arvidson, R., Itoh, Y., Lin, H., Mustard, J.F., Saranathan, A.M., Seelos, F.P., and Tarnas, J.D. (2019) Mineral detections over Jezero crater using advanced data processing techniques for CRISM data—The CRISM “Fandango.” Ninth International Conference on Mars, p. 2.Search in Google Scholar
Parker, T.W. (1969) A classification of kaolinites by infrared spectroscopy. Clay Minerals, 8, 135–141.10.1180/claymin.1969.008.2.02Search in Google Scholar
Paroz, G.N., and Frost, R.L. (1998) Chemometric investigation of disorder in kaolinite. The Analyst, 123, 2813–2817.10.1039/a806589fSearch in Google Scholar
Patterson, S.H., and Murray, H.H. (1984) Kaolin, Refractory Clay, Ball Clay, and Halloysite in North America, Hawaii, and the Caribbean Region. Geological Survey Professional Paper (United States).10.3133/pp1306Search in Google Scholar
Petit, S., and Decarreau, A. (1990) Hydrothermal (200 °C) synthesis and crystal chemistry of iron-rich kaolinites. Clay Minerals, 25, 181–196.10.1180/claymin.1990.025.2.04Search in Google Scholar
Petit, S., Madejová, J., Decarreau, A., and Martin, F. (1999) Characterization of octahedral substitutions in kaolinites using near infrared spectroscopy. Clays and Clay Minerals, 47, 103–108.10.1346/CCMN.1999.0470111Search in Google Scholar
Pilorget, C., and Bibring, J.P. (2013) NIR reflectance hyperspectral microscopy for planetary science: Application to the MicrOmega instrument. Planetary and Space Science, 76, 42–52.10.1016/j.pss.2012.11.004Search in Google Scholar
Plançon, A., and Zacharie, C. (1990) An expert system for the structural characterization of kaolinites. Clay Minerals, 25, 249–260.10.1180/claymin.1990.025.3.01Search in Google Scholar
Plançon, A., Giese, R.F., and Snyder, R. (1988) The Hinckley index for kaolinites. Clay Minerals, 23, 249–260.10.1180/claymin.1988.023.3.02Search in Google Scholar
Plançon, A., Giese, R.F., Snyder, R., Drits, V.A., and Bookin, A.S. (1989) Stacking faults in the kaolin-group minerals: defect structures of kaolinite. Clays and Clay Minerals, 37, 203–210.10.1346/CCMN.1989.0370302Search in Google Scholar
Pruett, R.J., and Webb, H.L. (1993) Sampling and analysis of KGa-1B well-crystallized kaolin source clay. Clays and Clay Minerals, 41, 514–519.10.1346/CCMN.1993.0410411Search in Google Scholar
Psyrillos, A., Manning, D.A.C., and Burley, S.D. (1998) Geochemical constraints on kaolinization in the St Austell Granite, Cornwall, England. Journal of the Geological Society, 155, 829–840.10.1144/gsjgs.155.5.0829Search in Google Scholar
Ryu, K.W., Jang, Y.N., and Chae, S.C. (2010) Hydrothermal synthesis of kaolinite and its formation mechanism. Clays and Clay Minerals, 58, 44–51.10.1346/CCMN.2010.0580104Search in Google Scholar
Savitzky, A., and Golay, M.J.E. (1964) Smoothing and differentiation of data by simplified least squares procedures. Analytical Chemistry, 36, 1627–1639.10.1021/ac60214a047Search in Google Scholar
Scheinost, A.C., Chavernas, A., Barron, V., and Torrent, J. (1998) Use and limitations of second-derivative diffuse reflectance spectroscopy in the visible to near-infrared range to identify and quantify Fe oxide minerals in soils. Clays and Clay Minerals, 46, 528–536.10.1346/CCMN.1998.0460506Search in Google Scholar
Sheppard, S.M.F. (1977) The Cornubian batholith, SW England: D/H and 18O/16O studies of kaolinite and other alteration minerals. Journal of the Geological Society, 133, 573–591.10.1144/gsjgs.133.6.0573Search in Google Scholar
Shoval, S., Yariv, S., Michaelian, K.H., Lapides, I., Boudeuille, M., and Panczer, G. (1999a) A fifth OH-stretching band in IR spectra of kaolinites. Journal of Colloid and Interface Science, 212, 523–529.10.1006/jcis.1998.6055Search in Google Scholar PubMed
Shoval, S., Yariv, S., Michaelian, K.H., Boudeulle, M., and Panczer, G. (1999b) Hydroxyl-stretching bands ‘A’ and ‘Z’ in Raman and infrared spectra of kaolinites. Clay Minerals, 34, 551–563.10.1180/000985599546442Search in Google Scholar
Steinier, J., Termonia, Y., and Deltour, J. (1972) Comments on smoothing and differentiation of data by simplified least square procedure. Analytical Chemistry, 44, 1906–1909.10.1021/ac60319a045Search in Google Scholar PubMed
Swayze, G.A., Clark, R.N., Goetz, A.F.H., Livo, K.E., Breit, G.N., Kruse, F.A., Sutley, S.J., Snee, L.W., Lowers, H.A., Post, J.L., and others (2014) Mapping advanced argillic alteration at Cuprite, Nevada, using imaging spectroscopy. Economic Geology, 109, 1179–1221.10.2113/econgeo.109.5.1179Search in Google Scholar
Swindale, L.D. (1975) The Crystallography of Minerals of the Kaolin Group, Soil Components, 121–154 p. Springer.10.1007/978-3-642-65917-1_5Search in Google Scholar
Tardy, Y. (1993) Pétrologie des Latérites et des Sols Tropicaux, 459 p. Masson, Paris. (in French).Search in Google Scholar
Tarnas, J.D., Mustard, J.F., Lin, H., Goudge, T.A., Amador, E. S., Bramble, M. S., Kremer, C.H., Zhang, X., Itoh, Y., and Parente, M. (2019) Orbital identification of hydrated silica in Jezero Crater, Mars. Geophysical Research Letters, 46, 12771–12782.10.1029/2019GL085584Search in Google Scholar
Thollot, P., Mangold, N., Ansan, V., Le Mouélic, S., Milliken, R.E., Bishop, J.L., Weitz, C.M., Roach, L.H., Mustard, J.F., and Murchie, S.L. (2012) Most Mars minerals in a nutshell: Various alteration phases formed in a single environment in Noctis Labyrinthus. Journal of Geophysical Research, 117, 1–28.10.1029/2011JE004028Search in Google Scholar
Vago, J.L., Westall, F., Coates, A.J., Jaumann, R., Korablev, O., Ciarletti, V., Mitrofanov, I., Josset, J.-L., De Sanctis, M.C., Bibring, J.-P., and others (2017) Habitability on early Mars and the search for biosignatures with the ExoMars Rover. Astrobiology, 17, 471–510.10.1089/ast.2016.1533Search in Google Scholar PubMed PubMed Central
Weck, P.F., Kim, E., and Jové-Colón, C.F. (2015) Relationship between crystal structure and thermo-mechanical properties of kaolinite clay: beyond standard density functional theory. Dalton Transactions, 44, 12550–12560.10.1039/C5DT00590FSearch in Google Scholar
Wiens, R.C., Maurice, S., and Perez, F.R. (2017) The SuperCam remote sensing instrument suite for the mars 2020 rover: A preview. Spectroscopy, 32, 50–55.Search in Google Scholar
© 2022 Maxime Pineau, Maximilien Mathian, Fabien Baron, Benjamin Rondeau, Laetitia Le Deit, Thierry Allard, and Nicolas Mangold, published by Mineralogical Society of America
This work is licensed under the Creative Commons Attribution-NonCommercial-NoDerivatives 4.0 International License.
Articles in the same Issue
- Estimating kaolinite crystallinity using near-infrared spectroscopy: Implications for its geology on Earth and Mars
- The interplay between twinning and cation inversion in MgAl2O4-spinel: Implications for a nebular thermochronometer
- The effect of fluorine on reaction-rim growth dynamics in the ternary CaO-MgO-SiO2 system
- Seeing through metamorphic overprints in Archean granulites: Combined high-resolution thermometry and phase equilibrium modeling of the Lewisian Complex, Scotland
- Interphase misorientation as a tool to study metamorphic reactions and crystallization in geological materials
- Trace element partitioning between olivine and melt in lunar basalts
- Solving the iron quantification problem in low-kV EPMA: An essential step toward improved analytical spatial resolution in electron probe microanalysis—Fe-sulfides
- Zircon geochronological and geochemical insights into pluton building and volcanic-hypabyssal-plutonic connections: Oki-Dōzen, Sea of Japan—A complex intraplate alkaline volcano
- Using cathodoluminescence to identify oscillatory zoning of perthitic K‑feldspar from the equigranular Toki granite
- Influence of intensive parameters and assemblies on friction evolution during piston-cylinder experiments
- Formation process of Al-rich calcium amphibole in quartz-bearing eclogites from The Sulu Belt, China
- Helvine-danalite mineralogy of the Dulong Sn-Zn polymetallic deposit in southeast Yunnan, China
- Native gold enrichment process during growth of chalcopyrite-lined conduits within a modern hydrothermal chimney (Manus Basin, PNG)
- Pliniusite, Ca5(VO4)3F, a new apatite-group mineral and the novel natural ternary solid-solution system pliniusite–svabite–fluorapatite
- Heamanite-(Ce), (K0.5Ce0.5)TiO3, a new perovskite supergroup mineral found in diamond from Gahcho Kué, Canada
- A revised analysis of ferrihydrite at liquid helium temperature using Mössbauer spectroscopy
- First find of merrillite, Ca3(PO4)2, in a terrestrial environment as an inclusion in lower-mantle diamond
- New Mineral Names: Hydrous Minerals
- Book Review
- Past to Present. (2020) Edited by Beth N. Orcutt, Isabelle Daniel, and Rajdeep Dasgupta.