Seeing through metamorphic overprints in Archean granulites: Combined high-resolution thermometry and phase equilibrium modeling of the Lewisian Complex, Scotland
-
Phillip Gopon

Abstract
The Lewisian Complex in northwest Scotland presents a record of the transition from the Neo-Archean to the Paleoproterozoic. However, this record is complicated by a long and varied history after peak metamorphism that has erased and/or partially reset much of the early history of the rocks. Such overprinting is a common feature of Archean granulites and poses a substantial problem when trying to understand the tectonic processes that were active prior to the onset of modern plate tectonics.
By combining careful petrography with phase diagram modeling and a range of exchange thermometers we obtain the peak and retrograde temperature history of the Lewisian Complex from a single, well-preserved, representative sample of garnet-bearing mafic granulite. We present the application of high-resolution electron probe microanalysis (HR-EPMA) to characterize sub-micrometer orthopyroxene exsolution lamellae in clinopyroxene. We discuss ways to mitigate issues associated with HR-EPMA including surface contamination, beam drift, standards, and the need to correct for secondary fluorescence effects. The resulting compositions from our HR-EPMA analyses provide an independent measure of the retrograde temperature conditions and can also be used to back-calculate the compositions of clinopyroxene in the peak assemblage.
We obtain peak metamorphic conditions for the Lewisian of >11 kbar and >1025 °C, and constrain subsequent metamorphic overprints to 850 °C (Grt-Cpx), 590 °C (Opx-Cpx), and 460 °C (Mag-Ilm). These peak and retrograde temperatures span the range of those found in the literature. Whereas recent phase equilibrium studies assume equilibrium among all preserved high-T minerals, this study considers microstructural and mineral-chemical evidence for corona formation that reflects post-peak decompression with partial equilibration at ~850 °C, as recognized in some earlier studies.
Introduction
The Lewisian Complex of northwest (NW) Scotland comprises a sequence of Archean igneous rocks, which have undergone a series of metamorphic events. At ≥2.8 Ga, these are not only the oldest rocks in the British Isles, but also have a history spanning the crucial transition from neo-Archean to the Paleoproterozoic, and the initiation of modern-style tectonics.
The Lewisian Complex can be divided into three regions: northern, central, and southern (Peach et al. 1907), and it comprises mainly tonalite-trondhjemite-granodiorite (TTG) orthogneisses with subordinate blocks and lenses of intermediate, mafic, and ultramafic rocks (Sutton and Watson 1950; O’Hara 1961; Rollinson and Windley 1980). This study focuses on the central region, specifically the mafic rocks of Scouriemore (Fig. 1), that underwent (ultra)high-temperature metamorphism during the Archean (Badcallian) regional metamorphic episode (Park 1970; Sills and Rollinson 1987). Despite extensive study since the time of Peach and Horne (Peach et al. 1907), there still exists much debate as to the peak metamorphic conditions attained during the Badcallian metamorphic event. Estimates in the older literature are derived from several different geothermobarometers (Wood 1975, 1977; O’Hara and Yarwood 1978; Barnicoat and O’Hara 1979; Savage and Sills 1980; Rollinson and Windley 1980; Pride and Muecke 1980; Rollinson 1981) and span a wide range from 820 to 1150 °C and 6 to 15 kbar (Barnicoat 1983; Sills and Rollinson 1987). The scatter in P-T estimates is largely due to the one (or more) subsequent metamorphic events that have wholly erased or partially reset the peak mineral compositions (Barnicoat 1983; Sills and Rollinson 1987). Modern phase equilibrium modeling techniques (e.g., de Capitani and Brown 1987; de Capitani and Petrakakis 2010; Connolly 1990; Connolly and Petrini 2002; Powell et al. 1998; Holland and Powell 2011; Green et al. 2016) have been applied to the Badcallian metamorphism (e.g., Johnson and White 2011; White et al. 2017; Feisel et al. 2018; Forshaw et al. 2019), but this approach has been hampered by the large P-T field in which the peak mineral assemblage occurs, by domains of partial re-equilibration that exist within samples, and issues relating to partitioning of minor elements among the dominant minerals.

Simplified geological map of the area surrounding Scourie Bay, showing the location of sample S98-14 on Scouriemore (after O’Hara 1961).
This study focuses on one particularly well-preserved mafic granulite sample (Fig. 2) from Scouriemore, NW Scotland. This sample is representative of the relatively Fe-rich metabasites found across the region, which are dominated by garnet and clinopyroxene (cf. Savage and Sills 1980). It exhibits similar features to other samples characterized by the authors (Online Materials[1] A) and to samples analyzed by other studies in the Lewisian (Wood 1975, 1977; O’Hara 1961; Barnicoat and O’Hara 1979; O’Hara and Yarwood 1978; Savage and Sills 1980; Rollinson and Windley 1980; Pride and Muecke 1980; Feisel et al. 2018; Johnson and White 2011). However, samples in the literature generally show higher degrees of amphibolite-facies retrogression and hydration compared with the rock sample on which we focus. Breakdown microstructures (i.e., post-peak net-transfer reactions) preserved within this rock can be linked to a succession of metamorphic processes and thus be used to determine the P-T conditions of the retrograde path. Importantly, this allows us to back-calculate the compositions of the peak assemblage, here interpreted to be only garnet and clinopyroxene (±plagioclase/quartz). The microstructures of particular importance to this study, as also described in Barnicoat (1983) and Sills and Rollinson (1987); are the breakdown of peak garnet (Fig. 3) to form corona textures composed of plagioclase and orthopyroxene (±magnetite-ilmenite), as well as the exsolution of (peak) coarse granoblastic clinopyroxene to form lamellae of orthopyroxene, which do not reach the edge of the host grain.

QEMSCAN (left-hand side) and plane-polarized optical thin section image (right-hand side) of S98-14. Black dashed line denoted border between left and right, and white dashed line shows the outline of a pyroxene grain that crosses between the two images. Locations of EPMA analyses and transects are noted in black on the ppl image. QEMSCAN image colors: red = garnet; green = clinopyroxene; blue = plagioclase; purple = orthopyroxene; orange = ilmenite; reddish-orange = magnetite; gold = pyrite. Optical image colors: reddish-orange = garnet; green = clinopyroxene; white = plagioclase; brown = orthopyroxene; black = oxide or altered plagioclase.

High-resolution QEMSCAN image (1 μm pixel size) of a corner of a representative garnet corona (see inset for location). Note the association of magnetite and ilmenite within the corona and that the orthopyroxene present in the matrix in the top right of the image is in fact connected to the garnet corona by orthopyroxene present along the Cpx-Cpx grain boundary. Image colors: red = garnet; green = clinopyroxene; blue = plagioclase; purple = orthopyroxene; orange = ilmenite; reddish-orange = magnetite.
We combine phase equilibrium modeling with the careful application of exchange thermometers applied to these microstructures to provide a more precise record of Badcallian peak metamorphism and a better understanding of Archean lower crustal P-T conditions. In the process we present an adapted analytical technique using HR-EPMA that allows accurate determination of sub-micrometer orthopyroxene (Opx) exsolution lamella in clinopyroxene (Cpx). Abbreviations here and throughout are after Whitney and Evans (2010).
To analyze phases below ~5 μm by EPMA, low accelerating potential and a field emission gun source are required. It is a known issue that using accelerating potentials below ~10 keV induce multiple analytical issues, including problems with using the L X‑ray transition lines of transition metals, increased sensitivity to surface contamination, enhanced sample damage, electron beam drift over the course of the analysis, and issues with secondary fluorescence (Gopon et al. 2013, 2017; Llovet et al. 2016; Armstrong 2012). We present a way that uses careful standard matching, combined with a correction scheme for secondary fluorescence, to accurately determine the compositions of micrometer and sub-micrometer orthopyroxene exsolution lamellae.
The analysis of sub-micrometer lamellae allows determination of a two-pyroxene retrograde temperature, but more importantly allows us to recombine the exsolved orthpyroxene into the clinopyroxene host to determine the composition of the “proto-Cpx” (defined as the original composition of the Cpx at peak P-T). This proto-Cpx can then be used to determine the peak Badcallian temperature using the graphical pyroxene thermometer of Lindsley (1983). These widely applicable techniques allow us to see through subsequent metamorphic overprints to determine the peak granulite P-T conditions.
Methods
Sample selection and petrography
Garnet-bearing mafic granulites were selected from a suite of >100 samples collected by the authors since 1991 from the central region of the Lewisian Complex. At Scouriemore, the mafic bodies range from garnet–clinopyroxene-bearing granulites with minor plagioclase through to two-pyroxene granulites. In addition to any record of re-equilibration during slow cooling from peak conditions, they have been subjected to varying degrees of retrograde overprinting during subsequent events. Thin sections from Scouriemore were noted to contain retrograde hydrous phases; principally amphibole and biotite but epidote and chlorite were observed in heavily retrogressed mafic-intermediate gneisses (Online Materials[1] A). After re-examination of all samples to assess the state of equilibrium, effects of deformation, and evidence for reaction relationships among minerals, a sample (S98-14) from Scouriemore (locality 3 of O’Hara 1961), showing excellent preservation of petrographic relationships and minimal retrogression, was selected for detailed study. This representative, and near totally anhydrous, sample shows similar features to those present in all samples characterized (Online Materials[1] A), as well as those found in the literature (O’Hara 1961; Rollinson and Windley 1980; Feisel et al. 2018; Johnson and White 2011).
QEMSCAN analysis was conducted on a FEI Wellsite SEM at Rocktype Ltd. (Oxford, U.K.), at a resolution of 10 μm across an entire thin section of S98-14 to determine the phases present and their modal abundance. A further high-resolution scan (1 μm pixel size) was conducted surrounding a well-preserved garnet and its corona. The modal abundance from the 10 μm scan, combined with microanalysis, was used to construct the bulk composition of the rock.
A grain size analysis of sample S98-14, using the approach in Abrams (1971), was conducted to quantify the size and abundance of the major minerals present. This involved drawing random lines across five thin sections from the same hand sample of S98-14 and measuring the diameter of the long and short axes of each crystal that the lines intersected. The diameter of the long and short axis was then used to calculate the area of the corresponding ellipse, which is assumed to estimate the volume of the crystal. The diameter of a sphere of equivalent volume to this was then taken to represent the grain size.
Electron probe microanalysis (EPMA)
EPMA analyses were conducted in the Department of Earth Sciences, University of Oxford, U.K., on a CAMECA SXFive-FE. The CAMECA Peaksight Version 6.2.0.2064 software was used for quantitative analyses.
15 keV electron microprobe analysis. Standard EPMA analysis used an acceleration voltage of 15 keV, a beam current of 20 nA, a spot size of 1 μm, as well as 30 s on-peak and 15 s background count times. For all silicate minerals silicon, titanium, aluminum, iron, manganese, magnesium, calcium, sodium, and potassium were analyzed using the following X‑ray lines and diffracting crystals: SiKα (TAP), TiKα (LPET), AlKα (TAP), FeKα (LLIF), MnKα (LLIF), MgKα (TAP), CaKα (PET), NaKα (TAP), KKα (PET). Additionally, CrKα (LLIF) and NiKα (LLIF) were analyzed in orthopyroxene. For oxide minerals sodium, magnesium, aluminum, silicon, calcium, titanium, chromium, manganese, iron, and nickel were analyzed using the following X‑ray lines and diffracting crystals: NaKα (TAP), MgKα (TAP), AlKα (TAP), SiKα (TAP), CaKα (PET), TiKα (PET), CrKα (LLIF), MnKα (LLIF), FeKα (LLIF), NiKα (LLIF). Oxygen was calculated by stoichiometry for silicate and oxide analyses. Standards for silicate analyses included: albite for Si, Al, and Na; orthoclase for K; andradite for Fe; 99.9% purity manganese metal for Mn; 99.99% purity chromium metal for Cr; 99.999% purity nickel metal for Ni; synthetic MgO for Mg; wollastonite for Ca; and synthetic TiO2 for Ti. Standards for oxide analyses included albite for Si, Al, and Na; synthetic MgO for Mg; magnetite for Fe; orthoclase for K; andradite for Ca; 99.99% purity chromium metal for Cr; 99.999% purity nickel metal for Ni; and 99.9% purity manganese metal for Mn. Point analyses provided an overview of the modal oxide weight percentages for each mineral, while line scans identified any heterogeneity within minerals expressed as elemental zoning between cores and rims. Analytical uncertainty for individual EPMA analyses is reported in the Online Materials[1] B and is based on the counting statistics of the detectors. Because we report averages of multiple analyses in Table 1, the uncertainty from counting statistics is in the third or fourth decimal place. Because we only report to two decimal places in Table 1 the uncertainty is not shown there, but we report the standard deviation of the averaged analyses.
Low 7-keV EPMA analyses (wt% oxide and cations per formula unit) for host Cpx, lamella Opx (both the CaO values before and after the secondary fluorescence), and recombined “proto-Cpx” (using the corrected CaO values)
| Mineral | Cpx 1 | Cpx 2 | Mineral | Mag | Ilm | Opx | Grt | Pl | Bulk comp. | |||||||||||||||||
|---|---|---|---|---|---|---|---|---|---|---|---|---|---|---|---|---|---|---|---|---|---|---|---|---|---|---|
| Location | Cpx Host | Opx Lam (3 μm) | Cpx Recomb | Garnet Pair | Cpx Host | Opx Lam (5 μm) | Cpx Recomb | Garnet Pair | Location | Mean | Mean | Mean | Mean | Mean | ||||||||||||
| No. of analyses | 6 | 9 | N/A | 20 | 11 | 9 | N/A | 20 | No. of analyses | 5 | 32 | 246 | 299 | 381 | ||||||||||||
| Analysis type | 7 keV | St.dev. | 7 keV | St.dev. | 7 keV | 15 keV | St.dev. | 7 keV | St.dev. | 7 keV | St.dev. | 7 keV | 15 keV | St.dev. | Analysis type | 15 keV | St.dev. | 15 keV | St.dev. | 15 keV | St.dev. | 15 keV | St.dev. | 15 keV | St.dev. | |
| SiO2 | 50.25 | 0.39 | 51.26 | 1.86 | 50.33 | 39.07 | 0.13 | 50.84 | 0.20 | 51.17 | 1.23 | 50.87 | 39.22 | 0.10 | SiO2 | 0.06 | 0.01 | 0.08 | 0.09 | 50.74 | 0.63 | 38.88 | 0.33 | 53.19 | 0.51 | 46.66 |
| TiO2 | 0.70 | 0.06 | 0.00 | 0.12 | 0.64 | 0.11 | 0.01 | 0.55 | 0.02 | 0.08 | 0.06 | 0.51 | 0.08 | 0.01 | TiO2 | 0.31 | 0.28 | 49.81 | 0.85 | 0.08 | 0.09 | 0.08 | 0.04 | 0.01 | 0.02 | 0.07 |
| Al2O3 | 5.84 | 0.28 | 3.67 | 0.19 | 5.67 | 22.14 | 0.06 | 4.72 | 0.17 | 3.70 | 0.22 | 4.64 | 22.21 | 0.07 | Al2O3 | 0.43 | 0.04 | 0.21 | 0.04 | 3.50 | 0.59 | 22.06 | 0.18 | 29.33 | 0.43 | 14.56 |
| Cr2O3 | – | – | – | – | – | – | – | – | – | – | – | – | – | – | Cr2O3 | 3.10 | 0.34 | 0.82 | 0.07 | 0.06 | 0.02 | – | – | – | – | – |
| Fe2O3 | – | – | – | – | – | – | – | – | – | – | – | – | – | – | Fe2O3 | – | – | – | – | – | – | – | – | – | – | 0.82 |
| FeO | 7.76 | 0.27 | 24.26 | 0.26 | 9.07 | 22.59 | 0.16 | 8.46 | 0.46 | 25.54 | 0.72 | 9.80 | 22.51 | 0.15 | FeO | 88.00 | 0.61 | 45.38 | 0.96 | 23.50 | 0.88 | 23.44 | 1.14 | 0.18 | 0.23 | 15.16 |
| MnO | 0.84 | 0.04 | 0.84 | 0.03 | MnO | 0.03 | 0.02 | 1.71 | 0.71 | 0.32 | 0.07 | 0.84 | 0.09 | 0.00 | 0.01 | – | ||||||||||
| MgO | 11.95 | 0.26 | 20.16 | 0.69 | 12.61 | 9.14 | 0.08 | 11.81 | 0.11 | 19.05 | 0.99 | 12.38 | 8.96 | 0.07 | MgO | 0.05 | 0.02 | 0.45 | 0.55 | 21.21 | 0.83 | 8.36 | 0.79 | 0.03 | 0.11 | 10.59 |
| CaO | 22.39 | 0.24 | 0.16 | 0.05 | 20.62 | 6.03 | 0.07 | 22.32 | 0.34 | 0.18 | 0.05 | 20.59 | 6.12 | 0.07 | CaO | 0.07 | 0.01 | 0.08 | 0.07 | 0.36 | 0.12 | 6.51 | 0.49 | 12.05 | 0.51 | 11.30 |
| CaO (uncorr.) | – | – | 0.45 | 0.05 | 20.64 | – | – | – | – | 0.48 | 0.05 | 20.61 | – | – | CaO (uncorr.) | – | – | – | – | – | – | – | – | – | – | – |
| NiO | – | – | – | – | – | – | – | – | – | – | – | – | – | – | NiO | 0.13 | 0.02 | 0.02 | 0.01 | 0.04 | 0.02 | – | – | – | – | – |
| Na2O | 0.85 | 0.05 | 0.01 | 0.02 | 0.79 | 0.01 | 0.01 | 0.79 | 0.03 | 0.01 | 0.02 | 0.73 | 0.01 | 0.01 | Na2O | 0.00 | 0.02 | 0.01 | 0.02 | 0.01 | 0.01 | 0.01 | 0.01 | 5.04 | 0.22 | 0.82 |
| K2O | – | – | – | – | – | 0.00 | 0.00 | – | – | – | – | – | 0.00 | 0.01 | K2O | 0.00 | 0.01 | 0.01 | 0.01 | 0.00 | 0.01 | 0.00 | 0.01 | 0.17 | 0.19 | 0.02 |
| Total | 99.74 | 99.52 | 99.73 | 99.93 | 99.49 | 99.73 | 99.52 | 99.95 | Total | 92.17 | 98.58 | 99.81 | 100.18 | 99.99 | 100.00 | |||||||||||
| Si | 1.87 | 1.93 | 1.87 | 2.98 | 1.90 | 1.93 | 1.90 | 2.99 | Si | 0.00 | 0.00 | 1.90 | 2.98 | 2.41 | ||||||||||||
| Ti | 0.02 | 0.00 | 0.02 | 0.01 | 0.02 | 0.00 | 0.01 | 0.00 | Ti | 0.01 | 0.95 | 0.00 | 0.00 | 0.00 | ||||||||||||
| Al | 0.26 | 0.16 | 0.25 | 1.99 | 0.21 | 0.16 | 0.20 | 2.00 | Al | 0.02 | 0.01 | 0.15 | 1.99 | 1.57 | ||||||||||||
| Cr | – | – | – | – | – | – | – | – | Cr | 0.10 | 0.02 | – | – | – | ||||||||||||
| Fe3+ | 0.03 | 0.00 | 0.03 | 0.04 | 0.02 | 0.00 | 0.01 | 0.02 | Fe3+ | 1.86 | 0.07 | 0.00 | 0.00 | 0.00 | ||||||||||||
| Fe2+ | 0.21 | 0.76 | 0.26 | 1.40 | 0.25 | 0.81 | 0.30 | 1.42 | Fe2+ | 1.00 | 0.90 | 0.74 | 1.50 | 0.01 | ||||||||||||
| Mn | – | – | – | 0.05 | 0.00 | 0.00 | 0.00 | 0.05 | Mn | 0.00 | 0.04 | 0.01 | 0.05 | 0.00 | ||||||||||||
| Mg | 0.66 | 1.13 | 0.70 | 1.04 | 0.66 | 1.07 | 0.69 | 1.02 | Mg | 0.00 | 0.02 | 1.18 | 0.95 | 0.00 | ||||||||||||
| Ca | 0.89 | 0.01 | 0.82 | 0.49 | 0.89 | 0.01 | 0.83 | 0.50 | Ca | 0.00 | 0.00 | 0.01 | 0.53 | 0.59 | ||||||||||||
| Ni | – | – | – | – | – | – | – | – | Ni | 0.00 | 0.00 | – | – | – | ||||||||||||
| Na | 0.06 | 0.00 | 0.06 | 0.00 | 0.06 | 0.00 | 0.05 | 0.00 | Na | 0.00 | 0.00 | 0.00 | 0.00 | 0.44 | ||||||||||||
| K | – | – | – | 0.00 | 0.00 | – | – | – | 0.00 | K | 0.00 | 0.00 | 0.00 | 0.00 | 0.01 | |||||||||||
| Sum | 4.00 | 3.99 | 4.00 | 8.01 | 4.00 | 3.98 | 4.00 | 8.00 | Sum | 3.00 | 2.00 | 4.00 | 8.02 | 5.03 | ||||||||||||
| XMg | 0.76 | 0.60 | 0.73 | 0.42 | 0.73 | 0.57 | 0.70 | 0.41 | XMg | – | – | 0.62 | 0.39 | – | ||||||||||||
Notes: Normal 15-keV EPMA analyses (wt% oxide and cations per formula unit) for garnet pairs and mean Mag/Ilm/Opx/Grt/Pl analyses. Bulk composition determined by combining these mineral analyses with QEMSCAN modes. “–” denotes elements not analyzed in a particular mineral. All iron is assumed to be FeO in this table, with the exception of the bulk composition where Fe2O3 was calculated in minerals using the method of Droop (1987). (Continued on next page)
High-resolution EPMA (HR-EPMA). To analyze the small analytical volumes of the <5 μm pyroxene exsolution lamella, lower accelerating potentials (<10 keV) were required. An accelerating voltage of 7 keV was selected to minimize the analytical volume of the analysis region (~400 nm diameter, ~500 nm penetration at 7 keV; Fig. 4), while still providing enough overvoltage to excite the CaKα line (Gopon et al. 2013). The estimates of analytical volume (Fig. 4) were determined using a Monte Carlo simulation of electron scattering using the CASINO (v2.1) software (https://www.gel.usherbrooke.ca/casino) and modeled using the average composition of clinopyroxene in our thin section (Table 1). Lower accelerating potentials were attempted to decrease the interaction volume further but were noted to give incorrect Ca concentrations of secondary standards due to low overvoltage of the CaKα X‑ray transition below 7 keV. A current of 10 nA was used, with 30 s on-peak and 15 s background count times. During analyses a liquid nitrogen cooled cold plate was used to keep contamination levels to a minimum (Gopon et al. 2015).

Backscatter electron image of pyroxene exsolution lamella (bright lines) in S98-14, overlain with the modeled electron interaction volume of a 7 keV (dark gray), 15 keV (orange), and 20 keV (blue) electron beam in orthopyroxene, using the CASINO (v 2.1) electron interaction modeling software. Image was acquired at 20 keV on a FEI Quanta650-FEG-SEM.
Iron, sodium, calcium, titanium, aluminum, silicon, and magnesium were analyzed using the following X‑ray lines and diffracting crystals: FeLα (PC1), NaKα (TAP), CaKα (LPET), TiKα (LPET), AlKα (TAP), SiKα (TAP), MgKα (TAP). Oxygen was calculated by stoichiometry. Standards used were: UW-7239 hedenbergite for Fe and Ca; University of Michigan synthetic ferrosilite for Si; University of Oxford synthetic MgO and TiO2 for Mg and Ti, respectively; albite for Na and Al in all samples.
Measurements of lamella composition were performed in a series of points along the length of each lamella. Stage reproducibility (the ability of stage automation to return to the desired site) below 1 μm is not possible on electron microprobes, therefore each point was acquired without the aid of any stage automation. The median composition of these points was determined, and any data points that were significant outliers (outside of 5 relative percent) from this median composition of a lamella were considered erroneous due to beam drift and removed. Also, any analysis with an oxide total of more than 102% and <98% was considered erroneous and removed. Analytical uncertainty for individual and averaged 7 keV analyses are reported in the Online Materials[1] B. It should be noted that the number of analyses averaged to generate the host and lamellae pyroxene compositions are much less than in the 15 keV portion of this study, and the uncertainty from counting statistics therefore lies in the second and third decimal place (Online Materials[1] B).
Mitigating issues with HR-EPMA analysis. The combination of a small beam size from a field emission-sourced microprobe, together with the low accelerating potentials necessary for analysis of sub-micrometer phases, introduces several issues that must be addressed (Gopon et al. 2013, 2015). These include but are not limited to problems with the generation of low-energy X‑ray lines, difficulty in aiming the electron beam, increased sample damage and enhanced sensitivity to surface contamination, and issues with secondary fluorescence.
Issues at low accelerating voltage due to bonding effects changing the X‑ray generation characteristics of a sample (especially for the L lines of transition metals), have been noted by several researchers (McSwiggen 2014; Heikinheimo et al. 2016; Buse and Kearns 2018), with numerous techniques being developed to mitigate these issues. In previous studies, the authors used the FeLl lines for low-voltage work for measurement of Fe in Fe-Si alloys (Gopon et al. 2013, 2017). However, because of the low-count rates of this X‑ray line, the relatively low abundance of Fe in these samples compared to the previous study, and the presence of appreciable amounts of Mg in pyroxenes (the II MgKα2 peak interferes on the FeLl peak), the FeLα peak was used instead in combination with careful standard matching for the analysis of iron.
Environmental and user-induced vibrations were noted to cause shifts in the beam position during analysis. Therefore, analyses were conducted in the evening, to reduce the effect of environmental vibrations and motion of the machine operator was limited during analysis. Spectrometer motion during the analysis was also noted to cause the beam to drift (up to ~50 nm for the parameter used here) from the intended analysis position. This drift is thought to be caused by electromagnetic interference from the spectrometer motors (personal communications with CAMECA Inst.) and has been noted in all FEG-EPMAs the authors tested (four CAMECA instruments and four JEOL). CAMECA instruments were found to generally have half of the drift compared to other manufacturers (Gopon et al. 2014). Therefore, an effort was made by the authors to limit spectrometer motion during the course of the analysis and the spectrometers were operated in synchronous mode, meaning that during operation spectrometers move and count in tandem. Secondary standards were run at the beginning of each day of measurement to test the validity of our calibrations.
In HR-EPMA we use a highly focused electron beam at low accelerating potentials. This means that while the same number of electrons interact with the sample, as in more traditional EPMA, the flux is much higher. This increased flux means that the potential for sample damage is also increased (Gopon et al. 2013). For this reason, a relatively low beam current of 10 nA was used in our analyses. An additional complication of operating at low accelerating potentials is that the smaller interaction volume means that any surface contamination will have a larger effect on the resultant analysis, as well as have a greater proportional effect in decelerating the electron beam (Gopon et al. 2015). To minimize this contamination all samples were thoroughly cleaned in a series of alcohol baths, a liquid nitrogen cold trap was used to minimize carbon buildup during analysis, and oil-free scroll pumps were used in the instrument.
Secondary fluorescence can potentially have a negative effect on the accuracy of EPMA measurements due to the primary generated X‑rays exciting atoms outside of the intended excitation volume and generating additional spurious X‑rays (Llovet et al. 2012; Bastin et al. 1984). For the example of the analysis of a 2 μm wide Ca-free Opx lamella in the center of a Cpx, PENELOPE modeling shows that 0.30 wt% CaO would be detected in the Opx, which would be entirely due to secondary fluorescence. Therefore, analyzing lamellae of varying width would have the effect of changing the apparent Ca concentration (Fig. 5). Note error bars in Figure 5 are determined based on the counting statistics for the simulated X‑rays that reach our simulated detector, which was modeled using the size and geometry of our SX5-EPMA.

Influence of lamellar width on apparent CaO concentration and subsequent two pyroxene (2-pyx) temperature using the QUILF program, for a (Ca free) Opx exsolution lamella in a Cpx grain. Modeled using PENELOPE and spectrometers at 45° to the lamellar orientation and 45° take-of angle, and the compositions listed in Figure 1 with the exception of Ca, which, to highlight the issue, was modeled as 0.00 wt%.
Range of temperatures determined from the different techniques
| Method | Reference | Analyses used | Uncertainty | Cpx Crystal 1 T (°C) | Cpx Crystal 2 T (°C) | Other T (°C) | Average T (°C) |
|---|---|---|---|---|---|---|---|
| Single pyroxene | Lindsley (1983) | Cpx recomb | ±50 °C | 1025 | 980 | – | 1003 |
| Phase equilibrium modeling | Green et al. (2016) | Grt; Cpx; Opx; Pl; Mag; Ilm | ±150 °C | – | – | 950 | 950 |
| Grt-Cpx | Powell (1985) | Cpx recomb; Grt pair | ±20 °C | 885 | 892 | – | 884 |
| Cpx rim avg; Grnt rim avg | ±70 °C | – | – | 755 | |||
| Ravna (2000) | Cpx recomb; Grt pair | ±100 °C | 859 | 828 | – | 846 | |
| Cpx rim avg; Grnt rim avg | ±70 °C | – | – | 670 | |||
| Opx-Cpx | Andersen et al. (1993) | Opx lam (uncorr Ca); Cpx host | ±16 °C | 742 | 737 | – | 740 |
| Andersen et al. (1993) | Opx lam (corr Ca); Cpx host | ±16 °C | 590 | 594 | – | 592 | |
| Mag-Ilm | Powell and Powell (1977) | Mag; Ilm | ±12.5 °C | – | – | 382 | 382 |
| Spencer and Lindsley (1981) | Mag; Ilm | ±13 °C | – | – | 508 | 503 | |
| Anderson and Lindsley (1985) | Mag; Ilm | ±14.5C | – | – | 509 | 502 |
In the pyroxenes studied, all elements measured were investigated for issues of secondary fluorescence using X‑ray generation modeling software (Llovet and Salvat 2016). Of the elements analyzed, only Ca was deemed to have an appreciable secondary fluorescence influence. Because the Ca content has the largest influence on the temperature produced by the thermometry methods used (Fig. 5; Lindsley 1983), a set of corrections was developed to adjust the Ca measurements for the influence of secondary fluorescence.
These corrections involved using the pyPENELOPE software (Pinard et al. 2010), to model the influence of secondary fluorescence on the composition measured by EPMA. The software allows the user to define complex compositions and geometries, including that of the lamella in relation to its host, to simulate the movement and generation of electrons and X‑rays in the analytical target, its neighboring phases, and the detector. Tailored simulations using the uncorrected pyroxene compositions, lamellar widths and orientations, as well as spectrometer geometries were run on each lamella-host pair to properly remove the excess Ca measured in the low-Ca pyroxene. For each host-lamella pair a simulation was run for the lamella composition modeled as a bulk material and the lamella composition modeled as an appropriately sized lamella (derived from BSE images; Fig. 6; Table 1) in the host composition. The difference in the modeled Ca X‑ray intensity from the lamella simulation and the bulk simulation was then used to determine the excess Ca attributed to secondary fluorescence. An adjustment was then made to the uncorrected lamella analysis to remove this excess Ca (Table 1).

Backscattered electron image showing the exsolution of orthopyroxene (Opx), from a clinopyroxene (Cpx) host. Note the dashed line, which shows the extent of lamellar growth.
Thermobarometry
This study attempts to use a combination of thermobarometric techniques, alongside careful petrography, to better constrain the peak metamorphic and retrograde conditions experienced by the Lewisian Complex.
Conventional thermometry. First, conventional Grt-Cpx thermometry, using the calibrations of Powell (1985) and Ravna (2000), was completed using an average of 20 analyses from the middle of the garnet transects from standard EPMA analysis and proto-Cpx compositions (see “Single proto-Cpx thermometry” section). Garnet core analyses were used because they are assumed to be least susceptible to equilibration through diffusion (Caddick et al. 2010). This was followed by Grt-Cpx thermometry from the rims of garnet and clinopyroxene, which should provide a minimum temperature for the end of corona formation. Two-pyroxene thermometry (Andersen et al. 1993) was applied to single crystals using the lamella and host compositions obtained from HR-EPMA analysis. This single crystal two-pyroxene thermometer should record the temperature of pyroxene exsolution on the retrograde path. Finally, Mag-Ilm thermometry, using the calibrations of Carmichael (1966), Powell and Powell (1977), and Spencer and Lindsley (1981), was calculated using the ILMAT spreadsheet of Lepage (2003) and oxide compositions from standard (15 keV) EPMA analyses. The uncertainty in the temperature derives mostly from the equations in the thermometer itself, and we therefore report the uncertainty of the techniques as cited in the original papers (Table 2). The estimated uncertainty of the Ravna (2000) thermometer is higher than the rest, as it is the only work that did not estimate error from equations, but instead used the deviation from experimentally made mineral pairs. The largest uncertainty of the Mag-Ilm thermometer comes from the experimental calibrations of ulvospinel and ilmenite activities. We therefore report the uncertainty of Mag-Ilm as the range of temperatures obtained from using the activities calculated by Carmichael (1967), Anderson (1968), Spencer and Lindsley (1981), and Stormer (1983).
Phase equilibrium modeling. Phase equilibrium modeling presents an alternative method for determining the peak P-T conditions of granulite facies rocks. The recent development of activity-composition (a-X) relations for minerals in upper amphibolite and granulite facies mafic rocks (Green et al. 2016), has allowed P-T paths to be constrained using this technique, for several high-grade terranes including the Lewisian. Observed mineral assemblages are matched to those on thermodynamically predicted phase diagrams to find the P-T conditions of formation. Phase diagrams were constructed to provide a pressure constraint to the temperatures obtained from exchange thermometers. In our sample, these were produced in the 9-component Na2O-CaO-K2O-FeO-MgO-Al2O3-SiO2-TiO2-O2 (NCKFMASTO) system using Theriak/Domino version 11/02/2015 (de Capitani and Petrakakis 2010) and the internally consistent data set of Holland and Powell (2011; update ds62, 06/02/2012). Note that H2O was excluded from the system, because the selected sample contains no primary hydrous phases. The following activity-composition (a-X) relations were used: melt, clinopyroxene (Green et al. 2016); garnet, orthopyroxene, and biotite (White et al. 2014); epidote (Holland and Powell 2011); magnetite-spinel (White et al. 2002); ilmenite-hematite (White et al. 2000); plagioclase and K-feldspar (Holland and Powell 2003). Pure phases included quartz and rutile.
Effective bulk compositions were calculated by combining modal proportions of phases, from QEMSCAN, with representative mineral compositions, from EPMA. EPMA-derived mineral compositional analyses (in wt% oxide) were converted to molecular mineral formulas using a standard number of oxygen atoms per formula unit. The proportion of Fe3+ in pyroxene and garnet was determined using the method of Droop (1987). For consistency, when building effective bulk compositions, we disregarded any minor elements from EPMA analyses that were not incorporated in a mineral’s a-X relation. (e.g., Ti in Cpx or Mn in Grt). This method allows a petrographically based assessment of which phases are participating in any specific equilibration process, and therefore of determining an effective bulk composition for different stages of the sample’s evolution, on petrological criteria.
The general assumption in phase equilibrium modeling is that the appropriate composition to use is the total bulk composition of the sample. This will be the case if equilibrium is achieved for major elements among all minerals present, and this is most likely at peak granulite conditions. If retrograde processes have subsequently altered the mineral compositions, or changed the mineral assemblage, the total rock composition is still applicable if the whole-rock system is essentially closed. As described earlier, the sample in question is an anhydrous rock with a distinctive microstructure of finer-grained coronas composed of plagioclase and orthopyroxene surrounding garnet. Therefore, we first calculate a phase diagram for the total bulk composition to constrain the pressures for the peak conditions in the sample, before corona development. Second, after demonstrating that certain domains in the rock, i.e., the core regions of coarse-grained clinopyroxene, were isolated from the retrograde reaction that formed the coronas, we investigate the effect of a bulk composition modified by a varying contribution of clinopyroxene, to determine the limits on pressure for corona formation.
The importance of bulk composition information for determining the stability limits of mineral assemblages was emphasized by Powell and Holland (2008). However, the uncertainty on the boundaries of mineral assemblage fields is not often assessed. Here we test the sensitivity to bulk composition variation using a Monte-Carlo type randomization that perturbs the volume percent of each mineral with a ±20% relative uncertainty, following the approach of Palin et al. (2016a). For sample S98-14, 20 new bulk compositions were created, and 20 phase diagrams produced to assess the uncertainty on certain critical assemblage field boundaries. We take the range in field boundaries as the best estimate of pressure uncertainty.
Single proto-Cpx thermometry. Frost and Chacko (1989) suggested that “the best way to recover high temperatures in granulite terrains is through the reintegration of exsolution lamellae or the use of relict mineral assemblages.” Following this approach, we attempt to calculate the original pyroxene composition, prior to exsolution, using a two-stage process. First, the percentages of host and lamella in the crystal were determined from backscattered electron images of the high-Ca pyroxene grains using the thresholding tool in the freely available ImageJ Software (https:// imagej.nih.gov/ij/). The recombined proto-Cpx composition was then calculated using these percentages, together with the average lamella and host compositions from HR-EPMA analysis. Single pyroxene thermometry was then conducted on these recombined analyses using the experimental calibrations of Lindsley (1983).
This thermometer is graphical and requires one to plot the clinopyroxene composition in ternary pyroxene space, using a specific set of calculations to determine wollastonite, enstatite, and ferrosilite contents. These calculations can be completed using the pyroxene component algorithm in the QUILF program (Andersen et al. 1993). The uncertainties of the temperatures obtained using this technique are taken from the original paper.
A simpler but flawed approach to determining the “bulk” clinopyroxene composition would be to use a large, defocused electron beam that would analyze the host and lamella simultaneously. This method was attempted and deemed to give erroneous numbers (see Online Materials[1] B) because it ignores the assumption in the matrix corrections of EPMA that only one phase is analyzed at a time, as well as analyzing different proportions of host and lamellae in each analysis spot.
Results
Petrographic and modal analysis
QEMSCAN analysis of S98-14 determined that the thin section is composed of (in area%) 35.6% garnet, 35.6% clinopyroxene, 11.1% orthopyroxene, 14.6% plagioclase feldspar, 0.14% quartz, 0.19% magnetite, and 0.11% ilmenite. Hydrous minerals, including biotite and hornblende, as well as accessory pyrite, are found in small quantities (<<1%). Grain size analysis of the four major minerals (Fig. 7) determined that garnet ranges in size from 0.5–3.5 mm (2.1 mm average), clinopyroxene ranges from 0.5–2.5 mm (0.9 mm average), and orthopyroxene and plagioclase feldspar do not exceed 0.5 mm in size (0.21 and 0.24 mm average). The spread and uneven distribution of garnet sizes is due to the comparatively small number of (large) garnets and the difficulty separating individual garnet grains from the large garnet aggregates in the thin sections considered.
Garnet and clinopyroxene occur within a coarse granoblastic texture, with relatively smaller clinopyroxene grains sometimes appearing as inclusions in garnet (Fig. 2). Plagioclase feldspar is generally found in contact with garnet as part of a corona texture (cf. O’Hara 1961; Barnicoat 1983; Johnson and White 2011; Fig. 3). A few examples of plagioclase not in contact with garnet can be found throughout the thin section, but these still occur as circular masses, which we interpret as surrounding a garnet occurring outside the plane of the thin section. Orthopyroxene occurs in two habits, as granular minerals (0.1–0.5 mm) generally found in contact with plagioclase feldspar on the outer edges of the corona textures, and as exsolution lamellae (<10 μm) within granoblastic clinopyroxene. The lamellae of orthopyroxene do not reach the edge of most of the host clinopyroxene crystals (Fig. 6), which we take as an indicator of exsolution of the original pyroxene in a closed system. Rare examples of orthopyroxene not adjacent to plagioclase are found, but are interpreted as being in contact with plagioclase in the third dimension or noted to be connected with the corona textures via narrow bands of orthopyroxene. Oxide minerals are relatively rare, but are exclusively contained within the plagioclase portion of the corona textures (Figs. 2 and 3). Oxides are mostly magnetite and ilmenite and are always found in contact with each other, with ilmenite generally being volumetrically smaller. Quartz is generally found on grain boundaries in coronas, and in rare cases as inclusions. The general mineral association within the corona textures is a core of garnet, surrounded by a corona of plagioclase feldspar, oxide minerals found within the plagioclase ring, and granular orthopyroxene located on the edge of the plagioclase ring away from the garnet (Fig. 3).
EPMA
Table 1 shows a compilation of the mean weight percent oxide analyses and calculated cations per formula unit (cpfu) taken during both the 7 and 15 keV analytical sessions. The full analyses from which these averages are derived are included in the Online Materials[1] B. Error estimates of individual analyses are reported in the Online Materials[1] B and are not shown in Table 1, due to the large number of analyses combined to generate each value, making the error from counting statistics smaller than the significant digits reported. All minerals show minimal within-grain compositional variation: plagioclase is labradoritic [XAn = Ca/(Ca+Na+K) = 0.59]; matrix-orthopyroxene has XMg = Mg/ (Mg+Fe2+) = 0.63 and Al = 0.17 cpfu; magnetite has Cr = 0.10 cpfu; ilmenite has Mn = 0.04 cpfu and Cr = 0.02 cpfu; garnet is dominantly almandine (49%), with lesser pyrope (31%), grossular (18%), and spessartine (2%) components. Line scans across two garnet crystals elucidate slight heterogeneity, with a <0.2 wt% increase in CaO and decrease in MgO from core to mantle, transitioning into more moderate (~0.5 wt%) increase and decrease at the rim in contact with plagioclase coronas (Fig. 8). It is noted that the compositions do not plateau in the core of the garnet. Proto-Cpx has XMg = 0.70, Na = 0.06 cpfu, Al = 0.20 cpfu, and Ca = 0.82 cpfu, classifying as diopside–augite (Morimoto 1988). When comparing Na, Ca, and Fe contents of the cores and rims of matrix clinopyroxene and clinopyroxene included in garnet, slight compositional heterogeneity exists (Fig. 9; Online Materials[1] B). Rims are typically Na-poor and Ca-rich compared to matrix cores and included clinopyroxene; while recombined proto-Cpx is relatively Ca-poor and Fe-rich. The heterogeneity in clinopyroxene is due to varying amounts of host clinopyroxene and orthopyroxene lamellae in the analytical volume.

Grain size analysis of the 4 major minerals present in sample S98-14, taken as a representative sample for the metabasic rocks at Scouriemore.
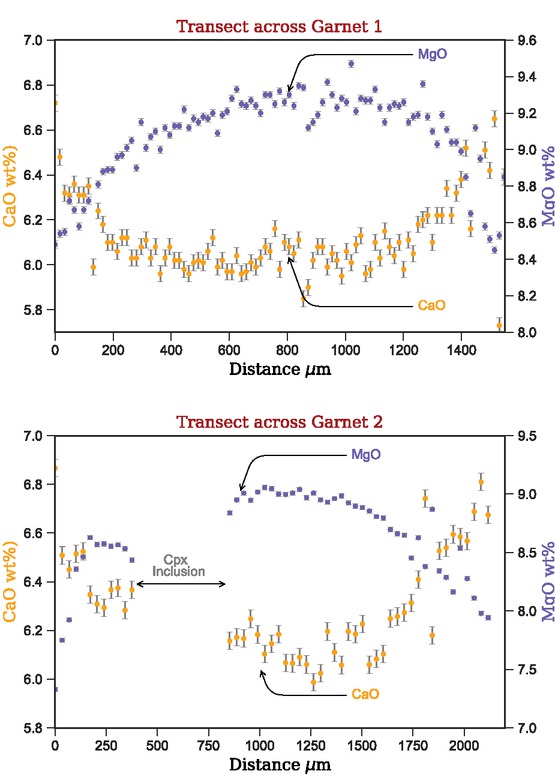
Garnet line profiles (locations shown in Fig. 5) exhibiting the change in CaO and MgO (wt%). Note the gap in the Garnet 2 data, which corresponds to a Cpx inclusion.

Na and Fe (total) cations per formula unit (cpfu) plotted vs. Ca cpfu. Note the slight decrease in Na content for the non-lamellae containing rims, as well as the general trend in the data toward the recalculated proto-Cpx composition (blue). Error bars are shown but are smaller than the symbol, with the exception of Na for the Cpx; proto-Cpx composition are the average of 12 analyses so have a smaller error than the symbol even for Na.
Thermobarometry
Table 2 shows the results of the application of different thermometers to S98-14. A range of temperatures was produced depending on the mineral system chosen for analysis.
Grt-Cpx thermometry, using the calibrations of Powell (1985) and Ravna (2000), obtained temperatures of ~830–880 °C, using recombined (proto-Cpx) clinopyroxene compositions and garnet cores, and ~670–760 °C using clinopyroxene rim and garnet rim compositions. Proto-Cpx compositions were calculated from analyses of exsolution lamellae of orthopyroxene and host clinopyroxene using the methods outlined in “Single proto-Cpx thermometry” section. Garnet core, garnet rim, and clinopyroxene rim compositions are noted in the Online Materials[1] B. Two-pyroxene thermometry from non-recombined matrix clinopyroxene and exsolved orthopyroxene (Andersen et al. 1993) derived temperatures of ~740 °C, when considering Opx lamellae that had not been corrected for excess Ca contents due to secondary fluorescence. In contrast, when fluorescence-corrected orthopyroxene analyses were used, this calibration returned lower temperatures of ~590 °C (“High resolution EPMA (HR-EPMA)” section). Mag-Ilm thermometry of the exsolved oxides within the garnet coronas, yielded temperatures ~460 °C.
The effective bulk composition for phase equilibrium modeling, as well as the mean mineral compositions used for its calculation, are presented in Table 1. Figure 10a shows the isochemical P-T phase diagram for this specific bulk composition. “Petrographic and modal analysis” section outlines mineral associations that suggest a garnet-clinopyroxene (±plagioclase feldspar) peak mineral assemblage free from orthopyroxene and the oxide minerals currently present in the sample. Based on these associations, the closest match to the peak assemblage is the field Cpx-Grt-Pl-Rt-Qtz, which spans a range of pressures above 10 kbar and temperatures up to the dry solidus at ~1050–1100 °C. There is no direct evidence in the rock for rutile at peak conditions, despite a small modal amount (<1%) being predicted by the phase diagram for our bulk composition (see “Obtaining peak P-T conditions” section for discussion of this).
![Figure 10 (a) Isochemical P-T phase diagram for S98-14. The large, bolded assemblage (Cpx-Grt-Pl-Rt-Qz) represents the closest match to our interpreted peak assemblage. The red, gray, and blue shaded regions depict the uncertainty on the garnet, quartz, and orthopyroxene mode-zero lines (Grt-in, Qz-in, and Opx-out) determined from 20 randomly generated bulk compositions. (b) P-X phase diagram showing the effect of varying the contribution (vol%) of clinopyroxene to the calculated bulk composition. The scientific color map “batlow” (Crameri 2021; Crameri et al. 2020) is used to depict the predicted ratio among the volumes of corona minerals [Grt/(Grt+Pl+Opx+Ox)].](/document/doi/10.2138/am-2022-8214CCBY/asset/graphic/j_am-2022-8214CCBY_fig_010.jpg)
(a) Isochemical P-T phase diagram for S98-14. The large, bolded assemblage (Cpx-Grt-Pl-Rt-Qz) represents the closest match to our interpreted peak assemblage. The red, gray, and blue shaded regions depict the uncertainty on the garnet, quartz, and orthopyroxene mode-zero lines (Grt-in, Qz-in, and Opx-out) determined from 20 randomly generated bulk compositions. (b) P-X phase diagram showing the effect of varying the contribution (vol%) of clinopyroxene to the calculated bulk composition. The scientific color map “batlow” (Crameri 2021; Crameri et al. 2020) is used to depict the predicted ratio among the volumes of corona minerals [Grt/(Grt+Pl+Opx+Ox)].
The three major constraints on our rock are the garnet, quartz, and orthopyroxene mode-zero lines, which denote the boundaries in P-T space where these phases disappear from the predicted assemblage (Fig. 10). The Opx mode-zero line (Opx-out) provides a minimum pressure for our assumed peak assemblage, the Qz mode-zero line (Qz-out) provides a minimum pressure for the end of corona growth, while the Grt mode-zero line (Grt-in) represents a minimum pressure for the final corona stage. Additionally, the corona mineral assemblage (Opx-Pl-Ilm) is a constraint itself, as it falls within the phase field Opx-Cpx-Grt-Pl-Ilm. To show the sensitivity of the Grt, Qz, and Opx mode-zero lines to bulk composition, the range of P-T conditions over which they lie for the 20 randomly generated bulk compositions is shown by the blue (Opx), gray (Qz), and red (Grt) shaded regions (Fig. 10a). We use this as the best estimate on the uncertainty of our phase equilibrium modeling P-T work.
Because textural evidence demonstrates that the core regions of coarse-grained clinopyroxene may have been isolated from the retrograde reaction that formed the coronas, we produced a P-X diagram in which the volume percent clinopyroxene inputted into the calculated bulk composition is varied between 35.6 and 0% (Fig. 10b). This allowed assessment of how the predicted proportion of corona minerals changes for a range of different inputted clinopyroxene volumes (Fig. 10b). Figure 10b shows that for the full range of bulk compositions there is little change in the pressure at which the corona forming reaction initiates (i.e., Opx-out line). It also highlights that considerable change in the volume percent of the corona minerals occurs between the orthopyroxene and quartz mode-zero lines, with almost no change once quartz has left the assemblage (Fig. 10b).
Finally, single pyroxene thermometry (Lindsley 1983) using the corrected and proto-Cpx composition (“Single proto-Cpx thermometry” section) obtained temperatures ranging from 980 to 1025 °C (Fig. 11; Table 2). Pyroxene thermometry assumes coexisting clino- and orthopyroxene. In the absence of a coexisting Ca-poor pyroxene, the clinopyroxene is not saturated in the orthopyroxene component. Therefore, the temperature obtained will be a minimum estimate for the inferred orthopyroxene-free peak assemblage, and we take the highest temperature obtained as the best estimate of peak.

Ternary plot (adapted from Lindsley 1983) showing host Cpx, lamella Opx, and recombined “proto-Cpx” compositions for two grains from S98-14 and the subsequent calculated temperatures. Pyroxene end-member compositions were calculated using the QUILF program and temperatures calculated using the Lindsley (1983) calibrations.
Discussion
Microstructural significance
Understanding the mineral relationships that are preserved in the breakdown microstructures is crucial if the aforementioned thermometers and barometers are to be applied correctly, and accurate P-T estimates are to be obtained for the different stages of metamorphism. The coronas are perhaps the most striking microstructural feature of the mafic granulites found at Scouriemore (Fig. 2) and have previously been observed by several authors (O’Hara 1961; Savage and Sills 1980; Barnicoat 1983; Johnson and White 2011), who attribute their formation to the breakdown of a high-temperature garnet (possibly reacting with clinopyroxene) to form plagioclase feldspar, orthopyroxene, and magnetite. This reaction is thought to occur due to retrograde decompression, either as part of a separate metamorphic event or during slow cooling from peak conditions. Thus, the key questions that arise are, how extensive was this reaction, what was the peak metamorphic assemblage, and how do we best use this information to re-interpret the P-T history of these rocks?
Johnson and White (2011) indicated that while orthopyroxene and plagioclase are present within both the coronas and matrix, magnetite generally only exists in the coronas and thus advocated a peak assemblage of Cpx-Grt-Pl-Opx-Ilm. In contrast, Savage and Sills (1980) found a complete lack of plagioclase within the matrix and therefore proposed an initial assemblage of garnetclinopyroxene. They bolstered this hypothesis by confirming that garnet was absent in samples with the highest XMg ratio, and best preserved in those with the lowest XMg ratio (Savage and Sills 1980). These two models represent end-members of a spectrum with a high-pressure, high-variance assemblage (Grt-Cpx) on one side and a moderate-pressure, lower-variance assemblage (Grt-Cpx-Pl-Opx) on the other.
In our assessment of the peak metamorphic assemblage, we consider the textural setting, relative size, and compositional heterogeneities of the minerals. Figures 2 and 7 illustrate the striking bimodal grain size distribution between coronal plagioclase-orthopyroxene and the relatively larger clinopyroxene and garnet. This size discrepancy was noted to varying degrees in all samples the authors characterized (Online Materials[1] A), with clinopyroxene generally greater than twice as large as orthopyroxene, when they exist in the same sample. This size discrepancy can also be seen in the images from previous studies (Feisel et al. 2018; Johnson et al. 2012; Johnson and White 2011). The comparable size and spatial relationship of plagioclase and orthopyroxene (Fig. 7), as well as their textural relationship with garnet, would suggest that they grew over a similar temperature and/or time window. Although plagioclase and orthopyroxene do also sometimes appear to coexist in the matrix, seemingly distant from any garnet, this probably represents a cut effect due to slicing the rock in such a fashion to only see the corona. Some of this “matrix” orthopyroxene is observed connecting with corona textures via a narrow band of orthopyroxene (Fig. 3). This shows that mineral growth from the garnet breakdown can occur outside of the immediate area of the corona texture. In other cases, they may result from all garnet within a local region degrading as the corona forming reaction runs to completion.
Our findings generally agree with those of O’Hara (1977), Barnicoat (1983), and Savage and Sills (1980) in that orthopyroxene, plagioclase, and magnetite-ilmenite only grew during the retrograde path. A caveat to this interpretation is that the peak garnet composition cannot be retrieved from the corona products (Opx-Pl-Ilm-Mag) alone. The Na content of the labradorite in the corona requires an extra source for Na, either from pre-existing Na-rich plagioclase, and/or from clinopyroxene. The decrease in Na content in the rims of matrix clinopyroxene (Fig. 9) suggests that clinopyroxene was, at least in part, involved in this reaction. However, the Na content and vol% of the corona plagioclase is too high to have been solely sourced from the clinopyroxene. As such peak plagioclase must be a reactant in the full corona-forming reaction. Because we do not know the composition of the peak plagioclase or the amount of clinopyroxene and/or peak plagioclase consumed, it is difficult to write a balanced reaction that considers all of the phases that petrography suggests. We instead write a simplified volume balance 1 for the minimum phases required for a garnet breakdown reaction.
We note that this volume balance has excess SiO2 in the products, and therefore requires quartz as a reactant to balance. The crossing of the quartz mode-zero line (Fig. 10) is therefore potentially important in the corona-forming reaction. We note that our thin section does include rare examples of quartz as inclusions, strengthening our argument of peak quartz, and that a quartz consuming retrograde reaction 1 is possible. We know from petrographic and mineral chemical evidence that the actual breakdown reaction likely included precursor plagioclase as well as the consumption of small amounts of clinopyroxene, as evidenced by the high-Na content of the corona plagioclase.
We therefore suggest the following generalized reaction 2 based on mineral relationships, abundances, compositions, and our volume balance 1.
The presence of clinopyroxene as a reactant in 1 and 2 might imply that it has lost its peak composition. However, Figure 6 shows that the lamellae do not reach the edge of most of the clinopyroxene grains. This carries two implications: that the lamella boundaries did not provide pathways for the interior to communicate with the grain-boundary network, and that the exsolution occurred within a system isolated from the rest of the rock. This minimizes the possibility that the interiors of clinopyroxene grains have changed their bulk composition since peak, or near-peak, conditions. Consequently, the contribution of clinopyroxene to the corona-forming reaction is probably from the consumption of clinopyroxene grains around the immediate perimeter of the corona, together with some compositional exchange via the grain-boundary network, with lattice diffusion over a limited distance affecting clinopyroxene rims (Fig. 9). We can place constraints on the amount of clinopyroxene that may have reacted by assuming that the titanium in the corona assemblage comes entirely from the breakdown of clinopyroxene. There is reason to believe that that the peak mineral assemblage did not contain a titanium-dominant phase, as would be suggested from phase equilibrium modeling (see “Obtaining peak P-T conditions” section), and that all Ti-oxide phases came from the breakdown of clinopyroxene (±garnet) in reaction 1. This would mean that a mass balance of ilmenite and clinopyroxene places an upper limit on the amount of clinopyroxene that might have reacted. Using the measured TiO2 content of clinopyroxene and the current vol% ilmenite, suggests that 20–30% of the clinopyroxene was consumed in reaction 2.
In summary, using microstructural evidence, we interpret the peak assemblage to be clinopyroxene and garnet (±plagioclase and quartz) with no orthopyroxene as either lamellae or individual grains. Subsequently, coronas consisting of plagioclase and orthopyroxene formed around garnets, at the expense of garnet, parts of the adjacent clinopyroxene, and the peak plagioclase and quartz predicted by phase equilibrium modeling. This Fe-Ti oxide later exsolved to form the magnetite-ilmenite intergrowth we see today.
Obtaining peak P-T conditions
Determining the peak P-T conditions of high-temperature rocks has presented a challenge to metamorphic petrologists for some time (O’Hara 1977; Frost and Chacko 1989; Harley 1989; Fitzsimons and Harley 1994; Pattison and Bégin 1994; Chacko et al. 1996; Pattison et al. 2003). This is a result of exchange thermometers having an apparent closure temperature below that of peak granulite facies conditions, meaning that the mineral compositions have probably been affected by down-temperature diffusional resetting during the initial stages of cooling (O’Hara 1977; Frost and Chacko 1989; Pattison and Bégin 1994). Aside from the obvious implications for temperature estimation, this also has a feedback effect (Harley 1989), because calculated pressures depend on temperature. Frost and Chacko (1989) coined this problem of unreliable P-T estimation in high-grade rocks the “granulite uncertainty principle.”
In our case, the rock records a continuum of retrograde metamorphic processes in which minerals behaved differently. Therefore, linking mineral compositions to the same event can be problematic and determining P-T conditions using conventional thermobarometry, without petrographic evidence for local equilibrium relationships, is inappropriate.
Some have suggested that phase equilibrium modeling may be a superior technique for determining the peak metamorphic conditions in granulite facies rocks (e.g., Palin et al. 2016b; Feisel et al. 2018). Nevertheless, when simply matching observed mineral assemblages to those predicted on phase diagrams this technique suffers from high-variance assemblage fields providing little constraint on temperature. Some authors compare observed modal abundances or mineral compositions to those predicted within these fields to tighten their P-T condition (Powell and Holland 2008). However, recent studies have shown that the current a-X relations fail to reproduce natural mineral compositions for some phases, which in turn affects modal abundance predictions and phase diagram topology (Forshaw et al. 2019; Santos et al. 2019; Starr et al. 2020).
Another issue in phase equilibrium modeling relates to the majority of activity-composition relations for silicates only accounting for major element chemistry. Minor and trace components, such as Ti, are not accommodated in all mineral solution models (e.g., Cpx in Green et al. 2016; Grt in White et al. 2014). This is problematic in our sample because titanium cannot be allocated to the two major peak minerals (clinopyroxene and garnet) for which EPMA analyses reveal a minor titanium component (Table 1; Online Materials[1] B). As a result, a stoichiometric Ti-bearing mineral (in our case rutile) is predicted to occur, even though the amount of titanium in the rock could be accommodated as trace components in the existing silicate minerals. We attempted to circumvent this issue when calculating our effective bulk composition by removing titanium contents of silicate minerals and only including titanium from ilmenite. In comparison, an XRF-derived bulk composition would include titanium that is “locked” up in silicates. Even so, we predict rutile in low modal abundance (<1%) at our peak P-T conditions. We hypothesize that rutile either: (1) reacted to form ilmenite/ magnetite during decompression, or (2) did not exist at peak and this small amount of TiO2 was incorporated as a trace element in the large quantities of clinopyroxene and/or garnet. We note that all of the Ti-bearing minerals occur within garnet coronas and that analyses of clinopyroxene combined with modal proportion estimates indicate that it contains four times as much titanium as that contained in oxide minerals. Additionally, in 1 we invoke the breakdown of a small amount of clinopyroxene (20–30 vol%; “Microstructural significance” section) in the corona forming reaction, which would be a source for titanium in the corona mineral assemblage. It is therefore possible that all titanium was contained in garnet and clinopyroxene at peak, and that rutile need not have been part of the predicted peak assemblage.
Both this and previous studies suggest that minerals in the Scouriemore metabasites equilibrated, partly or wholly, by reaction or interdiffusion, at different stages in the metamorphic cycle. Even those that may well have reached equilibrium at some stage, such as garnet and clinopyroxene at peak conditions, have behaved differently during the retrograde evolution. The application of phase equilibrium modeling is complicated by these disequilibrium textures (cf. White et al. 2008). However, when combined with detailed optical microscopy, these petrographic relationships can be used to determine likely peak and retrograde assemblages.
As a result, we have examined these issues, and argue that it is possible to determine valid constraints on pressure and temperature by considering individual features in terms of local equilibrium, diffusional closure, and reconstructing the peak compositions of minerals in local domains. Disequilibrium textures can be used to determine retrograde conditions, but when using phase equilibrium modeling to do so the uncertainty regarding composition and volume percent of the disequilibrium textures must be considered. Fortunately, for our sample changing the effective bulk composition has a negligible effect on the predicted phase fields (Fig. 10b) and means that the corona assemblage can be used to obtain retrograde pressures. The observed garnet and clinopyroxene chemical zonation can be used to obtain upper and lower estimates on the temperature diffusional closure for garnet breakdown. Temperatures obtained from exsolution features in pyroxene and oxides place further temperature constraints on retrograde conditions. The petrographic observations and complex retrograde zoning patters, show that recombined single pyroxene thermometry is the best predictor of peak temperature conditions.
This single pyroxene thermometry of a recombined proto-Cpx analysis is not limited to a specific assemblage, requiring only the presence of clinopyroxene, a mineral that is stable for most upper-amphibolite and granulite facies mafic rocks. It also does not require chemical equilibrium between minerals, just that the clinopyroxene as a whole retains its peak composition during exsolution (Fig. 6). However, single pyroxene thermometry is only applicable to high-Ca pyroxenes, due to the close spacing of temperature contours for low-Ca pyroxenes (Fig. 11). The need to correct for the effects of secondary fluorescence should also be considered prior to analysis and can be achieved using PENELOPE modeling (Pinard et al. 2010). In these samples, the need for correction was apparent due to the specific geometries (<5 μm Opx lamella in Cpx) and the large influence that Ca has on pyroxene thermometry (Lindsley and Frost 1992; Fig. 5). It is also important to consider when this technique should be used over other existing thermobarometric methods. Calculating a recombined proto-Cpx analysis for single pyroxene thermometry is most useful: (1) when the peak composition is no longer retained in one of the minerals and (2) when an applicable two-mineral exchange thermometer is absent.
Implications for the Lewisian Complex
In the case of the mafic rocks from Scouriemore investigated here, the restricted mineral assemblage means that a limited number of exchange thermometers can be used to study the metamorphic history, but also that determining local equilibrium assemblages is simpler. A range of temperatures have been obtained from a single, representative, well preserved, sample (S98-14; Table 2), which highlights the need for careful petrography and analytical parameters if geologically meaningful temperatures are to be obtained. Here, we attempt to relate the temperatures obtained from different thermometers to the stages in the metamorphic evolution of the rock discussed above.
Above, we propose that single pyroxene thermometry is the best predictor of the peak temperature conditions of ultrahigh-temperature metamorphism, hence we take >1025 °C to represent peak conditions. When assessing pressures, we have inferred that orthopyroxene is observed only as part of the corona texture and thus the peak assemblage was likely garnet-clinopyroxene (±plagioclase-quartz). Phase equilibrium modeling constrains this assemblage and thus peak pressures to >11.5 kbar for the original bulk composition, and >11 kbar for the 20 random bulk compositions (lower extent of blue region on Fig. 10a). Therefore, we interpret peak Badcallian metamorphic conditions to lie at >1025 °C and >11 kbar.
A subsequent metamorphic event and/or cooling and decompression from peak produced the corona textures of the garnets (O’Hara 1961; Barnicoat 1983; Johnson and White 2011). Line scans through garnet highlight the change in composition from core to rim (Fig. 8), which results in garnet cores returning higher Grt-Cpx temperatures than rims, as was noted by previous authors (Barnicoat 1983; Sills and Rollinson 1987). The notable lack of a flat interior plateau in these profiles shows that the peak composition has been lost, probably due to late diffusional exchange related to corona formation. Therefore, the core of the garnet cannot be used to determine peak conditions and the ~850 °C garnet(core)/proto-Cpx temperatures is interpreted to record some intermediate time during the exchange process. The garnet(rim)/ clinopyroxene(rim) temperature then represents the closure of this system at ~700 °C. Phase equilibrium modeling provides a constraint on pressure with the observed assemblage (Opx-Cpx-Grt-Pl-Ilm) found at 7–9 kbar, consistent with the results of Johnson and White (2011) and Feisel et al. (2018). The large pressure and temperature difference (>2 kbar/~200 °C) between peak and corona formation are suggestive of a subsequent metamorphic event.
In clinopyroxene crystals, where orthopyroxene lamellae do not reach the proto-grain boundary, we are able to assume exsolution has occurred in a closed system. Thus, we interpret the two-pyroxene temperature of ~590 °C as recording the end of clinopyroxene exsolution. Magnetite-ilmenite thermometry generates even lower temperatures (~460 °C), but due to the lower closure temperature of oxides relative to silicates, this temperature is probably recording the late stages of the metamorphism, that caused clinopyroxene exsolution.
Figure 12 exhibits a P-T diagram that summarizes the P-T estimates given above and shows a proposed P-T-t path for the rocks of Scouriemore. For those temperatures where independent pressure estimates could not be obtained (Mag-Ilm and Cpx-Opx) we use literature estimates for the correlating pressures (Cartwright and Barnicoat 1989). We infer that peak pressures were much higher than have been suggested by recent phase equilibrium modeling results, in line with those suggested by Cartwright and Barnicoat (1989).

P-T diagram summarizing the P-T estimates of this study and showing the proposed P-T path, compared to those of previous studies.
Although we have described a sequence of events for our sample S98-14 that is applicable to garnet-bearing Lewisian metabasites, our data do not constrain the absolute timing of metamorphic events. The time of peak Badcallian granulite-facies metamorphism is generally quoted as ~2.7 Ga (e.g., Cartwright and Barnicoat 1989), but the evidence is still equivocal after decades of study, mostly based on zircon geochronology. Whereas some recent studies (e.g., Crowley et al. 2015) provide evidence for two distinct periods of high-temperature metamorphism at ~2.7 and ~2.49 Ga, others such as Taylor et al. (2020) point to an apparent continuum of zircon ages as implying that supra-solidus metamorphism and melt generation lasted for more than 200 Ma. Nevertheless, if conditions at 2.49 Ga reached or remained at granulite facies, it is reasonable that the coronas formed at this time. The hydrous amphibolite-facies retrogression and cooling, commonly referred to as the Inverian, that immediately followed (Cartwright and Barnicoat 1989; and references therein) has not directly affected S98-14, but this interval marks the first opportunity for exsolution phenomena to appear in clinopyroxene and Fe-Ti oxides over the T interval 600–450 °C. However, the Laxfordian event at ~1.76 Ga, most clearly recorded in shear zones, evidently reached similar conditions at Scourie (Beach 1973), and therefore exsolution could be related to post-Laxfordian cooling. We cannot resolve this question, but we note that the orthopyroxene lamellae in clinopyroxene are very narrow, with planar interfaces that show no indication of annealing or later modification.
Implications
When appropriate exchange thermometers are absent, minerals have been partially or wholly overprinted, and temperatures obtained from phase equilibrium modeling are poorly constrained, we show that single proto-Cpx thermometry can provide a viable alternative for determining peak temperature estimates. Clinopyroxene commonly exsolves in a closed system that can be interrogated to determine: (1) peak conditions by phase recombination and (2) exsolution temperatures, if the appropriate analytical precautions are taken. Exsolution is a prevalent feature in granulitic rocks, so the technique presented has wide ranging applications to other terranes (e.g., Bohemian Massif, Grenville Orogen, etc.).
Our study combines several old and new thermobarometric techniques with careful petrography to determine the peak and retrograde mineral assemblages of the mafic granulites of Scourie-more. We obtain a much higher estimate of the Bacallian peak P-T conditions (>11 kbar and >1025 °C) compared to recent studies, which relied on phase equilibrium modeling alone, but one that is consistent with earlier work in the Lewisian (Barnicoat and O’Hara 1979; Sills and Rollinson 1987; Cartwright and Barnicoat 1989; Wheeler et al. 2010). In the process of generating our proto-Cpx temperature we also obtain a range of temperatures (850 °C Grt-Cpx; 590 °C Opx-Cpx; 460 °C Mag-Ilm) that represent estimates of the metamorphic overprints on the Lewisian. We note that a more nuanced approach is necessary in the application of phase equilibrium modeling to retrogressed mafic granulites, highlighting the need for a careful consideration of effective bulk composition.
Using these data, we have re-interpreted the P-T history of the Lewisian, with our study differing from previous work in two main regards: (1) we have an independent estimate of temperature from single proto-Cpx thermometry and (2) we use the petrologic evidence to argue for an orthopyroxene-free peak mineral assemblage in samples with corona textures. Our work sheds new light on rocks from the crucial transition from Archean to modern style subduction, and at the same time developed a new technique (single pyroxene thermometry) that can be widely used to study similarly overprinted high-grade terranes.
Acknowledgments
J. Omma (Rocktype Ltd., Divinity Road, Oxford, OX4 1LN, U.K.) is thanked for access to QEMSCAN analyses. D. Tinkham is owed a debt of gratitude for converting the latest set of a-X relations for use with Theriak/Domino. J.W. acknowledges receipt of a NERC Independent Research Fellowship NE/K009540/1. Chris Yakymchuk and John Wheeler are thanked for their insightful and constructive reviews. Special thanks to Lindsey McHenry for editorial handling and additional feedback.
Manuscript handled by Lindsay J. McHenry
References cited
Abrams, H. (1971) Grain size measurement by the intercept method. Metallography, 4, 59–78. doi:10.1016/0026-0800(71)90005-X.10.1016/0026-0800(71)90005-XSearch in Google Scholar
Anderson, A.T. (1968) Oxidation of the La Blanche Lake titaniferous magnetite deposit, Québec. Journal of Geology, 76(4), 528–547.10.1086/627358Search in Google Scholar
Andersen, D.J., and Lindsley, D.H. (1985) New (and final!) models for the Ti-magnetite/ ilmenite geothermometer and oxygen barometer. Abstract AGU 1985 Spring Meeting Eos Transactions. American Geophysical Union 66 (18), 416.Search in Google Scholar
Andersen, D.J., Lindsley, D.H., and Davidson, P.M. (1993) QUILF: A Pascal program to assess equilibria among FeMgMnTi oxides, pyroxenes, olivine, and quartz. Computers & Geosciences, 19, 1333–1350.10.1016/0098-3004(93)90033-2Search in Google Scholar
Armstrong, J. T. (2012) High resolution quantitative microbeam analysis of Ir-coated geologic specimens using conventionally coated standards. AGU Meeting Abstract, 1–2.Search in Google Scholar
Barnicoat, A.C. (1983) Metamorphism of the Scourian Complex, NW Scotland. Journal of Metamorphic Geology, 1, 163–182.10.1111/j.1525-1314.1983.tb00270.xSearch in Google Scholar
Barnicoat, A.C., and O’Hara, M.J. (1979) High-temperature pyroxenes from an ironstone at Scourie, Sutherland. Mineralogical Magazine, 43, 371–375.10.1180/minmag.1979.043.327.09Search in Google Scholar
Bastin, G.F., van Loo, F.J.J., Vosters, P.J.C., and Vrolijk, J.W.G.A. (1984) An iterative procedure for the correction of secondary fluorescence effects in electron-probe microanalysis near phase boundaries. Spectrochimica Acta Part B: Atomic Spectroscopy, 39, 1517–1522.10.1016/0584-8547(84)80174-3Search in Google Scholar
Beach, A. (1973) The mineralogy of high temperature shear zones at scourie, N.W. Scotland. Journal of Petrology, 14, 231–248.10.1093/petrology/14.2.231Search in Google Scholar
Buse, B., and Kearns, S. (2018) Quantification of olivine using Fe Lα in electron probe microanalysis (EPMA). Microscopy and Microanalysis, 24, 1–7.10.1017/S1431927618000041Search in Google Scholar PubMed
Caddick, M.J., Konopásek, J., and Thompson, A.B. (2010) Preservation of garnet growth zoning and the duration of prograde metamorphism. Journal of Petrology, 51, 2327–2347.10.1093/petrology/egq059Search in Google Scholar
Carmichael, I.S.E. (1966) The iron-titanium oxides of salic volcanic rocks and their associated ferromagnesian silicates. Contributions to Mineralogy and Petrology, 14, 36–64.10.1007/BF00370985Search in Google Scholar
Cartwright, I., and Barnicoat, A.C. (1989) Evolution of the Scourian complex. In J.S. Daly, R.A. Cliff, and B.W.D. Yardley, Eds., Evolution of Metamorphic Belts, 43, 297–301. Geological Society Special Publication.10.1144/GSL.SP.1989.043.01.21Search in Google Scholar
Chacko, T., Lamb, M., and Farquhar, J. (1996) Ultra-high temperature metamorphism in the Kerala Khondalite Belt. The Archaean and Proterozoic Terrains in Southern India within East Gondwane, 3, 157-165.Search in Google Scholar
Connolly, J.A.D. (1990) Multivariable phase diagrams: an algorithm based on generalized thermodynamics. American Journal of Science, 290, 666–718.10.2475/ajs.290.6.666Search in Google Scholar
Connolly, J.A.D., and Petrini, K. (2002) An automated strategy for calculation of phase diagram sections and retrieval of rock properties as a function of physical conditions. Journal of Metamorphic Geology, 20, 697–708.10.1046/j.1525-1314.2002.00398.xSearch in Google Scholar
Crameri, F. (2021) Scientific Colour Maps. doi:10.5281/zenodo.4491293. (Version date: February 2, 2021.)10.5281/zenodo.4491293Search in Google Scholar
Crameri, F., Shephard, G.E., and Heron, P.J. (2020) The misuse of colour in science communication. Nature Communications, 11, 5444.10.1038/s41467-020-19160-7Search in Google Scholar
Crowley, Q.G., Key, R., and Noble, S.R. (2015) High-precision U-Pb dating of complex zircon from the Lewisian Gneiss Complex of Scotland using an incremental CA-ID-TIMS approach. Gondwana Research, 27, 1381–1391.10.1016/j.gr.2014.04.001Search in Google Scholar
de Capitani, C., and Brown, T.H. (1987) The computation of chemical equilibrium in complex systems containing non-ideal solutions. Geochimica et Cosmochimica Acta, 51, 2639–2652.10.1016/0016-7037(87)90145-1Search in Google Scholar
de Capitani, C., and Petrakakis, K. (2010) The computation of equilibrium assemblage diagrams with Theriak/Domino software. American Mineralogist, 95, 1006–1016.10.2138/am.2010.3354Search in Google Scholar
Droop, G.T.R. (1987) A general equation for estimating\ferric\concentrations in ferromagnesian silicates and oxides from microprobe analyses, using stoichiometric criteria. Mineralogical Magazine, 51, 431–435.10.1180/minmag.1987.051.361.10Search in Google Scholar
Feisel, Y., White, R.W., Palin, R.M., and Johnson, T.E. (2018) New constraints on granulite facies metamorphism and melt production in the Lewisian Complex, northwest Scotland. Journal of Metamorphic Geology, 36, 799–721.10.1111/jmg.12311Search in Google Scholar
Fitzsimons, I.C.W., and Harley, S.L. (1994) The influence of retrograde cation exchange on granulite P-T estimates and a convergence technique for the recovery of peak metamorphic conditions. Journal of Petrology, 35, 543–576.10.1093/petrology/35.2.543Search in Google Scholar
Forshaw, J.B., Waters, D.J., Pattison, D.R.M., Palin, R.M., and Gopon, P. (2019) A comparison of observed and thermodynamically predicted phase equilibria and mineral compositions in mafic granulites. Journal of Metamorphic Geology, 37, 153–179.10.1111/jmg.12454Search in Google Scholar
Frost, R.B., and Chacko, T. (1989) The granulite uncertainty principle: limitations on thermobarometry in granulites. The Journal of Geology, 97, 435–450.10.1086/629321Search in Google Scholar
Gopon, P., Fournelle, J., Sobol, P., and Llovet, X. (2013) Low-voltage electron-probe microanalysis of Fe–Si compounds using soft X-rays. Microscopy and Microanalysis, 19, 1698–1708.10.1017/S1431927613012695Search in Google Scholar PubMed
Gopon, P., Fournelle, J., Sobol, P., Spicuzza, M., Pinard, P., Richter, S., Llovet, X., and Valley, J.W. (2014) Soft X-ray EPMA analyses of extremely reduced phases from Apollo 16 regolith: Problems and solutions for sub-micron analysis. Microscopy and Microanalysis, 20, 698–699.10.1017/S1431927614005212Search in Google Scholar
Gopon, P., Sobol, P., and Fournelle, J. (2015) Non-sequential spectral acquisitions and data reconstruction to remove time-dependent effects from X-ray spectra. Applied Spectroscopy, 69, 1403–1411.10.1366/14-07814Search in Google Scholar PubMed
Gopon, P., Spicuzza, M.J., Kelly, T.F., Reinhard, D., Prosa, T.J., and Fournelle, J. (2017) Ultra-reduced phases in Apollo 16 regolith: Combined field emission electron probe microanalysis and atom probe tomography of submicron Fe-Si grains in Apollo 16 sample 61500. Meteoritics & Planetary Science, 52, 1941–1962.10.1111/maps.12899Search in Google Scholar
Green, E.C.R., White, R.W., Diener, J.F.A., Powell, R., Holland, T.J.B., and Palin, R.M. (2016) Activity-composition relations for the calculation of partial melting equilibria in metabasic rocks. Journal of Metamorphic Geology, 34, 845–825.10.1111/jmg.12211Search in Google Scholar
Harley, S.L. (1989) The origins of granulites: A metamorphic perspective. Geological Magazine, 126, 215–247.10.1017/S0016756800022330Search in Google Scholar
Heikinheimo, E., Pinard, P.T., Richter, S., Llovet, X., and Louhenkilpi, S. (2016) Electron probe microanalysis of Ni-silicides at low voltage: difficulties and possibilities. IOP Conference Series: Materials Science and Engineering, 109, 012005.10.1088/1757-899X/109/1/012005Search in Google Scholar
Holland, T.J.B., and Powell, R. (2003) Activity-composition relations for phases in petrological calculations: An asymmetric multicomponent formulation. Contributions to Mineralogy and Petrology, 145, 492–501.10.1007/s00410-003-0464-zSearch in Google Scholar
Holland, T.J.B., and Powell, R. (2011) An improved and extended internally consistent thermodynamic dataset for phases of petrological interest, involving a new equation of state for solids. Journal of Metamorphic Geology, 29, 333–383.10.1111/j.1525-1314.2010.00923.xSearch in Google Scholar
Johnson, T.E., and White, R.W. (2011) Phase equilibrium constraints on conditions of granulite-facies metamorphism at Scourie, NW Scotland. Journal of the Geological Society, 168, 147–158.10.1144/0016-76492010-069Search in Google Scholar
Johnson, T. E., Fischer, S., White, R.W., Brown, M., and Rollinson, H.R. (2012) Archaean intracrustal differentiation from partial melting of metagabbro-field and geochemical evidence from the central region of the Lewisian complex, NW Scotland. Journal of Petrology, 53, 2115–2138.10.1093/petrology/egs046Search in Google Scholar
Lepage, L.D. (2003) ILMAT: An Excel worksheet for ilmenite-magnetite geothermometry and geobarometry. Computers & Geosciences, 29, 673–678.10.1016/S0098-3004(03)00042-6Search in Google Scholar
Lindsley, D.H. (1983) Pyroxene thermometry. American Mineralogist, 68, 477–493. doi:10.1007/BF00372872.10.1007/BF00372872Search in Google Scholar
Lindsley, D.H., and Frost, B.R. (1992) Equilibria among Fe-Ti oxides, pyroxenes, olivine, and quartz: Part I. Theory. American Mineralogist, 77, 987–1003.Search in Google Scholar
Llovet, X., and Salvat, F. (2016) PENEPMA: A Monte Carlo programme for the simulation of X-ray emission in EPMA. IOP Conference Series: Materials Science and Engineering, 109, 012009.10.1088/1757-899X/109/1/012009Search in Google Scholar
Llovet, X., Pinard, P.T., Donovan, J.J., and Salvat, F. (2012) Secondary fluorescence in electron probe microanalysis of material couples. Journal of Physics D: Applied Physics, 45, 225301.10.1088/0022-3727/45/22/225301Search in Google Scholar
Llovet, X., Pinard, P.T., Heikinheimo, E., Louhenkilpi, S., and Richter, S. (2016) Electron probe microanalysis of Ni silicides using Ni-L X-ray lines. Microscopy and Microanalysis, 22, 1233–1211.10.1017/S1431927616011831Search in Google Scholar PubMed
McSwiggen, P. (2014) Characterisation of sub-micrometre features with the FE-EPMA. IOP Conference Series: Materials Science and Engineering, 55, 012009.10.1088/1757-899X/55/1/012009Search in Google Scholar
Morimoto, N., Fabries, J., Ferguson, A.K., Ginzburg, I.V., Ross, M., Seifert, F.A., Zussman, J., Aoki, K., and Gottardi, G. (1988) Nomenclature of pyroxenes. Mineralogical Magazine, 52, 535–550.10.1180/minmag.1988.052.367.15Search in Google Scholar
O’Hara, M. J. (1961) Zoned ultrabasic and basic gneiss masses in the early Lewisian metamorphic complex at Scourie, Sutherland. Journal of Petrology, 2, 248–276.10.1093/petrology/2.2.248Search in Google Scholar
O’Hara, M. J. (1977) Thermal history of excavation of Archaean gneisses from the base of the continental crust. Journal of the Geological Society, 134, 185–200. doi:10.1144/ gsjgs.134.2.0185.10.1144/gsjgs.134.2.0185Search in Google Scholar
O’Hara, M. J., and Yarwood, G. (1978) High pressure-temperature point on an Archaean geotherm, implied magma genesis by crustal anatexis, and consequences for garnetpyroxene thermometry and barometry. Philosophical Transactions for the Royal Society of London. Series A, 288, 441–456.10.1098/rsta.1978.0027Search in Google Scholar
Palin, R.M., Weller, O.M., Waters, D.J., and Dyck, B. (2016a) Quantifying geological uncertainty in metamorphic phase equilibria modelling; A Monte Carlo assessment and implications for tectonic interpretations. Geoscience Frontiers, 7, 591–607.10.1016/j.gsf.2015.08.005Search in Google Scholar
Palin, R.M., White, R.W., Green, E.C.R., Diener, J.F.A., Powell, R., and Holland, T.J.B. (2016b) High-grade metamorphism and partial melting of basic and intermediate rocks. Journal of Metamorphic Geology, 34, 871–822.10.1111/jmg.12212Search in Google Scholar
Park, R.G. (1970) Observations on Lewisian Chronology. Scottish Journal of Geology, 6, 379–399.10.1144/sjg06040379Search in Google Scholar
Pattison, D.R.M., and Bégin, N.J. (1994) Zoning patterns in orthopyroxene and garnet in granulites: implications for geothermometry. Journal of Metamorphic Geology, 12, 387–410.10.1111/j.1525-1314.1994.tb00031.xSearch in Google Scholar
Pattison, D.R.M., Chacko, T., Farquhar, J., and McFarlane, C.R.M. (2003) Temperatures of granulite-facies metamorphism: Constraints from experimental phase equilibria and thermobarometry corrected for retrograde exchange. Journal of Petrology, 44, 867–900.10.1093/petrology/44.5.867Search in Google Scholar
Peach, B.N., Horne, J., Gunn, W., Clough, C.T., Hinxman, L.W., and Teall, J.J.H. (1907) The Geological Structure of the North-West Highlands of Scotland. H.M. Stationery Office, J. Hedderwick & Sons, Ltd.Search in Google Scholar
Pinard, P.T., Demers, H., Salvat, F., and Gauvin, R. (2010) An API/GUI for Monte Carlo simulation of EPMA spectra using PENELOPE. Microscopy and Microanalysis, 16, 280–287.10.1017/S1431927610059222Search in Google Scholar
Powell, R. (1985) Regression diagnostics and robust regression in geothermometer/ geobarometer calibration: the garnet-clinopyroxene geothermometer revisited. Journal of Metamorphic Geology, 3, 231–243.10.1111/j.1525-1314.1985.tb00319.xSearch in Google Scholar
Powell, R., and Holland, T.J.B. (2008) On thermobarometry. Journal of Metamorphic Geology, 26, 155–179.10.1111/j.1525-1314.2007.00756.xSearch in Google Scholar
Powell, R., and Powell, M. (1977) Geothermometry and oxygen barometry using coexisting iron-titanium oxides: a reappraisal. Mineralogical Magazine, 41, 257–263.10.1180/minmag.1977.041.318.14Search in Google Scholar
Powell, R., Holland, T. J.B., and Worley, B.A. (1998) Calculating phase diagrams involving solid solutions via non-linear equations, with examples using THERMOCALC. Journal of Metamorphic Geology, 16, 577–588.10.1111/j.1525-1314.1998.00157.xSearch in Google Scholar
Pride, C., and Muecke, G.K. (1980) Rare earth element geochemistry of the Scourian complex N.W. Contributions to Mineralogy and Petrology, 73, 403–412. doi:10.1007/BF00376632.10.1007/BF00376632Search in Google Scholar
Ravna, E.J.K. (2000) The garnet-clinopyroxene Fe2+-Mg geothermometer: An updated calibration. Journal of Metamorphic Geology, 18, 211–219.10.1046/j.1525-1314.2000.00247.xSearch in Google Scholar
Rollinson, H.R. (1981) Garnet-pyroxene thermometry and barometry in the Scourie granulites, NW Scotland. Lithos, 14, 225–238.10.1016/0024-4937(81)90044-XSearch in Google Scholar
Rollinson, H.R., and Windley, B.F. (1980) Mineralogy and selective elemental depletion during metamorphism in granulites. Contributions to Mineralogy and Petrology, 72, 257–263.10.1007/BF00376144Search in Google Scholar
Santos, C.A., Moraes, R., and Szabó, G.A.J. (2019) A comparison between phase diagram modelling of metamafic rocks and experimental and independent thermobarometric data. Lithos, 340-341, 108–123.10.1016/j.lithos.2019.04.024Search in Google Scholar
Savage, D., and Sills, J.D. (1980) High pressure metamorphism in the Scourian of NW Scotland: Evidence from garnet granulites. Contributions to Mineralogy and Petrology, 74, 153–163.10.1007/BF01132001Search in Google Scholar
Sills, J.D., and Rollinson, H.R. (1987) Metamorphic evolution of the mainland Lewisian complex. In R.G. Park and J. Tarney, Eds., Evolution of the Lewisian and Comparable Precambrian High Grade Terrains, p. 81–92. Geological Society Special Publication.10.1144/GSL.SP.1987.027.01.08Search in Google Scholar
Spencer, K.J., and Lindsley, D.H. (1981) A solution model for coexisting iron titanium oxides. American Mineralogist, 66, 1189–1201.Search in Google Scholar
Starr, P.G., Pattison, D.R.M., and Ames, D.E. (2020) Mineral assemblages and phase equilibria of metabasites from the prehnite – pumpellyite to amphibolite facies, with the Flin Flon Greenstone Belt (Manitoba) as a type example. Journal of Metamorphic Geology, 38, 71–102.10.1111/jmg.12513Search in Google Scholar
Stormer, J.C. Jr. (1983) The effects of recalculation on estimates of temperature and oxygen fugacity from analyses of multi-component iron-titanium oxides. American Mineralogist, 68, 586–594.Search in Google Scholar
Sutton, J., and Watson, J. (1950) The pre-Torridonian metamorphic history of the Loch Torridon and Scourie areas in the North-West Highlands, and its bearing on the chronological classification of the Lewisian. Quarterly Journal of the Geological Society, 106, 241–307.10.1144/GSL.JGS.1950.106.01-04.16Search in Google Scholar
Taylor, R.J.M., Johnson, T.E., Clark, C., and Harrison, R.J. (2020) Persistence of melt-bearing Archean lower crust for >200 m.y. – An example from the Lewisian Complex, northwest Scotland. Geology, 48, 221–225. doi:10.1130/G46834.1/4906652/g46834.pdf.10.1130/G46834.1/4906652/g46834.pdfSearch in Google Scholar
Wheeler, J., Park, R.G., Rollinson, H.R., and Beach, A. (2010) The Lewisian Complex: Insights into deep crustal evolution. Geological Society, London, Special Publications, 335, 51–79.10.1144/SP335.4Search in Google Scholar
White, R.W., Powell, R., Holland, T.J.B., and Worley, B.A. (2000) The effect of TiO2 and Fe2O3 on metapelitic assemblages at greenschist and amphibolite facies conditions: mineral equilibria calculations in the system K2O-FeO-MgO-Al2O3-SiO2-H2O-TiO2- Fe2O3. Journal of Metamorphic Geology, 18, 497–511.10.1046/j.1525-1314.2000.00269.xSearch in Google Scholar
White, R.W., Powell, R., and Clarke, G.L. (2002) The interpretation of reaction textures in Fe-rich metapelitic granulites of the Musgrave Block, Central Australia: Constraints from mineral equilibria calculations in the system. Journal of Metamorphic Geology, 20, 41–55.10.1046/j.0263-4929.2001.00349.xSearch in Google Scholar
White, R.W., Powell, R., and Baldwin, J.A. (2008) Calculated phase equilibria involving chemical potentials to investigate the textural evolution of metamorphic rocks. Journal of Metamorphic Geology, 26, 181–198.10.1111/j.1525-1314.2008.00764.xSearch in Google Scholar
White, R.W., Powell, R., Holland, T.J.B., Johnson, T.E., and Green, E.C.R. (2014) New mineral activity-composition relations for thermodynamic calculations in metapelitic systems. Journal of Metamorphic Geology, 32, 261–286.10.1111/jmg.12071Search in Google Scholar
White, R.W., Palin, R.M., and Green, E.C.R. (2017) High-grade metamorphism and partial melting in Archean composite grey gneiss complexes. Journal of Metamorphic Geology, 35, 181–195.10.1111/jmg.12227Search in Google Scholar
Whitney, D.L., and Evans, B.W. (2010) Abbreviations for names of rock-forming minerals. American Mineralogist, 95, 185–187.10.2138/am.2010.3371Search in Google Scholar
Wood, B.J. (1975) The influence of pressure, temperature and bulk composition on the appearance of garnet in orthogneisses—An example from South Harris. Earth and Planetary Science Letters, 26, 299–311.10.1016/0012-821X(75)90005-9Search in Google Scholar
Wood, B.J. (1977) The activities of components in clinopyroxene and garnet solid solutions and their application to rocks [and discussion]. Philosophical Transactions of the Royal Society A: Mathematical, Physical and Engineering Sciences, 286, 331–342. doi:10.1098/rsta.1977.0121.10.1098/rsta.1977.0121Search in Google Scholar
© 2022 Phillip Gopon, Jacob B. Forshaw, Jon Wade, David J. Waters, and Christine Gopon, published by Mineralogical Society of America
This work is licensed under the Creative Commons Attribution 4.0 International License.
Articles in the same Issue
- Estimating kaolinite crystallinity using near-infrared spectroscopy: Implications for its geology on Earth and Mars
- The interplay between twinning and cation inversion in MgAl2O4-spinel: Implications for a nebular thermochronometer
- The effect of fluorine on reaction-rim growth dynamics in the ternary CaO-MgO-SiO2 system
- Seeing through metamorphic overprints in Archean granulites: Combined high-resolution thermometry and phase equilibrium modeling of the Lewisian Complex, Scotland
- Interphase misorientation as a tool to study metamorphic reactions and crystallization in geological materials
- Trace element partitioning between olivine and melt in lunar basalts
- Solving the iron quantification problem in low-kV EPMA: An essential step toward improved analytical spatial resolution in electron probe microanalysis—Fe-sulfides
- Zircon geochronological and geochemical insights into pluton building and volcanic-hypabyssal-plutonic connections: Oki-Dōzen, Sea of Japan—A complex intraplate alkaline volcano
- Using cathodoluminescence to identify oscillatory zoning of perthitic K‑feldspar from the equigranular Toki granite
- Influence of intensive parameters and assemblies on friction evolution during piston-cylinder experiments
- Formation process of Al-rich calcium amphibole in quartz-bearing eclogites from The Sulu Belt, China
- Helvine-danalite mineralogy of the Dulong Sn-Zn polymetallic deposit in southeast Yunnan, China
- Native gold enrichment process during growth of chalcopyrite-lined conduits within a modern hydrothermal chimney (Manus Basin, PNG)
- Pliniusite, Ca5(VO4)3F, a new apatite-group mineral and the novel natural ternary solid-solution system pliniusite–svabite–fluorapatite
- Heamanite-(Ce), (K0.5Ce0.5)TiO3, a new perovskite supergroup mineral found in diamond from Gahcho Kué, Canada
- A revised analysis of ferrihydrite at liquid helium temperature using Mössbauer spectroscopy
- First find of merrillite, Ca3(PO4)2, in a terrestrial environment as an inclusion in lower-mantle diamond
- New Mineral Names: Hydrous Minerals
- Book Review
- Past to Present. (2020) Edited by Beth N. Orcutt, Isabelle Daniel, and Rajdeep Dasgupta.