
An investigation on Trakya region Oak (Quercus spp.) honeys of Turkey: their physico-chemical, antioxidant and phenolic compounds properties
-
Sevgi Kolayli

 ,
Hilal Ebru Çakir
,
Hilal Ebru Çakir

Abstract
Objective
The purpose of this study was therefore to investigate various physicochemical properties, phenolic composition and antioxidant capacities of the oak honey, large quantities of which are produced in the Thrace region of Northwest Turkey.
Methods
Hunter color values (Lab), optical rotation, electrical conductivity, moisture and ash were measured as physicochemical determinants. Sugar, proline content, mineral, phenolic acids, total phenolic flavonoids contents were evaluated as chemical parameters. Ferric reducing antioxidant power (FRAP) and 2,2-diphenyl-1-picrylhydrazyl (DPPH) free radical scavenging were used as antioxidant determinants.
Results
The results determined that dark-colored honeys (mean 24.95±8.35 L) have proline levels (649.82±203.90 mg/kg), total phenolic content (TPC) (67.29±13.10 mgGAE/100 g) and total flavonoid content (TFC) (10.14±4.78 mgQE/100 g), a high ratio of fructose/glucose (1.65±0.18). Rutin (11.14±8.50 μg/g), p-coumaric acid (6.97±5.80 μg/g) and protocatechuic acid (6.12±4.39 μg/g) were the major phenolic components, and quercetin was also detected in varying amounts in all samples. Potassium (2523±0.28 mg/kg), calcium (63.40±3.20 mg/kg) and magnesium (38.88±0.65 mg/kg) were the major minerals in the honeys.
Conclusion
Our results showed that physicochemical properties, phenolic compounds, antioxidant capacity, sugar and mineral contents successfully distinguish the geographical origins of oak honey. These findings will contribute to a more accurate evaluation of oak honey in the literature.
Özet
Amaç
Bu çalışmanın amacı, Kuzeybatı Trakya bölgesinde bol miktarda üretilen meşe balının çeşitli fiziko-kimyasal özellikleri, fenolik bileşimi ve antioksidan kapasitelerini araştırmaktır.
Metod
Fiziko-kimyasal özellik olarak Hunter renk değeri (Lab), optik rotasyon, elektriksel iletkenlik, nem, kül analizleri belirlendi. Kimyasal parametreler olarak şeker, prolin içeriği, mineral, fenolik asitler, toplam fenolik flavonoid içerik belirlendi. Antioksidan aktivite olarak demir indirgeme/antioksidan kapasitesi (FRAP) ve 2,2 difenil-1- pikrahidrazil (DPPH) belirlendi.
Bulgular
Sonuçlarda, koyu renkli balların L değeri ortalama (24.95±8.35), değeri (649.82±203.90 mg/kg), toplam fenolik içeriği (67.29±13.10 mgGAE/100 g), toplam flavonoid içeriği (10.14±4.78 mgQE/100 g), yüksek fruktoz/glukoz oranı (1.65±0.18) tespit edildi. Rutin (11.14±8.50 μg/g), p-kumarik asit (6.97±5.80 μg/g), protokatekuik asit (6.12±4.39 μg/g) major fenolik bileşen olarak, kuersetin değişik miktarlarda tüm ballarda tespit edildi. Potasyum, (2523±0.28 mg/kg), kalsiyum (63.40±3.20 mg/kg) ve magnezyum (38.88±0.65 mg/kg) ballarda major mineral olarak bulundu.
Sonuç
Sonuçlarımızda, fiziko-kimyasal özellikleri, fenolik kompozisyonları antioksidan kapasitesi, şeker ve mineral içerikleri coğrafi orjinleri farklı olan meşe ballarında başarılı bir şeklide ayırt edildiğini ortaya koymaktadır. Elde edilen bu bulgular, meşe balının literatürde daha doğru bir şekilde değerlendirilmesine katkıda bulunacaktır.
Introduction
Honey is a sweet natural substance produced by honeybees (Apis mellifera). Honey produced from nectars are known as blossom honey, and those produced from liquids secreted from living parts of plants as honeydew honey. The dry weight of honey is composed of 94–97% carbohydrates. The principal monosaccharides are glucose and fructose [1]. The rest of the dry weight is composed of proteins, amino and organic acids, phenolic compounds, enzymes, hormones, lipids, vitamin, essential oils and mineral substances [2]. Many secondary metabolites, such as flavonoids and phenolic acids, are responsible for the biological properties of honey [3]. Therefore, honey is appreciated not only for its taste, but also for its high nutritional and nutraceutical value [3]. In general, honey is classified under two categories depending on the sources involved, honeydew honey and blossom honey. These exhibit different physico-chemical properties [2, 4].
Blossom honey is produced from nectar, and the honey was identified as their positive optical rotation values. Honeydew honeys are produced in two different ways. One is from secretions of insects and the other from the sweat of leaves. Pine honey is one well-known honeydew honey. In order to produce pine honey, bees use the honeydew of the insect species Marchalina hellenica that live on the sap of pine trees. Oak honey can be produced in one of two ways. One involves the secretions of some oak aphids, such as Kernes guercus, Lachnus iliciphilus and Thelaxes dryophila [5]. An alternative method involves sweating by oak leaves under stress conditions, such as sudden temperature changes, or nocturnal and diurnal temperature changes. Sweating of leaves results in the secretion of various sugars, an important food source for bees in honey production. For these reasons, honeydew and nectar honeys differ from one another in terms of chemical composition, physical properties and melissopalynological analysis [6].
Due to its geographical location and ideal climatic conditions, Turkey is one of the world’s most important honey-producing countries. It is the largest producer of pine honey, the best-known honeydew honey, in the world. However, little is known about oak honey. Turkey is an oak-rich country, and oak forests are found in almost all its geographical regions. However, not all oak forests are suitable for oak honey production. The climatic conditions also have to be appropriate. Sugars form in association with stress factors in the leaves of plants in regions with a high difference between day- and night-time temperatures. Bees store the sugars from the leaves when it is moist. Various polyphenolic substances enter the honey from the leaves together with the sugars. For these reasons, oak honey is dark-colored, rich in polyphenolic components and has its own unique aroma. Oak honey production is known to occur in Thrace, northwest Anatolia and the region of the Istranca Mountains, with their rich oak forests. However, insufficient studies have to date investigating the chemical and biologically active properties of the honey of the region. The aim this study was therefore to investigate various physicochemical properties, phenolic composition and antioxidant capacities of the oak honey, large quantities of which are produced in the Thrace region of Northwest Turkey. There is not much information about oak honey in the Thrace region. The oak honey, which is known as secretion honey, is dark in color and has high antioxidant capacity and the high apitherapy value, so its characteristic features have to be illuminated.
Materials and methods
Chemicals
2,4,6-Tripyridyl-s-triazine (TPTZ), Folin–Ciocalteu’s phenol reagent, 2,2-diphenyl-1-picrylhydrazyl (DPPH), Trolox (6-hydroxy-2,5,7,8-tetramethylchroman-2-carboxylic acid), were purchased sigma-aldrich merck (Darmstandt, Germany). All chemical standards were HPLC-grade pure, and the common phenolic and sugar standards were obtained from Sigma-Aldrich (Munich, Germany). HPLC grade organic reagents were supplied by Sigma-Aldrich Co. (St. Louis, MO, USA), and methanol by Merck KGaA, (Darmstandt, Germany).
Honey samples
Twenty oak (Quercus spp.) honey samples were collected from experienced beekeepers in the Thrace region of Turkey in the 2016 harvest season (August). This region lies on Turkey’s European border, and contains the Istranca Mountains and forest. The forest contains many species of oak trees (Quercus spp.), such as Quercus robur, Quercus petraea, Quercus hartwissians, Quercus infectoria, Quercus macranthera, Quercus libani, Quercus auches and Quercus ilex [7]. Despite being honeydew honeys, pollen analyses were performed as a melissopalynological test [8].
Determination of physicochemical properties
Color, moisture, ash, electrical conductivity and optical rotation analysis
Color characteristics were assessed using the CIE L*a*b* method. The apparent (surface) color of samples was measured in terms of L (degree of darkness), a (degree of redness and greenness) and b (degree of yellowness and blueness) using appropriate equipment (Konica, Minolta, CR-5). Ash content was determined using official methods of analysis [9]. Moisture was measured using a portable refractometer (Atago, Germany), electrical conductivities with a conductometer (Hanna Instrument, HI 2030-02, Romania) and optical rotation with a polarimeter (Beta PPP7, England). Proline content was determined using the spectrophotometric method [10]. Maximum absorbance was read at 510 nm, with the aid of a calibration curve obtained from solutions of pure dry proline. The content was expressed as a proportion of the mass of honey as mg/kg.
Honey extraction for antioxidant activity and phenolics analysis
Each honey sample (10 g) was dissolved in 50 mL methanol in a falcon tube. The mixture was stirred continuously with a shaker (Heidolph Promax 2020, Schwabach, Germany) at room temperature for 24 h. The mixture was then filtered with filter paper (Whatman) and concentrated in a rotary evaporator (IKA-Werke, Staufen, Germany) at 40°C. The residue was dissolved in methanol to a known final concentration and kept at 4°C until use for antioxidant and phenolic compound analysis.
Preparation of samples for RP-HPLC-UV analysis
The methanolic extract was evaporated until dryness with a rotary drier at 40°C. The residue was dissolved in 15 mL acidified distilled water (pH 2), after which liquid-liquid extraction was carried out with 5×3 mL diethyl ether (sigma-aldirch Louis, MO Burlington, USA) and 5×3 mL ethyl acetate, consecutively [11]. Both the diethyl ether and ethyl acetate phases were pooled and dried by rotary evaporation (IKA-Werke, Staufen, Germany) at 40°C. The pellet was resuspended in 2 mL methanol, filtered with syringe filters (RC-membrane, 0.45 μm), and injected to HPLC.
Total phenolic content (TPC) and total flavonoid content (TFC)
Total phenolic compound contents were determined by spectrophotometric analysis using the Folin–Ciocalteu method [12]. The maximum absorbance was read at 760 nm, and total phenolic contents (TPC) were expressed as gallic acid equivalents in mg per 100 g of honey (mg GAE/100 g).
Total flavonoid contents (TFC) were measured using a spectrophotometric assay [13]. The maximum absorbance was read at 415 nm, and TFC was expressed as mg quercetin equivalents per 100 g honey (mg QE/100 g).
Determination of ferric reducing antioxidant power (FRAP) and free radical scavenging
Ferric reducing antioxidant power (FRAP) assay was used to determine total antioxidant capacity [14]. FeSO4⋅7H2O was used as a positive control to construct a reference curve (31.25–1000 μM). FRAP values were expressed as μmol FeSO4⋅7H2O equivalent 100 g of sample.
The scavenging of DPPH radicals were used to determine the radical scavenging activity of the methanolic honey samples. This test is based on the disappearance of color in the presence of antioxidants [15]. Radical scavenging activity was measured using Trolox as standard, and the values were expressed as SC50 (mg sample per mL), the concentration of sample resulting in 50% scavenging of DPPH⋅ radicals.
Analysis of phenolic profiles by HPLC-UV detector
HPLC analyses of phenolic profiles were carried out on an Elite LaChrom Hitachi HPLC with a UV-Vis detector. A C18 column (150 mm×4.6 mm, 5 μm; Fortis) was used. Gradient elution was used for HPLC-UV analyses [2]. The mobile phase consisted of (A) 2% acetic acid in water and (B) acetonitrile:water (70:30) (merck Darmstandt, Germany). The 14 standards were recorded at 280 nm, while quercetin was recorded at 315 nm. The programmed solvent used began with a linear gradient held at 95% A for 3 min, decreasing to 80% A at 10 min, 60% A at 20 min, 20% A at 30 min and finally 95% A at 50 min [16].
Determination of sugar content profiles by HPLC-RI detector
Sugar profiles of the honey was determined using a refractive detector (RID) with HPLC (Elite LaChrom, Hitachi, Japan) and a reverse phase-amide column (200/4.6 Nucleosil100-5 NH2) adjusted to a 45°C column temperature. HPLC-RI was performed using the method described by Can et al. [2]. The mobile phase consisted of an acetonitrile and ultrapure water mixture (79:21, v/v) with an injection volume of 15 min. The volume of each injection was 20 μL.
Determination of mineral contents
ICP-MS (Agilent, 7700) was used to determine element contents in the honey samples. Ten minerals (K, C, Mg, C, Al, Na, Fe, Zn, Ni, Cu and Mn) were determined in the specimens. Honeys (1 g) were digested with a Teflonmicro- digestion vessel (CEM, MARSXperss), to which was added 5 mL high purity nitric acid and 1.5 mL 30% H2O2. The samples were digested at 120°C for 45+25 min, held at 190°C 30+10 min, allowed to cool and then made up to 14 mL of distilled water. For calibration standards for measurement with ICP-MS, Merck VI multi element calibration solution was prepared volumetrically by dilution with 1% nitric acid [17].
Statistical analysis
Data were tested on SPSS (version 9.0 for Windows 98, SPSS Inc.) software. Regression and correlation analyses were performed with Kruskal-Wallis and Pearson correlation analysis as a non-parametric test. Significance was set at p<0.05. Pearson’s correlations were calculated for color, TP, TF, FRAP, DPPH and proline levels to determine differences.
Results and discussion
Organoleptic and physicochemical properties
The melissopalynological analysis was performed to determine the specific botanical origins of the honeys. Microscopic analysis of the 20 honey samples revealed much lower pollen contents compared to nectar honeys. The predominate pollens in the samples were Quercus spp., from the family Fagaceae. The predominat pollen ratio was greater than 45%. The other minor pollen families identified were Lauraceae, Tiliceae, Pinaceae, Asteraceae, Rosaceae and Lamiaceae. A lower level of pollen in the oak honey than in nectar honey was an expected finding, as the sample is a honeydew honey and the its production was performed after flowering time. There is a considerable difference between flowering and the collection of the honey. In general, oak trees bloom in March–April, while honey collection starts in July–August. Therefore, oak honey contains low levels of pollens. These consisted of both oak pollens and other flower pollens observed around the forest.
Various physicochemical parameters of the samples are summarized in Table 1. The mean moisture content in the samples was 17.2±1.47%. In general, honey moisture ranges between 16% and 20% in many honey codices [18]. A mean honeydew moisture level of 17.4%, ranging from 15.5% to 19.8%, has been reported in honeys from Spain [4]. In general terms, honey moisture varies depending on climatic and soil conditions, geographical and botanical origins and the season of production.
Some physico-chemical properties and prolin amount of the studied honeys.
| Sample | Moisture (%) | Optic rotation [α]20 | Hunter colors | Conductivity (mS/cm) | Ash (%) | Proline (mg/kg) | ||
|---|---|---|---|---|---|---|---|---|
| L | a | b | ||||||
| H1 | 15.00±0.17a | 0.46±0.00i | 34.09±0.05n | 35.92±0.02n | 57.84±0.10o | 0.92±0.01i | 0.40±0.01cd | 473.69±44.81b |
| H2 | 17.00±0.00c | −0.57±0.00j | 15.12±0.01a | 27.94±0.04a | 25.84±0.02b | 0.90±0.01h | 0.41±0.01c | 762.82±16.80g |
| H3 | 15.00±0.17a | −0.26±0.00f | 21.95±0.01i | 36.39±0.02p | 37.57±0.02k | 0.95±0.01j | 0.60±0.01i | 691.53±16.80f |
| H4 | 16.00±0.50b | −0.24±0.00e | 15.11±0.09a | 33.87±0.03g | 25.73±0.02a | 0.88±0.01g | 0.36±0.01b | 1242.05±11.20k |
| H5 | 17.00±0.00c | −0.09±0.00a | 35.08±0.00o | 33.18±0.01d | 58.77±0.05p | 0.92±0.01i | 0.56±0.01h | 556.86±5.60de |
| H6 | 16.00±0.17b | −0.37±0.00h | 16.42±0.00d | 35.00±0.01k | 28.03±0.01e | 0.87±0.01fg | 0.33±0.01a | 901.44±11.20j |
| H7 | 16.00±0.00b | −0.37±0.00h | 18.90±0.02e | 35.98±0.01o | 32.31±0.02f | 0.88±0.01gh | 0.42±0.01d | 865.79±39.21ij |
| H8 | 17.00±0.00c | −0.59±0.00k | 35.46±0.01p | 33.74±0.02f | 59.61±0.08r | 0.84±0.01cd | 0.41±0.01cd | 572.71±5.60e |
| H9 | 17.00±0.00c | 0.99±0.00l | 26.42±0.03s | 30.52±0.01b | 70.20±0.02u | 0.98±0.01k | 0.66±0.01j | 434.09±0.00a |
| H10 | 19.00±0.17e | −0.26±0.00f | 15.24±0.01b | 34.26±0.02i | 26.01±0.03c | 0.86±0.01ef | 0.36±0.01b | 818.27±39.21h |
| H11 | 19.00±0.50e | −0.17±0.00d | 42.13±0.02r | 32.92±0.01c | 69.70±0.05t | 0.87±0.01fg | 0.48±0.01f | 687.57±11.20f |
| H12 | 17.00±0.00c | 0.12±0.00b | 16.29±0.11c | 34.81±0.03j | 27.81±0.04d | 0.82±0.01ab | 0.32±0.01a | 758.86±33.61g |
| H13 | 16.00±0.00b | −0.26±0.00f | 21.50±0.01h | 37.38±0.09s | 36.83±0.20i | 0.84±0.01cd | 0.49±0.01f | 857.87±16.80i |
| H14 | 16.00±0.00b | 1.16±0.00m | 30.53±0.01l | 36.09±0.02o | 52.00±0.05m | 0.83±0.01bc | 0.36±0.01b | 509.34±16.81bc |
| H15 | 19.00±0.00e | 0.09±0.00a | 20.03±0.01g | 35.66±0.01m | 34.24±0.05h | 0.85±0.01de | 0.44±0.01e | 529.14±0.00cd |
| H16 | 18.00±0.00d | 0.15±0.00c | 19.63±0.00f | 35.44±0.01l | 33.59±0.03g | 0.86±0.01ef | 0.57±0.01h | 552.90±0.01de |
| H17 | 19.00±0.17e | −0.26±0.00f | 35.52±0.01p | 36.94±0.01r | 60.27±0.02s | 0.83±0.01bc | 0.52±0.01g | 489.53±22.40bc |
| H18 | 20.00±0.50f | 0.12±0.00b | 31.26±0.01m | 36.08±0.01o | 53.20±0.05n | 0.81±0.01a | 0.49±0.01f | 497.46±33.61bc |
| H19 | 17.00±0.00c | 0.09±0.00a | 23.21±0.00j | 33.24±0.01e | 39.52±0.01l | 1.03±0.01l | 0.79±0.01k | 497.40±11.20bc |
| H20 | 18.00±0.01d | 0.30±0.01g | 25.22±0.00k | 34.26±0.01h | 37.22±0.01j | 0.81±0.01a | 0.52±0.01g | 499.47±10.20bc |
Different letters in the same column indicate significantly different at the 5% level (p<0.05) among the results.
Another important physical property of honey is electrical conductivity, a parameter widely used to distinguish between nectar and honeydew honeys [19]. Mean electrical conductivity value of the honey samples in this study was 0.88 mS/cm, ranging from 0.81 to 1.03 mS/cm (Table 1). The conductivity of honey derives from various ions, proteins, organic acids, amino acids, phenolic and mineral contents [19]. Generally, honeydew honeys should possess an electrical conductivity value higher than 0.80 mS/cm. Many honey studies have shown that dark-colored honeys have higher electrical conductivity than light honeys [19]. Electrical conductivity in Spanish honeydew honeys has been reported to range between 0.80 and 1.20 mS/cm, similarly to our results [4]. The elevated conductivity in honeydew honey is associated with its high phenolic and mineral contents, as well as ash levels. Total ash in the samples ranged from 0.36% to 0.72%, higher than in many blossom honeys [20] (Table 1). The ash content of honey depends on the mineral content, and this is in turn affected by various environmental pollution and soil properties [21]. The optical rotation values of the samples are given in Table 1. Some of the honey has positive optic rotation, and others negative, in nearly equal proportions. Although honeydew honey exhibits dextrorotatory properties with positive optic rotation, the honeys showed different rotation. Each of the honey samples must be examined separately in order to explain this variation. Undergrowth plant cover may also affect honeydew qualities. On the other hand, the optic rotation values were between −0.57 and 1.16, and half of the honey samples exhibited positive optic rotation. Negative rotation values not greater than −0.57 that can be considered close positive values. As a result, the honey samples optic rotations were found between −0.57 and 1.12. In one previous study, oak honey exhibited positive rotation, with a mean value of 0.74±0.25 [19]. There is considerable previous research into honeydew in the literature, and optic rotation is reported to be an important distinguishing factor for honeydew honeys in some studies [22]. However, other studies have shown that the classification is not always possible, as mono and oligosaccharide compositions of honeydew can affect environmental flora [23]. However, optic rotation of −7.8 and 7.5 has been reported in Macedonian honeydew honeys [23]. For this reason, specific rotation is not the only characteristic factor in oak honeys, and further evidence is required.
Color values of the honeys are given in Table 1. There are two methods for determining honey colors, the pfund scale and Hunter L*a*b* assays [24]. The tritium color values of honeys are expressed as L*⁄ for darkness/lightness (0 black, 100 white), a*⁄ (−a greenness, +a redness), and b*⁄ (−b blueness, +b yellowness) [25]. Comparing our results with values in the previous literature, the samples exhibited lower L values, defined as dark-color honeys [19, 26]. Light-colored honeys are reported to have L values lower than 50, and our L values were also below 50 [26]. Dark-colored honeys are reported to have a stronger taste, while light-colored honeys have a delicate flavor [18]. Honey color depends on the flora involved and on associated vitamin, pigment, phenolic substance and mineral contents. Chlorophyll, carotene and xanthophylls type compounds bestow a yellow-green color [27].
Maillard products emerging with exposure to heat treatment also cause honey to darken. Since the honey colors were measured immediately and without exposure to heat treatment, Maillard reaction products are not thought to affect the color [28]. Our measurements of Hunter a* values (redness) for the samples ranged from 27.94 to 36.94, and b* values (yellowness) ranged from 25.73 to 70.20. Our results show that the honey samples had low L* values, but high a* and b* values. Darkness, redness and yellowness therefore predominated in the honey samples. Color analysis is an important parameter of honey, due to its visual appearance, and is mostly dependent on the nectar source and pollen content. Honey color is also related to the presence of pigments, mainly chlorophylls, carotenoids, flavonoids and polyphenols [29].
Proline contents of the honeys were between 434.09 and 1242.05 mg/kg, and the mean proline value was 649.83±203 mg/kg. The level of proline in honey is associated with many factors, but the source of flora and bees’ work performance has a particular influence [30]. Proline is an amino acid that is added by the honey bee during nectar conversion and indicates the degree of honey. It could be thought that the amount of proline in the honey and enzymes such as sucrose and glucose oxidase, produced by honey bees, shows the possibility of honey. In this study, we used a spectrometric method, an assay which shows total free amino acid contents. Interestingly, however, proline was present in the highest quantities, and other amino acids were very low at negligible amounts. Although a minimum proline level of 150 mg/kg is cited in European codices, in Turkish codices this is above 300 mg/kg [31]. Most honey studies have reported proline contents greater than 400 mg/kg in the literature [19, 30]. In general, lower proline values are observed in adulterated honeys, such as those produced by bee colonies fed with sugar syrups [32]. All proline contents were above the levels given in both honey codices. Our study determined quite proline values in oak honeys. The amount of amino acids in honey is approximately 1% (w/w).
Total phenolic and total flavonoid contents
Contents of total phenolics and total flavonoids and 15 individual phenolic components of the samples were analyzed in order to reveal the secondary metabolites deriving from plants. Total phenolic and flavonoid contents in the current study ranged from 40.60 to 98.56 GAE/100 g and from 3.00 to 21.00 mg QE/100 g, respectively (Table 2). Similar results were reported for South European honeydew honey [33, 34]. The secondary metabolites found in honey are related to floral properties and environmental conditions. In general, it is not possible to determine each of the phenolic components; total contents give information about the product [3, 19]. These secondary agents provide biological active features of honeys as well as natural products, such as antioxidant, antimicrobial and anti-inflammatory and immuno-modulatory characteristics [34]. Oak honey TPC has been variously reported at 120±18 mgGAE/100 g [19] and 132±30 mgGAE/100 g [4]. Oak honeys are also reported to have higher TPC than many nectar honeys, such as acacia, clover and many heterofloral honeys [17]. As a honeydew honey, oak honey has higher TPC than pine honey samples [2, 17]. Flavonoids are important subgroups of polyphenolic family and are ubiquitously distributed in the plant kingdom. These secondary metabolites are widely represented in bee products, such as honey, pollen and propolis [35]. TFC of the samples ranged from 3.00 to 15.44 mgQE/100 g, with a mean value of 10.14±4.78 mgQE/100 g. They also represented 4–15% of the TPC of the honeys. Similar to our findings, total flavonoid levels of 6.6–13.1 mgQE/100 g has been determined in Spanish honeydew honeys [4]. Oak honey has higher flavonoid contents than pine and some blossom honeys [2, 17].
Antioxidant properties of the oak honeys.
| Sample | Total phenolic (mg GAE/100 g) | Total flavonoid (mg QE/100 g) | FRAP (μmol FeSO4⋅7H2O/100 g) | DPPH SC50 (mg/mL) |
|---|---|---|---|---|
| H1 | 64.06±0.60e | 4.70±0.40b | 509±4d | 15.42±0.09f |
| H2 | 77.40±0.60j | 12.91±0.10h | 606±19fg | 17.20±0.43g |
| H3 | 75.44±0.22i | 13.22±1.61h | 809±1l | 13.95±0.43e |
| H4 | 68.21±0.70g | 18.10±0.11k | 625±1h | 8.49±0.21b |
| H5 | 49.57±0.80b | 4.52±0.10ab | 439±5c | 27.89±0.66l |
| H6 | 73.60±0.40h | 13.00±0.50h | 897±2m | 12.35±0.13d |
| H7 | 66.13±0.10f | 3.00±0.40a | 710±24j | 16.78±0.41g |
| H8 | 64.29±0.10ef | 7.61±0.11c | 625±2h | 19.47±0.32i |
| H9 | 40.60±0.09a | 4.21±0.30ab | 385±4a | 20.53±1.16j |
| H10 | 66.01±0.01f | 8.63±0.11cd | 770±7k | 8.09±0.17ab |
| H11 | 56.58±0.01c | 3.92±0.30ab | 410±1b | 18.77±0.58h |
| H12 | 98.56±3.33m | 11.30±0.70fg | 1015±3o | 8.32±0.06ab |
| H13 | 82.80±2.30l | 10.12±0.60def | 819±12l | 9.22±0.22c |
| H14 | 58.77±0.80d | 10.62±0.30efg | 546±6e | 15.75±0.21f |
| H15 | 80.27±0.42k | 11.84±0.60gh | 901±18m | 8.56±0.12bc |
| H16 | 82.00±1.30l | 21.00±0.80l | 973±22n | 7.67±0.09a |
| H17 | 58.88±0.70d | 9.33±1.80de | 609±3gh | 14.33±0.01e |
| H18 | 59.00±0.12d | 15.44±2.31i | 658±6i | 16.51±0.23g |
| H19 | 64.75±0.60ef | 10.10±1.30def | 658±7i | 15.52±0.41f |
| H20 | 59.06±0.60d | 9.23±0.09de | 589±8f | 16.75±0.09g |
Different letters in the same column indicate significantly different at the 5% level (p<0.05) among the results.
Antioxidant activity of oak honeys
Many different methods are appropriate for assessing the antioxidant activity of a substance and in most cases it is necessary to use several tests to obtain good reliability [13, 27]. There is no official method for honey antioxidant activity determination. Various tests are in use, each based on different principles and experimental conditions; the FRAP assay, the DPPH method, oxygen radical absorbance capacity (ORAC), superoxide radical-scavenging activity, Trolox equivalent antioxidant activity (TEAC). Antioxidant capacity is an important indicator of honey that influenced many environmental conditions such as floral source, geographical origin and storage conditions [1]. The total antioxidant capacity of honey is determined using the FRAP test. In this assay, higher FRAP values indicate a higher antioxidant capacity. The results are given in Table 2. The values ranged from 410 to 1050 μmol FeSO4⋅7H2O/100 g, with a mean value of 677±18.20 μmol FeSO4⋅7H2O/100 g. Total antioxidant capacity (FRAP values) was found to be related to the TPC of these honeys (R2: 0.875, p<0.05) in Table 3. One study reported that higher FRAP values for oak and chestnut honey FRAP than some blossom honeys, in addition to TPC [2]. In this previous study, oak and chestnut honeys were identified as dark-colored and had higher antioxidant capacities.
Pearson’s correlation coefficient for color, total phenolic, total flavonoids, FRAP, DPPH and proline in honey samples in Thrace region of Turkey.
| Color (L) | Color (a) | Color (b) | TPC | TFC | FRAP | DPPH | Proline (mg/kg) | ||
|---|---|---|---|---|---|---|---|---|---|
| Color (L) | Pearson correlation | 1 | −0.144 | 0.996(a) | −0.764(a) | −0.559(a) | −0.751(a) | 0.673(a) | −0.618(a) |
| Sig. (two-tailed) | 0.271 | 0.000 | 0.000 | 0.000 | 0.000 | 0.000 | 0.000 | ||
| n | 60 | 60 | 60 | 60 | 60 | 60 | 60 | 60 | |
| Color (a) | Pearson correlation | −0.144 | 1 | −0.108 | 0.243 | 0.140 | 0.422(a) | −0.404(a) | −0.014 |
| Sig. (two-tailed) | 0.271 | 0.410 | 0.062 | 0.286 | 0.001 | 0.001 | 0.917 | ||
| n | 60 | 60 | 60 | 60 | 60 | 60 | 60 | 60 | |
| Color (b) | Pearson correlation | 0.996(a) | −0.108 | 1 | −0.745(a) | −0.551(a) | −0.739(a) | 0.667(a) | −0.616(a) |
| Sig. (two-tailed) | 0.000 | 0.410 | 0.000 | 0.000 | 0.000 | 0.000 | 0.000 | ||
| n | 60 | 60 | 60 | 60 | 60 | 60 | 60 | 60 | |
| TPC | Pearson correlation | −0.764(a) | 0.243 | −0.745(a) | 1 | 0.515(a) | 0.875(a) | −0.732(a) | 0.394(a) |
| Sig. (two-tailed) | 0.000 | 0.062 | 0.000 | 0.000 | 0.000 | 0.000 | 0.002 | ||
| n | 60 | 60 | 60 | 60 | 60 | 60 | 60 | 60 | |
| TFC | Pearson correlation | −0.559(a) | 0.140 | −0.551(a) | 0.515(a) | 1 | 0.584(a) | −0.605(a) | 0.276(b) |
| Sig. (two-tailed) | 0.000 | 0.286 | 0.000 | 0.000 | 0.000 | 0.000 | 0.033 | ||
| n | 60 | 60 | 60 | 60 | 60 | 60 | 60 | 60 | |
| FRAP | Pearson correlation | −0.751(a) | 0.422(a) | −0.739(a) | 0.875(a) | 0.584(a) | 1 | −0.777(a) | 0.302(b) |
| Sig. (two-tailed) | 0.000 | 0.001 | 0.000 | 0.000 | 0.000 | 0.000 | 0.019 | ||
| n | 60 | 60 | 60 | 60 | 60 | 60 | 60 | 60 | |
| DPPH | Pearson correlation | 0.673(a) | −0.404(a) | 0.667(a) | −0.732(a) | −0.605(a) | −0.777(a) | 1 | −0.427(a) |
| Sig. (two-tailed) | 0.000 | 0.001 | 0.000 | 0.000 | 0.000 | 0.000 | 0.001 | ||
| n | 60 | 60 | 60 | 60 | 60 | 60 | 60 | 60 | |
| Proline (mg/kg) | Pearson correlation | −0.618(a) | −0.014 | −0.616(a) | 0.394(a) | 0.276(b) | 0.302(b) | −0.427(a) | 1 |
| Sig. (two-tailed) | 0.000 | 0.917 | 0.000 | 0.002 | 0.033 | 0.019 | 0.001 | ||
| n | 60 | 60 | 60 | 60 | 60 | 60 | 60 | 60 |
aCorrelation is significant at the 0.01 level (two-tailed). bCorrelation is significant at the 0.05 level (two-tailed).
In addition to FRAP values, DPPH radical scavenging activity is also an indicator test of free radical scavenging capacity. The radical does not form in living organisms, but is used to model free radical reactions. The result is given as IC50 (mg/mL) value, representing scavenging of 50% of DPPH radical in a honey solution. Lower IC50 values indicate greater radical scavenging capacity. However, we observed a significant correlation between TPC and DPPH (R2: −0.732, p<0.05). The relation between the two methods for determination of antioxidant activity, FRAP and DPPH, was also significant, with a correlation coefficient equal to (R2: −0.777, p>0.05) in our honey samples (Table 3). The previous study was there was also a significant correlation between the FRAP values and color values (Hunter L) of the honey samples (R2: −0.75, p<0.05). These significant correlations indicated that a honey’s phenolic content determines its antioxidant potential, and that dark honeys have a higher antioxidant potential [35]. Previous honey studies in the literature have reported that dark honeys have a higher antioxidant capacity, deriving from their phenolic compositions.
Phenolic compounds of oak honeys
As it is impossible to detect all the phenolic compounds present in the honey, the basic phenolic compounds are determined by RP-UV-HPLC. Fifteen phenolic compounds were analyzed in the samples in two different wavelengths (280 and 315) (Figure 1). The results are given in Table 4. Ten phenolic compounds were detected in various concentrations, but five phenolics were not detected in the samples. Interestingly, catechin, vanillic acid, syringic acid, daidzein and luteolin were not detected in any specimens. Protocatechuic acid, rutin and caffeic acid were the major phenolic compounds in all samples, p-coumaric, ferulic, gallic and t-cinnamic acids and quercetin was detected in low concentrations, and epicatechin was detected only in tree samples. In agreement with our findings, p-coumaric, ferulic and protocatechuic acids and rutin have been reported as major phenolic compounds in oak honeys [2]. It was reported that quercetin, p-coumaric acid, ferulic acid and cinnamic acid were present in leaves, which confirmed our results [36]. The presence of the three phenolics rutin, ferulic and p-coumaric acid in oak honey and the absence of the five phenolics described above may be used as a marker in distinguishing oak honeys from other honeydew honeys. However, the number of studies of oak honey is very limited. Quercitol or quercetin has been reported as an important marker in oak honeys [6]. In this study, too, quercetin was detected in varying concentrations in all samples. A previous study detected quercetin at 0.382 μg/g in oak honeys [37]. Rutin or rutoside (quercetin-3-O-rutinoside) is a glycoside combined with quercetin. Rutin is a derivative product of quercetin, found particularly in old oak trees. Quercitol has used an important marker for distinguishing oak honey from other honeydew honeys, such as fir and spruce [6].
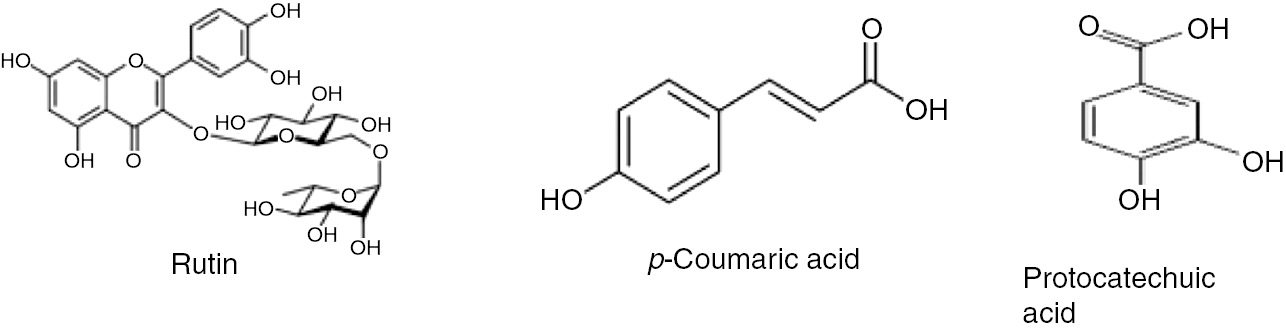
Rutin, p-coumaric acid, protocatechuic acid.
Phenolic profiles of the oak honeys.
| μg (phenolic compound)/g sample | |||||||||||||||
|---|---|---|---|---|---|---|---|---|---|---|---|---|---|---|---|
| Gallic acid | Protocatequic acid | p-OH Benzoic acid | Catechin | Vanillic acid | Caffeic acid | Syringic acid | Epicatechin | p-Coumaric acid | Ferulic acid | Rutin | Daidzein | t-Cinnamic acid | Luteolin | Quercetin | |
| H1 | 0.85±0.01b | 3.07±0.47cd | n.d.a | n.d.a | n.d.a | 3.16±0.01cd | n.d.a | n.d.a | 1.54±0.01bc | 2.33±0.11h | 4.80±1.77ab | n.d.a | 0.31±0.01d | n.d.a | 0.02±0.00ab |
| H2 | n.d.a | n.d.a | 0.45±0.05c | n.d.a | n.d.a | n.d.a | n.d.a | n.d.a | 1.74±0.01e | 1.76±0.02e | 7.41±0.08bc | n.d.a | 0.20±0.02c | n.d.a | 0.12±0.02bc |
| H3 | 5.23±0.05f | 4.74±0.25ef | 0.12±0.08b | n.d.a | n.d.a | 3.96±0.48g | n.d.a | n.d.a | 1.62±0.01cde | 2.03±0.02g | 14.41±0.48d | n.d.a | 0.96±0.03g | n.d.a | 0.16±0.04d |
| H4 | 6.11±0.26g | 4.77±1.15ef | 0.73±0.02f | n.d.a | n.d.a | 2.54±0.05b | n.d.a | n.d.a | 1.52±0.01bc | 1.57±0.32e | 24.71±0.55ef | n.d.a | n.d.a | n.d.a | 0.29±0.02ef |
| H5 | 0.44±0.01ab | 5.46±0.09f | n.d.a | n.d.a | n.d.a | 2.80±0.04bc | n.d.a | n.d.a | 3.40±0.02g | 0.71±0.03a | 2.73±0.03ab | n.d.a | 1.08±0.06h | n.d.a | 0.03±0.00ab |
| H6 | 0.66±0.04ab | 3.22±0.57cd | 1.00±0.07h | n.d.a | n.d.a | 2.54±0.13b | n.d.a | 0.12±0.01b | 1.59±0.07bcd | 1.20±0.08d | 3.51±0.10ab | n.d.a | n.d.a | n.d.a | 0.04±0.00ab |
| H7 | 0.57±0.01ab | 2.68±0.03c | n.d.a | n.d.a | n.d.a | 2.80±0.04bc | n.d.a | n.d.a | 1.27±0.01a | 1.01±0.01c | 3.04±0.01ab | n.d.a | 0.12±0.01b | n.d.a | 0.03±0.00ab |
| H8 | n.d.a | 3.28±0.01cd | 0.17±0.03b | n.d.a | n.d.a | 4.06±0.16g | n.d.a | n.d.a | 2.86±0.02f | 9.33±0.01j | 1.13±0.06a | n.d.a | 0.17±0.03bc | n.d.a | 0.02±0.00a |
| H9 | 0.42±0.02ab | 1.77±0.06b | 0.02±0.01a | n.d.a | n.d.a | 3.44±0.22def | n.d.a | n.d.a | 1.47±0.06b | 0.85±0.01abc | 2.59±0.07ab | n.d.a | 1.20±0.04i | n.d.a | 0.03±0.00ab |
| H10 | n.d.a | 4.64±0.02de | 0.70±0.01f | n.d.a | n.d.a | 3.60±0.02ef | n.d.a | n.d.a | 1.53±0.01bc | 1.56±0.02e | 25.13±0.58ef | n.d.a | 0.26±0.01a | n.d.a | 0.31±0.04ef |
| H11 | n.d.a | 3.89±0.31d | 0.17±0.01b | n.d.a | n.d.a | 2.45±0.01b | n.d.a | 6.66±0.07d | 26.55±0.10n | 0.93±0.01bc | 12.84±0.03d | n.d.a | 2.42±0.04k | n.d.a | 0.13±0.01d |
| H12 | 3.35±0.01d | 5.01±0.19ef | 0.54±0.02d | n.d.a | n.d.a | 4.44±0.10h | n.d.a | 1.24±0.02c | 1.63±0.02cde | 2.10±0.03g | 26.37±0.54f | n.d.a | 0.27±0.01d | n.d.a | 0.32±0.03f |
| H13 | 3.95±0.03de | 10.05±0.15h | 1.28±0.03i | n.d.a | n.d.a | 6.31±0.05j | n.d.a | n.d.a | 1.68±0.03de | 3.17±0.01i | 22.40±0.20d | n.d.a | 1.71±0.04j | n.d.a | 0.25±0.01d |
| H14 | 0.07±0.01a | 19.64±1.78i | n.d.a | n.d.a | n.d.a | 2.66±0.12b | n.d.a | n.d.a | 1.24±0.01a | 0.81±0.01ab | 4.48±0.07ab | n.d.a | 0.30±0.01d | n.d.a | 0.03±0.01ab |
| H15 | 4.18±0.20e | 11.88±0.14h | 1.03±0.11h | n.d.a | n.d.a | 4.95±0.03i | n.d.a | n.d.a | 8.32±0.05i | 2.41±0.10h | 14.12±0.30d | n.d.a | 0.76±0.01e | n.d.a | 0.15±0.01d |
| H16 | 7.11±1.72h | 9.45±0.33h | 0.82±0.06g | n.d.a | n.d.a | 4.47±0.13h | n.d.a | n.d.a | 8.63±0.06j | 2.29±0.18h | 20.92±1.21e | n.d.a | 0.77±0.04e | n.d.a | 0.22±0.01e |
| H17 | 3.65±0.03de | 2.81±0.52c | n.d.a | n.d.a | n.d.a | 3.88±0.58ef | n.d.a | n.d.a | 26.29±0.04m | 1.01±0.01c | 6.77±0.22bc | n.d.a | 4.61±0.06m | n.d.a | 0.09±0.01bc |
| H18 | 1.11±0.06bc | 9.04±0.40g | 0.63±0.03e | n.d.a | n.d.a | 2.45±0.02b | n.d.a | n.d.a | 5.77±0.07h | 1.77±0.06 | 10.90±0.84cd | n.d.a | 0.18±0.01bc | n.d.a | 0.10±0.01cd |
| H19 | 1.75±0.03c | 8.05±0.29f | 0.31±0.06a | n.d.a | n.d.a | 3.77±0.08efg | n.d.a | n.d.a | 14.92±0.24k | 0.88±0.07bc | 7.74±0.13bc | n.d.a | 0.88±0.05f | n.d.a | 0.08±0.01bc |
| H20 | 3.96±0.02de | 2.74±0.07c | n.d.a | n.d.a | n.d.a | 3.60±0.38efg | n.d.a | n.d.a | 25.87±0.06l | 1.00±0.01c | 6.82±0.13bc | n.d.a | 4.00±0.08l | n.d.a | 0.07±0.01bc |
Different letters in the same column indicate significantly different at the 5% level (p<0.05) among the results. n.d., not detected.
Sugar content of the honeys
Analysis of the honey sugar profiles performed using HPLC-RID is shown in Table 5. Total sugar contents in honeys in the current study ranged from 58% to 68%. The basic monosaccharides in honey are the reducing sugars fructose and glucose. Our study results confirmed that fructose and glucose are the main sugars present in honey. The sugar values were suitable honey codices. Melibiose is found in all honey samples, ranging from 0.25% to 2.17%. In general, honeydew honeys contain more oligosaccharides than nectar honeys [18]. Melibiose is a disaccharide (galactose and glucose) that is not metabolized by humans, but is metabolized only by enteric and lactic acid bacteria. It is therefore regarded as a probiotic sugar [38]. Although maltose was not detected in the 20 honey samples, melezitose and trehalose were detected at varying levels in some of them. Melezitose, a trisaccharide sugar, was detected at various levels in 10 honey samples. Similarly to melezitose, trehalose was detected in 11 honey samples at levels between 0.25% and 2.30%. The fructose/glucose ratio is an important factor in the characterization of honeys, and affects crystallization. The fructose/glucose ratio in this study ranged from 1.44 to 2.11. When the ratio exceeds 1.50, the honey crystallizes very late. Some studies have reported that honeydew honeys have a higher fructose/glucose ratio than some blossom honeys, such as acacia and clover [27, 39]. In addition, dark honeys, such as chestnut and heather honeys are reported to have higher fructose/glucose ratios.
Sugar profiles of the oak honeys.
| Sample | Fructose (%) | Glucose (%) | Sucrose (%) | Maltose (%) | Trehalose (%) | Melebiose (%) | Melezitose (%) | F/G |
|---|---|---|---|---|---|---|---|---|
| H1 | 41.85±1.04gh | 23.34±0.29c | 0.19±0.01b | 1.82±0.07b | n.d.a | 1.68±0.07fg | n.d.a | 1.79 |
| H2 | 39.43±0.99bcdef | 21.05±0.09b | 0.63±0.05g | n.d.a | 0.44±0.01g | 2.17±0.03h | n.d.a | 1.87 |
| H3 | 38.73±0.97abcde | 25.34±0.01de | 0.32±0.02c | n.d.a | n.d.a | 1.54±0.02f | 0.42±0.09c | 1.52 |
| H4 | 40.68±0.23efg | 27.54±0.02h | 0.33±0.01c | n.d.a | n.d.a | 1.80±0.01gh | 0.37±0.01c | 1.48 |
| H5 | 41.39±2.63gh | 27.81±0.07h | 0.20±0.03b | n.d.a | 0.37±0.03f | 1.60±0.02f | n.d.a | 1.49 |
| H6 | 41.34±0.93fgh | 27.07±0.16gh | 0.47±0.02f | n.d.a | n.d.a | 2.08±0.01h | n.d.a | 1.53 |
| H7 | 39.50±0.60cdef | 25.72±1.11def | 0.41±0.03d | n.d. a | 0.33±0.01e | 1.61±0.02f | n.d.a | 1.54 |
| H8 | 41.03±0.50fg | 26.07±1.10efg | 0.46±0.01ef | n.d. a | 0.24±0.01b | 1.63±0.01f | n.d.a | 1.57 |
| H9 | 40.55±0.41efg | 25.26±0.02de | 0.21±0.02b | n.d. a | n.d.a | 1.59±0.01f | n.d.a | 1.63 |
| H10 | 40.08±1.26defg | 24.64±0.05d | 0.40±0.03d | n.d. a | 0.25±0.02bc | 1.60±0.04f | n.d.a | 1.63 |
| H11 | 43.18±0.78h | 25.53±0.03def | 0.21±0.01b | n.d. a | 2.13±0.01h | 0.83±0.01c | n.d.a | 1.69 |
| H12 | 41.27±0.46fgh | 24.65±0.26d | 0.32±0.01c | n.d. a | n.d.a | 0.43±0.01b | 2.15±0.01c | 1.67 |
| H13 | 40.57±0.44efg | 23.43±0.29c | 0.68±0.03h | n.d. a | 0.25±0.01bc | 1.69±0.11fg | n.d.a | 1.73 |
| H14 | 38.06±0.12abc | 26.72±0.07fgh | 0.30±0.03c | n.d. a | 0.29±0.02d | 1.93±0.05h | n.d.a | 1.42 |
| H15 | 40.48±0.10efg | 21.04±0.12b | 0.43±0.07def | n.d.a | 0.34±0.01e | 1.32±0.29e | 0.37±0.04b | 1.92 |
| H16 | 39.95±0.47defg | 18.89±0.37a | 0.42±0.01de | n.d.a | 0.27±0.01c | 0.92±0.13cd | 0.38±0.01b | 2.11 |
| H17 | 37.53±0.23abc | 25.98±0.07efg | 0.33±0.02c | n.d.a | 0.27±0.01c | 0.99±0.03d | 0.36±0.01b | 1.44 |
| H18 | 37.10±0.91a | 21.15±2.14b | 0.39±0.01d | n.d.a | n.d.a | n.d.a | n.d.a | 1.75 |
| H19 | 38.00±1.80abc | 26.78±0.43fgh | 2.60±0.03i | n.d.a | n.d.a | 0.94±0.03cd | n.d.a | 1.42 |
| H20 | 38.27±1.80abcd | 20.33±1.21b | n.d. a | 2.63±0.01c | n.d.a | n.d.a | 2.06±0.45c | 1.88 |
Different letters in the same column indicate significantly different at the 5% level (p<0.05) among the results. n.d., not detected.
Mineral content of oak honeys
Ten different macro and microelements were analyzed in the honey samples in this study. The results are given in Table 6. Potassium, calcium and magnesium were the macro minerals identified; and aluminum, sodium and iron the micro minerals. Many previous honey studies have reported that potassium is the main mineral, its values being highly variable [20, 40, 41]. The highest level of potassium was determined in chestnut honey (5007 μg/mg) and the lowest in blossom honey (564 μg/mg) in our previous study [41]. Similarly to these findings, potassium, calcium, magnesium and iron have also been reported as the major mineral contents of oak honeys [17]. Potassium levels of 306–480 μg/mg have been determined in Arabian honey [41]. Comparing our study results with those for Saudi Arabian honeys, although oak honey had higher potassium levels, its calcium and magnesium levels were lower [41]. These mineral measurements show that the mineral content of honey depends on botanical origin and geographical structures [20].
Mineral content of analyzed honeys (mg/kg).
| Sample | Macro minerals μg/mg | Microminerals | ||||||||
|---|---|---|---|---|---|---|---|---|---|---|
| K | Ca | Mg | Al | Na | Fe | Zn | Ni | Cu | Mn | |
| H1 | 2802.25±30.12g | 65.68±1.19a | 38.22±0.33bcd | 9.43±0.21bcd | 3.36±0.15bc | 1.19±0.11bc | 0.11±0.00a | 0.51±0.06e | 0.23±0.00a | 0.20±0.00cdef |
| H2 | 2467.56±26.23c | 63.17±1.12bc | 38.81±0.28de | 9.24±0.20abc | 3.46±0.16bcd | 1.39±0.12cde | 0.11±0.00a | 0.21±0.00ab | 0.18±0.00a | 0.23±0.00efg |
| H3 | 2558.82±32.51d | 61.52±0.88a | 37.90±0.35ab | 9.20±0.16abc | 2.81±0.16a | 1.95±0.10j | 1.09±0.10b | 0.52±0.07e | 0.24±0.01a | 0.05±0.00a |
| H4 | 2103.30±24.45a | 51.13±0.98a | 37.50±0.45a | 9.20±0.15abc | 3.70±0.14d | 0.61±0.07a | 2.01±0.18f | 0.22±0.00ab | 2.19±0.23b | 0.38±0.08jk |
| H5 | 2540.25±20.76d | 64.16±0.78bc | 37.74±0.42ab | 9.19±0.20abc | 3.51±0.17cd | 1.68±0.10fghi | 0.09±0.00a | 0.45±0.06e | 0.21±0.00a | 0.15±0.00bc |
| H6 | 2942.72±28.91i | 64.67±0.75bc | 38.63±0.41cdef | 9.08±0.26ab | 3.41±0.17bd | 1.70±0.10fghi | 1.23±0.10bc | 0.36±0.04d | 2.10±0.22b | 0.28±0.03gh |
| H7 | 2087.19±21.02a | 64.09±0.46bc | 39.23±0.22ef | 9.21±0.32abc | 3.55±0.15cd | 1.05±0.09b | 2.11±0.13g | 0.61±0.06f | 2.11±0.20b | 0.37±0.05jk |
| H8 | 2696.83±33.69ef | 64.39±0.66bc | 39.49±0.40f | 9.14±0.25ab | 5.15±0.14f | 1.76±0.15ghij | 1.07±0.11b | 0.20±0.00ab | 2.10±0.18b | 0.18±0.01cde |
| H9 | 2884.60±36.47h | 64.32±0.66bc | 39.37±0.23f | 9.13±0.13ab | 3.31±0.16bc | 1.40±0.14cde | n.d.a | 0.47±0.05e | 2.09±0.12b | 0.10±0.00ab |
| H10 | 2469.52±31.51c | 64.24±0.33bc | 38.91±0.36ef | 9.11±0.14ab | 3.32±0.17bc | 1.76±0.15ghij | 1.36±0.12cd | 0.53±0.06e | 2.09±0.11b | 0.33±0.02ghij |
| H11 | 2507.47±34.10cd | 62.50±1.23bc | 39.50±0.38f | 9.09±0.24ab | 5.58±0.20g | 1.60±0.16efg | 1.34±0.12cd | 0.22±0.00ab | 0.26±0.02a | 0.20±0.00cdef |
| H12 | 2675.30±29.19ef | 62.92±1.14bc | 38.97±0.43ef | 9.07±0.21ab | 3.52±0.18cd | 1.62±0.13efgh | 1.22±0.10bc | 0.14±0.00a | 2.11±0.16b | 0.39±0.03k |
| H13 | 2724.65±26.42f | 64.00±1.10bc | 38.03±0.35abc | 9.07±0.19ab | 3.72±0.14d | 1.36±0.10cd | 1.51±0.14de | 0.68±0.08f | 2.09±0.13b | 0.35±0.02ijk |
| H14 | 2374.89±22.23b | 63.95±1.23bc | 39.22±0.45ef | 9.12±0.20ab | 5.55±0.19 g | 1.12±0.08b | 1.20±0.10bc | 0.20±0.00ab | 2.10±0.14b | 0.17±0.00cd |
| H15 | 2067.09±23.15a | 62.60±1.00bc | 39.12±0.34ef | 9.01±0.17a | 5.58±0.20 g | 1.96±0.18j | 1.61±0.16e | 0.25±0.00bc | 2.08±0.11b | 0.31±0.02hi |
| H16 | 2059.30±25.41a | 63.20±1.00bc | 39.23±0.22ef | 9.53±0.13cde | 5.13±0.21f | 1.91±0.18i | 1.47±0.15de | 0.68±0.06f | 2.10±0.10b | 0.31±0.02hi |
| H17 | 2405.81±27.12b | 64.19±1.02bc | 39.34±0.50ef | 9.85±0.10e | 4.44±0.17e | 1.84±0.18hij | 1.08±0.10b | 0.77±0.09f | 2.11±0.10b | 0.24±0.01g |
| H18 | 2646.06±39.54e | 68.38±0.99c | 39.46±0.49f | 9.72±0.12de | 3.15±0.13b | 1.39±0.16cde | 1.45±0.16de | 0.21±0.00ab | 2.18±0.13b | 0.37±0.04jk |
| H19 | 2927.07±33.33hi | 64.46±1.06bc | 39.40±0.47f | 9.51±0.12dc | 3.26±0.14bc | 1.52±0.12def | 1.82±0.18f | 0.23±0.00b | 2.11±0.11b | 0.21±0.00def |
| H20 | 2521.30±32.26d | 64.34±1.22bc | 39.49±0.38f | 9.14±0.13a | 3.46±0.15bcd | 1.05±0.11b | 1.55±0.15de | 0.32±0.05cd | 2.12±0.13b | 0.82±0.07l |
Different letters in the same column indicate significantly different at the 5% level (p<0.05) among the results. n.d., not detected.
Our findings show that physico-chemical properties, phenolic compounds, antioxidant capacity, sugar and mineral contents successfully distinguish the geographical origins of oak honeys. In this study, 20 oak honey samples collected from the Thrace region of Turkey exhibited different honeydew honey characteristics, depending on their physico-chemical properties. The honeys had higher phenolic contents than most blossom honeys, as well as higher antioxidant capacities. These findings supplied will contribute to a more accurate evaluation of oak honey in the literature.
Acknowledgment
We are grateful to the Scientific and Technological Research Council of Turkey (TUBITAK) for its support for the study through its contributions to project No. 114Z370. We also thank to Demirköy honey association for supplied honey samples.
Conflict of interest: The authors have no conflict of interest.
References
1. Nayik GA, Nanda V. Effect of thermal treatment and pH on antioxidant activity of saffron honey by using response surface methodology. Food Measure 2016;10:64–70.10.1007/s11694-015-9277-9Search in Google Scholar
2. Can Z, Yildiz O, Sahin H, Turumtay EA, Silici S, Kolayli S. An investigation of Turkish honeys: their physico-chemical properties, antioxidant capacities and phenolic profiles. Food Chem 2015;180:133–41.10.1016/j.foodchem.2015.02.024Search in Google Scholar PubMed
3. Meo SA, Al-Asiri SA, Mahesar AL, Ansari MJ. Role of honey in modern medicine. Saudi Journal of Biological Sciences, Article in Press. 2017. http://dx.doi.org/10.1016/j.sjbs.2016.12.010.10.1016/j.sjbs.2016.12.010Search in Google Scholar PubMed PubMed Central
4. Rodríguez-Flores MS, Escuredo O, Seijo MC. Assessment of physicochemical and antioxidant characteristics of Quercus pyrenaica honeydew honeys. Food Chem 2015;166:101–6.10.1016/j.foodchem.2014.06.005Search in Google Scholar PubMed
5. Sorkun K. Turkey’s nectarine plants, pollen and honeys. Palm Publication, 1. Press/341. Ankara. 2008.Search in Google Scholar
6. Simova S, Atanassov A, Shishiniova M, Bankova A. A rapid differentiation between oak honeydew honey and nectar and other honeydew honeys by NMR spectroscopy. Food Chem 2012;134:1706–10.10.1016/j.foodchem.2012.03.071Search in Google Scholar PubMed
7. Yaltırık F, Efe A. System of herbaceous plants study books, (II. Press) Ġ.Ü. Publication No: 3940, Forestry Faculty Publication. 1998; No: 10, 437–6, 518. Istanbul.Search in Google Scholar
8. Louveaux J, Maurizio A, Vorwohl G. Methods of melissopalynology. Bee World 1978;59:139–57.10.1080/0005772X.1978.11097714Search in Google Scholar
9. AOAC. Official Methods of Analysis of AOAC International, 16th ed. Association of Official Analytical Chemists. Washington, DC, 1990.Search in Google Scholar
10. Ough C. Rapid determination of proline in grapes and wines. J Food Sci 1960;34:228–30.10.1111/j.1365-2621.1969.tb10327.xSearch in Google Scholar
11. Kim KH, Tsao R, Yang R, Cui SW. Phenolic acid profiles and antioxidant activities of wheat bran extracts and the effect of hydrolysis conditions. Food Chem 2006;95:466–73.10.1016/j.foodchem.2005.01.032Search in Google Scholar
12. Singleton VL, Rossi JL. Colorimetry of total phenolics with phosphomolybdic phosphotungstic acid reagents. American J Enology Viticult 1965;16:144–58.10.5344/ajev.1965.16.3.144Search in Google Scholar
13. Fukumoto LR, Mazza G. Assessing antioxidant and prooxidant activities of phenolic compounds. J Agric Food Chem 2000;48:3597–604.10.1021/jf000220wSearch in Google Scholar PubMed
14. Benzei FF, Strain JJ. The ferric reducing ability of plasma (FRAP) as a measure of “antioxidant power”: the FRAP assay. Anal Biochem 1996;239:70–6.10.1006/abio.1996.0292Search in Google Scholar PubMed
15. Molyneux P. The use of the stable free radical diphenylpicrylhyrazyl (DPPH) for estimating antioxidant activity. Songklanakarin J Food Sci Technol 2004;26:211–9.Search in Google Scholar
16. De Villiers A, Lynen F, Crouch A, Sandra P. Development of a solid phase extraction procedure for the simultaneous determination of polyphenols, organic acids and sugars in wine. Chromatograp 2004;59:403–9.10.1365/s10337-004-0204-1Search in Google Scholar
17. Kaygusuz H, Tezcan F, Erim FB, Sahin H, Yıldız O, Can Z, et al. Characterization of Anatolian honeys based on minerals, bioactive components and principal component analysis. LWT – Food Sci Technol 2016;68:273–9.10.1016/j.lwt.2015.12.005Search in Google Scholar
18. Bogdanov S, Ruoff K, Persano Oddo L. Physico-chemical methods for the characterisation of unifloral honeys: a review. Apidologie 2004;35:4–17.10.1051/apido:2004047Search in Google Scholar
19. Kolayli S, Can Z, Yildiz O, Sahin H, Alpay Karaoglu S. A comparative study of the antihyaluronidase, antiurease, antioxidant, antimicrobial and physicochemical properties of different unifloral degrees of chestnut (Castanea sativa Mill.) honeys. J Enzyme Inhib Med Chem 2016;31:96–104.10.1080/14756366.2016.1209494Search in Google Scholar
20. Karabagias IK, Louppis AP, Karabournioti S, Kontakos S, Papastephanou C, Kontominas MG. Characterization and geographical discrimination of commercial Citrus spp. Honeys produced in different Mediterranean countries based on minerals, volatile compounds and physicochemical parameters, using chemometrics. Food Chem 2017;217:445–55.10.1016/j.foodchem.2016.08.124Search in Google Scholar
21. Kolayli S, Küçük M, Duran C, Candan F, Dinçer B. Chemical and antioxidant properties of laurocerasus officinalis roem. (Cherry Laurel) Fruit grown in the Black Sea region. J Agric Food Chem 2003;51:7489–94.10.1021/jf0344486Search in Google Scholar
22. Castro-Vázquez L, Díaz-Maroto MC, Pérez-Coello MS. Aroma composition and new chemical markers of Spanish citrus honeys. Food Chem 2007;103:601–6.10.1016/j.foodchem.2006.08.031Search in Google Scholar
23. Primorac L, Angelkov BM, Mandić M, Kenjerić D, Nedeljko M, Flanjak I. Comparison of the croatian and Macedonian honeydew honey. J Central Europen Agric 2009;10:263–70.Search in Google Scholar
24. Tezcan F, Kolayli S, Sahin H, Ulusoy E, Erim FB. Evaluation of organic acid, saccharide composition and antioxidant properties of some authentic Turkish honeys. J Food Nutrit 2011;50:33–40.Search in Google Scholar
25. Anupama D, Bhat KK, Sapna VK. Sensory and physicochemical properties of commercial samples of honey. Food Res Inter 2003;36:183–91.10.1016/S0963-9969(02)00135-7Search in Google Scholar
26. Gonzalez-Miret ML, Terrab A, Hernanz D, Fernandez-Recamales MA, Heredia FJ. Multivariate correlation between color and mineral composition of honeys and by their botanical origin. J Agric Food Chem 2005;53:2574–80.10.1021/jf048207pSearch in Google Scholar PubMed
27. Bertoncelj J, Doberšek U, Jamnik M, Golob T. Evaluation of the phenolic content, antioxidant activity and colour of Slovenian honey. Food Chem 2007;105:822–8.10.1016/j.foodchem.2007.01.060Search in Google Scholar
28. Lazaridou A, Biliaderis CG, Bocandritsos N, Sabatini AG. Composition, thermal and rheological behaviour of selected Green honeys. J Food Engineer 2004;64:9–21.10.1016/j.jfoodeng.2003.09.007Search in Google Scholar
29. Cotte JF, Casabianca H, Giroud B, Albert M, Lheritier J, Grenier-Loustalot MF. Characterization of honey amino acid profiles using high-pressure liquid chromatography to control authenticity. Anal Bioanal Chem 2004;378:1342–50.10.1007/s00216-003-2430-zSearch in Google Scholar PubMed
30. Codex Alimentarius Standard for honey Codex Alimentarius commission (pp.1e8). Rome/OMS.2001.Search in Google Scholar
31. Guler A, Bakan A, Nisbet C, Yavuz O. Determination of important biochemical properties of honey to discriminate pure and adulterated honey with sucrose (Saccharum officinarum L.) syrup. Food Chem 2007;105:1119–25.10.1016/j.foodchem.2007.02.024Search in Google Scholar
32. Vela L, De Lorenzo C, Perez RA. Antioxidant capacity of Spanish honeys and its correlation with polyphenol content and other physicochemical properties. J Sci Food Agric 2007;87:1069–75.10.1002/jsfa.2813Search in Google Scholar
33. Álvarez-Suárez JM, Tulipani S, Diaz D, Estevez Y, Romandini S, Giampieri F. Antioxidant and antimicrobial capacity of several monofloral Cuban honeys and their correlation with colour, polyphenol content and other chemical compounds. Food Chem Toxicol 2010;48:2490–9.10.1016/j.fct.2010.06.021Search in Google Scholar PubMed
34. Gómez-Caravaca AM, Gómez-Romero M, Arráez-Román D, Segura-Carretero A, Fernández-Gutiérrez A. Advances in the analysis of phenolic compounds in products derived from bees. J Pharma Biomed Anal 2006;41:1220–34.10.1016/j.jpba.2006.03.002Search in Google Scholar PubMed
35. Bueno-Costo FM, Zambiazi RC, Bohmer BW, Chaves FC, da Silva PW, Zanusso TJ. Antibacterial and antioxidant activity of honeys from the state of Rio Grande do Sul, Brazil. LWT – Food Sci Technol 2016;65:333–40.10.1016/j.lwt.2015.08.018Search in Google Scholar
36. Rasouli H, Farzaei MH, Mansouri K, Mohammadzadeh S, Khodarahmi R. Plant cell cancer: may natural phenolic compounds prevent onset and development of plant cell malignancy? A literature review. Molecules 2016; 21:2–26.10.3390/molecules21091104Search in Google Scholar PubMed PubMed Central
37. Haroun MI, Poyrazoglu E, Konar N, Artik N. Phenolic acid flavonoids profile of some Turkish honeydew and floral honeys. J Food Technol 2002;10:39–45.10.3923/jftech.2012.39.45Search in Google Scholar
38. Tomita K, Nagura T, Okuhara Y, Nakajima-Adachi H, Shigematsu N, Aritsuka T. Dietary melibiose regulates the cell response and enhances the induction of oral tolerance. Biosci Biotechnol Biochem 2007;71:2774–80.10.1271/bbb.70372Search in Google Scholar PubMed
39. Manzanares AB, García ZH, Galdón BR, Rodríguez ER, Romero CD. Differentiation of blossom and honeydew honeys using multi variate analysis on the physicochemical parameters and sugar composition. Food Chem 2011;126:664–72.10.1016/j.foodchem.2010.11.003Search in Google Scholar
40. Kolayli S, Kongur N, Gündoğdu A, Kemer B, Duran C, Aliyazicioğlu R. Mineral composition of selected honeys from Turkey. Asian J Chem 2008;20:2421–4.Search in Google Scholar
41. Alqarni AS, Owayss AA, Mahmoud AA. Mineral content and physical properties of local and imported honeys in Saudi Arabia. J Saudi Chem Society 2014;18:618–25.10.1016/j.jscs.2012.11.009Search in Google Scholar
©2018 Walter de Gruyter GmbH, Berlin/Boston
Articles in the same Issue
- Frontmatter
- Research Articles
- Betaine treatment decreased serum glucose and lipid levels, hepatic and renal oxidative stress in streptozotocin-induced diabetic rats
- Oxidative stress and response of antioxidant system in Nostoc muscorum exposed to different forms of Zinc
- An investigation on Trakya region Oak (Quercus spp.) honeys of Turkey: their physico-chemical, antioxidant and phenolic compounds properties
- Effects of Shiranuhi flower extracts and fractions on lipopolysaccharide-induced inflammatory responses in murine RAW 264.7 cells
- Evaluation of resveratrol organogels prepared by micro-irradiation: fibroblast proliferation through in vitro wound healing
- Ecological and phytochemical attributes of endemic Ferula gummosa Boiss. at vegetative and generative stages
- Characterization of calmodulin in the clam Anodonta woodiana: differential expressions in response to environmental Ca2+ and Cd2+
- Foliar application effects of salicylic acid and jasmonic acid on the essential oil composition of Salvia officinalis
- Antioxidant and antimicrobial activities of four Astragalus species growing wild in Turkey
- Differences in structure, allergenic protein content and pectate lyase enzyme activity of some Cupressaceae pollen
- In vitro bioactivities and subacute toxicity study of O. basilicum, T. vulgaris and R. officinalis
- Wendlandia exserta: a pertinent source of antioxidant and antimicrobial agent
- Effects of epigallocatechin-3-gallate (EGCG) on a scleroderma model of fibrosis