The association between back muscle characteristics and pressure pain sensitivity in low back pain patients
-
 ,
,

Abstract
Background and aims:
Some low back pain (LBP) patients recover after every pain episode whereas others develop chronicity. Research indicates that the amount of atrophy and fat infiltration differs between patients with LBP. Also enhanced pain sensitivity is present only in a subgroup of LBP patients. The relationship between pain sensitivity and muscular deformations in LBP, is however unexplored. This study examined the association between pressure pain sensitivity and the structural characteristics of the lumbar muscles in three different groups of non-specific LBP patients.
Methods:
This cross-sectional study examined the total cross-sectional area (CSA), fat CSA, muscle CSA and muscle fat index (MFI) of the lumbar multifidus (MF) and erector spinae (ES) at level L4 by magnetic resonance imaging in 54 patients with non-specific LBP (23 recurrent LBP, 15 non-continuous chronic LBP and 16 continuous chronic LBP). Pressure pain thresholds were measured at four locations (lower back, neck, hand and leg) by a manual pressure algometer and combined into one “pain sensitivity” variable. As a primary outcome measure, the association between pain sensitivity and muscle structure characteristics was investigated by multiple independent general linear regression models. Secondly, the influence of body mass index (BMI) and age on muscle characteristics was examined.
Results:
A positive association was found between pain sensitivity and the total CSA of the MF (p=0.006) and ES (p=0.001), and the muscle CSA of the MF (p=0.003) and ES (p=0.001), irrespective of the LBP group. No association was found between pain sensitivity and fat CSA or MFI (p>0.01). Furthermore, a positive association was found between BMI and the fat CSA of the MF (p=0.004) and ES (p=0.006), and the MFI of the MF (p<0.01) and ES (p=0.003). Finally, a positive association was found between age with the fat CSA of the MF (p=0.008) but not with the fat CSA of the ES (p>0.01), nor the MFI of the MF (p>0.01) and ES (p>0.01).
Conclusions:
A higher pain sensitivity is associated with a smaller total and muscle CSA in the lumbar MF and ES, and vice versa, but results are independent from the LBP subgroup. On the other hand, the amount of fat infiltration in the lumbar muscles is not associated with pain sensitivity. Instead, a higher BMI is associated with more lumbar fat infiltration. Finally, older patients with LBP are associated with higher fat infiltration in the MF but not in the ES muscle.
Implications:
These results imply that reconditioning muscular tissues might possibly decrease the pain sensitivity of LBP patients. Vice versa, therapy focusing on enhancement of pain sensitivity might also positively influence the CSA and that way contribute to the recovery of LBP. Furthermore, the amount of lumbar muscle fat seems not susceptible to pain sensitivity or vice versa, but instead a decrease in BMI might decrease the fat infiltration in the lumbar muscles and therefore improve the muscle structure quality in LBP. These hypothesis apply for all non-specific LBP patients, despite the type of LBP.
1 Introduction
Low back pain (LBP) is one of the most common musculoskeletal complaints. Up to 85% of all adults deal with LBP at one point in their lives [1], [2]. Recurrence rates are high (44–78%) [3] and are related to a large amount of health care costs and reduced productivity [2]. To date, it is unknown why some people recover after an episode of LBP whereas others develop chronic low back pain (CLBP). Research on the pathogenic mechanisms that trigger and underpin LBP complaints, is essential to prevent recurrence and the progression to chronicity.
For some decades, alterations in the central nervous system are frequently reported in several chronic pain populations [4], [5], [6], [7]. Recently, the contribution of pain processing mechanisms is also suggested in the etiology of recurrence and chronicity of LBP. In acute LBP, excitability and hypersensitivity of the peripheral nociceptors occur. This phenomenon is referred to as peripheral sensitization [8]. In case of sustained LBP, noxious input persists, which may lead to an enhanced responsiveness of the neurons within the central nervous system, termed as central sensitization. These changes in the central nervous system in some cases persist, even when the noxious input has disappeared and the initial injury is healed [8]. Central sensitization manifests through lowered pressure pain thresholds, enhanced temporal summation and decreased endogenous pain inhibition [7], [9], [10], [11]. A possible indicator of enhanced pain facilitation is hyperalgesia, or an increased response to a (painful) stimulus resulting in lowered pressure pain thresholds [8], [12]. Pressure pain thresholds are frequently measured by manual pressure algometry, both at primary pain sites and distant locations, giving an indication on local and widespread hyperalgesia [13], [14], [15], [16]. Based on preliminary evidence, it is expected that pain processing works properly in RLBP, enabling them to recover after every episode [17]. In CLBP however, contradicting results concerning local and widespread hyperalgesia are reported. Some studies found segmental/widespread hyperalgesia [18], [19], [20], [21] whereas others did not [14], [22].
Recently, a contribution of alterations in muscle tissue in the development or maintenance of alterations in the central nervous system is suggested [23]. In some chronic pain populations characterized by central sensitization, peripheral alterations are established. In chronic whiplash associated disorders for example [7], enhanced fat infiltration is established in the cervical flexor and extensor muscles [24], [25]. These fatty infiltrates are more distinct in patients with greater disability and are suggested to be associated with non-recovery [26]. These recent findings suggest a possible contribution of peripheral alterations in changes in the central nervous system occurring in chronic pain populations [27], [28], [29], [30]. An unexplored issue however, is the association between lumbar muscle alterations and pressure pain sensitivity in the LBP population. Possibly, local pressure pain sensitivity in CLBP patients, measured at the lower back, might be influenced by the muscle characteristics or vice versa.
Muscle structure alterations are frequently established in LBP patients [31]. The occurring changes in muscle structure in LBP patients differ between CLBP and recurrent low back pain (RLBP) patients. In CLBP, atrophy of the multifidus (MF) muscle is clearly established whereas results on fat infiltration remain conflicting [31]. In RLBP, no overall decrease in cross-sectional area (CSA) is present but an increased muscle fat index (MFI) is found, representing an enhanced amount of fat in lean muscle tissue and thus a decrease in lumbar muscle quality, which does not resolve when RLBP patients are in remission [32], [33].
Time aspects and the frequency of pain episodes might be involved in structural muscle alterations. One study found a relation between “the time elapsed since the last pain episode” and lean muscle CSA and total CSA in lumbar muscle tissue of RLBP patients [33]. Recovery from atrophy might therefore occur during pain remission periods. Furthermore, deterioration in muscle quality seems related to the frequency of previous pain episodes in RLBP [33]. Finally, a recent study described differences in muscle characteristics between RLBP patients, patients with continuous CLBP and patients with non-continuous CLBP [34]. As a result, the duration of pain resolution as well as the frequency of pain episodes might play a role in the alteration process of lumbar muscle structure in LBP. Further research in this area is however needed.
Until now, the association between muscle alterations such as CSA, fat infiltration and MFI with pressure pain sensitivity remains unexplored in LBP. Understanding of this relationship however might provide insight in the recurrence and chronicity of LBP. Therefore, this explorative study examined the association between pressure pain thresholds and alterations in CSA, fat infiltration and MFI of the lumbar erector spinae (ES) and MF muscle, in three subgroups of LBP, namely patients with RLBP who are in remission, CLBP with non-continuous LBP complaints and CLBP with continuous LBP complaints. It is hypothesized that patients with the largest amount of muscle deteriorations, might be characterized by the highest pressure pain sensitivity.
2 Methods
2.1 Participants
Males and females between 18 and 65 years old, with non-specific recurrent or chronic LBP were recruited through advertisement in hospitals in Ghent, in private practices for physiotherapy and through social media.
The RLBP subjects are characterized by pain episodes alternated by pain free periods. According to the definition of a LBP episode, launched by de Vet et al. [35] an episode of LBP is defined as a pain flare of at least 24 h, followed by a pain free episode of at least 1 month. Because this definition is not based on quantitative evidence, concomitant parameters of LBP recurrence were added: a pain flair is characterized by an increase of ≥2 on a Numeric Rating Scale (NRS) and/or ≥5 on the Roland-Morris Disability Questionnaire (RMDQ) [36]. A pain free episode is characterized by a 0/10 on an NRS and/or a score of <2 on the RMDQ [37]. Subjects in the RLBP group suffered from non-specific RLBP during at least 6 months, with a frequency of at least two episodes in the past year [38]. In addition, these subjects have a specific request for medical help concerning their RLBP but are currently in a state of remission.
CLBP is defined by symptoms of LBP for at least 3 months [39]. As described above, a large heterogeneity exists within the CLBP population and the frequency of pain flares might influence the association between muscle morphology and pain processing. Therefore, the CLBP population was subdivided into a non-continuous CLBP subgroup and a continuous CLBP subgroup. Subjects in the continuous CLBP subgroup suffered daily from LBP, whereas those in the non-continuous CLBP subgroup suffered from LBP for 3–4 days a week.
All subjects were asked to refrain from alcohol, nicotine, caffeine and all medication (including NSAID’s and paracetamol) on the day of testing. Subjects were also instructed not to perform exhausting physical activities the day before. Symptom characteristics, sociodemographic data and pain measurements were assessed on the 1st day of testing. Due to the limited availability of the MRI scanner and the subjects, the MRI assessment could vary between 3 and 10 days after the 1st day of testing. All subjects were provided with MRI-safety instructions and gave written informed consent prior to participation. This cross-sectional study took place at the University hospital of Ghent between September 2013 and November 2014 and was approved by the local ethical committee (EC UZ 22012/791). All in- and exclusion criteria for RLBP, non-continuous CLBP and continuous CLBP are summarized in Table 1.
In- and exclusion criteria for subject selection.
| Group | General inclusion criteria | General exclusion criteria | Specific in- and exclusion criteria |
|---|---|---|---|
| RLBP | – males and females – 18–65 years old – ≥1 years post-natal |
– neurological, respiratory, circulatory or continuous orthopedic diseases – use of antidepressants or analgesics (except for NSAID’s or paracetamol), taken 2 weeks prior to the testing – pregnancy – back surgery – previous exercise therapy focussing on the activation of the MF and ES muscles – current treatment for LBP |
– non-specific RLBP – ≥6 months duration – a frequency of ≥2 episodes in the past year – a pain flare of ≥24 h, characterized by an increase of ≥2 on an NRS scale and/or ≥5 on RMDQ – followed by a pain free episode of ≥1 month, characterized by a 0/10 on an NRS scale and/or <2 on RMDQ – application for medical help concerning low back complaints |
| Non-continuous CLBP | – non-specific CLBP – ≥3 months – 3–4 pain days a week |
||
| Continuous CLBP | – non-specific CLBP – ≥3 months – 7 pain days a week |
-
RLBP=recurrent low back pain; CLBP=chronic low back pain; NSAID’s=nonsteroidal anti-inflammatory drugs; NRS=numeric rating scale; RMDQ=Roland-Morris Disability Questionnaire.
2.2 Symptom characteristics and sociodemographic data
Sociodemographic information [age, gender, body mass index (BMI)] and symptom characteristics were obtained during a question round on the day of the pain measurements. To evaluate the impact of the LBP intensity on the day of testing, all subjects were asked to fill in the RMDQ. Greater levels of disability are reflected by higher scores on the RMDQ [40]. The current LBP intensity was recorded at the start of the experiment by use of an NRS in which “0=no pain” and “10=the worst pain imaginable”.
2.3 Structural muscle measurements
A 3-Tesla Siemens Trio-Tim whole-body MRI system (Siemens AG®, Erlangen, Germany) was used to acquire a T1-weighted 2-point Dixon scan, which was assessed to evaluate the CSA of MF and ES. Patients were placed supine on the MRI table, knees supported by a cushion, through which the hips were slightly flexed (30°). A flexible 6-element body-matrix coil, centered ventrally at L4 height, covered the complete lumbar region. A dorsal standard phased-array spine coil, acted as a receiver coil [33], [34].
On a sagittal localizing MRI scan, a slap group of 36 slices (3 mm slice thickness and 22.2% oversampling) was positioned at the upper endplate of L4 [41]. Measurement parameters for this two-point Dixon fat/water separation were: 320 mm FOV read, 6.59 ms TR, 2.45 ms TE1, 3.675 ms TE2 with 5 min 1 s acquisition time and a 0.7×0.7 matrix. The Dixon scan resulted in a fat image and water image. Total CSA, muscle CSA and fat CSA of ES and MF were calculated from these images by the signal intensities of the MRI obtained in the Siemens environment. All data was processed by the same researcher, blinded for the participant’s LBP status [34].
To estimate the total CSA of ES and MF, the region of interest (ROI) was outlined in the fat image, which was automatically copied onto the water image (Fig. 1A). ES and MF were outlined in two slices, at the height of L4, since measurements at L4 seem surrogates for the complete lumbar spine [41]. The total CSA of each muscle was calculated as the number of voxels in the respective ROI, multiplied by voxel size. A mean value of both slices was calculated, respectively for right and left ES and MF.
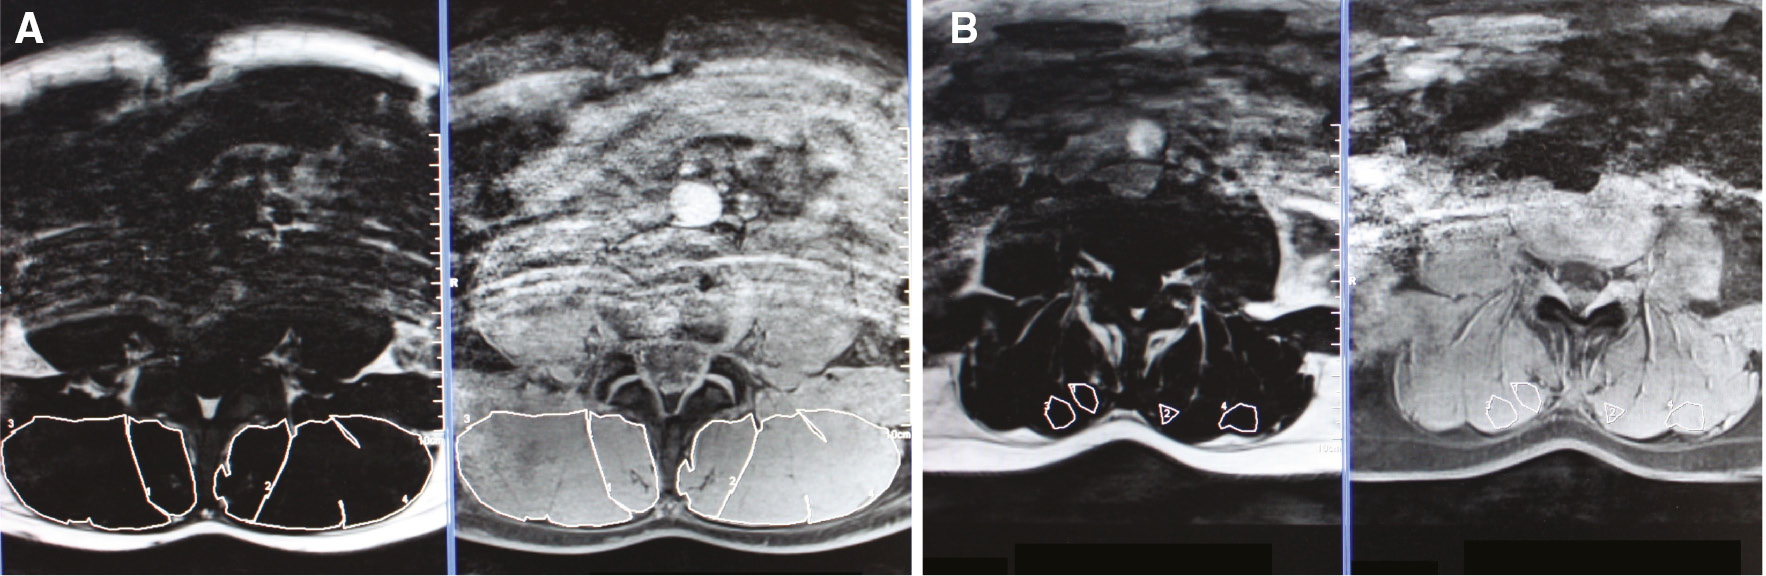
(A) Provides the ROI of the complete left and right ES and MF. (B) Provides the ROI for MFI in the left and right ES and MF. Therefore, an area with lean muscle tissue was selected.
In order to calculate the total fat index for MF and ES, the signal intensity for fat (SI-fat) and the signal intensity for water (SI-water) of ES and MF were also obtained from these particular ROIs. To estimate the total fat index, the following formula was applied: “SI-fat×100/(SI-fat+SI-water)” [34], [42], [43]. The CSA of lean muscle tissue (muscle CSA) was calculated by the formula: “total CSA×(1-total fat index)” [44]. To calculate the CSA of fat tissue in the spinal muscles (fat CSA), muscle CSA was distracted from total CSA.
To estimate the amount of fat in lean muscle tissue (lean MFI), the fat index in homogenous muscle tissue was estimated (Fig. 1B). Therefore, the procedure above was repeated, but in a homogenous muscle region instead of the total muscle region.
Since there were no differences in CSA between the left and right MF and ES and the majority of subjects suffered from central or bilateral LBP complaints, a mean value of left and right measurements was used in all analyses (Table 2).
Subject characteristics.
| RLBP (n=23) | Non-continuous CLBP (n=15) | Continuous CLBP (n=16) | Total (n=54) | |||||
|---|---|---|---|---|---|---|---|---|
| Gender | 9 m; 14 f | 7 m; 8 f | 8 m; 8 f | 24 m; 30 f | ||||
| Symptom site | – L: 2 – R: 4 – Bilateral: 17 |
– R: 1 – Bilateral: 14 |
– L: 2 – R: 2 – Bilateral: 12 |
– L: 4 – R: 7 – Bilateral: 43 |
||||
| Median (IQR) |
Min-Max |
Median (IQR) |
Min-Max |
Median (IQR) |
Min-Max |
Median (IQR) |
Min-Max |
|
| Age (years) | 27 (12) | 21–53 | 31 (14) | 20–54 | 50 (28) | 23–64 | 32 (24) | 20–64 |
| BMI | 22.80 (2.59) | 18.59–28.83 | 23.07 (1.13) | 19.83–26.13 | 24.07 (3.53) | 19.66–31.74 | 23.28 (2.86) | 18.59–31.74 |
| Symptom duration (months) | 84 (120) | 24–300 | 78 (138) | 24–240 | 156 (213) | 30–552 | 90 (141) | 24–552 |
| RMDQ (max 24) | 1.00 (1) | 0–6 | 5.00 (3) | 1–11 | 5.00 (5) | 1–12 | 3.00 (5) | 0–12 |
| Current LBP (NRS) | 0.00 (0.00) | 0–2 | 2.00 (1.5) | 0–8 | 2.00 (2) | 0–7 | 0.25 (2.00) | 0–8 |
-
IQR=Interquartile range; n=number of subjects included; m=male; f=female; L=left; R=right; no LBP=no low back pain; BMI=body mass index; RMDQ=Roland-Morris Disability Questionnaire; NRS=Numeric Rating Scale; RLBP=recurrent low back pain; CLBP=chronic low back pain.
2.4 Pain measurements
A hand held manual algometer (Wagner Instruments, Greenwich, CT, USA) with a probe of 1 cm diameter was used to assess pressure pain thresholds. Therefore, pressure was applied two times, perpendicular and at a constant rate (1 kg/s) onto the tissue surface, bilaterally at four spots: lumbar ES muscle (=lower back), 5 cm lateral of the spinous process at the height of L3 [45]; quadriceps muscle (=leg) at the middle of rectus femoris muscle belly, between the anterior superior iliac spine and basis patella [46]; trapezius muscle (=neck) at the middle between acromion and spinous process at C7 height [15], [47], [48]; the web (=hand) at the dorsal hand side between index and thumb [14], [49]. Lower back represents the local pain area, whereas neck, leg and hand represents distant areas. Lower back and leg were measured, respectively in prone and supine position. The pressure pain threshold at the neck and hand were assessed when sitting on a chair. For the neck, both arms hung relaxed beside the trunk and for the hand, both hands were placed on a table (Fig. 2). The minimal amount of pressure that induced an “uncomfortable sensation” at each test side, resembles the pressure pain threshold [50]. Therefore, pressure pain thresholds were obtained by instructing the subjects to say “stop” when the sensation became “uncomfortable”. The mean of both measurements was calculated. Furthermore, the mean value of the left and right mean pressure was calculated and used in further analysis.
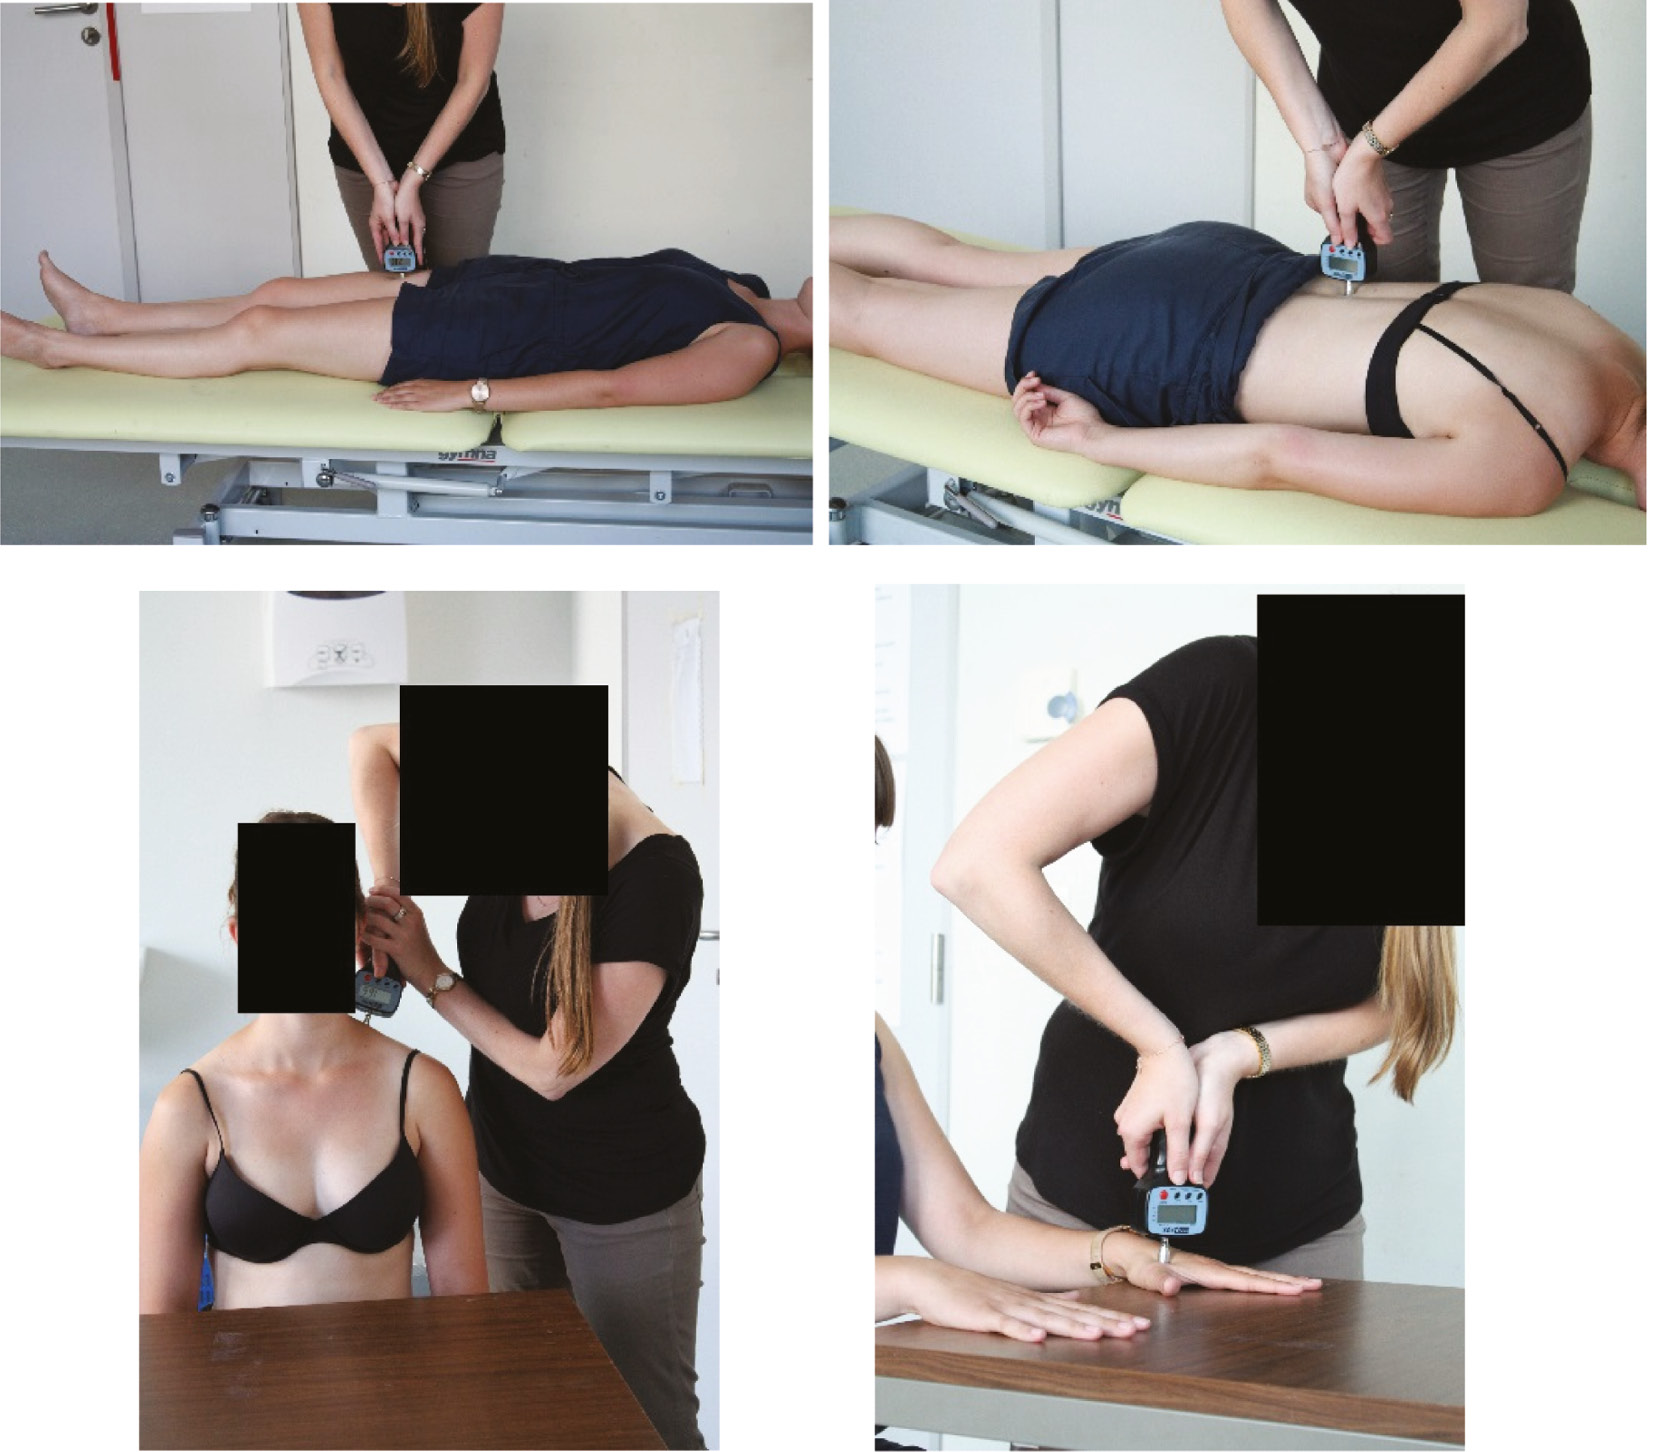
Pressure pain threshold measurements at the leg, back, neck and hand by use of a manual pressure algometer.
2.5 Statistical analyses
Statistics were performed using IBM SPSS Statistics 22 (SPP Inc., Chicago, IL, USA). Normality of the data was assessed visually and through the Shapiro-Wilk test. Comparability of groups was studied with a Pearson χ2 test for gender distribution and symptom site. Since most of the data were not normally distributed, a non-parametric Kruskal-Wallis test was used to compare groups for age, BMI, symptom duration, disability and current LBP intensity, whereas a Mann-WhitneyU-test was used for post-hoc pairwise comparison. To reduce the original pressure pain threshold variables into fewer composite variables, principal component analysis was performed (pressure pain thresholds at the back, leg, neck and hand) resulting into one “pain sensitivity”-variable (pain processing) which was used in further analysis. Only components with an eigenvalue of more than one were retained. If the variance explained by the included principal components reached a value above 75%, no additional components are retained.
Multiple independent general linear regression models were performed with pain processing as independent variable, muscle structure parameters as dependent variables, patient-group as fixed factor, and age and BMI as covariates, since both factors are considered as highly relevant confounders for pain thresholds and muscle structure characteristics. After building these models, all models were individually checked via residual-analyses, analyzing the following assumptions: linearity, homoscedasticity, and randomness of error terms. In addition, the cook’s distance for each observation was calculated to assess the influence of potential outliers on the estimated model. The significance level was set at α<0.01 to counteract multiple comparison.
3 Results
3.1 Demographic variables
A total of 54 LBP patients (23 RLBP, 15 non-continuous CLBP, 16 continuous CLBP) between 20 and 64 years old were included. RLBP were younger (p=0.002) and had a lower BMI (p=0.020) compared to continuous CLBP. RLBP experienced less disability (p<0.001) and current pain intensity (p<0.001) compared to both continuous and non-continuous CLBP. No significant differences between groups were found for gender, symptom site and symptom duration. All demographic variables are represented in Table 2.
3.2 Association between pressure pain thresholds and muscle structure
The principal component analysis on the dataset of pain variables resulted in four components of which the first was retained since it explained more than 77.6% of the total variance of the dataset. The weight given to the leg, back, neck and hand variable in component 1 are, respectively 0.900, 0.887, 0.869 and 0.865, which indicates that each variable has a similar influence on the principal component.
A significant association was found between pain processing and the total CSA of MF (p=0.006) and ES (p=0.001), controlled for age and BMI and irrespective of the LBP group. In addition, a significant association was found between pain processing and the muscle CSA of MF (p=0.003) and ES (p=0.001). No association was found between pain processing on the one hand and fat CSA of MF (p=0.876), fat CSA of ES (p=0.142), MFI of MF (p=0.274) or MFI of ES (p=0.231) on the other hand.
BMI was associated with fat CSA of MF (p=0.004), fat CSA of ES (p=0.006), MFI of ES (p=0.003) and MFI of MF (p<0.001). Age was associated with fat CSA of MF (p=0.008) but not with MFI ES (p=0.037), fat CSA of ES (p=0.115) or MFI ES (p=0.167).
All descriptive details and model characteristics can be found, respectively in Tables 3 and 4.
Descriptive statistics for the outcome measures.
| RLBP (n=23) | Non-continuous CLBP (n=15) | Continuous CLBP (n=16) | |
|---|---|---|---|
| Total CSA MF (cm2) | 5.85±1.40; (4.21–8.98) | 5.41±1.15; (3.17–7.47) | 5.95±1.45; (3.54–8.14) |
| Total CSA ES (cm2) | 16.62±4.18; (12.08–24.34) | 14.98±3.06; (8.57–21.44) | 15.84±3.17; (11.45–22.20) |
| Fat CSA MF (cm2) | 0.83±0.29; (0.53–1.66) | 0.77±0.19; (0.49–1.13) | 1.05±0.26; (0.62–1.41) |
| Fat CSA ES (cm2) | 2.66±0.83; (1.70–4.58) | 2.31±0.62; (1.14–3.51) | 3.27±1.04; (1.89–5.88) |
| Muscle CSA MF (cm2) | 5.02±1.21; (3.41–7.32) | 4.65±1.08; (2.35–6.47) | 4.89±1.44; (2.76–6.79) |
| Muscle CSA ES (cm2) | 13.96±3.61; (10.34–21.12) | 12.70±2.65; (6.64–17.93) | 12.58±2.90; (8.38–17.98) |
| MFI MF (%) | 7±1; (6–10) | 8±2; (5–14) | 10±3; (6–17) |
| MFI ES (%) | 8±2; (5–15) | 9±2; (6–13) | 11±3; (7–19) |
| PDT leg | 6.98±3.23 (2.89–16.38) | 6.19±3.08 (2.20–14.00) | 6.06±2.52 (1.24–10.05) |
| PDT back | 7.59±3.22 (4.08–16.94) | 6.14±3.07 (1.94–14.27) | 6.19±3.53 (0.86–13.87) |
| PDT neck | 4.49±1.93 (1.67–9.41) | 4.33±2.18 (0.95–9.43) | 3.77±1.41 (1.00–5.87) |
| PDT hand | 4.97±2.44 (2.01–10.42) | 4.78±3.04 (1.45–13.88) | 4.64±2.45 (1.27–10.44) |
-
Descriptive statistics of outcome measurements for muscle structure (total cross-sectional area, fat cross-sectional area, muscle cross-sectional area, muscle fat index) and pressure pain thresholds at four locations (CLBP=Chronic low back pain; CSA=cross-sectional area; ES=erector spinae; MF=multifidus; MFI=muscle fat index; n=number of subjects included; PDT=pressure pain detection threshold; RLBP=recurrent low back pain). All values are expressed by mean, standard deviation and range.
Model characteristics and parameter estimates.
| Model | df | R2-adjusted | Sig. | Parameter estimates | β | t (sig.) | 95% CI |
|
|---|---|---|---|---|---|---|---|---|
| Lower B | Upper B | |||||||
| Total CSA MF | df1=5 | 14% | 0.034a | (Intercept) | 2.826 | 1.490 (0.143) | −0.991 | 6.644 |
| df2=46 | RLBP | 0.463 | 1.106 (0.275) | −0.380 | 1.306 | |||
| Continuous CLBP | 0.624 | 1.244 (0.220) | −0.386 | 1.635 | ||||
| BMI | 0.142 | 1.687 (0.098) | −0.027 | 0.311 | ||||
| Age | −0.021 | −1.228 (0.226) | −0.055 | 0.013 | ||||
| Pain processing | 0.525 | 2.862 (0.006)a | 0.156 | 0.895 | ||||
| Muscle CSA MF | df1=5 | 14.5% | 0.030a | (Intercept) | 3.319 | 1.899 (0.064) | −0.199 | 6.837 |
| df2=46 | RLBP | 0.374 | 0.968 (0.338) | −0.403 | 1.151 | |||
| Continuous CLBP | 0.479 | 1.035 (0.306) | −0.453 | 1.410 | ||||
| BMI | 0.099 | 1.280 (0.207) | −0.057 | 0.255 | ||||
| Age | −0.028 | −1.831 (0.074) | −0.060 | 0.003 | ||||
| Pain processing | 0.530 | 3.134 (0.003)a | 0.190 | 0.871 | ||||
| Fat CSA MF | df1=5 | 41.9% | <0.001a | (Intercept) | −0.493 | −1.556 (0.126) | −1.130 | 0.144 |
| df2=46 | RLBP | 0.090 | 1.281 (0.206) | −0.051 | 0.230 | |||
| Continuous CLBP | 0.146 | 1.739 (0.089) | −0.023 | 0.314 | ||||
| BMI | 0.043 | 3.042 (0.004)a | 0.014 | 0.071 | ||||
| Age | 0.008 | 2.756 (0.008)a | 0.002 | 0.013 | ||||
| Pain processing | −0.005 | −0.157 (0.876) | −0.066 | 0.057 | ||||
| MFI MF | df1=5 | 44.3% | <0.001a | (Intercept) | −0.024 | −0.915 (0.365) | −0.077 | 0.029 |
| df2=47 | RLBP | −0.005 | −0.755 (0.454) | −0.017 | 0.008 | |||
| Continuous CLBP | 0.009 | 1.233 (0.224) | −0.006 | 0.024 | ||||
| BMI | 0.004 | 3.149 (0.003)a | 0.001 | 0.006 | ||||
| Age | 0.001 | 2.152 (0.037) | 0.0001 | 0.001 | ||||
| Pain processing | −0.003 | −1.107 (0.274) | −0.009 | 0.002 | ||||
| Total CSA ES | df1=5 | 20.4% | 0.009a | (Intercept) | 9.274 | 1.879 (0.067) | −0.675 | 19.224 |
| df2=44 | RLBP | 1.257 | 1.174 (0.274) | −0.901 | 3.415 | |||
| Continuous CLBP | 1.081 | 0.857 (0.396) | −1.461 | 3.622 | ||||
| BMI | 0.307 | 1.404 (0.167) | −0.134 | 0.749 | ||||
| Age | −0.041 | −0.971 (0.337) | −0.127 | 0.045 | ||||
| Pain processing | 1.685 | 3.599 (0.001)a | 0.742 | 2.629 | ||||
| Muscle CSA ES | df1=5 | 20.4% | 0.009a | (Intercept) | 10.606 | 2.397 (0.021) | 1.689 | 19.522 |
| df2=44 | RLBP | 1.008 | 1.050 (0.299) | −0.926 | 2.941 | |||
| Continuous CLBP | 0.478 | 0.423 (0.674) | −1.799 | 2.756 | ||||
| BMI | 0.177 | 0.901 (0.372) | −0.219 | 0.573 | ||||
| Age | −0.059 | −1.552 (0.128) | −0.136 | 0.018 | ||||
| Pain processing | 1.531 | 3.650 (0.001)a | 0.686 | 2.377 | ||||
| Fat CSA ES | df1=5 | 34.0% | <0.001a | (Intercept) | –1.959 | –1.581 (0.121) | −4.453 | 0.536 |
| df2=46 | RLBP | 0.179 | 0.654 (0.516) | –0.372 | 0.730 | |||
| Continuous CLBP | 0.571 | 1.739 (0.089) | –0.090 | 1.231 | ||||
| BMI | 0.158 | 2.869 (0.006)a | 0.047 | 0.268 | ||||
| Age | 0.017 | 1.605 (0.115) | –0.004 | 0.040 | ||||
| Pain processing | 0.179 | 1.493 (0.142) | –0.062 | 0.421 | ||||
| MFI ES | df1=5 | 56.6% | <0.001a | (Intercept) | –0.073 | −2.550 (0.014) | –0.130 | –0.015 |
| df2=46 | RLBP | –0.005 | –0.782 (0.438) | –0.019 | 0.008 | |||
| Continuous CLBP | 0.015 | 1.804 (0.078) | –0.002 | 0.031 | ||||
| BMI | 0.006 | 4.964 (p<0.001)a | 0.004 | 0.009 | ||||
| Age | 0.000 | 1.403 (0.167) | 0.000 | 0.001 | ||||
| Pain processing | –0.004 | –1.214 (0.231) | –0.010 | 0.002 | ||||
-
Multiple general linear regression models for different muscle structure outcome parameters with pain processing as predictor, corrected for patient group, BMI and age. The model characteristics are situated on the left side, the parameter estimates on the right side. Non-continuous CLBP is the reference group. ap<0.010 is significant. (df=Degrees of freedom; CI=confidence interval; B=bound; MF=multifidus; ES=erector spinae; CSA=cross-sectional area; MFI=muscle fat index).
4 Discussion
To our knowledge, this study is the first to discuss the association between pain processing measured by pressure pain thresholds and structural changes in the lumbar muscles of patients with LBP.
This explorative study found associations between pressure pain thresholds and the total CSA of MF and ES in LBP patients, when controlled for age and BMI. This implies that higher pressure pain thresholds, which are indicative for a better pain processing, are associated with a larger lumbar CSA among all LBP patients. As a consequence, one can assume that patients with LBP who are generally more sensitive for pain (lower pressure pain thresholds in general), are more likely to have smaller total and muscle CSA and vice versa.
Larger muscles are not necessarily characterized by enlarged muscle mass. It is even recently suggested that structural remodeling occurs, rather than clear atrophy of the lumbar muscles after back injury [51]. Therefore, general atrophy in lumbar muscles might be masked by the amount of fat infiltration and connective tissue, despite the amount of healthy muscle tissue. This study however also established a positive association between pressure pain thresholds and muscle CSA for ES and MF, when controlled for age and BMI. It can therefore be hypothesized that smaller muscles are less resilient for daily impact due to lowered pressure pain thresholds. This phenomenon might play a role to the recurrence and/or chronicity of LBP complaints.
Whether alterations in pain processing mechanisms are cause or consequence of muscle alterations, remains unclear. To date, limited evidence suggests that pain results in alterations in muscle structure and muscle function [52], [53], [54], but the opposite cannot be ruled out. On the one hand, an altered control strategy, induced by nociceptive input, might contribute to muscle overload or disuse and thus induce adaptations at the muscle level. In contrast, pain might also be the consequence of alterations in muscle structures and/or muscle activity [55]. A longitudinal design is needed to examine this question more closely.
However, a positive association between pressure pain sensitivity and CSA for ES and MF is established in the current study, the exact interplay between pressure pain sensitivity and muscle alterations remains unclear. A possible mechanism behind this interplay is the contribution of inflammatory mediators. It is postulated that the increased production of pro-inflammatory cytokines, such as tumor necrosis factor alpha (TNF-α), interleukin (IL)-1, IL-6 and interferon gamma (IFN-γ) [56], [57] as well as reduced levels of anti-inflammatory mediators such as IL-10 [58] are involved in muscle wasting. In a state of acute muscle injury, a diffuse muscle degeneration results in temporary muscle atrophy which is followed by the induction of muscle regeneration [56], [57]. Chronic inflammation on the other hand, affects muscle tissue differently, by enhancing protein breakdown and impaired myogenesis, resulting in uncontrolled wound healing, fibrosis and muscle waste [56]. Peripheral inflammatory processes are also involved in the phenomenon of widespread hyperalgesia: peripheral injury or other stressors seem to trigger pro-inflammatory cytokines contributing to symptoms of central sensitization in chronic pain populations [23], [57], [59], [60], [61]. The precise working mechanisms of inflammation on both protein turnover rates and central sensitization are yet poorly understood and need further elaboration.
No associations between pressure pain thresholds and fat CSA in MF or ES are established. Also no association with the quality of muscle tissue (MFI) is observed. Possibly other factors determine the amount of fat infiltration and muscle quality deterioration in the lumbar muscles. Several personal factors e.g. are related with muscular characteristics [62], [63]. Aging processes are associated with a declined total muscle CSA [64] as the consequence of motor unit loss and muscle fiber degeneration [65]. This gradual decrease in muscle size is accompanied by a replacement of muscle tissue by fat and connective tissue [41], [65], [66]. In the current study, a significant association of age was found on fat CSA in MF, and a borderline significant association on MFI in MF, confirmed previous results. However, no association was found in the ES muscle. These results are in concordance with recent findings of Crawford and colleagues, who established muscle degeneration was more pronounced in the MF compared to the ES in asymptomatic subjects [41], [67]. BMI is also observed to negatively influence muscle thickness [64], [68], [69] and pressure pain thresholds [21], [70]. An association between BMI and fat CSA and MFI in the current study confirms previous research reporting an influence of BMI on muscle CSA and fat infiltration [71], [72]. This finding, together with the lack of an association between fatty infiltrates and pressure pain thresholds indicate that BMI might play an explicit role in the fat infiltration of muscle tissue, and not pressure pain sensitivity.
Differences between RLBP and CLBP exist in muscle morphology [34] and are suggested in pain processing mechanisms [17]. The chronicity based classification of the LBP subgroups used in this study was of no influence on the association between pressure pain thresholds and muscle morphology in this cohort. However, given the rather small sample sizes per group, small associations might have been missed.
5 Clinical implications
An association between lumbar CSA and pressure pain thresholds in LBP patients, implies that improvement of lumbar CSA might positively affect pressure pain sensitivity. Previous studies found enhanced muscle characteristics in addition to a decrease in lumbar pain experience after exercise interventions [73], [74]. Reconditioning muscular tissues might therefore decrease the pain sensitivity of those patients. However, further research is needed to confirm this hypothesis. Also the opposite might work. Therapy focusing on enhancement of pain processing mechanisms, might positively influence muscle CSA in LBP and contribute to the recovery of LBP. These interventions intend to deactivate the pain facilitation top-down pathways, responsible for central nervous system hyperexcitability [75]. Recent interest arises for treatment approaches addressing both pain processing dysfunctions and peripheral mechanisms within a broader biopsychosocial point of view [75], [76], [77]. The results of the current study might partly explain the effectiveness of this approach. If both problem areas are addressed and positively influence each other, it is more likely that patients improve after therapy. Further research in this field is however needed.
From a clinical point of view, distant and local pressure pain thresholds could been separated. Based on the principal component analysis, an equal weight was observed from each PPT at each site. This indicates an underlying variable of pain rather than two underlying variables of distant and local pressure pain. However, one should always keep in mind that different variables could be associated with peripheral and central processes of pain.
6 Limitations
The methodological characteristics of this study imply some limitations. First, in this study, pain processing was only assessed by pressure pain thresholds using manual algometry. Future research should incorporate additional quantitative sensory testing to fully record pain processing, amongst which temporal summation of pain, spatial summation of pain and conditioned pain modulation. Furthermore, the CSA and MFI were assessed at only level L4. The fat fraction of this level correlates best with the total lumbar fat fraction [41]. For CSA however, a full volume metrics is probably superior to single slice analysis. Future research should take this into account.
Second, it should also be highlighted that the explained variance of the multiple independent general linear regression models is limited for total CSA and muscle CSA of MF (respectively 14% and 14.5%). Besides age and BMI, also psychosocial factors may influence LBP occurrence, recurrence and chronicity [78], [79]. Therefore, an influence on the association between muscle morphology on the one hand and pain processing on the other hand can also be assumed. Addressing these psychosocial issues would dilate the theme of the current study but should be considered in future research.
Finally, the absolute observations in the cross-sectional nature of this study implies that no causal connection can be made between the explored associations. Further research on this topic in longitudinal studies is essential to provide additional insight in the association between structural characteristics, pressure pain thresholds and personal characteristics. It could be investigated whether interventions that influence muscle characteristics result in increased pressure pain thresholds and vice versa. Furthermore, the relative long-term influence of personal factors such as BMI and age on fat infiltration and MFI in lumbar muscles should be investigated in longitudinal studies to investigate whether these factors indeed play a role in the fat infiltrations of muscle tissue.
7 Conclusion
Associations between pressure pain thresholds and total and muscle CSA in the lumbar MF and ES seem to exist, independent from the LBP subgroup. As consequence, LBP patients with generally increased pain sensitivity are more likely to have smaller muscles and vice versa. As with any novel and preliminary findings, these results need to be elaborated in future research. Longitudinal studies including more psychosocial variables are necessary to address the importance of an individual’s pain threshold on muscle morphology and vice versa in LBP patients.
-
Authors’ statements
-
Research funding: Dorien Goubert and Iris Coppieters were financially supported by an Interdisciplinary Research grant from the Special Research Fund of Ghent University (Dorien Goubert: BOF14/IOP/067; Iris Coppieters: BOF13/DOC/276).
-
Conflict of interest: No conflicts of interest are present in this manuscript.
-
Informed consent: All participants gave written informed consent prior to participation.
-
Ethical approval: This research was part of a larger study which was approved by the local ethical committee (EC UZ 22012/791).
References
[1] Von Korff M. Studying the natural history of back pain. Spine (Phila Pa 1976) 1994;19(18 Suppl):2041S–6S.10.1097/00007632-199409151-00005Search in Google Scholar PubMed
[2] Becker A, Held H, Redaelli M, Strauch K, Chenot JF, Leonhardt C, Keller S, Baum E, Pfingsten M, Hildebrandt J, Basler HD, Kochen MM, Donner-Banzhoff N. Low back pain in primary care: costs of care and prediction of future health care utilization. Spine (Phila Pa 1976) 2010;35:1714–20.10.1097/BRS.0b013e3181cd656fSearch in Google Scholar
[3] Hestbaek L, Leboeuf-Yde C, Manniche C. Low back pain: what is the long-term course? A review of studies of general patient populations. Eur Spine J 2003;12:149–65.10.1007/s00586-002-0508-5Search in Google Scholar PubMed PubMed Central
[4] Julien N, Goffaux P, Arsenault P, Marchand S. Widespread pain in fibromyalgia is related to a deficit of endogenous pain inhibition. Pain 2005;114:295–302.10.1016/j.pain.2004.12.032Search in Google Scholar PubMed
[5] Lannersten L, Kosek E. Dysfunction of endogenous pain inhibition during exercise with painful muscles in patients with shoulder myalgia and fibromyalgia. Pain 2010;151:77–86.10.1016/j.pain.2010.06.021Search in Google Scholar PubMed
[6] Staud R, Vierck CJ, Cannon RL, Mauderli AP, Price DD. Abnormal sensitization and temporal summation of second pain (wind-up) in patients with fibromyalgia syndrome. Pain 2001;91:165–75.10.1016/S0304-3959(00)00432-2Search in Google Scholar
[7] Van Oosterwijck J, Nijs J, Meeus M, Paul L, Nijs CJ. Evidence for central sensitization in chronic whiplash: a systematic literature review. Eur J Pain 2012;17:299–312.10.1002/j.1532-2149.2012.00193.xSearch in Google Scholar PubMed
[8] Woolf CJ, Doubell TP. The pathophysiology of chronic pain – increased sensitivity to low threshold A beta-fibre inputs. Curr Opin Neurobiol 1994;4:525–34.10.1016/0959-4388(94)90053-1Search in Google Scholar PubMed
[9] Meeus M, Nijs J, De Meirleir K. Chronic musculoskeletal pain in patients with the chronic fatigue syndrome: a systematic review. Eur J Pain 2007;11:377–86.10.1016/j.ejpain.2006.06.005Search in Google Scholar PubMed
[10] Kaya S, Hermans L, Willems T, Roussel N, Meeus M. Central sensitization in urogynecological chronic pelvic pain: a systematic literature review. Pain Physician 2013;16:291–308.10.36076/ppj.2013/16/291Search in Google Scholar
[11] Clauw DJ. Fibromyalgia: an overview. Am J Med 2009;122 (12 Suppl):S3–13.10.1016/j.amjmed.2009.09.006Search in Google Scholar PubMed
[12] Latremoliere A, Woolf CJ. Central sensitization: a generator of pain hypersensitivity by central neural plasticity. J Pain 2009;10:895–926.10.1016/j.jpain.2009.06.012Search in Google Scholar PubMed PubMed Central
[13] Van Oosterwijck J, Nijs J, Meeus M, Van Loo M, Paul L. Lack of endogenous pain inhibition during exercise in people with chronic whiplash associated disorders: an experimental study. J Pain 2012;13:242–54.10.1016/j.jpain.2011.11.006Search in Google Scholar PubMed
[14] Meeus M, Roussel NA, Truijen S, Nijs J. Reduced pressure pain thresholds in response to exercise in chronic fatigue syndrome but not in chronic low back pain: an experimental study. J Rehabil Med 2010;42:884–90.10.2340/16501977-0595Search in Google Scholar PubMed
[15] Ickmans K, Meeus M, De Kooning M, Lambrecht L, Pattyn N, Nijs J. Associations between cognitive performance and pain in chronic fatigue syndrome: comorbidity with fibromyalgia does matter. Pain Physician 2015;18:841–52.10.36076/ppj.2015/18/E841Search in Google Scholar
[16] Skou ST, Graven-Nielsen T, Rasmussen S, Simonsen OH, Laursen MB, Arendt-Nielsen L. Widespread sensitization in patients with chronic pain after revision total knee arthroplasty. Pain 2013;154:1588–94.10.1016/j.pain.2013.04.033Search in Google Scholar PubMed
[17] Goubert D, Danneels L, Graven-Nielsen T, Descheemaeker F, Coppieters I, Meeus M. Differences in pain processing between patients with chronic low back pain, recurrent low back pain and fibromyalgia. Pain Physician 2017;20:307–18.10.36076/ppj.2017.318Search in Google Scholar
[18] Giesecke T, Gracely R, Grant M, Nachemson A, Petske F, Williams D, Clauw D. Evidence of augmented central pain processing in idiopathic chronic low back pain. Arthritis Rheum 2004;50:613–23.10.1002/art.20063Search in Google Scholar PubMed
[19] Clauw DJ, Williams D, Lauerman W, Dahlman M, Aslami A, Nachemson A, Kobrine A, Wiesel S. Pain sensitivity as a correlate of clinical status in individuals with chronic low back pain. Spine (Phila Pa 1976) 1999;24:2035–41.10.1097/00007632-199910010-00013Search in Google Scholar PubMed
[20] Giesbrecht RJS, Battie MC. A comparison of pressure pain detection thresholds in people with chronic low back pain and volunteers without pain. Phys Ther 2005;85:1085–92.10.1093/ptj/85.10.1085Search in Google Scholar
[21] Imamura M, Chen J, Matsubayashi SR, Targino RA, Alfieri FM, Bueno DK, Hsing WT. Changes in pressure pain threshold in patients with chronic nonspecific low back pain. Spine (Phila Pa 1976) 2013;38:2098–107.10.1097/01.brs.0000435027.50317.d7Search in Google Scholar PubMed
[22] Diers M, Koeppe C, Diesch E, Stolle AM, Ho R, Schiltenwolf M, Van Ackern A, Flor H. Central processing of acute muscle pain in chronic low back pain patients: an EEG mapping study. J Clin Neurophysiol 2007;24:76–83.10.1097/01.wnp.0000241093.00844.0eSearch in Google Scholar PubMed
[23] Staud R. Fibromyalgia syndrome: mechanisms of abnormal pain processing. Prim Psychiatry 2006;13:66–71.Search in Google Scholar
[24] Elliott JM, O’Leary S, Sterling M, Hendrikz J, Pedler A, Jull G. Magnetic resonance imaging findings of fatty infiltrate in the cervical flexors in chronic whiplash. Spine (Phila Pa 1976) 2010;35:948–54.10.1097/BRS.0b013e3181bb0e55Search in Google Scholar PubMed
[25] Elliott J, Jull G, Noteboom JT, Darnell R, Galloway G, Gibbon WW. Fatty infiltration in the cervical extensor muscles in persistent whiplash-associated disorders: a magnetic resonance imaging analysis. Spine (Phila Pa 1976) 2006;31: E847–55.10.1097/01.brs.0000240841.07050.34Search in Google Scholar PubMed
[26] Elliott J, Pedler A, Kenardy J, Galloway G, Jull G, Sterling M. The temporal development of fatty infiltrates in the neck muscles following whiplash injury: an association with pain and posttraumatic stress. PLoS One 2011;6:2–7.10.1371/journal.pone.0021194Search in Google Scholar PubMed PubMed Central
[27] Staud R, Nagel S, Robinson ME, Price DD. Enhanced central pain processing of fibromyalgia patients is maintained by muscle afferent input: a randomized, double-blind, placebo-controlled study. Pain 2009;145:96–104.10.1016/j.pain.2009.05.020Search in Google Scholar PubMed PubMed Central
[28] Staud R. The role of peripheral input for chronic pain syndromes like fibromyalgia syndrome. J Musculoskelet Pain 2008;16:67–74.10.1080/10582450801960339Search in Google Scholar
[29] Gerdle B, Hilgenfeldt U, Larsson B, Kristiansen J, Søgaard K, Rosendal L. Bradykinin and kallidin levels in the trapezius muscle in patients with work-related trapezius myalgia, in patients with whiplash associated pain, and in healthy controls – a microdialysis study of women. Pain 2008;139:578–87.10.1016/j.pain.2008.06.012Search in Google Scholar PubMed
[30] Serra J, Collado A, Solà R, Antonelli F, Torres X, Salgueiro M, Qioles C, Bostock H. Hyperexcitable C nociceptors in fibromyalgia. Ann Neurol 2014;75:196–208.10.1002/ana.24065Search in Google Scholar PubMed
[31] Goubert D, Van Oosterwijck J, Meeus M, Danneels L. Lumbar muscles in non-specific low back pain: a systematic review. Pain Physician 2016;19:E985–1000.10.36076/ppj/2016.19.E985Search in Google Scholar
[32] MacDonald D, Moseley GL, Hodges PW. Why do some patients keep hurting their back? Evidence of ongoing back muscle dysfunction during remission from recurrent back pain. Pain 2009;142:183–8.10.1016/j.pain.2008.12.002Search in Google Scholar PubMed
[33] D’hooge R, Cagnie B, Crombez G, Vanderstraeten G, Dolphens M, Danneels L. Increased intramuscular fatty infiltration without differences in lumbar muscle cross-sectional area during remission of unilateral recurrent low back pain. Man Ther 2012;17:584–8.10.1016/j.math.2012.06.007Search in Google Scholar PubMed
[34] Goubert, De Pauw R, Meeus M, Willems T, Cagnie B, Schouppe S, Van Oosterwijck J, Dhondt E, Danneels L. Lumbar muscle structure and function in chronic versus recurrent low back pain: a cross-sectional study. Spine J 2017;17:1285–96.10.1016/j.spinee.2017.04.025Search in Google Scholar PubMed
[35] de Vet HCW, Heymans MW, Dunn KM, Pope DP, van der Beek AJ, Macfarlane GJ, Bouter LM, Croft PR. Episodes of low back pain: a proposal for uniform definitions to be used in research. Spine (Phila Pa 1976) 2002;27:2409–16.10.1097/00007632-200211010-00016Search in Google Scholar
[36] Stanton TR, Latimer J, Maher CG, Hancock M. Definitions of recurrence of an episode of low back pain. Spine (Phila Pa 1976) 2009;34:E316–22.10.1097/BRS.0b013e318198d073Search in Google Scholar PubMed
[37] Kamper SJ, Maher CG, Herbert RD, Hancock MJ, Hush JM, Smeets RJ. How little pain and disability do patients with low back pain have to experience to feel that they have recovered? Eur Spine J 2010;19:1495–501.10.1007/s00586-010-1366-1Search in Google Scholar PubMed PubMed Central
[38] Stanton TR, Latimer J, Maher CG, Hancock MJ. How do we define the condition “recurrent low back pain”? A systematic review. Eur Spine J 2010;19:533–9.10.1007/s00586-009-1214-3Search in Google Scholar PubMed PubMed Central
[39] Bogduk N. Management of chronic low back pain. Med J Aust 2004;180:79–83.10.5694/j.1326-5377.2004.tb05805.xSearch in Google Scholar PubMed
[40] Smeets R, Köke A, Lin C-W, Ferreira M, Demoulin C. Measures of function in low back pain/disorders: Low Back Pain Rating Scale (LBPRS), Oswestry Disability Index (ODI), Progressive Isoinertial Lifting Evaluation (PILE), Quebec Back Pain Disability Scale (QBPDS), and Roland-Morris Disability Questionnaire. Arthritis Care Res (Hoboken) 2011;63(S11):S158–73.10.1002/acr.20542Search in Google Scholar PubMed
[41] Crawford RJ, Filli L, Elliott JM, Nanz D, Fischer MA, Marcon M, Ulbrich EJ. Age- and level-dependence of fatty infiltration in lumbar paravertebral muscles of healthy volunteers. Am J Neuroradiol 2016;37:742–8.10.3174/ajnr.A4596Search in Google Scholar PubMed PubMed Central
[42] Wokke BH, Bos C, Reijnierse M, van Rijswijk CS, Eggers H, Webb A, Verschuuren J, Kan H. Comparison of dixon and T1-weighted MR methods to assess the degree of fat infiltration in duchenne muscular dystrophy patients. J Magn Reson Imaging 2013;38:619–24.10.1002/jmri.23998Search in Google Scholar PubMed
[43] Sinclair CD, Morrow J, Yousry T, Golay X, Thornton J. Test-retest reproducibility of MTR, T2 and 3-point dixon fat quantification methods in muscle MRI. Proc Intl Soc Magn Reson Med 2010;433:3958.Search in Google Scholar
[44] Elliott JM, Pedler AR, Jull GA, Van Wyk L, Galloway GG, OʼLeary SP. Differential changes in muscle composition exist in traumatic and nontraumatic neck pain. Spine (Phila Pa 1976) 2014;39:39–47.10.1097/BRS.0000000000000033Search in Google Scholar PubMed
[45] Farasyn A, Meeusen R. Pressure pain thresholds in healthy subjects: influence of physical activity, history of lower back pain factors and the use of endermology as a placebo-like treatment. J Bodyw Mov Ther 2003;7:53–61.10.1016/S1360-8592(02)00050-5Search in Google Scholar
[46] Daenen L, Nijs J, Roussel N, Wouters K, Van Loo M, Cras P. Dysfunctional pain inhibition in patients with chronic whiplash-associated disorders: an experimental study. Clin Rheumatol 2013;32:23–31.10.1007/s10067-012-2085-2Search in Google Scholar PubMed
[47] Cathcart S, Winefield AH, Lushington K, Rolan P. Noxious inhibition of temporal summation is impaired in chronic tension-type headache. Headache 2010;50:403–12.10.1111/j.1526-4610.2009.01545.xSearch in Google Scholar PubMed
[48] Nijs J, Meeus M, Van Oosterwijck J, Roussel N, De Kooning M, Ickmans K, Matic M. Treatment of central sensitization in patients with “unexplained” chronic pain: what options do we have? Expert Opin Pharmacother 2011;12:1087–98.10.1517/14656566.2011.547475Search in Google Scholar PubMed
[49] Whiteside A, Hansen S, Chaudhuri A. Exercise lowers pain threshold in chronic fatigue syndrome. Pain 2004;109:497–9.10.1016/j.pain.2004.02.029Search in Google Scholar PubMed
[50] O’Sullivan P, Waller R, Wright A, Gardner J, Johnston R, Payne C, Shannon A, Ware B, Smith A. Sensory characteristics of chronic non-specific low back pain: a subgroup investigation. Man Ther 2014;19:311–8.10.1016/j.math.2014.03.006Search in Google Scholar PubMed
[51] Hodges PW, James G, Blomster L, Hall L, Schmid A, Shu C, Little C, Melrose J. Multifidus muscle changes after back injury are characterized by structural remodeling of muscle, adipose and connective tissue, but not muscle atrophy. Spine (Phila Pa 1976) 2015;40:1057–71.10.1097/BRS.0000000000000972Search in Google Scholar PubMed
[52] Kiesel KB, Uhl T, Underwood FB, Nitz AJ. Rehabilitative ultrasound measurement of select trunk muscle activation during induced pain. Man Ther 2008;13:132–8.10.1016/j.math.2006.10.003Search in Google Scholar PubMed
[53] Hodges P, Holm AK, Hansson T, Holm S. Rapid atrophy of the lumbar multifidus follows experimental disc or nerve root injury. Spine (Phila Pa 1976) 2006;31:2926–33.10.1097/01.brs.0000248453.51165.0bSearch in Google Scholar PubMed
[54] Dickx N, Cagnie B, Achten E, Vandemaele P, Parlevliet T, Danneels L. Changes in lumbar muscle activity because of induced muscle pain evaluated by muscle functional magnetic resonance imaging. Spine (Phila Pa 1976) 2008;33:E983–9.10.1097/BRS.0b013e31818917d0Search in Google Scholar PubMed
[55] Falla D, Farina D. Neuromuscular adaptation in experimental and clinical neck pain. J Electromyogr Kinesiol 2008;18:255–61.10.1016/j.jelekin.2006.11.001Search in Google Scholar PubMed
[56] Costamagna D, Costelli P, Sampaolesi M, Penna F. Role of inflammation in muscle homeostasis and myogenesis [Internet]. Vol. 2015, Mediators of Inflammation. Hindawi; 2015, p. 1–14. Available at: http://www.hindawi.com/journals/mi/2015/805172/. Accessed: 22 Aug 2017.10.1155/2015/805172Search in Google Scholar PubMed PubMed Central
[57] Londhe P, Guttridge DC. Inflammation induced loss of skeletal muscle. Bone 2015;80:131–42.10.1016/j.bone.2015.03.015Search in Google Scholar PubMed PubMed Central
[58] Walston J, Fedarko N, Yang H, Leng S, Beamer B, Espinoza S, Lipton A, Zheng H, Becker K. The physical and biological characterization of a frail mouse model. J Gerontol A Biol Sci Med Sci 2008;63:391–8.10.1093/gerona/63.4.391Search in Google Scholar PubMed PubMed Central
[59] Kothari SF, Baad-Hansen L, Oono Y, Svensson P. Somatosensory assessment and conditioned pain modulation in temporomandibular disorders pain patients. Pain 2015;156:2545–55.10.1097/j.pain.0000000000000325Search in Google Scholar PubMed
[60] Meeus M, Nijs JJ, Hermans L, Goubert D, Calders P. The role of mitochondrial dysfunctions due to oxidative and nitrosative stress in the chronic pain or chronic fatigue syndromes and fibromyalgia patients: peripheral and central mechanisms as therapeutic targets? Expert Opin Ther Targets 2013;17:1081–9.10.1517/14728222.2013.818657Search in Google Scholar PubMed
[61] Watkins LR, Wiertelak EP, Goehler LE, Smith KP, Martin D, Maier SF. Characterization of cytokine-induced hyperalgesia. Brain Res 1994;654:15–26.10.1016/0006-8993(94)91566-0Search in Google Scholar PubMed
[62] Fortin M, Yuan Y, Battie MC. Factors associated with paraspinal muscle asymmetry in size and composition in a general population sample of men. Phys Ther 2013;93:1540–50.10.2522/ptj.20130051Search in Google Scholar PubMed PubMed Central
[63] Mannion AF, Dumas GA, Stevenson JM, Cooper RG. The influence of muscle fiber size and type distribution on electromyographic measures of back muscle fatigability. Spine (Phila Pa 1976) 1998;23:576–84.10.1097/00007632-199803010-00010Search in Google Scholar PubMed
[64] Kalichman L, Hodges P, Li L, Guermazi A, Hunter DJ. Changes in paraspinal muscles and their association with low back pain and spinal degeneration: CT study. Eur Spine J 2010;19: 1136–44.10.1007/s00586-009-1257-5Search in Google Scholar PubMed PubMed Central
[65] Power GA, Dalton BH, Rice CL. Human neuromuscular structure and function in old age: a brief review. J Sport Health Sci 2013;2:215–26.10.1016/j.jshs.2013.07.001Search in Google Scholar PubMed PubMed Central
[66] Evance WJ, Lexell J. Human aging, muscle mass, and fiber type composition. J Gerontol A Biol Sci Med Sci 1995;50:11–6.10.1093/gerona/50A.Special_Issue.11Search in Google Scholar PubMed
[67] Crawford RJ, Volken T, Valentin S, Melloh M, Elliott JM. Rate of lumbar paravertebral muscle fat infiltration versus spinal degeneration in asymptomatic populations: an age-aggregated cross-sectional simulation study. Scoliosis Spinal Disord 2016;11:21.10.1186/s13013-016-0080-0Search in Google Scholar PubMed PubMed Central
[68] Rostami M, Abedi Yekta AH, Noormohammadpour P, Farahbakhsh F, Kordi M, Kordi R. Relations between lateral abdominal muscles thickness, body mass index, waist circumference and skin fold thickness. Acta Med Iran 2013;51:101–6.Search in Google Scholar
[69] Fortin M, Videman T, Gibbons L, Battié MC. Paraspinal muscle morphology and composition. Med Sci Sport Exerc 2014;46:893–901.10.1249/MSS.0000000000000179Search in Google Scholar PubMed
[70] Tashani OA, Astita R, Sharp D, Johnson MI. Body mass index and distribution of body fat can influence sensory detection and pain sensitivity. Eur J Pain (United Kingdom) 2017;21:1186–96.10.1002/ejp.1019Search in Google Scholar PubMed
[71] Gibbons LE, Videman T, Battié MC, Kaprio J. Determinants of paraspinal muscle cross-sectional area in male monozygotic twins. Phys Ther 1998;78:602–10; discussion 611–2.10.1093/ptj/78.6.602Search in Google Scholar PubMed
[72] Springer BA, Mielcarek BJ, Nesfield TK, Teyhen DS. Relationships among lateral abdominal muscles, gender, body mass index, and hand dominance. J Orthop Sport Phys Ther 2006;36:289–97.10.2519/jospt.2006.2217Search in Google Scholar PubMed
[73] Welch N, Moran K, Antony J, Richter C, Marshall B, Coyle J, Falvey E, Franklyn-Miller A. The effects of a free-weight-based resistance training intervention on pain, squat biomechanics and MRI-defined lumbar fat infiltration and functional cross-sectional area in those with chronic low back. BMJ Open Sport Exerc Med 2015;1:1–10.10.1136/bmjsem-2015-000050Search in Google Scholar PubMed PubMed Central
[74] Hides JA, Richardson CA, Jull GA. Multifidus muscle recovery is not automatic after resolution of acute, first-episode low back pain. Spine (Phila Pa 1976) 1996;21:2763–9.10.1097/00007632-199612010-00011Search in Google Scholar PubMed
[75] Nijs J, Meeus M, Cagnie B, Nathalie A, Dolphens M, Van Oosterwijck J, Danneels L. A modern neuroscience approach to chronic spinal pain: combinin neuroscience education with cognition-targeted motor control training. Physical 2014;94:730–8.10.2522/ptj.20130258Search in Google Scholar PubMed
[76] Louw A, Zimney K, O’Hotto C, Hilton S. The clinical application of teaching people about pain. Physiother Theory Pract 2016;32:385–95.10.1080/09593985.2016.1194652Search in Google Scholar PubMed
[77] Malfliet A, Kregel J, Meeus M, Cagnie B, Roussel N, Dolphens M, Danneels L, Nijs J. Applying contemporary neuroscience in exercise interventions for chronic spinal pain: treatment protocol. Brazilian J Phys Ther 2017;21:378–87.10.1016/j.bjpt.2017.06.019Search in Google Scholar PubMed PubMed Central
[78] Hallegraeff JM, Krijnen WP, van der Schans CP, de Greef MHG. Expectations about recovery from acute non-specific low back pain predict absence from usual work due to chronic low back pain: a systematic review. J Physiother 2012;58:165–72.10.1016/S1836-9553(12)70107-8Search in Google Scholar PubMed
[79] Schiphorst Preuper HR, Reneman MF, Boonstra AM, Dijkstra PU, Versteegen GJ, Geertzen JHB, Brouwer S. Relationship between psychological factors and performance-based and self-reported disability in chronic low back pain. Eur Spine J 2008;17:1448–56.10.1007/s00586-008-0772-0Search in Google Scholar PubMed PubMed Central
©2018 Scandinavian Association for the Study of Pain. Published by Walter de Gruyter GmbH, Berlin/Boston. All rights reserved.
Articles in the same Issue
- Frontmatter
- Topical review
- Reducing risk of spinal haematoma from spinal and epidural pain procedures
- Clinical pain research
- A multiple-dose double-blind randomized study to evaluate the safety, pharmacokinetics, pharmacodynamics and analgesic efficacy of the TRPV1 antagonist JNJ-39439335 (mavatrep)
- Reliability of three linguistically and culturally validated pain assessment tools for sedated ICU patients by ICU nurses in Finland
- Superior outcomes following cervical fusion vs. multimodal rehabilitation in a subgroup of randomized Whiplash-Associated-Disorders (WAD) patients indicating somatic pain origin-Comparison of outcome assessments made by four examiners from different disciplines
- Morning cortisol and fasting glucose are elevated in women with chronic widespread pain independent of comorbid restless legs syndrome
- Chronic pain experience and pain management in persons with spinal cord injury in Nepal
- The Standardised Mensendieck Test as a tool for evaluation of movement quality in patients with nonspecific chronic low back pain
- Exploring effect of pain education on chronic pain patients’ expectation of recovery and pain intensity
- Pain, psychological distress and motor pattern in women with provoked vestibulodynia (PVD) – symptom characteristics and therapy suggestions
- Relative and absolute test-retest reliabilities of pressure pain threshold in patients with knee osteoarthritis
- The influence of pre- and perioperative administration of gabapentin on pain 3–4 years after total knee arthroplasty
- Observational study
- CT guided neurolytic blockade of the coeliac plexus in patients with advanced and intractably painful pancreatic cancer
- Prescription of opioids to post-operative orthopaedic patients at time of discharge from hospital: a prospective observational study
- The psychological features of patellofemoral pain: a cross-sectional study
- Prevalence of self-reported musculoskeletal pain symptoms among school-age adolescents: age and sex differences
- The association between back muscle characteristics and pressure pain sensitivity in low back pain patients
- Postural control in subclinical neck pain: a comparative study on the effect of pain and measurement procedures
- Original experimental
- Exercise-induced hypoalgesia in women with varying levels of menstrual pain
- Exercise does not produce hypoalgesia when performed immediately after a painful stimulus
- Effectiveness of neck stabilisation and dynamic exercises on pain intensity, depression and anxiety among patients with non-specific neck pain: a randomised controlled trial