Young’s modulus and Poisson’s ratio of the deformable cement adhesives
-
Jacek Karpiesiuk
 and
Tadeusz Chyzy
and
Tadeusz Chyzy

Abstract
The article outlines the methods, which has designated Young’s Modulus and Poisson’s Ratio of deformable cement adhesives. These indicators are necessary for the strength calculation of the lightweight floor systems (LFS), that do not require screeds with and without heating, using the finite element method. It was noticed that the diagrams of the dependence the stress on deformation in deformable cement adhesives are similar to the model of the ‘Madrid parabola’ used in testing concrete and cement mortar. In order to determine that the theory of ‘Madrid parabola’ is correct, calculations were performed using the least amount of squares approximation method. The data of the experimental studies combined with the formula calculations, allowed the study to achieve a reliable result, together to determine whether the theory of relative approximation is correct or not. All these actions have allowed determining the smallest deformations εc2 in deformable cement adhesives type C2S1 and C2S2 and their compressive strength. Thanks, these two methods (experimental and calculation) the functions describing deformable cement adhesives are defined. They were named S1 and S2 Evola and can be used by designers and producers of floor systems that do not require screeds.
1 Introduction
For several years, the mechanical strength of the lightweight floor system (LFS) without screeds has been tested. The design of this system is a board made of insulating material, most often as the XPS or EPS panels, covered with an adhesive-mesh layer, to which the floor of the artificial stone e.g. ceramic tiles, or natural stone, is directly glued. This type of floor is mounted on rigid substrates like concrete, wood or others, with the possibility of mounting the radiant floor heating. Mechanical endurance tests were preceded by the experiments that determined thermal performance and temperature distributions on the tiled floor. The basic loads of layered, lightweight floor will be exposed to different thermal factors (as a result of weather exposure and that generated by heating systems) and standard normal loads - imposed and self-weighted. Under the influence of these interactions, there are stresses and deformations inside the floor structure. The most important layer in the cross section of a lightweight floor system without screeds is cement mortar, as it must transfer the various types of internal stresses that are derived from external loads, including thermal impacts. To determine them, the authors of the article performed many experiments described in [1] and [2]. To confirm the results of conducted laboratory tests and the impact of possible applications of their various fixings on a durable base, numerical calculations should be made. They should be implemented by using the finite element method (FEM). For this purpose, you need the material strength data of the individual layer components in the LFS. The top of the floor consists of (Figure 1):

Cross section of layers in LFS with a heating coil
ceramic tile floor
cement adhesive mortar reinforced with fiberglass mesh
thermal insulation from the XPS or EPS polystyrene
mounting material for the substrate (adhesive mortar, mechanical fasteners or no fixing on perfectly equal substrates)
PVC steam insulation foil, self-adhesive
rigid substrate (concrete or wood-like)
The material strength indicators to be used for FEM numerical calculations are:
Young’s modulus E
Poisson’s ratio ν
thermal linear expansion coefficient α
Most of the necessary material data can be found in the literature. There were no E, ν and α indicators for deformable cement mortars C2S1 and C2S2. This article describes experimental studies of compressive strength to designate E and ν in the laboratory of the Bialystok University of Technology. These strength indicators were additionally verified using least-squares approximation.
2 Research methodology
After analysing the literature, including a doctoral dissertation [3], in which the uniaxial compression and bending tensile strength tests were conducted on various samples of masonry mortar (cuboid and cylindrical), it was decided to take cylindrical samples of adhesive mortars as those that guarantee the final determination of the material data needed, namely Young’s modulus and Poisson’s coefficient when axial squeezing occurs. For this purpose, samples of each adhesive with a height of 50 mm and an equal diameter of approx. 46 mm were prepared, mixing cement mortars with water in the amounts provided by the producers. Each of the adhesives was arranged in cylindrical PVC forms (Figure 2).

Samples of deformable cement adhesive mortars
After twenty seven days, the samples were removed from the moulds (Figure 3) and four of five samples of each type of adhesives were eventually taken for testing. Axial compression tests were performed on Sika Ceram 255 and C2S2 Basf Flex-mortel cement adhesives samples, which was similar to the sample dimensions in the strength tests for masonry mortar compression according to normative [4], in which a diameter of 8 cm is taken. The smaller size of cement adhesive samples was dictated by the smaller grain size used in the cement adhesive, baring in mind the similar composition of both mortars. According to [5], more than 90% of adhesive mortars components are cement and aggregate.

Adhesive mortar samples of type C2S1 and C2S2 after removing from the moulds, h ≈ 5 cm
Before the compressive strength test, the cement adhesive sample was aligned on a lathe to obtain equal planes. After alignment, the following sample diameters were obtained:
adhesive C2S1 Sika Ceram 255 in [mm]: No 1 – 46.8, No 2 – 47.1, No 3 – 46.7, No 4 – 46.7
adhesive C2S2 Basf Flex-mortel in [mm]:No 1 – 46.85, No 2 – 47.15, No 3 – 46.7, No 4 – 46.7
After this treatment, one sample from each of the cement adhesives was initially compressed without the use of external extensometers. This allowed us to create the correct estimate for compressive stresses, which confirmed the use of the relevant test machines. The following maximum compression force and stress values were obtained:
C2S1 – F = 24.14 kN, σ = 14.04 N/mm2
C2S2 – F = 23.32 kN, σ = 13.53 N/mm2
For the compression strength test of the cement mortars, the dynamic dual-axis (torsional) strength machine MTS 809.10 was used, and it was controlled by MTS Flex-Test 40 controller with an axial load range ± 100 kN (Figure 4).

MTS 809.10 strength machine
After the preliminary tests were conducted, the target studies began, using the two extensometers, fixed for each of the cement adhesive samples transversely and oblongly to the axis. The extensometers were attached to a measuring transducer with the results read out on a computer screen. The longitudinal base of the extensometer was constant and read 37.5 mm. The following extensometer types were used:
oblong Instron 2620, with a measurement accuracy of 0.15% FSD (full deflection scale)
transverse Epsilon 3542050M-025-HT1, with a measurement accuracy of 0.15% FSD
The extensometers attached to the adhesive mortars by rubber O-rings were used to measure transverse and oblong deformations during the compressive strength test of the prepared samples, to determine the Poisson’s ratio of adhesive mortars. The fastening method is shown in Figure 5.

One of the samples of adhesive mortar with the exten-someters for measurement of deformation during the compressive strength test.
3 The research results
It was assumed that cement adhesive mortars are a homogeneous, isotropic material, with elastic properties. It is possible to determine material properties such as Poisson’s ratio ν, Young’s modulus E, Kirchhoff G and others under the action of compressive force. When we determine Young’s modulus according to [6], initial readings are not included in the calculations due to possible small offsets, during the first low load increment. However, individual assessment of the strength characteristics of materials depends not only on their chemical composition but also on the procedure and apparatus used in the tests. The main purpose of the study was to designated the Poisson’s ratio and Young’s modulus of the two cement adhesives tested on the pre-prepared samples described in this paper.
Based on the test results (three samples of C2S1 and C2S2 adhesive were tested), 2-degree polynomial functions by the method of least squares were determined, within the range up to the maximum stress value (Figures 6–7). Then, using the same method, the polynomial functions of these adhesives were determined, taking the arithmetic means of the test results for individual adhesives, for calculations, as shown in Figures 8 and 9. The following names have been adopted: for C2S1 – function S1 and for C2S2 – function S2.

Dependence σ on C2S1 adhesive, three samples under compression

Dependence σ on C2S2 adhesive, three samples under compression
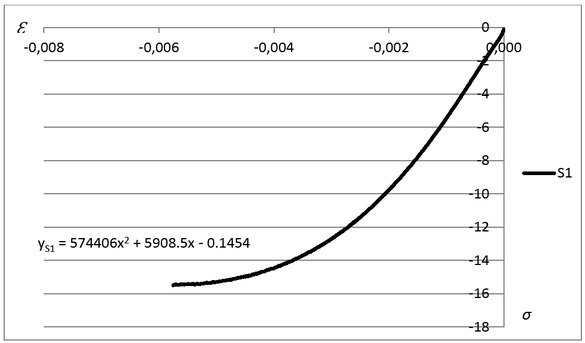
Dependence σ on C2S1 adhesive, as function S1 under compression

Dependence σ on C2S2 adhesive, as function S2 under compression
When it is difficult to determine the relationship between stress and deformation of the rectilinear part of quadratic function, in order to state the value of the potential modulus of longitudinal elasticity E, it is necessary to lead tangent or secant at point x = 0 to the S1 and S2 functions (Figures 8–9).
The tangents at points for x = 0 for functions S1 and S2 are written by the equations:
The right sides of the equations are linear parts of polynomials describing the functions S1 and S2. Due to a low absolute value c = 0.1454, close to zero (relative to the high value of the b factor at x) we assume it as equal to 0. Hence, the Young’s modulus is:
For C2S2 adhesive, due to a low absolute value c = 1.3507, close to zero (relative to the high value of the b factor at x) we assume it as equal to 0. Hence, the Young’s modulus is:
The Poisson’s ratio is the absolute value of the relation of transverse deformation to the corresponding axial deformation resulting from the evenly distributed axial stress below the material proportionality limit. It is described by the formula (1):
ν – Poisson’s ratio
εn – transverse deformation
εm – longitudinal (axial) deformation
The coefficient ν is estimated by the tensile or compression force tests, according to the standard [9] at axial stress. The arithmetic mean’s value of the Poisson coefficient, in the phase of elastic compression stress of cement adhesives for each of the samples, was assumed in calculations to be within the range of linear, when it reaches stable numerical values in a given test sample. Examples of the dependence of stress from the quotient of the ratio transverse to longitudinal deformation ν C2S1 and C2S2 adhesive, in tests with the extensometers, are shown in Figures 10 and 11.
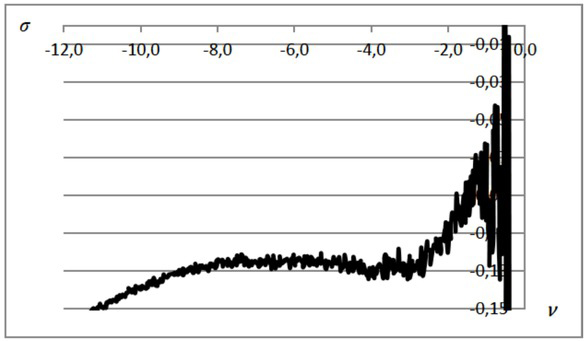
The dependence of the σ stress from the quotient of transverse to longitudinal deformation ν in the cement adhesive C2S1.

The dependence of the σ stress from the quotient of transverse to longitudinal deformation ν in the cement adhesive C2S2.
The results of calculations of maximum stresses, Young’s modulus and the Poisson’ ratio for each type of adhesives are given in Table 1.
Average value of the Young modulus and Poisson factor in the adhesive tested.
| Type of adhesive | No of sample | σmax [MPa] | E [MPa] | Ee [MPa] | νi | νavg |
|---|---|---|---|---|---|---|
| S1_1 | 15.32 | 5894.2 | 0.128 | |||
| C2S1 | S1_2 | 15.72 | 6115.3 | 5900 | 0.135 | 0.13 |
| S1_3 | 15.52 | 5715.9 | 0.126 | |||
| S2_1 | 13.52 | 1909 | 0.153 | |||
| C2S2 | S2_2 | 13.78 | 1998.5 | 1950 | 0.150 | 0.15 |
| S2_3 | 13.89 | 1935.4 | 0.146 |
σmax – maximum stress in compressing
E – Young’s modulus of the sample
EeS1, EeS2 – accepted potential Young’s modulus of C2S1 and C2S2
νi – Poisson’s ratio of the sample
νavgS1, νavgS2 – average accepted Poisson’s ratio of C2S1 i C2S2
4 Analysis of test results
The relationship between stresses and deformations in the tested cement mortars subjected to compression is not a linear function. The shape is similar to the dependence of stress on the deformation of the compressed wall in reality. The dependence of stress on the strain was shown in the article [10] (Figure 1) on the first graph. The other two charts on this drawing show the above-mentioned dependencies calculated according to the standard [11]. Inside, it is possible to take calculations for four various dependencies of stress on deformation, including linear, rectangular, parabolic and parabolic-rectangular dependencies. These four graphs cannot be taken for calculations arbitrarily. It depends on the material used. In the article [10] due to the lack of standard indications [11, 12, 13], and after observations during the testing of masonry structures, it is proposed that the smallest wall deformations corresponding to the compressive strength should be equal to 0.002, i.e. at the same level as in ordinary concretes.
Concerning the tests of the cement adhesive mortars, in the initial compression phase of these samples, the stresses increase with deformations up to the maximum value. Then, as the strain increases, the stress decreases. For this reason, a parabolic graph of cement adhesive functions was used for the calculations. As pointed out in the publication [14], that in the initial phase of adhesive compression there are minimal disturbances (despite earlier alignment of samples for testing), caused by the adjustment of the loading force to the adhesive mortar. These disturbances stopped very quickly, without exceeding the stress level of 0.15 MPa. This is not a significant error amount of approx. 1% at the maximum compressive stress within 14–16 MPa. In this situation, as recommended in [14], it can be moved the vertical axis of stress to the point of intersection of the curve with the axis of deformation and thus start approximating the dependence of σ on ε at point 0.
4.1 Determining the smallest deformation of adhesives using a polynomial approximation with a reduced second-order polynomial
The analysed dependence of σ on ε has a fairly obvious feature for σ = 0 should be ε = 0. In addition, so called in the literature ‘Madrid parabola’, which well characterizes the dependence of σ on ε for concrete, has the form σ = aε2 + bε for n = 2 (10). Therefore, test result sets should be approximated with the polynomial y = ax2 + bx instead of y = ax2 + bx + c. The application of the least-squares method for the function y = ax2 + bx boils down to finding the minimum of the function
where
The value
By substituting to the formulas (2)–(5), the data from tests dependence of deformation to the stress of C2S1 adhesive obtained the following results:
at the arithmetic mean of three samples
for the total set of all three samples results
Finally accepted εc2 = 0.0051 for adhesive C2S1
By substituting to the above formulas the data from tests dependence of deformation to the stress of C2S2 adhesive the following results were obtained:
at the arithmetic mean of three samples
for the total set of all three samples results
Finally accepted εc2 = 0.0126 for adhesive C2S2
Using the ‘Madrid parabola’ to designate the E longitudinal elasticity modulus and parabolic functions of deformable cement adhesives
The formulas (6) and (7) for ‘Madrid parabolas’ is cited in Eurokod 2 [15] (paragraph 3.1.3, Table 3.1)
where:
fc – computational strength of ordinary concrete, e.g. C12/15 ÷ C50/60, compressive strength,
εc – current concrete deformation,
σc – compressive stress in concrete corresponding to the εc, deformation
εc2 – the smallest deformation in concrete for which the stresses achieved are equal to the strength of concrete for compression (for normal concrete εc2 = 0.002),
εcu2 – limiting deformation of concrete (for ordinary concrete εcu2 = 0.0035),
n – exponent (for ordinary concrete equal to 2).
The average arithmetic strength value of the C2S1 adhesive from three samples equal fc = 15.49 ≈ 15.50 MPa was taken from the experimental research (the maximum from the set of all results from the three tests was equal to 15.72 MPa). In the C2S2 adhesive, strength was equal respectively fc = 13.73 ≈ 13.70 MPa, and a maximum of 13.89 MPa. By substituting into formula (11) the data for the strength of the adhesives from the experiment and the smallest deformations εc2 = 0.0051 in C2S1 and εc2 = 0.0126 in C2S2, the functions referred to in section 5 were named S1 Evola and S2 Evola, and were designated by formulas (8) and (9).
These are:
Cement adhesive mortar C2S1
σS1 – compression stress in C2S1, corresponding to the εS1 deformation
εS1 – C2S1 adhesive deformation from the research
Cement adhesive mortar C2S2
σS2 – compression stress in C2S2, corresponding to the εS2 deformation
εS2 – C2S2 adhesive deformation from the research
Verification of the experimental adhesive strength results against experimental data can be performer using a formula (10) for the ‘Madrid parabola’, which have written in monograph [16] as follows:
where:
ε0 – the smallest deformation of the test material corresponding to its strength
ε – strain corresponding to stress σ, wherein
where
It has been noted that the function described in the formula (10) is σ = aε2 + bε, where
Having the values of a and b, determined earlier by means of polynomial approximation, from the formula (12) the values σ0, ε0, were calculated, described by the formula (13):
From the condition (11) it is directly visible that the quantities (13) are related to the modulus of elasticity E.
Taking data a = 587804.9 and b = 6010.2, for C2S1 adhesive and a = 89922.2 and b = 2265.0 for C2S2 adhesive, calculated by the approximation square function in the set of all experimental results, the following strengths of these adhesive mortars were obtained:
The calculated values of the compression strength of the adhesives do not differ significantly (they are within a statistical 5% error) from the arithmetic means given, resulting from experimental tests, which are 15.5 MPa (S1) and 13.7 (S2), respectively.
Knowing the smallest deformations of cement adhesives C2S1 and C2S2 at which they reach their strengths, and using formula (11), their longitudinal elasticity modules E were determined.
ES1 = 6023 MPa, adopted 6000 MPa (for cement adhesive C2S1)
ES2 = 2264 MPa, adopted 2300 MPa (for cement adhesive C2S2)
The graphs of the determined functions S1 Evola and S2 Evola based on formulas (8) and (9), confirmed by calculations, are shown in Figures 12 and 13, compared to the values of the average functions S1 and S2 developed based on the research.

S1 Evola function compared to S1 (from researches)

S2 Evola function compared to S2 (from researches)
Figure 12 shows a greater convergence of function graphs compared to Figure 13. This is due to the fact that a larger error occurred during the testing of C2S2 adhesive, which is determined by the relationships of the coefficients for the functions S1 and S2, including the value of the coefficient c of the square function (in S1 c = 0.1454, and in S2 is 10 times larger, equal to 1.3507).
The average square error of approximation in C2S1 and C2S2
Experiments for measuring the size of ε (deformation) and σ (stress) were performed for two types of adhesives C2S1 and C2S2 in a three-series (three series of test results: S1_1, S1_2, S1_3; S2_1, S2_2, S2_3) and after joining each of the two series independently (S1, S2) into one set of Si points (i = 1, 2). The measure of approximation accuracy, data set (xi, yi)i=1,2,...,n, function f (x) is the relative approximation error given by formulas (14) and (15):
which in relation to the function f (x) = ax2 + bx has the form:
Using the above equations, the following relative error results were obtained for C2S1 and C2S2 adhesives:
C2S1 adhesive mortar
For the C2S1 adhesive mortar, the relative approximation error calculated by the formula (15), without taking into account the initial measurement disturbances resulting from the adjustment of the device to the tested samples in the stress range from 0.8-15.5 MPa, is on average 3.8%, and in the range 0.6-15.5 MPa is on average 4.5%.
C2S2 adhesive mortar
For the C2S2 adhesive mortar, the relative approximation error calculated using formula (15), without taking into account the initial measurement disturbances resulting from the adjustment of the device to the tested samples in the stress range from 0.8–13.7 MPa, is on average 13.4%, and in the range from 0.6–13.7 MPa is on average 14.1%.
A much larger relative approximation error calculated for the series S2_1, S2_2, S2_3 than for the series S1_1, S1_2, S1_3 can be explained by the results of approximation using the function fi(x) = aix2 + bix + ci(i = 1, 2). The approximation results, obtained using the function fi(x), differ significantly in the values of ci. Non-zero values of ci indicate a certain imperfection of approximation, which means that the zero value ε (deformation) corresponds to a non-zero value of σ (stress). The reason for this may be the unstable initial readings of the instruments when the test apparatus corrects slight irregularities of the tested samples, as well as the results from the permissible errors of the test instruments themselves. Another reason may be that the test apparatus does not record measurable deformations when the stresses are small (near zero).
5 Conclusions
There are not exist Young’s modulus E and Poisson’s ratio ν for deformable cement adhesives, type C2S1 and C2S2 in the literature. Compressive strength tests of adhesives cylindrical samples C2S1 and C2S2 allowed to determine these strength indexes. After verification of the results, the elastic modulus E was finally adopted 6000 MPa (C2S1), 2300 MPa (C2S2), and Poisson’s ratio ν was assumed in the C2S1 adhesive equal to 0.13 and the C2S2 adhesive equal to 0.15. These data can be used by producers and designers in calculations of the mechanical strength in the lightweight floor systems (LFS) no required screeds with or without heating by using the Finite Element Method, as well as for all other calculations needed.
In addition, it has been determined that:
The functions defining selected adhesives – S1 Evola characterizes C2S1 cement adhesive and S2 Evola function characterizes C2S2 cement adhesive.
The smallest deformations of the adhesives correspond to their compressive strength after using approximation with a polynomial, the least-squares method, respectively εc2 = 0.0051 (C2S1), εc2 = 0.0126 (C2S2).
The mistakes of the potential modulus E were corrected by determining the tangent equation to the function graph. It was confirmed by comparing the graphs of functions obtained from experimental tests and obtained after applying the ‘Madrid parabola’ formula.
The greater convergence of functions from S1 and computational S1 Evola tests (C2S1 adhesive) concerning to the corresponding functions S2 and S2 Evola (C2S2 adhesive) as indicated by the c coefficients for these functions, has been confirmed by calculating the approximation error, which was about 4% (for C2S1) and approx. 14% (for C2S2).
When we use the cement adhesive mortar with the same designation, but with another manufacturer, Young’s modulus or Poisson’s ratio may differ slightly from those adopted in the article. The cause is that Cement adhesive mortars type C2S1 and C2S2 according to the standard [17] should have transversal deformation in the range of 2.5–5 mm at the designation S1 and ≥ 5 mm for S2. From these ranges of deformability, it can be concluded that adhesive mortar manufacturers can be used to produce different components that can affect strength indicators. The differences in these indicators should not be significant due to the 90% majority share of aggregate and cement in these adhesives.
To confirm that the obtained characteristics of the designated functions and strength indicators are universal and that they apply to all cement deformable adhesives of type C2S1 and C2S2, the authors suggest to perform the same experiments in the future, testing the same type of cement adhesives, but from other manufacturers.
Acknowledgement
The authors of this article would like to thank Prof. Edwin Kozniewski from the Bialystok University of Technology for his math suggestions and the Sika Poland & Basf Poland Companies for providing materials. The research was performed as part of statutory work from the Bialystok University of Technology No. WI/WB-IIL/7/2020, financed from the subsidy provided by the Ministry of Science and Higher Education.
References
[1] Karpiesiuk J, Chyży T. The results of selected strength tests of the adhesive layer of radiant heater with lightweight construction [Polish.]. Budownictwo i Inżynieria Środowiska. 2017;8(4):165–71.Search in Google Scholar
[2] Karpiesiuk J, Chyży T. The interface strength tests of a lightweight floor with a heating coil [Polish.]. Materiały Budowlane. 2018 Aug;552:68–70.Search in Google Scholar
[3] Galman I. Ściany z ceramicznej cegły pełnej cyklicznie ściskane w swej płaszczyźnie lub zginane prostopadle do płaszczyzny [dissertation]. Katedra Konstrukcji Budowlanych, Wydział Budownictwa: Politechnika Śląska Gliwice; 2012. Polish.Search in Google Scholar
[4] Zaprawy budowlane – Badania cech fizycznych i wytrzymałościowych, PN-B-04500 (1971).Search in Google Scholar
[5] Chłądzyński S. Składniki zapraw klejowych do płytek. Część V–Podsumowanie. Izolacje. 2008;7 – 8:66–8. Polish.Search in Google Scholar
[6] Standard Test Method for Young’s Modulus, Tangent Modulus, and Chord Modulus, ASTM E111 – 17.Search in Google Scholar
[7] Bednarski Ł, Sieńko R, Howiacki T. Oszacowanie wartości i zmienności modułu sprężystości betonu w istniejącej konstrukcji na podstawie ciągłych pomiarów in situ. 2014;CWB-6:396-404. Polish.Search in Google Scholar
[8] Próba statyczna rozciągania metali. Katedra wytrzymałości materiałów i konstrukcji: Politechnika Łódzka - Ćwiczenie 1. 2019;1-12. Polish.Search in Google Scholar
[9] Standard Test Method for Poisson’s Ratio at Room Temperature, ASTM E132 – 17.Search in Google Scholar
[10] Jarmontowicz R, Sieczkowski J. Odkształcalność muru pod wpływem obciążeń [Polish.]. Przegląd Budowlany. 2015;7-8:45–8.Search in Google Scholar
[11] Design of Masonry Structures. Part 1-1: General Rules for Reinforced and UnreinforcedMasonry Structures - Eurocode 6, PN-EN 1996-1-1+A1:2013 (2010).Search in Google Scholar
[12] Konstrukcje murowe niezbrojone. Projektowanie i obliczanie, PN-B-03002 (1999).Search in Google Scholar
[13] Konstrukcje murowe. Projektowanie i obliczanie, PN-B-03002 (2007).Search in Google Scholar
[14] Lewicki B, Jarmontowicz R, Kubica J. Podstawy projektowania niezbrojonych konstrukcji murowych. Warszawa: Instytut Techniki Budowlanej; 2001.Search in Google Scholar
[15] Design of concrete structures - part 1-1: General rules and rules for buildings - Eurocode 2, PN-EN 1992-1-1 (2008).Search in Google Scholar
[16] Shah SP, Swartz SE, Barr B. Facture of concrete and rock: Recent Developments. New York: Taylor & Francis; 2007.Search in Google Scholar
[17] Adhesives for tiles – Requirements, evaluation of conformity, classyfication and designation, PN-EN 12004+A1 (2012).Search in Google Scholar
© 2020 J. Karpiesiuk and T. Chyzy, published by De Gruyter
This work is licensed under the Creative Commons Attribution 4.0 International License.
Articles in the same Issue
- Regular Articles
- Microstructure and compressive behavior of lamellar Al2O3p/Al composite prepared by freeze-drying and mechanical-pressure infiltration method
- Al3Ti/ADC12 Composite Synthesized by Ultrasonic Chemistry in Situ Reaction
- Microstructure and photocatalytic performance of micro arc oxidation coatings after heat treatment
- The effect of carbon nanotubes on the mechanical and damping properties of macro-defect-free cements
- Toughening Mechanism of the Bone — Enlightenment from the Microstructure of Goat Tibia
- Characterization of PVC/MWCNTs Nanocomposite: Solvent Blend
- Study on Macroscopic and Mesoscopic Mechanical Behavior of CSG based on Inversion of Mesoscopic Material Parameters
- Bearing properties and influence laws of concrete-filled steel tubular arches for underground mining roadway support
- Comparing Test Methods for the Intra-ply Shear Properties of Uncured Prepreg Tapes
- Investigation of Microstructural, Mechanical and Corrosion Properties of AA7010-TiB2 in-situ Metal Matrix Composite
- A Comparative Study of Structural Changes in Conventional and Unconventional Machining and Mechanical Properties Evaluation of Polypropylene Based Self Reinforced Composites
- Research on Influence mechanism of composite interlaminar shear strength under normal stress
- Mechanical properties of geopolymer foam at high temperature
- Synthesis and mechanical properties of nano-Sb2O3/BPS-PP composites
- Multiscale acoustic emission of C/SiC mini-composites and damage identification using pattern recognition
- Modifying mechanical properties of Shanghai clayey soil with construction waste and pulverized lime
- Relationship between Al2O3 Content and Wear Behavior of Al+2% Graphite Matrix Composites
- Static mechanical properties and mechanism of C200 ultra-high performance concrete (UHPC) containing coarse aggregates
- A Parametric Study on the Elliptical hole Effects of Laminate Composite Plates under Thermal Buckling Load
- Morphology and crystallization kinetics of Rubber-modified Nylon 6 Prepared by Anionic In-situ Polymerization
- Effects of Elliptical Hole on the Correlation of Natural Frequency with Buckling Load of Basalt Laminates Composite Plates
- Effect of interphase parameters on elastic modulus prediction for cellulose nanocrystal fiber reinforced polymer composite
- Mixed Matrix Membranes prepared from polysulfone and Linde Type A zeolite
- Fabrication and low-velocity impact response of pyramidal lattice stitched foam sandwich composites
- Design and static testing of wing structure of a composite four-seater electric aircraft
- CSG Elastic Modulus Model Prediction Considering Meso-components and its Effect
- Optimization of spinning parameters of 20/316L bimetal composite tube based on orthogonal test
- Chloride-induced corrosion behavior of reinforced cement mortar with MWCNTs
- Statistical Law and Predictive Analysis of Compressive Strength of Cemented Sand and Gravel
- Young’s modulus and Poisson’s ratio of the deformable cement adhesives
- Reverse localization on composite laminates using attenuated strain wave
- Impact of reinforcement on shrinkage in the concrete floors of a residential building
- Novel multi-zone self-heated composites tool for out-of-autoclave aerospace components manufacturing
- Effect of notch on static and fatigue properties of T800 fabric reinforced composites
- Electrochemical Discharge Grinding of Metal Matrix Composites Using Shaped Abrasive Tools Formed by Sintered Bronze/diamond
- Fabrication and performance of PNN-PZT piezoelectric ceramics obtained by low-temperature sintering
- The extension of thixotropy of cement paste under vibration: a shear-vibration equivalent theory
- Conventional and unconventional materials used in the production of brake pads – review
- Inverse Analysis of Concrete Meso-constitutive Model Parameters Considering Aggregate Size Effect
- Finite element model of laminate construction element with multi-phase microstructure
- Effect of Cooling Rate and Austenite Deformation on Hardness and Microstructure of 960MPa High Strength Steel
- Study on microcrystalline cellulose/chitosan blend foam gel material
- Investigating the influence of multi-walled carbon nanotubes on the mechanical and damping properties of ultra-high performance concrete
- Preparation and properties of metal textured polypropylene composites with low odor and low VOC
- Calculation Model for the Mixing Amount of Internal Curing Materials in High-strength Concrete based on Modified MULTIMOORA
- Electric degradation in PZT piezoelectric ceramics under a DC bias
- Cushioning energy absorption of regular polygonal paper corrugation tubes under axial drop impact
- Erratum
- Study on Macroscopic and Mesoscopic Mechanical Behavior of CSG based on Inversion of Mesoscopic Material Parameters
- Effect of interphase parameters on elastic modulus prediction for cellulose nanocrystal fiber reinforced polymer composite
- Statistical Law and Predictive Analysis of Compressive Strength of Cemented Sand and Gravel
- Retraction
- Assessment of nano-TiO2 and class F fly ash effects on flexural fracture and microstructure of binary blended concrete