Effect of chemical treatment on thermal properties of hair fiber-based reinforcement of HF/HDPE composites
-
Prashant Srivastava


Abstract
The present study deals with the effects of fiber loading and alkali treatment (AT) on thermal behavior of a hair fiber (HF)-reinforced high-density polyethylene (HDPE) composite. The HF/HDPE-reinforced polymer composite has been prepared through a compression molding technique, which provided optimum thermal stability at 15 wt% of the fiber in the reinforced composite. The thermal stability of the composite has been investigated using a thermal analyzer [thermogravimetric analysis (TGA), derivative thermogravimetric analysis (DTG) and differential scanning calorimetry (DSC)]. The ATs of HF-reinforced composites have affected the thermal stability of the material, in which the observed optimum thermal stability is 0.25 N AT 15% HF/HDPE-reinforced composites. Fourier transform infrared (FTIR) spectroscopy, scanning electron microscopy (SEM) and tensile test played an important role in the study of the thermal stability of the material. FTIR analysis was used to investigate the chemical groups between the fiber and matrix. The morphology of the fiber is beneficial for the study of the surface treatment effect on the HF. The tensile test examined the optimum strength at 0.25 N AT 15% HF/HDPE composite, and a good relationship between the thermal and mechanical properties was also observed.
1 Introduction
In recent years, rapid growth has taken place in the development of natural fiber-based reinforced polymer composites. Natural fibers are replacing the utilization of glass and other synthetic materials for the development of new reinforced polymer composites, as they have unique properties, are eco friendly and have favorable cost of processing [1]. Hair fiber (HF) is found in waste streams, and it has unique properties. So, we used it for the development of HF-based reinforced polymer composites. Excellent mechanical properties, low moisture absorption, chemical and corrosion resistance properties make it useful for applications in products such as furniture, architectural materials and more recently, in the automotive industry [2]. Keratin (protein) is a major constituent of the HF, which is 65%–95% of proteins, and the other constituents are water and lipid pigment, etc. Cuticle, cortex and medulla are the other three parts of the HF. Usually, the hair diameter ranges between 50 and 80 μm, the density is around 1.32 g/cm3, tensile strength is 150–350 MPa, and elongation at break is approximately 216.9% [3]. Surface modification forms the additional reactive sites on the surface, which improves the bonding strength and thermal stability of composite materials [4], [5], [6], [7]. Wielage et al. [8] observed the thermogravimetric analysis (TGA) and differential scanning calorimetry (DSC) study of flax-hemp base polypropylene-reinforced composites. Araujo et al. [9] studied the effect of a coupling agent on the thermal properties of curaua/high-density polyethylene (HDPE) composites. Khan and Alam [10] investigated the effect of the different chemical treatments (NaCl, NaOH and acrylamide monomer) on the thermal characterization of the coconut husk fiber. Blanco et al. [11] observed the thermal kinetics of polystyrene (PS) and polyhedral oligomeric silsesquioxane (POSS) nanocomposites with 3%, 5% and 10% fiber loading in composites. Bianchi et al. [12] prepared the nanocomposites of POSS/PS and also studied the thermal kinetics. Mittal and Sinha [13] investigated the surface treatments of fibers that affect the thermal study [TGA, derivative thermogravimetric analysis (DTG) and DSC] of bagasse fiber/epoxy composites. Prasad et al. [14] prepared a banana fiber-based low-density polyethylene composite and investigated the effect of the coupling agent and chemical technology on the different properties [X-ray diffraction (XRD), TGA, Fourier transform infrared (FTIR) spectroscopy, scanning election microscopy (SEM), mechanical strength and water absorption]. Srivastava and Sinha [15] developed the alkali-treated HF/HDPE-reinforced polymer composites. The mechanical and water absorption behaviors of these composites have been studied. Pal [16] observed the nanocomposite of halloysite nanotubes (HNT) and poly methyl methacrylate (PMMA). The different mechanical and dynamic behaviors of the nanocomposites have been studied and compared with carbon nanotube (CNT)-carbon nanofiber (CNF)-reinforced polymer nanocomposites. Granda et al. [17] have studied the thermal properties of Leucaena-based polypropylene-reinforced composites.
Numerous researchers have developed reinforced composites and improved the thermal stability of the composites with the help of fiber treatment. In the present study, the authors used HF with HDPE for the development of HF/HDPE-reinforced composites and studied the effect of surface modification on the thermal properties (TGA, DTG and DSC) of HF/HDPE composites with various fiber loadings (0 wt%, 5 wt%, 15 wt% and 25 wt%).
2 Materials and characterization
2.1 Materials and specimen preparation
In this study, all raw materials were procured from India. HDPE and HF were purchased from Rapid Coat Powder Coatings Pvt. Ltd. (Ghaziabad, India) and a local barber shop from Roorkee (India), respectively. We utilized waste HF directly as a natural fiber for our research. Preliminary, HF was washed with hot water to remove oil and other suspended particles. HF was washed with ethanol to remove the organic components and again washed with distilled water to remove the alcohol content. After that, the fiber was dried in a hot air oven for 24 h to remove the moisture content. Three types of fibers were used for sample preparation. Untreated fiber was used for sample preparation directly, but treated fibers were used after alkali treatment (0.25 N and 0.5 N NaOH) at 50°C for 1 h [6], [15]. The hot compression molding technique was used for the preparation of HF/HDPE-reinforced composites. The fibers were cut into pieces within the range of 5 to 10 mm length and mixed with matrix (HDPE) in a predetermined ratio (5%, 15% and 25%). The composite was mixed uniformly with a stirrer, and the sample was fed into the molding machine. The temperature of the machine was raised to 180°C and then switched off. The prepared composite was cooled in air, and 4-mm-thick sheets were prepared as per ASTM standards. The same phenomena were applied for all predetermined various fiber samples [13], [14], [15].
2.2 Characterization
2.2.1 Fourier transformation infrared spectroscopy (FTIR)
An FTIR spectrometer (Nicolet 6700 series, Thermo Electron corporation, Nottingham, UK & OMNIC Specta software) was used to examine the spectrum analysis of untreated and treated composites. Potassium bromide (KBr) was used to develop the pellets of samples as a reference substance. For our study, the spectrum resolution of 4 cm−1 was used for the analysis of samples within the range of 4000–600 cm−1 [13], [14], [15].
2.2.2 Scanning electron microscopy (SEM) analysis
The morphological study of untreated and alkali-treated HFs was examined using a scanning electron microscope (LEO-435VP, LEO Electron microscopy Ltd., USA & LEO system software) with an acceleration voltage of 0–30 kV. A thin layer coating of gold was used for the SEM analysis of the fiber surfaces [12], [13], [14].
2.2.3 Thermal properties test
The thermal behavior of the HF and HF/HDPE composites was observed via an EXSTAR TG/DTA 6300 (RT instruments Inc., Woodland, CA, USA & Seiko software). TGA, DTG and DSC analysis of the composites were done with a constant heating rate (10°C/min) from ambient temperature to 800°C in the presence of nitrogen atmosphere (flow rate=200 ml/min). The thermal degradation of the composite was shown in percentage for polymer composites [10], [11], [12], [13], [14].
2.2.4 Tensile mechanical test
The tensile test of the fiber and composites were investigated using the universal testing machine (INSTRON, 5500R; 5982, Instron engineering corporation, MA, USA & Bluehills software) as per ASTM D3822-07 and ASTM D3039 standards, respectively. During the tensile study, a cross head speed was maintained 2 mm/min for different gauge lengths (10–40 mm for fiber; 150 mm for composite). The gauge length and recursion test provide accurate results [12], [13], [14], [15].
3 Results and discussion
3.1 FTIR analysis of reinforced HF composites
FTIR spectra of untreated and treated HFs are shown in Figure 1. The FTIR spectrums of the fibers were affected by the alkali treatment (0.25 N and 0.50 N). In the FTIR spectrum, a broad peak of untreated fiber composite at 3438 cm−1 was observed, which corresponds to the O-H stretching vibration and a free hydroxyl group. This peak was reduced after using the 0.25-N alkali treatment of HF at 3424 cm−1 due to the removal of O-H stretching vibration and free hydroxyl group. Another two broad peaks were observed in all three types of fibers within the range of 2850–2929 cm−1, which represents the C-H stretching vibrations. One more peak of all three types of fiber composites occurred at around 1169 cm−1, and C-O stretching vibration and C-H wag (-CH2X) group were observed, which had shifted (1160 cm−1) after the 0.25-N alkali treatment. A common peak for all the composites were observed at 1363 cm−1 and 720 cm−1, which were shown at the C-H rock group and the C-Cl stretching vibration group, respectively [6], [7], [15].

FTIR spectra of the untreated and AT composites.
3.2 Scanning electron microscopy (SEM) analysis of reinforced hair fiber composites
The morphology of the untreated, 0.25 N alkali treatment (AT) and 0.5 N AT HFs is shown in Figure 2A–C, respectively. In the SEM analysis, it was observed that the surface of the untreated fiber was smooth due to the presence of amino acids and impurities were shown in Figure 2A. Impurities were also found on the surface of the fibers, which reduced the interlocking between the fiber and the matrix. The alkali-treated HF (0.25 N AT and 0.5 N AT HF) surfaces were shown in Figure 2B and C. The surface of the fiber was more porous and rough, formed the pits on fiber surface up to a certain limit of AT at 0.25 N, which was useful for good interlocking between the fiber and the polymer. Due to further treatment (0.5 N alkali), the fractures were formed on the fiber surface, which reduced the strength of the fiber [6], [7], [15].

Morphology of the untreated, 0.25 N alkali treatment (AT and 0.5 N AT HFs).
(A) SEM micrographs of untreated HF. (B) SEM micrographs of 0.25-N AT HF. (C) SEM micrographs of 0.5-N AT HF.
3.3 Thermal properties of reinforced hair fiber composites
A TGA and DTG analyzer was used for the thermal study of untreated, treated HF and their reinforced composites. The DSC study of fibers and HDPE resins was also done for the observation of the amount of heat absorbed or released during such transitions.
3.3.1 TGA analysis
The TGA thermograms of the HDPE resin, untreated HF (UTHF), alkali-treated HF (ATHF), untreated HF/HDPE composite, and treated HF/HDPE composites are shown in Figures 3–6. There are three different zones of degradation. Small and high weight losses are observed due to the removal of moisture and degradation of samples in primary and middle zones. In the last zone, very slow degradation is observed in the presence of residue in the samples. The onset temperature (To), the final degradation temperature (Tf) and corresponding weight loss (wt% loss 1 and wt% loss 2) of the respective samples are presented in the Table 1. Weight percent losses (W1% and W2%) are estimated in the primary zone and middle zone, respectively.

TGA thermograms of HDPE, untreated and treated HF.

TGA thermograms of untreated and treated 5% HF/HDPE composites.

TGA thermograms of untreated and treated 15% HF/HDPE composites.
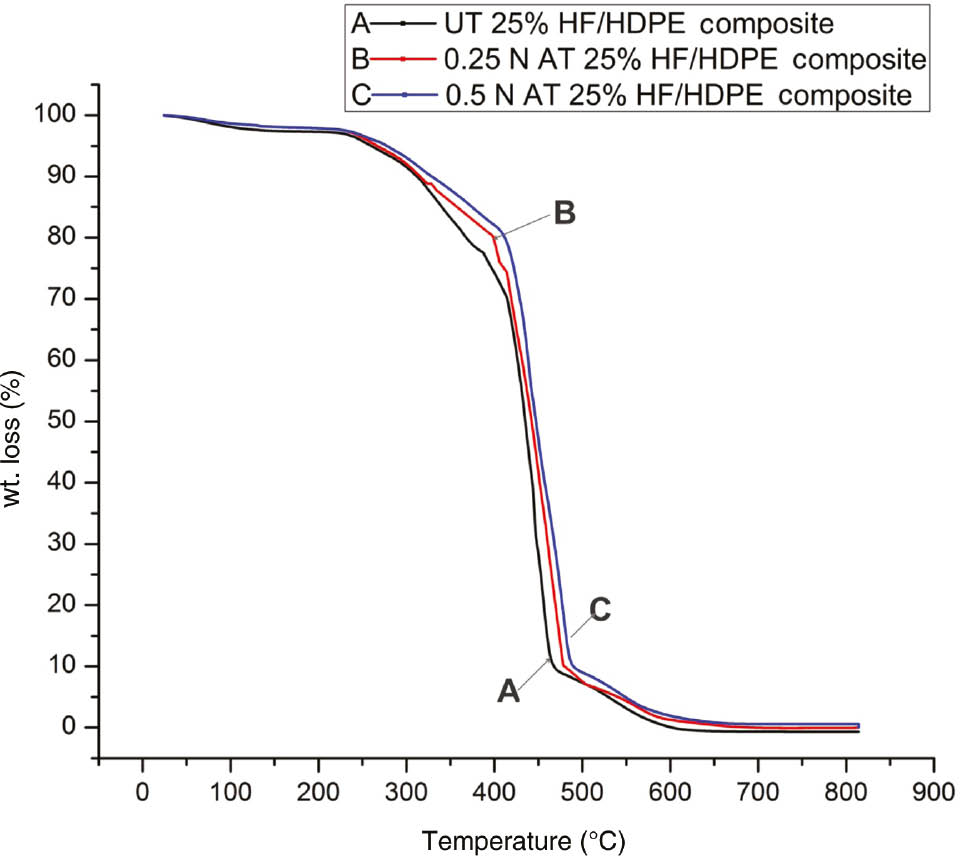
TGA thermograms of untreated and treated 25% HF/HDPE composites.
Degradation temperature obtained from TGA thermograms.
| Samples | Wt.% loss (W1%) | Temp To (°C) | Temp. range (°C) | Wt.% loss (W2%) | Temp Tf (°C) | Residue left% |
|---|---|---|---|---|---|---|
| HDPE | 5.8 | 330 | 330–495 | 93.437 | 495 | 0.763 |
| HF | ||||||
| Untreated | 10.9 | 220 | 220–670 | 87.45 | 670 | 1.65 |
| 0.25-N AT | 11.5 | 223 | 222–673 | 86.74 | 673 | 1.76 |
| 0.50-N AT | 11.3 | 221 | 210–665 | 86.99 | 665 | 1.71 |
| 5% HF/HDPE composite | ||||||
| Untreated | 1.03 | 340 | 340–565 | 98.745 | 565 | 0.225 |
| 0.25-N AT | 0.21 | 344 | 343–567 | 99.262 | 567 | 0.528 |
| 0.50-N AT | 0.65 | 342 | 341–566 | 99.073 | 566 | 0.277 |
| 15% HF/HDPE composite | ||||||
| Untreated | 1.9 | 360 | 360–586 | 96.95 | 586 | 1.15 |
| 0.25-N AT | 0.67 | 367 | 363–589 | 97.48 | 589 | 1.85 |
| 0.50-N AT | 1.17 | 362 | 361–587 | 97.22 | 587 | 1.61 |
| 25% HF/HDPE composite | ||||||
| Untreated | 1.93 | 355 | 355–602 | 96.99 | 602 | 1.08 |
| 0.25-N AT | 1.37 | 353 | 358–615 | 96.94 | 615 | 1.69 |
| 0.50-N AT | 1.61 | 351 | 356–610 | 96.91 | 610 | 1.48 |
The TGA behaviors of HDPE resin and HF are shown in Figure 3. Curves A, B, C and D depict the degradation pattern of HDPE resin, untreated (UN), 0.25-N and 0.5-N alkali-treated (AT) HF, respectively. At the temperature range from ambient to 100°C, a small amount of weight loss was observed due to removal of moisture contents. The degradation strength of HFs were a bit improved after applying the surface treatment of HFs. In the middle zone, rapid degradation was observed due to cleavage of the chemical bonding of material samples. Maximum weight loss of HDPE resin was found at the temperature range 330–495°C. However, weight losses of HFs were observed within the temperature range of 220–673°C, which improved the thermal stability using surface treatments of the fibers as shown in Table 1. Residue was found in the last zone due to the presence of non-volatile matters (fly ash and other contents).
Curves A, B, and C shows the TGA thermograms of the untreated, 0.25-N and 0.5-N alkali-treated 5% HF-/HDPE-reinforced composites shown in Figure 4. Small weight loss% was observed in the initial zone, which appeared due to the presence of fiber contents in the reinforced composite. Huge weight loss was found in the middle zone, 340–589°C and also reduced the material contents up to 99.262% weight loss. A small amount of residue was left after the final zone degradation. The 0.25-N AT improved the degradation stability of composite, which is shown in Table 1.
The TGA thermograms of the untreated, 0.25-N and 0.5-N alkali-treated 15% HF-/HDPE-reinforced composites are shown in Figure 5 (curves A, B and C; respectively). In the primary zone, a small amount of weight loss appeared due to fiber contents in the composite. Maximum weight loss was observed in the middle zone of the temperature range 360–589°C and up to 97.48% weight reduced due to breakage of chemical bonding. Up to 1.85% of residue was found after the final zone degradation of composite at a temperature of 589°C. The thermal strength of the HF-/HDPE-reinforced composite improved the degradation temperature after applying the 0.25-N AT on the fibers, which are shown in Table 1.
The TGA thermograms of the untreated, 0.25-N and 0.5-N alkali-treated 25% HF-/HDPE-reinforced composites are shown in Figure 6 (curves A, B and C; respectively). The thermal degradation pattern was almost similar as in the previous tested reinforced composite, and the thermal stability of the 25% HF-/HDPE-reinforced composite was reduced after increasing the fiber loading. The 0.25-N AT enhanced the degradation temperature of the composite, which is shown in Table 1.
Thus, the surface modification of the fibers played an important role to enhance the thermal stability of the composite, which showed the similar pattern as tensile strength. The 0.25-N alkali-treated 15% HF-/HDPE-reinforced composite was observed to have superior stability during the TGA study.
3.3.2 DTG analysis
The DTG thermograms of the HDPE resin, UTHF, ATHF, untreated HF/HDPE composites, and treated HF/HDPE composites are shown in Figures 7–10.

DTG thermograms of HDPE, UT HF, 0.25-N AT HF and 0.5-N AT HF.

DTG thermograms of untreated and treated 5% HF/HDPE composites.

DTG thermograms of untreated and treated 15% HF/HDPE composites.
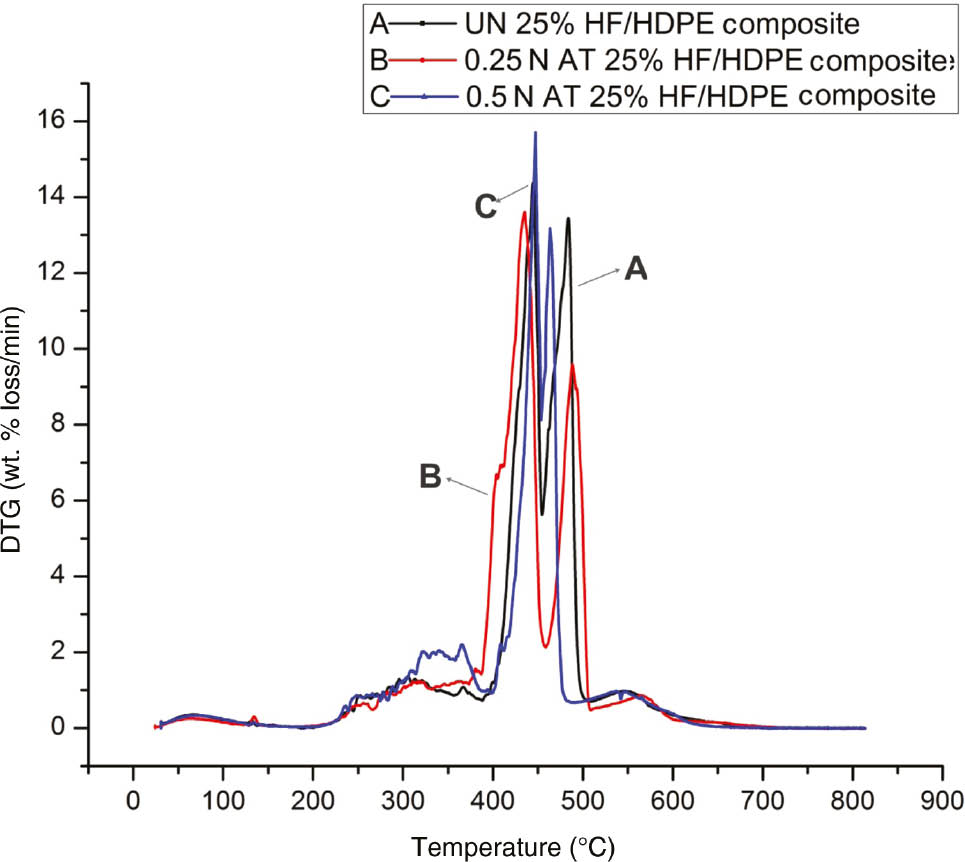
DTG thermograms of untreated and treated 25% HF/HDPE composites.
The DTG thermograms of the HDPE, UTHF, 0.25-N AT HF, and 0.5-N AT HF are shown in Figure 7 (curves A, B, C and D, respectively). Curve A has a DTG thermogram pattern of the HDPE resin within the range of 240–538°C. The large peak was examined with a high rate of weight% loss (16.06 wt.% loss/min) at 454°C, and degradation of the composite was almost constant at 538°C. The degradation of untreated HF was observed in three rates within the range of 30.4–687°C. In a specific temperature range, degradation rates of untreated HF were found with 1.25, 3.57 and 3.09 wt.% loss/min at temperatures of 69.5°C, 275°C and 643°C, respectively. Similar degradation rates were observed for 0.25-N AT HF and 0.5-N AT HF. Degradation rates of 0.25-N AT HF was examined with 1.38, 4.16 and 5.56 wt.% loss/min at temperatures of 70.5°C, 320°C and 590°C, respectively. Weight loss rates (1.38, 4.8 and 2.99 wt.% loss/min) were observed at 70.1°C, 306°C and 535°C, respectively, for 0.5-N AT HF. The degradation temperature range was affected after applying ATs of HF. The DTG behavior was improved after the 0.25-N AT and 0.5-N AT damaged the surface of the HF, which is shown in the SEM results.
The DTG thermograms of the UT, 0.25-N AT, and 0.5-N AT with 5% HF/HDPE composites are shown in Figure 8 (curves A, B and C, respectively). The two major peaks were observed during the DTG study of the untreated and alkali-treated 5% HF/HDPE composites within the temperature range of 218–619°C. In curve A, degradation rates (20.16 and 15.77 wt.% loss/min) were examined at 446.1°C and 485°C. Similar thermograms were observed for the study of 0.25-N AT and 0.5-N AT with 5% HF/HDPE composites. In curve B, degradation rates of 16.85 and 17.54 wt.% loss/min were obtained at 446°C and 477°C, respectively. The degradation rates of 19.79 and 15.7 wt.% loss/min were observed in curve C at 466.9°C and 473°C, respectively. According to the above DTG thermograms, in the 0.25-N alkali-treated composite, optimum thermal stability was observed compared to the 0.5-N alkali-treated and untreated composites.
The DTG thermograms of the UT, 0.25-N AT and 0.5-N AT with 15% HF/HDPE composites are shown in Figure 9 (curves A, B and C, respectively). The major two peaks were obtained during the DTG study of the untreated and alkali-treated 15% HF/HDPE composites at the temperature range of 231–608°C. The 15% HF/HDPE composites were found to be more stable compared to the 5% HF/HDPE composites due to optimum interlocking between the fiber and the matrix. In curve A, the degradation rates of 19.8 and 15.67 wt.% loss/min were observed at 446.3°C and 487°C, respectively. The 0.25-N AT 15% HF/HDPE composite (curve B) had weight reduction rates of 16.9 and 9.75 wt.% loss/min at 467.6°C and 473°C, respectively. A similar thermogram was found for the 0.5-N AT 15% HF/HDPE composite in curve C, which was observed to have more reduction rates of 20.8 and 17.5 wt.% loss/min at 467.6°C and 478°C, respectively. The degradation rate of the 0.25-N AT 15% HF/HDPE composite showed the optimum thermal stability.
The DTG thermograms of the UT, 0.25-N AT and 0.5-N AT with 25% HF/HDPE composites are shown in Figure 10 (curves A, B and C, respectively). The two major peaks were observed during the DTG study of the untreated and alkali-treated 25% HF/HDPE composites within the temperature range of 222–632°C. In curve A, the degradation rates of 15.62 and 12.98 wt% loss/min were obtained at 446.3°C and 464°C, respectively. The 0.25-N AT 25% HF/HDPE composite (curve B) showed the weight reduction rates of 13.77 and 9.73 wt.% loss/min at 434.1°C and 489°C, respectively. A similar thermogram was found for the 0.5-N AT 25% HF/HDPE composites in curve C, which showed the reduction rates of 14.1 and 13.22 wt% loss/min at 446.3°C and 484°C, respectively. The degradation rate of the 0.25-N AT 25% HF/HDPE composite has the optimum thermal stability compared to other (UT and 0.5-N AT) composites. The higher rate of weight reduction was observed at 436.3°C for the untreated 25% HF/HDPE composite and 443.1°C for the 0.25-N AT 25% HF/HDPE composite, which showed the improvement in the thermal stability of the 0.25-N AT 25% HF/HDPE composite.
Thus, it has been observed that the thermal stability (DTG analysis) of the HF-/HDPE-reinforced composite was improved by AT. The 0.25-N alkali-treated HF-/HDPE-reinforced composite has been investigated for its optimum thermal stability with 15% fiber loading, which provided similar results as a tensile test.
3.3.3 DTA/DSC analysis
The observations of the DTA thermograms of the HDPE, UT, 0.25-N AT and 0.5-N AT HF are shown in Figure 11 (curves A, B, C and D, respectively). The DTA thermograms of the respective samples showed distinct endothermic and exothermic peaks, which absorb and release heat from the surroundings. The nature of the peaks and the relative ΔH value of the samples are observed from the DTA thermograms, which are shown in Table 2. The DTA thermogram of the HDPE was investigated from curve A, and one endothermic and three exothermic natures of the reactions were observed. This endothermicity of the reaction was obtained in the beginning of the reaction and further reaction approached to exothermicity due to releasing of heat in surrounding. One endothermic and one exothermic nature of the sample were observed during the study of the DTA thermogram of the UN HF. After applying ATs on HFs, fiber has lost their original structure and converted into the zones of short microfibril. These short microfibrils may have some influence in shifting the peaks. The second exothermic peak of 0.25-N AT HF was observed at temperature 606°C, which was a higher value of ΔH as compared to other HF peaks. Thus, the 0.25-N AT HF provided a better thermal stability.

DTA thermograms of HDPE, UT, 0.25-N AT and 0.5-N AT HF.
DSC thermograms of different samples.
| Samples | Peak temp. (°C) | Nature of peak | ΔH (mJ/mg) |
|---|---|---|---|
| HDPE | 127 | Endothermic | 87.4678 |
| 265 | Exothermic | −83.7002 | |
| 382 | Exothermic | −2981.8481 | |
| 528 | Exothermic | −9111.1003 | |
| UN HF | 246 | Endothermic | 128.91095 |
| 650 | Exothermic | −8807.0972 | |
| 0.25-N AT HF | 290 | Exothermic | −117.5661 |
| 606 | Exothermic | −9320.8741 | |
| 0.5-N AT HF | 285 | Exothermic | −72.1521 |
| 554 | Exothermic | −7911.1681 |
3.4 Tensile mechanical test
Tensile results (tensile strength and tensile modulus) of UT, 0.25-N AT, and 0.50-N AT HFs and composites are shown in Table 3. Tensile strength of untreated HF was examined to be 175.442 MPa, which was raised up to 179.105 MPa after applying the 0.25-N AT. Further treatment (0.50-N AT) reduced the strength and damaged the fiber surface, which are shown in the SEM results. The experimental results showed that the tensile properties of the untreated and treated samples increased with increasing fiber loading from 0 to 15 wt%, and beyond 15 wt% of fiber loading, tensile properties were substantially decreased [15]. The value of the tensile strength was 19.02% less than the virgin HDPE matrix, but the tensile modulus was observed to be 29.7%, which was more than that of the virgin HDPE matrix. The tensile behavior of the composite was affected after applying ATs. The values of the tensile strength (1.67%) and modulus (2.42%) were more compared to those of the UT 15% HF/HDPE composite. The 0.25-N AT formed pits and roughness over the fiber surface, which improved the adhesion between the fiber and the matrix, and the superior strength of the reinforced composites was also achieved. The chemical treatment was found to be a superior technique of fiber modification, which increased the surface roughness of the fiber due to the hydrophilic characteristic [2].
Tensile test of HF and HF/HDPE composite.
| Samples | Mean±SD | |
|---|---|---|
| Tensile strength (MPa) | Tensile modulus (MPa) | |
| HDPE | 18.805±1.2 | 802.921±41.2 |
| HF | ||
| Untreated | 175.442±11.3 | 2816.667±121.5 |
| 0.25-N AT | 179.105±11.6 | 2970.112±131.2 |
| 0.50-N AT | 172.142±11.0 | 2746.167±120.8 |
| 5% HF/HDPE composite | ||
| Untreated | 12.293±0.8 | 959.115±45.2 |
| 0.25-N AT | 12.799±0.8 | 986.577±46.1 |
| 0.50-N AT | 11.199±0.7 | 914.892±44.2 |
| 15% HF/HDPE composite | ||
| Untreated | 15.229±0.9 | 1142.150±51.9 |
| 0.25-N AT | 15.487±0.9 | 1170.458±52.0 |
| 0.50-N AT | 14.742±0.8 | 1106.443±48.2 |
| 25% HF/HDPE composite | ||
| Untreated | 11.637±0.7 | 1037.318±42.1 |
| 0.25-N AT | 12.167±0.7 | 1062.482±43.2 |
| 0.50-N AT | 11.429±0.6 | 980.302±41.2 |
4 Conclusions
The effect of fiber loading and surface modification on the thermal properties of HF-/HDPE- reinforced composites has been investigated. The thermal properties (TGA, DTG and DSC) were improved by applying the surface modification of fibers with 0.25-N AT. By applying further treatments (0.5-N AT) on the HF, the properties of the fiber were reduced due to the fracture of the fiber surface, which was shown in the SEM results. The degradation of the 0.25-N AT 15% HF-/HDPE-reinforced composite had observed optimum results compared to the untreated and another level of AT-reinforced composites. These results are shown in Tables 1 and 2. It was observed that there was a shifting of the exothermic peaks toward a higher temperature of the 0.25-N treated fiber compared to the untreated and another level of AT fiber in DTA thermograms. The SEM morphology easily verified the effect of chemical treatment on the fibers. This treatment of fibers is useful for the study of bonding between the fiber and the matrix. The tensile mechanical test investigated the fiber and composite strengths, which were affected by applying ATs. The 0.25-N AT 15% HF-/HDPE-reinforced composite has achieved superior strength and modulus, which is useful for the study of thermal stability. The above characterization of the HF-/HDPE-reinforced composites is useful for the development of a stable reinforced composite.
Acknowledgments
This study is supported by the Indian Institute of Technology Roorkee (INDIA) and Ministry of Human Resources and Development (MHRD), INDIA.
References
[1] Gupta A. J. Waste Manag. 2014, Article ID 498018. http://dx.doi.org/10.1155/2014/498018.10.1155/2014/498018Search in Google Scholar
[2] Robbins CR. Chemical and Physical Behavior of Human Hair, 5th ed., Springer: Berlin, 2012, p. 537.10.1007/978-3-642-25611-0Search in Google Scholar
[3] Velasco MVR, Dias TCS, Freitas AZ, Junior NDV, Pinto CASO, Kaneko TM, Baby AR. Braz. J. Pharm. Sci. 2009, 45, 153–162.10.1590/S1984-82502009000100019Search in Google Scholar
[4] Faruka O, Bledzkia AK, Fink HP, Sain M. Prog. Polym. Sci. 2012, 37, 1552–1596.10.1016/j.progpolymsci.2012.04.003Search in Google Scholar
[5] Da Gama RM, Balogh TS, Franca S, Sa Dias TC, Bedin V, Baby AR, Matos JDR, Velasco MVR. J. Therm. Anal. Calorim. 2011, 106, 399. doi:10.1007/s10973-011-1463-3.Search in Google Scholar
[6] Zheng L, Jones FR, Liu Y, Jiang B. Int. J. Adhes. Adhes. 2014, 48, 14–19.10.1016/j.ijadhadh.2013.09.004Search in Google Scholar
[7] Oladele IO, Olajide JL, Ogunbadejo AS. Am. J. Eng. Res. 2015, 4, 19–26.Search in Google Scholar
[8] Wielage B, Lampke Th, Marx G, Nestler K, Starke D. Thermochim. Acta 1999, 337, 169–177.10.1016/S0040-6031(99)00161-6Search in Google Scholar
[9] Araujo JR, Waldman WR, De Paoli MA. Polym. Degrad Stab. 2008, 93, 1770–1775.10.1016/j.polymdegradstab.2008.07.021Search in Google Scholar
[10] Khan AGM, Alam MD. S. Indian J. Fibre Text. Res. 2012, 37, 20–26.Search in Google Scholar
[11] Blanco I, Bottino FA, Cicala G, Latteri A, Recca A. Polym. Degrad. Stab. 2013, 98, 2564–2570.10.1016/j.polymdegradstab.2013.09.017Search in Google Scholar
[12] Bianchi O, Repenning GB, Canto LB, Mauler RS, Oliverira RVB. Polym. Test. 2013, 32, 794–801.10.1016/j.polymertesting.2013.03.007Search in Google Scholar
[13] Mittal V, Sinha S. Sci. Eng. Compos. Mater. 2017, 24, 237–243.10.1515/secm-2014-0434Search in Google Scholar
[14] Prasad N, Agarwal VK, Sinha S. Iran Polym. J. 2016, 25, 229–241.10.1007/s13726-016-0416-xSearch in Google Scholar
[15] Srivastava P, Sinha S. Sci. Eng. Compos. Mater. 2018, 25, 571–578.10.1515/secm-2016-0198Search in Google Scholar
[16] Pal K. Compos. Commun. 2016, 1, 25–28.10.1016/j.coco.2016.08.001Search in Google Scholar
[17] Granda LA, Mendez JA, Espinach FX, Puig J, Aguilar MD, Mutje P. Compos. Part B 2016, 94, 75–81.10.1016/j.compositesb.2016.03.017Search in Google Scholar
©2018 Walter de Gruyter GmbH, Berlin/Boston
This article is distributed under the terms of the Creative Commons Attribution Non-Commercial License, which permits unrestricted non-commercial use, distribution, and reproduction in any medium, provided the original work is properly cited.
Articles in the same Issue
- Frontmatter
- Review
- Research review of diversified reinforcement on aluminum metal matrix composites: fabrication processes and mechanical characterization
- Original articles
- On the mechanisms of modal damping in FRP/honeycomb sandwich panels
- Innovative experimental and finite element assessments of the performance of CFRP-retrofitted RC beams under fatigue loading
- Mixed-mode I/III fracture toughness of polymer matrix composites toughened with waste particles
- A novel analytical curved beam model for predicting elastic properties of 3D eight-harness satin weave composites
- Microwave absorption and mechanical properties of double-layer cement-based composites containing different replacement levels of fly ash
- Electrical and rheological properties of carbon black and carbon fiber filled low-density polyethylene/ethylene vinyl acetate composites
- Effect of neutron irradiation on neat epoxy resin stability in shielding applications
- Study on the relation between microstructural change and compressive creep stress of a PBX substitute material
- Chemical synthesis and densification of a novel Ag/Cr2O3-AgCrO2 nanocomposite powder
- Reinforcing polypropylene with calcium carbonate of different morphologies and polymorphs
- Fabrication, mechanical, thermal, and electrical characterization of epoxy/silica composites for high-voltage insulation
- Synergy of cashew nut shell filler on tribological behaviors of natural-fiber-reinforced epoxy composite
- Fabrication and Failure Prediction of Carbon-alum solid composite electrolyte based humidity sensor using ANN
- Investigation of three-body wear of dental materials under different chewing cycles
- Structural and physico-mechanical characterization of closed-cell aluminum foams with different zinc additions
- Mechanical performance of polyester pin-reinforced foam filled honeycomb sandwich panels
- Effect of chemical treatment on thermal properties of hair fiber-based reinforcement of HF/HDPE composites
- Indium doping in sol-gel synthesis of In-Sm co-doped xIn-0.05%Sm-TiO2 composite photocatalyst
- Effect of the meso-structure on the strain concentration of carbon-carbon composites with drilling hole