Indium doping in sol-gel synthesis of In-Sm co-doped xIn-0.05%Sm-TiO2 composite photocatalyst
-
Wenjie Zhang
 ,
Yuxuan Liu
,
Yuxuan Liu

Abstract
Sol-gel method was used to prepare a novel In-Sm co-doped TiO2 photocatalyst. The materials were characterized by X-ray diffraction, scanning electron microscopy, Fourier transform infrared/far infrared, UV-Vis diffuse reflectance, and N2 adsorption-desorption analyses. Anatase phase TiO2 is formed in the pure and doped TiO2 samples. Anatase TiO2 crystal formation and growing are disturbed by the dopants. The substitution of smaller Ti4+ ions by the larger Sm3+ and In3+ ions causes the expansion of TiO2 cell. The doping of indium and samarium ions has no noticeable influence on the bonding characters of TiO2. A continuous red shift of the absorption edge of xIn-0.05%Sm-TiO2 occurs at increasing indium doping content. Brunauer-Emmett-Teller surface area, average pore size, and total pore volume are enhanced after doping of samarium and indium. The adsorption of methyl orange on the surface of xIn-0.05%Sm-TiO2 increases with rising indium content. The 5%In-0.05%Sm-TiO2 has the maximum photocatalytic activity. About 97.7% of the initial methyl orange is decolorized on 5%In-0.05%Sm-TiO2 after 45 min of irradiation.
1 Introduction
Photocatalytic technique has been studied for more than 40 years and has achieved tremendous progress in many of its applications [1]. As an advanced oxidation method, photocatalytic degradation of organic pollutants in water and air has aroused great attention [2], [3]. The application of this technique depends on the activity of the photocatalytic materials, among which TiO2 is the most studied material ever since the discovery of photo-splitting of water [4], [5], [6], [7], [8]. However, researchers have paid much effort to modify TiO2-based material in order to improve its activity [9], [10]. After decades of improvements, ion doping is believed to be an effective method. Ion doping in TiO2 can retard recombination of photogenerated electron-hole pairs [11], [12]. Either the formation of lower conduction band level or the introduction of electron trap in TiO2 is capable of promoting quantum efficiency and absorption of illumination at longer wavelength. The charge carriers’ lifetime can be extended, and therefore photocatalytic activity is enhanced. Up till now, many elements have been applied as dopants in TiO2-based materials with enhancing activity [13], [14], [15], [16].
Meanwhile, a recent approach is related to simultaneous doping of two dopants into TiO2 [17], [18]. For this purpose, the selection and combination of two different elements are of great importance. Tobaldi et al. [19] studied antibacterial and photocatalytic functional properties of Cu-Zn modified TiO2 nano-heterostructures. Kotesh et al. [20] reported H2O splitting activity of Ag-Cu/TiO2 photocatalyst under solar and artificial light. Sasani et al. [21] studied the structural and electronic properties of Mg-Nb co-doped TiO2 (101) anatase surface. We firstly reported the Al-In co-doped TiO2 photocatalyst synthesized by sol-gel method [22]. Normally, co-doping of two different elements is beneficial to photocatalytic activity of the materials.
Besides the current progress in preparation of co-doped TiO2 materials, great efforts are still needed for this topic since the combination of two different elements is quite complex. For example, transition metals are effective dopants in many photocatalytic materials. The combination of transition metal ions and main group element ions in TiO2 is a new approach. The selection is not easy regarding this topic so that extensive work is necessary. The synthesis of a novel In-Sm co-doped TiO2 material through sol-gel route was studied in this work. X-ray diffraction (XRD), scanning electron microscope (SEM), infrared and far infrared absorption, ultraviolet-visible (UV-Vis) diffuse reflectance, and N2 adsorption-desorption analyses were conducted on the materials. The effects of indium doping content on characterizations and photocatalytic activity of xIn-0.05%Sm-TiO2 photocatalyst were investigated.
2 Materials and methods
2.1 Synthesis of xIn-0.05%Sm-TiO2 photocatalyst
In-Sm co-doped TiO2 and pure TiO2 were synthesized through sol-gel route. A solution was composed of 0.9 ml distilled water and 4 ml anhydrous ethanol. Another solution was composed of 0.0025 g Sm(NO3)3, In(NO3)3, 2 ml tetrabutyl titanate, 8 ml anhydrous ethanol, and 0.1 ml concentrated hydrochloric acid. The first solution was slowly dropped into the second solution to form a transparent sol. Subsequently, the sol turned into a sticky gel after stirring for about 1 h. The gel stayed at ambient temperature for 12 h and was dried in the furnace at 80°C for another 12 h. The solid was ground into fine powders and transferred into an oven. The temperature of the oven increased from room temperature to 400°C at a heating rate of 5°C/min. The powders were calcinated for 3 h and then cooled to room temperature. The samples were ground again and marked as xIn-0.05%Sm-TiO2 [x=n(In)/n(Ti)×100%]. Samarium doping content was fixed to 0.05%. Pure TiO2 sample was also synthesized without any dopants.
2.2 Characterization of photocatalysts
The crystalline structures of the materials were determined by a D8 X-ray diffractometer, using monochromatized Cu Kα at λ=1.5416 Å. Surface morphology of the materials were taken by a QUANTA 250 SEM. Infrared and far infrared absorption spectra were recorded by a Frontier Fourier transform infrared and far infrared (FT-IR/FIR) spectrometer in the wavenumber between 50 cm−1 and 4000 cm−1. A LAMBDA 35 UV-Vis spectrometer was used to record UV-Vis diffuse reflectance spectra of the materials. Specific surface area and pore characters of the materials were measured by an F-sorb 3400 analyzer.
2.3 Decoloration of methyl orange
Decoloration of methyl orange (MO) was measured to study the activity of the materials. A 100 ml quartz beaker and a 20 W UV-light lamp irradiating at 253.7 nm were set up as the lap-scale reactor. Photocatalyst (15 mg) and 50 ml of 10 mg/l MO solution were used in each experiment. Prior to turning on the light, the suspension was ensured adsorption-desorption equilibrium after stirring in the dark for 60 min. Adsorption percent of MO on the photocatalyst was measured at this moment. The photocatalyst powders were removed from the solution through a millipore filter. The average irradiation intensity was 1300 μW/cm2, as measured on the surface of the suspension using an actinometer. The irradiation time in the subsequent experiments was set to 30 min except for the prolonged time reaction. Absorbance of the solution was measured by a 721E spectrophotometer at the maximum absorption wavelength of MO, i.e., 466 nm. MO concentration was calculated according to Lambert-Beer theory.
3 Results and discussion
3.1 Characterization results
Figure 1 shows XRD patterns of xIn-0.05%Sm-TiO2 and pure TiO2. The typical and pure anatase phase can be seen in the pattern of TiO2. The diffraction angles slightly move to low angle after the doping of Sm and In, accompanied with broaden peak and shrinking intensity. Scherrer formula was used to calculate the crystallite size of anatase TiO2 based on the (101) plane. The crystallite sizes are 26.9 and 11.5 nm in pure TiO2 and 0.05%Sm-TiO2. With further doping of samarium ions in 0.05%Sm-TiO2, the crystallite sizes are 10.1, 9.2, 8.9, and 8.7 nm for the samples containing 1%, 3%, 5%, and 10% samarium, respectively. The addition of Sm and In leads to continuous shrinking crystallite size. Anatase TiO2 crystal formation and growing are disturbed by the dopants.

XRD patterns of xIn-0.05%Sm-TiO2 and pure TiO2.
Substances containing indium and samarium cannot be distinguished in the XRD patterns, although the indium doping content is as high as 10% in the 10%In-0.05%Sm-TiO2. Similar result is reported in our previous work using aluminum and indium as dopants [22]. As can be seen from the figure, the diffraction angles of anatase TiO2 slightly move to low angle, which can be explained by the replacement of Ti4+ in the lattice skeleton with Sm3+ and In3+. The radii of Sm3+ (108 pm) and In3+ (81 pm) are larger than that of Ti4+ (68 pm). The substitution of smaller Ti4+ ions by the larger Sm3+ and In3+ ions causes the expansion of the TiO2 cell. Table 1 lists the lattice parameters of anatase TiO2 in xIn-0.05%Sm-TiO2 and TiO2. The cell volume of anatase TiO2 expands with the addition of both indium and samarium.
Lattice parameters of xIn-0.05%Sm-TiO2 and TiO2.
| Samples | a (=b) (nm) | c (nm) | V (nm3) |
|---|---|---|---|
| TiO2 | 0.36924 | 0.93334 | 0.12733 |
| 0.05%Sm-TiO2 | 0.37328 | 0.93365 | 0.12976 |
| 1%In-0.05%Sm-TiO2 | 0.37467 | 0.93384 | 0.13235 |
| 3%In-0.05%Sm-TiO2 | 0.37773 | 0.93478 | 0.13294 |
| 5%In-0.05%Sm-TiO2 | 0.37824 | 0.93539 | 0.13368 |
| 10%In-0.05%Sm-TiO2 | 0.37826 | 0.93787 | 0.13419 |
The surface morphologies of the sol-gel synthesized xIn-0.05%Sm-TiO2 samples are shown in Figure 2. The samples are composed of irregular shaped particles in the size as large as several micrometers. Particles aggregation during synthesizing process is responsible for the large particles. Grinding is necessary before using the materials, while the particle size is not even after grinding. There is no noticeable difference in the surface morphologies of the samples containing different content of indium.

SEM images of xIn-0.05%Sm-TiO2 samples with different indium contents. (A) 0.05%Sm-TiO2, (B) 1%In-0.05%Sm-TiO2, (C) 3%In-0.05%Sm-TiO2, and (D) 5%In-0.05%Sm-TiO2.
The FT-IR and FT/far IR spectra of xIn-0.05%Sm-TiO2 and TiO2 are shown in Figure 3. The adsorbed hydroxyl groups are proven by the bending and stretching vibrations of O-H bond at 1640 cm−1 and 3450 cm−1 [23], [24]. Surface adsorbed hydroxyl is important for photocatalytic generation of holes after electron exciting. Although the materials are dried before IR examination to remove the adsorbed water molecules, there is still detectable hydroxyl group combining with TiO2. The absorption of stretching vibration of C-O bond is also found at 1387 cm−1 [25].

(A) FT-IR and (B) FT/far IR spectra of xIn-0.05%Sm-TiO2 samples and pure TiO2.
It seems that the absorption intensity of O-H becomes a little stronger after doping more indium ions. Although it is hard to ascertain the reason for this phenomenon, the increase in O-H group is beneficial to produce hydroxyl radicals after irradiation. FT-far IR spectra are used to distinguish the bonding information of metal oxide. The broad adsorptions centered at 470 cm−1 and 347 cm−1 are attributed to bending vibration of Ti-O-Ti [26]. The doping of indium and samarium ions has no noticeable influence on the bonding characters of TiO2. The major skeleton of anatase TiO2 lattice is maintained in the doped samples.
UV-Vis diffuse reflectance spectra of TiO2 and xIn-0.05%Sm-TiO2 are presented in Figure 4. The spectra can be used to calculate the band gap of semiconductors through Tauc plot method [27]. The pure TiO2 synthesized in this work has a band gap of 3.08 eV. The value is a little smaller than the common 3.2 eV band gap of anatase TiO2. After doping of 0.05% Sm in TiO2, the band gap of 0.05%Sm-TiO2 slightly changes to 3.05 eV. The indium doped samples have comparatively strong absorption in the visible region. The band gaps of xIn-0.05%Sm-TiO2 samples are 3.03, 2.93, 2.91, and 2.85 eV when indium doping contents are 1%, 3%, 5%, and 10%, respectively. A continuous red shift of the absorption edge occurs at increasing indium doping content. Lower conduction band level is usually formed in the doped TiO2. Bandgap energy is reduced after doping. The doped ions can also act as low potential electron trap in the original semiconductor, which is beneficial to promote quantum efficiency and the response to visible illumination.

UV-Vis diffuse reflectance spectra of TiO2 and xIn-0.05%Sm-TiO2.
Enhanced absorption of the incoming photons means the possibility of photon-electron conversion and the subsequent degradation of organic substances. The UV lamp used in this work can illuminate UV light at 253.7 nm, which has enough power to excite all the xIn-0.05%Sm-TiO2 samples. Meanwhile, the lamp can emit in longer wavelength including visible light. That means the co-doped xIn-0.05%Sm-TiO2 materials can absorb more incoming photons to generate electrons and holes. Materials with small bandgap energy may have strong activity on photocatalytic degradation.
Porous characters are examined for the xIn-0.05%Sm-TiO2 samples, as shown in Figure 5 and Table 2. Figure 5 gives N2 desorption isotherms of xIn-0.05%Sm-TiO2. All of the desorption curves can be identified as mesoporous materials in the International Union of Pure and Applied Chemistry classification. An almost constant adsorbed N2 volume at low relative pressure indicates the saturated adsorption of N2 molecules on the surface of xIn-0.05%Sm-TiO2. Capillary condensation of N2 molecules in the pores of the materials leads to obvious increase of the adsorbed N2 volume. The materials also contain certain number of macropores that can be proved by the abruptly increased N2 volume at relative pressure over 0.95.

N2 desorption isotherms of xIn-0.05%Sm-TiO2.
Specific surface area and pore structure of xIn-0.05%Sm-TiO2.
| Sample | BET surface area (m2/g) | Average pore size (nm) | Pore volume (cm3/g) |
|---|---|---|---|
| TiO2 | 37.0 | 11.2 | 0.0960 |
| 0.05%Sm-TiO2 | 70.0 | 19.8 | 0.3699 |
| 1%In-0.05%Sm-TiO2 | 95.9 | 19.5 | 0.3935 |
| 3%In-0.05%Sm-TiO2 | 96.3 | 16.5 | 0.2399 |
| 5%In-0.05%Sm-TiO2 | 113.1 | 12.5 | 0.2312 |
| 10%In-0.05%Sm-TiO2 | 104.0 | 12.3 | 0.1680 |
Brunauer-Emmett-Teller (BET) surface area, average pore size, and total pore volume of TiO2 and xIn-0.05%Sm-TiO2 are listed in Table 2. The undoped TiO2 has the minimum specific surface area and the smallest pore volume. Porous characters of photocatalyst are very important in discussing the possible activities on both adsorption and photocatalytic degradation. The doping of samarium into bulk TiO2 can apparently enhance BET surface area, average pore size, and total pore volume. Further doping of indium into 0.05%Sm-TiO2 has complex influences. The sample doped with 0.05% Sm and 5% In has the maximum specific surface area. A slight shrinking in surface area is found in the 10%In-0.05%Sm-TiO2 sample containing as much as 10% indium.
The average pore size is enlarged from 11.2 nm to 19.8 nm after doping 0.05% samarium in TiO2. That means smaller pores in TiO2 merge into larger ones after the addition of samarium. The additional doping of indium into 0.05%Sm-TiO2 causes continuous pore size declining in xIn-0.05%Sm-TiO2, accompanied with shrinking pore volume with increasing indium content. The doping of Sm and In leads to continuous shrinking in crystallite size of anatase TiO2. It is responsible for the enhancement in BET surface area. The average pore size and total pore volume are reduced after doping more indium ions due to the refinement of crystallite size. Obviously, the number of pores in the materials decreases after doping excessive amount of indium. Although the pore size varies with the doping of samarium and indium, the pores are large enough for most organic pollutants. The difference in pore size may not have much effect on adsorption of methyl orange molecules. On the other hand, both of adsorption and photocatalytic degradation of methyl orange take place on the surface of the xIn-0.05%Sm-TiO2 materials. In this case, the enlarged surface area as the result of doping may have positive effect on removal of the dye.
3.2 Photocatalytic activity
Methyl orange is used as the model pollutant to examine the activity of xIn-0.05%Sm-TiO2. Either adsorption or degradation of the dye leads to decoloration of the solution. Figure 6 shows adsorption and photocatalytic activities of xIn-0.05%Sm-TiO2 samples with the variation of indium doping contents. The adsorption of methyl orange on the surface of xIn-0.05%Sm-TiO2 increases with rising indium content. The maximum adsorption percent is a little higher than 10% when indium content is as high as 10%. Normally, the adsorption of methyl orange depends on the surface properties of the materials. Adsorption amount is usually proportional to specific surface area. Meanwhile, surface polarity and bonding characters are also important to the adsorption capacity.

Adsorption and photocatalytic activities of xIn-0.05%Sm-TiO2 samples with respect to indium contents.
The influence of indium content on photocatalytic degradation of methyl orange on xIn-0.05%Sm-TiO2 is more complex. Degradation efficiency increases from 41% on 0.05%Sm-TiO2 to the maximum value of 69.8% on 5%In-0.05%Sm-TiO2. The degradation efficiency sharply decreases after the optimal indium doping content. In a common sense, nano-sized material usually has strong activity. The resulted smaller crystallite size after doping of indium can be beneficial to photocatalytic activity of the materials. However, this might not be the main reason causing the variation of the activity.
The adsorption capacity and photocatalytic activity of the photocatalyst have close correlation. Adsorption capacity is related to specific surface area. Meanwhile, surface area of photocatalyst is also important for absorption of incoming irradiating photons. The adsorption of pollutant on photocatalyst surface is also beneficial to the subsequent transition of photogenerated electrons and holes to the target substances. As stated before, either the formation of lower conduction band level or the introduction of electron trap in TiO2 is capable of promoting quantum efficiency and absorption of illumination at longer wavelength. The optimal doping content is usually reported by most of the researchers regarding doping effect on photocatalysts. After exceeding the optimal doping content, degradation activity can be eventually reduced. The dopants can become recombination centers for electrons and holes at excessive concentration if they cannot enter into the lattice skeleton of TiO2.
Figure 7 compares the removal of methyl orange with extending irradiation time on 0.05%Sm-TiO2 and 5%In-0.05%Sm-TiO2. The photocatalysts and methyl orange solution were stirred in the dark to reach adsorption-desorption equilibrium. Subsequently, the lamp was turned on to trigger photocatalytic process. As can be seen from the figure, 97.7% of the initial methyl orange is decolorized on 5%In-0.05%Sm-TiO2 after 45 min of irradiation. As a comparison, only 76.4% of the dye is removed from the solution after 60 min of irradiation with the existence of 0.05%Sm-TiO2. Photocatalytic degradation plays the main role in decoloration of the dye. Meanwhile, it is believed that adsorption of pollutant on the surface of photocatalyst is important to the photocatalytic degradation process. Enhanced adsorption of methyl orange on 5%In-0.05%Sm-TiO2 is also beneficial to photocatalytic activity as compared to 0.05%Sm-TiO2. Photogenerated electrons and holes can readily move from photocatalyst to the adsorbed methyl orange molecules, leading to the subsequent degradation process. These charge carriers can hardly move from the surface of the photocatalyst to the methyl orange molecules in the solution due to fast recombination rate of electrons and holes.
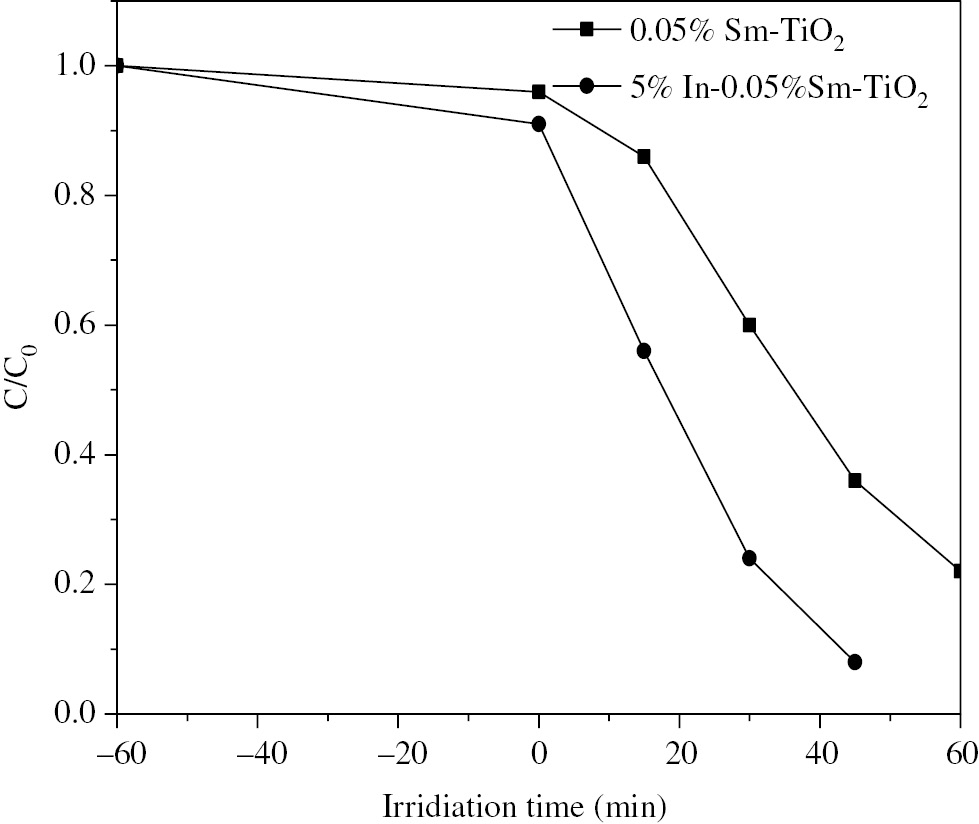
Removal of methyl orange during irradiation with the existence of 0.05%Sm-TiO2 and 5%In-0.05%Sm-TiO2 photocatalysts.
UV-Vis absorption spectra of methyl orange aqueous solution during photocatalytic degradation are shown in Figure 8. Some groups in methyl orange molecule have absorptions in both visible and ultraviolet regions. The spectrum of the initial methyl orange solution has a broad and strong absorption peak in the visible region. It is attributed to the conjugated chromophores in methyl orange molecule. The weak absorption peaks in the ultraviolet region are due to the absorptions of benzene ring in methyl orange molecule. Methyl orange is a typical azo dye and is characterized by its orange juice-like color after entering into the aquatic system. Although the initial concentration of methyl orange solution used in this work is only 10 mg/l, the solution has an apparent color so that treatment is needed before discharging.

UV-Vis absorption spectra of methyl orange aqueous solution catalyzed by (A) 0.05%Sm-TiO2 and (B) 5%In-0.05%Sm-TiO2.
The solution containing 5%In-0.05%Sm-TiO2 can be decolorized much faster than the solution using 0.05%Sm-TiO2. The absorption in the visible region almost disappears after 60 min of photocatalytic degradation using 5%In-0.05%Sm-TiO2 as photocatalyst. Methyl orange molecules are decomposed into small fragments as a result. The conjugated chromophores in methyl orange molecule can be decomposed thoroughly at this time, leading to total decoloration of the solution. However, weak absorptions in ultraviolet region can still be found in the spectra. Some organic intermediates still remain in the solution. Total mineralization of the organic substances needs much longer time.
4 Conclusions
The preparation of xIn-0.05%Sm-TiO2 photocatalyst by sol-gel method was studied. The effects of indium doping content on characterizations and photocatalytic activity of xIn-0.05%Sm-TiO2 photocatalyst were investigated. All the samples are composed of anatase phase TiO2. The addition of Sm and In leads to continuous shrinking of the TiO2 crystallite size. The cell volume of anatase TiO2 expands with the doping of both indium and samarium ions. The major skeleton of anatase TiO2 lattice is maintained in the doped samples. Band gap of xIn-0.05%Sm-TiO2 becomes smaller at higher indium doping content. The doping of Sm and In into bulk TiO2 can apparently enhance BET surface area, average pore size, and total pore volume. The solution containing 5%In-0.05%Sm-TiO2 can be decolorized much faster than the solution using 0.05%Sm-TiO2.
References
[1] Fujishima A, Rao TN, Tryk DA. J. Photochem. Photobiol. 2000, C 1, 1–21.10.1016/S1389-5567(00)00002-2Search in Google Scholar
[2] Zhang WJ, Li Y, Wang FH. J. Mater. Sci. Technol. 2002, 18, 101–107.Search in Google Scholar
[3] Chatterjee D, Dasgupta S. J. Photochem. Photobiol. 2005, C 6, 186–205.10.1016/j.jphotochemrev.2005.09.001Search in Google Scholar
[4] Zhang WJ, Ma Z, Li KX, Yang LL, Li H, He HB. Curr. Nanosci. 2016, 12, 514–519.10.2174/1573413712666151223201637Search in Google Scholar
[5] Zhou P, Wu JH, Yu WL, Zhao GH, Fang GJ, Cao SW. Appl. Surf. Sci. 2014, 319, 167–172.10.1016/j.apsusc.2014.05.045Search in Google Scholar
[6] Ku Y, Shiu SJ, Wu HC, J. Photochem. Photobio. A: Chem. 2017, 332, 299–305.10.1016/j.jphotochem.2016.09.011Search in Google Scholar
[7] Bellardita M, Paola AD, Megna B, Palmisano L. Appl. Catal. B: Environ. 2017, 201, 150–158.10.1016/j.apcatb.2016.08.012Search in Google Scholar
[8] Tahir M, Tahir B, Saidina Amin NA, Alias H, Appl. Surf. Sci. 2016, 389, 46–55.10.1016/j.apsusc.2016.06.155Search in Google Scholar
[9] Cai JB, Wu XQ, Li SX, Zheng FY. Appl. Catal. B: Environ. 2017, 201, 12–21.10.1016/j.apcatb.2016.08.003Search in Google Scholar
[10] Jo WK, Kumar S, Isaacs MA, Lee AF, Karthikeyan S. Appl. Catal. B: Environ. 2017, 201, 159–168.10.1016/j.apcatb.2016.08.022Search in Google Scholar
[11] Simsek EB. Appl. Catal. B: Environ. 2017, 200, 309–322.10.1016/j.apcatb.2016.07.016Search in Google Scholar
[12] Han C, Andersen J, Likodimos V, Falaras P, Linkugel J, Dionysiou DD. Catal. Today 2014, 224, 132–139.10.1016/j.cattod.2013.11.052Search in Google Scholar
[13] Yu JG, Xiong JF, Cheng B, Liu SW. Appl. Catal. B 2005, 60, 211–221.10.1016/j.apcatb.2005.03.009Search in Google Scholar
[14] Du J, Li XY, Li K, Gu X, Qi WQ, Zhang K. J. Alloys Compd. 2016, 687 893–897.10.1016/j.jallcom.2016.06.182Search in Google Scholar
[15] Juma A, Acik IO, Oluwabi AT, Mere A, Mikli V, Danilson M, Krunks M. Appl. Surf. Sci. 2016, 387, 539–545.10.1016/j.apsusc.2016.06.093Search in Google Scholar
[16] Zhang WJ, Pei XB, Yang B, He HB. J. Adv. Oxid. Technol. 2014, 17, 66–72.10.1002/pat.3206Search in Google Scholar
[17] Chen LC, Huang CM, Gao CS. Chem. Eng. J. 2011, 175, 49–55.10.1016/j.cej.2011.09.032Search in Google Scholar
[18] Liu JW, Han R, Wang HT, Zhao Y, Lu WJ, Wu HY. J. Mol. Catal. 2011, A 344, 145–52.10.1016/j.molcata.2011.04.022Search in Google Scholar
[19] Tobaldi DM, Piccirillo C, Rozman N, Pullar RC, Seabra MP, Škapin AS, Castro PML, Labrincha JA. J. Photochem. Photobiol. A: Chem. 2016, 330, 44–54.10.1016/j.jphotochem.2016.07.016Search in Google Scholar
[20] Kotesh KM, Bhavani K, Naresh G, Srinivas B, Venugopal A. Appl. Catal. B: Environ. 2016, 199, 282–291.10.1016/j.apcatb.2016.06.050Search in Google Scholar
[21] Sasani A, Baktash A, Mirabbaszadeh K, Khoshnevisan B. Appl. Surf. Sci. 2016, 384, 298–303.10.1016/j.apsusc.2016.05.040Search in Google Scholar
[22] Zhang WJ, Li CG, Ma Z, Yang LL, He HB. J. Adv. Oxid. Technol. 2016, 19, 119–124.Search in Google Scholar
[23] Kansal SK, Sood S, Umar A. J. Alloys Compd. 2013, 581, 392–397.10.1016/j.jallcom.2013.07.069Search in Google Scholar
[24] Ropero-Vega JL, Aldana-perez A, Gomez R. Appl. Catal. A: Gen. 2010, 379, 24–29.10.1016/j.apcata.2010.02.020Search in Google Scholar
[25] Javaid S, Farrukh MA, Muneer I. Superlattices Microstruct. 2015, 82, 234–247.10.1016/j.spmi.2015.01.038Search in Google Scholar
[26] Zhang WJ, Hu TT, Yang B, Sun P, He HB. J. Adv. Oxid. Technol. 2013, 16, 261–267.Search in Google Scholar
[27] Tauc J, Grigorovici R, Vancu A. Phys. Status Solidi 1966, 15, 627–637.10.1002/pssb.19660150224Search in Google Scholar
©2018 Walter de Gruyter GmbH, Berlin/Boston
This article is distributed under the terms of the Creative Commons Attribution Non-Commercial License, which permits unrestricted non-commercial use, distribution, and reproduction in any medium, provided the original work is properly cited.
Articles in the same Issue
- Frontmatter
- Review
- Research review of diversified reinforcement on aluminum metal matrix composites: fabrication processes and mechanical characterization
- Original articles
- On the mechanisms of modal damping in FRP/honeycomb sandwich panels
- Innovative experimental and finite element assessments of the performance of CFRP-retrofitted RC beams under fatigue loading
- Mixed-mode I/III fracture toughness of polymer matrix composites toughened with waste particles
- A novel analytical curved beam model for predicting elastic properties of 3D eight-harness satin weave composites
- Microwave absorption and mechanical properties of double-layer cement-based composites containing different replacement levels of fly ash
- Electrical and rheological properties of carbon black and carbon fiber filled low-density polyethylene/ethylene vinyl acetate composites
- Effect of neutron irradiation on neat epoxy resin stability in shielding applications
- Study on the relation between microstructural change and compressive creep stress of a PBX substitute material
- Chemical synthesis and densification of a novel Ag/Cr2O3-AgCrO2 nanocomposite powder
- Reinforcing polypropylene with calcium carbonate of different morphologies and polymorphs
- Fabrication, mechanical, thermal, and electrical characterization of epoxy/silica composites for high-voltage insulation
- Synergy of cashew nut shell filler on tribological behaviors of natural-fiber-reinforced epoxy composite
- Fabrication and Failure Prediction of Carbon-alum solid composite electrolyte based humidity sensor using ANN
- Investigation of three-body wear of dental materials under different chewing cycles
- Structural and physico-mechanical characterization of closed-cell aluminum foams with different zinc additions
- Mechanical performance of polyester pin-reinforced foam filled honeycomb sandwich panels
- Effect of chemical treatment on thermal properties of hair fiber-based reinforcement of HF/HDPE composites
- Indium doping in sol-gel synthesis of In-Sm co-doped xIn-0.05%Sm-TiO2 composite photocatalyst
- Effect of the meso-structure on the strain concentration of carbon-carbon composites with drilling hole