Utilization of traceable standards to validate plutonium isotopic purification and separation of plutonium progeny using AG MP-1M resin for nuclear forensic investigations
-

 ,
,
,
,

Abstract
Radio-chronometric studies on plutonium (Pu) materials require independent measurement of the Pu (parent) content and isotopic distribution as well as concentration and isotopic distribution of the plutonium isotopic decay products. We performed a series of experiments to demonstrate the consistency of separations using the Lewatit MP 800 macroporous anion exchange resin and the AG MP-1M resin with traceable Pu isotopic certified reference material (CRM) standards 136, 137, 138, and 126-A. Two different mesh-sizes of the AG MP-1M resin were tested and the 50–100 mesh size resin was found to work more efficiently for the separation task. Both Lewatit and AG MP-1M resins were found to perform satisfactorily for quantitatively extracting the americium (Am) and uranium (U) progeny as well as gallium (Ga) present as a tracer in the Pu material. Both resins were effective in removing isobaric interferences from the Pu fraction used in isotopic measurements by thermal ionization mass spectrometry (TIMS). To address the co-elution of uranium and gallium, Alizarin red S (ARS) was used as a colorimetric dye to determine the behavior of UO22+ and Ga3+ on AG MP-1M resin with various acidic solutions as eluents using UV–vis spectra. Poor resolution of these peaks complicated quantitative analysis by UV–vis spectroscopy, but these results were informative in planning automated separation experiments by HPLC. LA-UR-24-28919.
1 Introduction
Developing advanced analytical technologies that improve capability for quantification of key analyte abundances represents a unique challenge in bulk (∼0.5 g sample amounts) actinide characterization. Some of the challenges include complex separations and tedious hands-on radiological operations. Development of safer and more efficient sample handling processes through the reduction of the sample sizes being worked on is an effective mechanism to address these challenges. The nature of nuclear analytical work requires that changes in the approved processes be thoroughly validated using traceable standards and/or material (such as those used in proficiency tests) for which characteristic values have been established by independent techniques. The characterized isotopic abundances of plutonium (Pu) certified reference materials (CRMs) for which model production dates have been established using inter-laboratory comparison 1 are most suitable for validation experiments on the completeness of separations as the amounts of the plutonium progeny expected in these standards can be accurately estimated from the certified attributes. From a nuclear forensic perspective attribution studies of nuclear materials require characteristics such as isotopic compositions of the key analytes, element contents of the major and minor constituents, and radio-chronometric ages. 1 , 2 , 3 , 4 , 5
For element content determinations isotope dilution mass spectrometry (IDMS) 6 using a suitable traceable isotope of the element as the spike standard (a.k.a. tracer) has become the preferred analytical technique compared to classical wet chemistry techniques like titrimetry. In this technique small amounts (typically micrograms or smaller quantities) of the sample in which the element content is to be characterized is mixed with known amounts (also in the sub microgram range) of the spike standard and the isotopic ratios of the mixture are measured by mass spectrometer instrumentation. IDMS technique yields element contents that are traceable to the S.I. units if the spike standard used is a certified standard. The ability of thermal ionization and inductively coupled plasma mass spectrometer instruments to analyze samples in an auto-sequence, under computer control, and without user intervention has made the IDMS technique attractive for element content measurements. For nuclear materials that emit hazardous radiation, use of smaller amounts of the materials for destructive characterization analysis enhances the safety posture of the analytical operations through minimizing radiation exposure and minimizing the amount of contaminated waste. Summary results from Commission d’ETAblissement des Méthodes d’Analyse (CETAMA) illustrates that for Pu materials, >50 % of the data for Pu element content are generated by the IDMS technique 7 , 8 in their most recent proficiency test (PT) campaign.
Due to the precision and accuracy levels achieved by thermal ionization mass spectrometer (TIMS) instruments, these instruments are considered the gold standard for isotope amount ratio measurements using mass spectrometry techniques. The improvements in the TIMS measurement techniques have also made it possible to certify the spike standards with smaller uncertainties, compared to the spike standards available earlier. 9 , 10 , 11 To achieve the best levels of accuracy in isotope ratio measurements isobaric interferences must be resolved during the instrumental analysis or the isobaric interferences must be removed by chemical separation techniques. 12 , 13 , 14 , 15
The Lewatit® MonoPlus MP 800 anion exchange resin (Manufacturer: Lanxess Deutschland GmbH, Leverkusen, Germany) used in the current separation processes at Actinide Analytical Chemistry (C-AAC) group of LANL is not commercially available anymore. Separation using UTEVA, TEVA, or DGA resin has been reported. 12 , 13 , 14 , 15 However, the chemistry associated with separation using these resins are different from that associated with the Lewatit resin. Here we investigate use of AG MP-1M resin (Manufacturer: Bio-Rad Laboratories, Hercules, California, USA) 16 as a replacement resin for Pu isotopic separation, and for quantitative extraction of the decay products of the Pu isotopes (234U, 235U, 236U, 238U, and 241Am produced, respectively, from 238Pu, 239Pu, 240Pu, 242Pu, and 241Pu) and Ga are presented. Separations using the AG MP-1M resin followed the exact same procedure as the Lewatit resin and the results from both resins are compared.
2 Experimental techniques
2.1 Sample preparation
The first set of experiments to test the effectiveness of the resins in purifying the Pu isotopic fractions analyzed by TIMS utilized traceable plutonium isotopic CRMs from New Brunswick Laboratory (NBL). Model ages which correspond to the age of purification of these standards cover a range from 1963 through 1971. Thus, significant amounts of the plutonium progeny are present in these standards and these standards are ideal for evaluating the complete removal of the isobaric interferences (238U and 241Am are both isobaric interferences in a Pu isotopic measurement) possible for Pu isotopic measurement. The CRM standards were prepared as follows: Starting with solutions with a concentration of ∼100 mg/mL Pu, aliquots of approximately 20 μg of Pu were taken out for separations as described below. We have demonstrated that effective separation is possible for Pu amounts up to 2 mg using these columns and volume of chemicals. 17 The Pu solutions were dried down and dissociated by fuming with a couple of drops of concentrated HNO3.
The plutonium fraction is separated from the decay products and from Ga using ion exchange chromatography. Aliquots used for Pu isotopic measurements must be separated from the decay products of the Pu isotopes in order to eliminate isobaric interferences. For Pu materials, two isobaric interferences come into play as decay products: 241Am (produced by decay of 241Pu) interfering with 241Pu and 238U (produced by decay of 242Pu or present as an impurity in the initial sample) interfering with 238Pu. As the first step in the resin test, ∼20 μg aliquots of two high burnup CRMs (Pu isotopic CRMs 136 and 137), one low burnup CRM (Pu isotopic and assay standard CRM 126-A), and two aliquots each from two different Plutonium Metal Standard Exchange Program (PMSEP) metals were separated using the 50–100 mesh & 100–200 mesh resins from Bio-Rad 16 . Similar to the current analytical process using Lewatit resin 18 , 19 a water slurry of the Bio-Rad resins is loaded into a Nalgene-type disposable dropper with the tip of the bulb end cut and the dropper end plugged with a small ball of glass wool (approximately 0.8 g of the resin is used for each separation). The resin is conditioned with 4 mL of 12 M HCl (the conditioning and elution steps for the AG MP-1M resin stayed the same as that being currently used for the Lewatit MP 800 resin). 20 μg aliquots of the Pu (in 12 M HCl) was transferred to the column. The americium is removed by adding ∼12 mL of 12 M HCl. The Pu fraction is reduced to Pu(III) and eluted with 4 mL of 12 M HCl + 0.2 M HI solution. The uranium and gallium fractions remain on the column (see refs. 15] & 16] for additional details on the separation technique). During the Pu isotopic purification process, both 50–100 mesh and 100–200 mesh resins from AG MP-1M were used. The 100–200 mesh resin took approximately five times longer for the elute to drain. So, for all subsequent testing (Am, Pu, and U element content analyses by the IDMS technique) the 50–100 mesh resin only was used. All three Pu isotopic CRMs mentioned earlier and two other PMSEP Pu metals were separated on two different days (using the 50–100 mesh AG MP-1M resin) to demonstrate repeatability of the Pu isotopic separation.
2.2 UV–vis determination of UO22+/Ga3+ content
Alizarin red S (ARS) was used as a colorimetric dye to determine the behavior of UO22+ and Ga3+ on AG MP-1M resin with various acidic solutions as eluents. A 0.2 M stock solution was prepared by dissolving ARS (6.8 mg, 0.02 mmol) in pyridine in a calibrated volumetric flask (100 mL). An aliquot (1 mL) of this solution was transferred to the vials containing 10 μL aliquots of the elution fractions. The samples were mixed gently by inverting the capped vials several times and then aged at ambient temperature for 2 h to ensure that complexation equilibrium was reached. Having an excess of ARS with respect to the metal analytes was desirable to ensure that the dye could bind both UO22+ and Ga3+ (if both were present in the same sample) and to ensure consistency in metal-to-ligand binding ratios (e.g., 3:1 ARS:Ga3+). The samples were then transferred to matched UV quartz cuvettes (FireflySci, 1.4 mL capacity, 1.00 cm path length). UV–vis spectra were collected on an Agilent Cary in a 750–350 nm window. Samples were prepared in unbuffered deionized water at concentrations that maintained absorbance between 0.0 and 1.0 (unitless). Spectral details of relevant species dissolved in water are as follows: uncomplexed ARS λmax = 420 nm, ε420 = 2,830(10) M−1 cm−1; Ga(ARS)3 λmax = 480 nm, ε480 = 4,300(30) M−1 cm−1; UO2(ARS)±(pv) λmax = 565 nm, ε565 = 2,220(30) M−1 cm−1. Unfortunately, poor resolution of these peaks complicated quantitative analysis by UV–vis spectroscopy, but these results were informative in planning automated separation experiments by HPLC.
2.3 TIMS instrumental
Plutonium isotopic analytical data presented here were collected using cup-configuration shown in Table 1a using TRITON TIMS instruments (Manufacturer: ThermoElectron, Bremen, Germany). For the analysis presented here, each Faraday cup detector was connected to 1011 Ω amplifiers. The “0” idle time chosen for the total evaporation (TE) analysis precludes use of the 1012 Ω amplifiers in the isotope ratio measurements. Two different TRITON instruments, both performing at similar levels for isotope ratio measurements, were used for this investigation.
Cup-configuration for plutonium measurements by the TE technique.a
| L2 cup | L1 cup | Center | H1 cup | H2 cup | H3 cup |
|---|---|---|---|---|---|
| 238Pu | 239Pu | 240Pu | 241Pu | 242Pu | 244Pu |
-
aAll Pu isotopic signals were measured on 1011 Ω amplifiers.
For isotopic analysis using TIMS instrumentation, the total evaporation (TE) technique has been demonstrated to yield more accurate major isotope ratios for actinide elements U and Pu 20 , 21 , 22 , 23 , 24 due to the ability to perform mass fractionation correction. Standardization of the analytical technique has further helped in improving the accuracy, precision, and overall uncertainty of the 235U/238U and 240Pu/239Pu major isotope ratio measurements. Analytical method development efforts at NBL and IRMM, specifically the development of the modified total evaporation (MTE) technique 25 accomplished a consistency in the tailing correction approaches and standardization of these correction methodologies, resulting in a vast improvement in the accuracy and precision of the minor isotope ratio data for uranium. The MTE technique has become the state-of-the-art analytical technique for U isotope amount ratio measurements.
TE analysis utilized the double filament configuration with 20 ng Pu, 5 ng Am, and 200 ng U loaded onto zone-refined rhenium filaments. Cup-configurations used for Am and U isotope ratio measurements are shown in Table 1b and c, respectively. Before starting the analyses of the turret as an auto sequence, 185Re and 187Re isotopes as well as 239Pu, and 240Pu (Pu analysis), or 235U and 238U (U analysis), 241Am and 243Am (Am analysis) isotopes were focused and calibrated (magnet mass calibration) by manually heating the ionization and evaporation filaments to obtain 100 mV signals of 187Re and 239Pu (or 241Am, or 235U). During analysis fine changes in the mass calibration curve were captured by peak centering on 187Re and 240Pu (isotope in the center cup) for each sample/standard before data collection.
Cup-configuration for americium measurements by the TE technique.a
| L2 | L1 | Axial | H1 | H2 | H3 |
|---|---|---|---|---|---|
| 241Am | 243Am |
-
aBoth 241Am & 243Am isotopic signals were measured on 1011 Ω amplifiers.
Cup-configuration for uranium measurements by the TE technique.a
| L2 cup | L1 cup | Center | H1 cup | H2 cup | H3 cup |
|---|---|---|---|---|---|
| 233U | 234U | 235U | 236U | 237 | 238U |
-
aAll U isotopic signals were measured on 1011 Ω amplifiers.
3 Results and discussion: separation of the Pu isotopic fraction
3.1 Performance for 240Pu/239Pu major isotope ratio
The certified (or known, for the PMSEP metals) Pu isotopic composition of these standards (samples) was decay corrected to the date of separation and compared with measured isotope amount ratio data.
Table 2 show the performance characteristic observed for two Pu isotopic turrets analyzed on two different Triton instruments. The isotopic measurements were performed within a few days of separation of the Pu progeny. Turret 1 was analyzed on Triton SN747 and Turret 2 was analyzed on Triton SN748 utilizing the TE methodology described in Section 2. Turrets 1 and 2 included three aliquots each of CRMs 136, 137, and 126-A. Turret 1 also included aliquots from two different dissolutions of two PMSEP metals analyzed in duplicate. In order to demonstrate the repeatability of the isotopic separations, Turrets 3 and 4 following similar analysis schemes as Turrets 1 and 2 were made on two different days. Two other PMSEP metals were processed and analyzed along with the CRMs 136, 137, and 126-A for Turrets 3 and 4. Turret 3 was analyzed on Triton SN747 and Turret 4 was analyzed on Triton SN748. For all Turrets, precision (percent relative standard deviations, %RSDs) of <0.01 % was observed on the 240Pu/239Pu major isotope ratio for all Pu isotopic standards. The %RSDs observed in all cases were better than the acceptance criteria of 0.024 % for the 240Pu/239Pu major isotope ratio analysis by the TE method (2-σ limit on the control chart for 240Pu/239Pu isotope ratio using TE).
Performance characteristics for the major isotope ratios in isotope ratio measurements.
| Standard | Turret 1 | Turret 2 | ||||
|---|---|---|---|---|---|---|
| %RSD | N | b1-s cycles | %RSD | N | b1-s cycles | |
| CRM 136 | 0.0008 | 3 | 1,006 | 0.0035 | 3 | 302 |
| CRM 137 | 0.0008 | 3 | 1,340 | 0.0048 | 3 | 290 |
| CRM 126-A | 0.0045 | 3 | 1,069 | 0.0012 | 3 | 359 |
| PMSEP Metal-1a | 0.0018 | 4 | 867 | 0.0017 | 4 | 282 |
| PMSEP Metal-2a | 0.0042 | 4 | 929 | 0.0053 | 4 | 177 |
|
|
||||||
| Turret 3 | Turret 4 | |||||
|
|
||||||
| CRM 136 | 0.0025 | 3 | 383 | 0.0061 | 3 | 863 |
| CRM 137 | 0.0030 | 3 | 437 | 0.0030 | 3 | 1,100 |
| CRM 126-A | 0.0042 | 3 | 506 | 0.0027 | 3 | 772 |
| PMSEP Metal-3a | 0.0038 | 4 | 777 | 0.0097 | 4 | 1700 |
| PMSEP Metal-4a | 0.0039 | 4 | 543 | 0.0017 | 4 | 881 |
-
aaliquots from two different dissolved cuts from the same Pu metal were analyzed in duplicate to yield four measurements for each metal. bnumber of 1-s cycles.
Note that for accuracy, the nature of the TE analytical methodology implies that the sum integrated 240Pu/239Pu major isotope ratios overlap the true values of these ratios within an uncertainty limit of ± 0.030 %. 24 , 26 The 240Pu/239Pu isotope ratio is the most diagnostic for safeguards applications to decipher the intended use of the Pu material 27 and has smaller accuracy and precision target values from Nuclear Material Control & Accountability (NMCA) and safeguards perspectives. 28 For the traceable Pu standards and for the PMSEP metals included in this study, the certified (or known, for PMSEP metals) values can be decay corrected to the date of purification of the Pu isotopic fraction and the percent relative deviations (%RDs) of these values from the decay corrected values can be calculated. In all cases, these %RDs are <0.030 %, consistent with expected trends for TE isotopic analysis of Pu. For PMSEP metals the %RDs are with respect to isotope ratio values (decay corrected to the date of separation) measured on Triton SN747 & VG-4 TIMS instruments that were independently obtained following the task area measurement practices using Lewatit resin.
Table 2 also show that the standards ran acceptable number of cycles (>100 1 s integrations are considered acceptable for a SUM – (239Pu + 240Pu) – target intensity of 6 V) considering the amounts of Pu loaded on the filaments and the analysis intensity used for the TE method. On an average, both turrets ran similar number of cycles. This demonstrates that ionization inhibiting elements, if any, present in the standards/sample solution were removed equally efficiently by both mesh sizes of the AG MP-1M resin.
For Turret 1, the Pu isotopic fraction was separated using 50–100 mesh resin on 8/30/2022 and analyzed using Triton SN00747T on 9/1/2022 and for Turret 2, the Pu isotopic fraction was separated using 100–200 mesh resin on 8/29/2022 and analyzed using Triton SN00748T on 9/1/2022. For Turret 3, the Pu isotopic fraction was separated using 50–100 mesh resin on 9/27/2022 and analyzed using Triton SN00748T on 9/29/2022 and for Turret 4, the Pu isotopic fraction was separated using 50–100 mesh resin on 10/12/2022 and analyzed using Triton SN00747T on 10/13/2022. A %RSD of <0.030 % based on the control charts for high burnup and low burnup CRMs is used as the acceptance criteria for TE analysis.
3.2 Performance for 238Pu/239Pu, 241Pu/239Pu, and 242Pu/239Pu minor isotope ratios
Table 3 show the precision characteristic observed at the minor isotope ratios associated with the major ratio data shown in Table 2. For the minor isotope ratios, systematic biases arising from peak-tailing from the major isotope peak (239Pu, in this case) has been corrected using the data analysis technique described in literature. 29 The relative deviations of the tail corrected minor ratio values from the certified values decay corrected to the date of separation (expressed as a percent – %RDs) as well as the %RSDs of the replicate measurements within the turret are also shown. For PMSEP metals the %RDs are with respect to isotope ratio values (also decay corrected to the date of separation) measured on Triton SN747 & VG-4 TIMS instruments that were independently obtained following the task area measurement practices using Lewatit resin.
Minor ratio performance characteristic summary. %RDs and %RSDs are also indicated.
Standard |
Turret 1, %RD ± %RSD | Turret 2, %RD ± %RSD | ||||
|---|---|---|---|---|---|---|
| 238Pu/239Pu | 241Pu/239Pu | 242Pu/239Pu | 238Pu/239Pu | 241Pu/239Pu | 242Pu/239Pu | |
| CRM 136 | −0.01 ± 0.15 | 0.000 ± 0.008 | 0.000 ± 0.019 | −0.01 ± 0.02 | 0.000 ± 0.005 | 0.000 ± 0.003 |
| CRM 137 | −0.01 ± 0.07 | −0.001 ± 0.002 | 0.000 ± 0.009 | −0.02 ± 0.12 | −0.001 ± 0.032 | 0.000 ± 0.022 |
| CRM 126-A | −0.88 ± 2.02 | 0.000 ± 0.036 | 0.000 ± 0.186 | −4.29 ± 2.95 | 0.000 ± 0.082 | −0.006 ± 0.108 |
| PMSEP Metal-1a | 2.69 ± 1.09 | −0.005 ± 0.053 | 0.084 ± 0.181 | 3.33 ± 1.60 | −0.020 ± 0.055 | 0.034 ± 0.085 |
| PMSEP Metal-2a | 2.20 ± 1.80 | −0.022 ± 0.035 | −0.024 ± 0.316 | 4.15 ± 2.35 | 0.048 ± 0.162 | −0.123 ± 0.156 |
|
|
||||||
| Turret 1, %RD ± %RSD | Turret 2, %RD ± %RSD | |||||
|
|
||||||
| CRM 136 | −0.02 ± 0.10 | 0.000 ± 0.014 | 0.000 ± 0.011 | −0.01 ± 0.10 | 0.000 ± 0.015 | 0.000 ± 0.010 |
| CRM 137 | −0.01 ± 0.02 | −0.001 ± 0.015 | 0.000 ± 0.010 | −0.01 ± 0.06 | 0.000 ± 0.004 | 0.000 ± 0.005 |
| CRM 126-A | −2.32 ± 0.96 | 0.000 ± 0.013 | 0.000 ± 0.146 | −1.19 ± 1.97 | 0.000 ± 0.013 | 0.000 ± 0.225 |
| PMSEP Metal-3a | 6.20 ± 5.63 | −0.008 ± 0.088 | 0.044 ± 0.082 | 0.30 ± 1.55 | 0.008 ± 0.035 | 0.080 ± 0.135 |
| PMSEP Metal-4a | 1.47 ± 3.30 | −0.034 ± 0.070 | 0.084 ± 0.045 | 0.18 ± 0.52 | 0.044 ± 0.068 | −0.088 ± 0.098 |
-
aaliquots from two different dissolved cuts from the same Pu metal were analyzed in duplicate to yield four measurements for each metal.
The bias is statistically significant if the %RD values are larger than the %RSD values (i.e., bias is significant if within the precision observed, the %RDs are not overlapping “0” values).
4 Consistency in the separation process for plutonium progeny
4.1 Americium
241Am produced from decay of 241Pu isotope was separated as described in Section 2.1 and analyzed by TIMS instrument (VG-4). For the Am content measurements by IDMS, 243Am was used as the tracer. The 243Am tracer solution is calibrated against SRM 4322d to establish traceability. Table 4 shows the results of the Am element content measurements. Two separate aliquots from each of the CRMs 136, 137, and 138 were independently taken through the spiking and separation process using the Lewatit and AG MP-1M resins and measured in triplicates/duplicate on the VG-4 TIMS instrument using the TE methodology. The analytical technique followed the analysis scheme described in Section 2.2 and explained in more detail elsewhere. 30
Am content values in CRMs 136, 137, and 138 as of 7/31/2023 (separation date).
| Am (wt%) (Lewatit) |
%RSD | Am (wt%) (AG MP-1M) |
%RSD | |
|---|---|---|---|---|
| CRM 136 Aliquot 1 |
1.8179 (N = 3) |
±0.11 | 1.8171 (N = 3) |
±0.044 |
| CRM 136 Aliquot 2 |
1.8183 (N = 3) |
±0.20 | 1.8160 (N = 3) |
±0.064 |
| CRM 136 Aliquot average |
1.81812 (N = 6) |
±0.017 | 1.81653 (N = 6) |
±0.044 |
| CRM 136, grand average ± SD | 1.8173 | ±0.057 | ||
| CRM 137 Aliquot 1 |
1.9488 (N = 3) |
±0.097 | 1.9521 (N = 3) |
±0.15 |
| CRM 137 Aliquot 2 |
1.9515 (N = 2) |
±0.094 | 1.95033 (N = 3) |
±0.028 |
| CRM 137 Aliquot average |
1.9502 (N = 5) |
±0.097 | 1.9512 (N = 6) |
±0.063 |
| CRM 137, grand average ± SD | 1.9507 | ±0.073 | ||
| CRM 138 Aliquot 1 |
0.32800 (N = 3) |
±0.11 | 0.32807 (N = 3) |
±0.018 |
| CRM 138 Aliquot 2 |
0.32800 (N = 3) |
±0.053 | 0.32807 (N = 3) |
±0.070 |
| CRM 138 Aliquot average |
0.3280 (N = 6) |
a | 0.3281 (N = 6) |
a |
| CRM 138, grand average ± SD | 0.32803 | ±0.012 | ||
-
aStandard Deviation and %RSD are “0” as the aliquots yielded the same Am content values.
The three traceable CRMs included in this investigation contain ∼1.8 wt%, 1.95 wt%, and 0.32 wt% 241Am based on the model purification dates 1 , 31 and the certified Pu isotopic abundances. Figure 1 shows that the separations using both Lewatit and AG MP-1M resins yielded Am contents consistent with these expected values. Within the observed precision of the analytical data, no difference between the Am content values obtained using the Lewatit and AG MP-1M resins are observed.
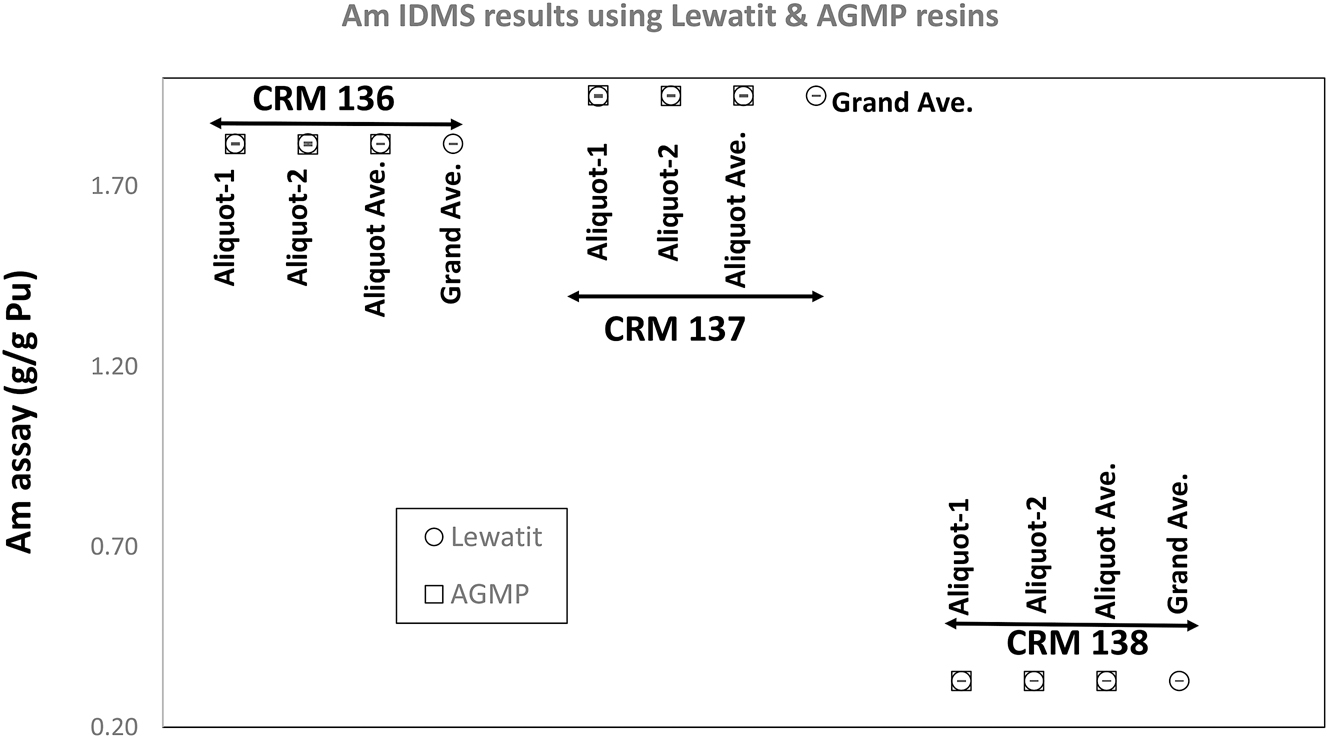
Measured Am element contents in CRMs 136, 137, and 138. Both the Lewatit resin and 50 to 100 mesh AG MP-1M resin yielded identical results for each CRM. The two high-burnup CRMs (CRMs 136 and 137) have Am contents in the wt% range, indicating the old age & higher burnup of these Pu isotopic standards.
Within the uncertainties realized by the Am IDMS technique, no cut-to-cut differences are present in the Am content data for all three standards. An expanded uncertainty of ∼0.12 % is realized (uncertainties stated are the method uncertainties estimated from quality control charts covering long periods – years) by the IDMS technique for the Am element content data.
4.2 Uranium
Uranium isotopes 234U, 235U, 236U, and 238U are produced by α-decay of the Pu isotopes 238Pu, 239Pu, 240Pu, and 242Pu. U amount content was analyzed using 233U as the traceable spike standard. Two separate aliquots from the CRM standards 136, 137, and 138 were independently spiked with the 233U tracer and taken through the column chemistry as described in Section 2.1 using Lewatit and AG MP-1M resins. The separated U fraction was analyzed in duplicate using the Triton TIMS instrument as described in Section 2.2. Table 5 provides a summary of the results for all three CRMs.
U amount content values in CRMs 136, 137, and 138 as of 6/26/2023, the date of separation.
| U (μg/g) (Lewatit) |
%RSD | U (μg/g) (AG MP-1M) |
%RSD | |
|---|---|---|---|---|
| CRM 136 Aliquot 1 |
1,299.760 (N = 2) |
±0.074 | 1,301.320 (N = 2) |
±0.002 |
| CRM 136 Aliquot 2 |
1,300.875 (N = 2) |
±0.021 | 1,301.195 (N = 2) |
±0.017 |
| CRM 136 Aliquot average |
1,300.318 (N = 4) |
±0.061 | 1,301.258 (N = 4) |
±0.0068 |
| CRM 136, grand average ± SD |
1,300.788
(N = 8) |
±0.055 | ||
| CRM 137 Aliquot 1 |
1,429.830 (N = 2) |
±0.042 | 1,431.850 (N = 2) |
±0.006 |
| CRM 137 Aliquot 2 |
1,429.835 (N = 2) |
±0.065 | 1,432.050 (N = 2) |
±0.008 |
| CRM 137 Aliquot average |
1,429.833 (N = 4) |
±0.0002 | 1,431.950 (N = 4) |
±0.0099 |
| CRM 137, grand average ± SD |
1,430.89
(N = 8) |
±0.086 | ||
| CRM 138 Aliquot 1 |
971.950 (N = 2) |
±0.029 | 971.285 (N = 2) |
±0.011 |
| CRM 138 Aliquot 2 |
970.145 (N = 2) |
±0.004 | 970.415 (N = 2) |
±0.007 |
| CRM 138 Aliquot average |
971.05 (N = 4) |
±0.13 | 970.850 (N = 4) |
±0.063 |
| CRM 138, grand average ± SD |
970.949
(N = 8) |
±0.085 | ||
The three traceable CRMs included in this investigation contain ∼1,300 μg/g, 1,430 μg/g, and 970 μg/g U based on the model purification dates 1 , 31 and the certified Pu isotopic abundances. Figure 2 shows that the separations using both Lewatit and AG MP-1M resins yielded U contents consistent with these expected values. Within the observed precision of the analytical data, no difference between the U content values obtained using the Lewatit and AG MP-1M resins are observed.
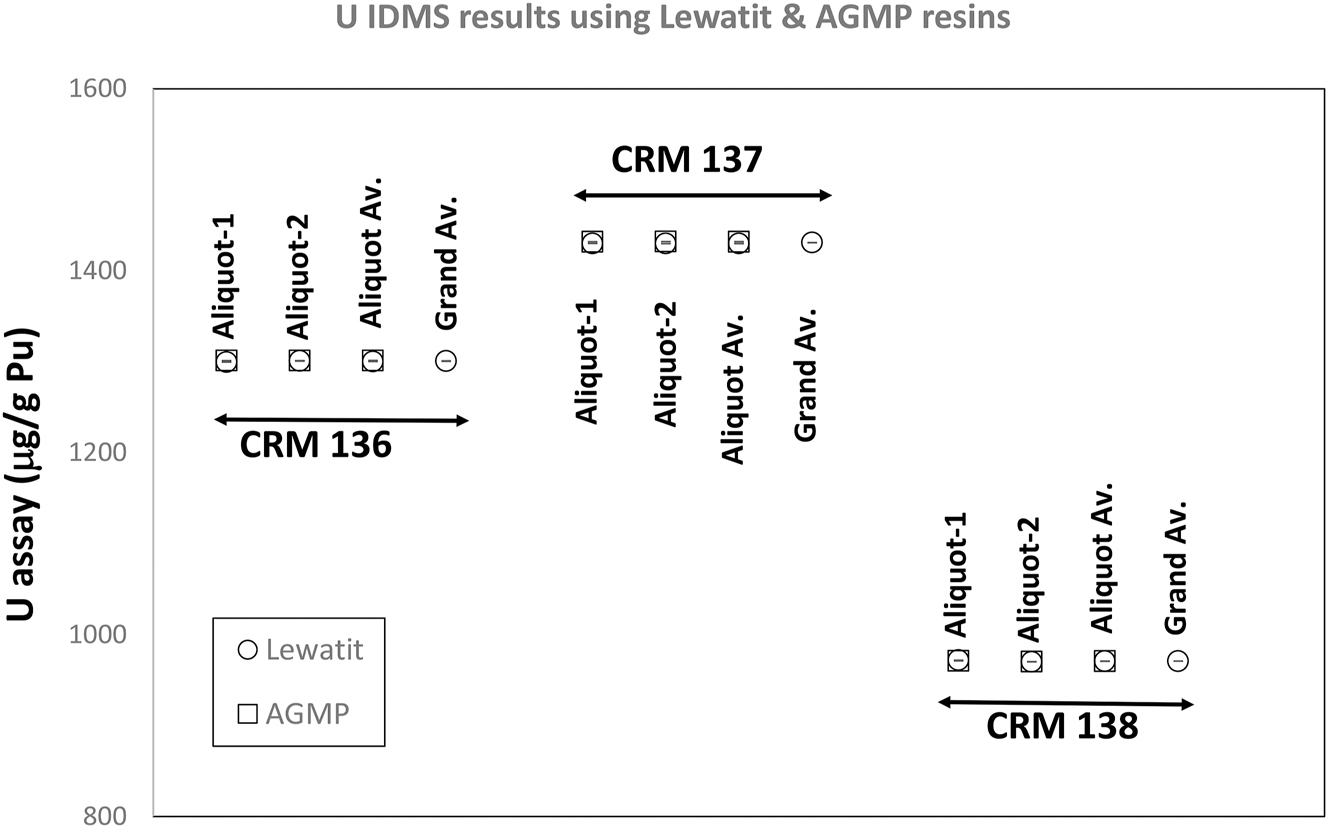
Uranium element content data on CRMs 136, 137, and 138. Both the Lewatit resin and 50 to 100 mesh AG MP-1M resin yielded identical results for each CRM. The two high-burnup CRMs (CRMs 136 and 137) have higher U contents, indicating the old age & high burnup of these Pu isotopic standards.
For all three CRMs, within the precision of the data for the U element content results, there is no cut-to-cut difference between the U data. An expanded uncertainty of 0.20 % is obtained (uncertainties stated are the method uncertainties estimated from quality control charts covering long periods – years) for the trace U element content measurements using the IDMS technique.
4.3 Plutonium
For Pu element content measurements by the isotope dilution, 244Pu was used as a tracer. Two separate aliquots each from each of the three CRMs 136, 137, and 138 went through a double dilution before being mixed with 244Pu spike standard and taken through the separation process using Lewatit and AG MP-1M resins. Table 6 shows a summary of the Pu IDMS results in CRMs 136, 137, and 138.
Pu amount contents in CRMs 136, 137, and 138 as of 7/31/2023, the date of separation.
| Pu (wt%) (Lewatit) |
%RSD | Pu (wt%) (AG MP-1M) |
%RSD | |
|---|---|---|---|---|
| CRM 136 Aliquot 1 |
45.3823 (N = 3) |
±0.064 | 45.2827 (N = 3) |
±0.036 |
| CRM 136 Aliquot 2 |
45.4768 (N = 3) |
±0.065 | 45.2803 (N = 3) |
±0.040 |
| CRM 136 Aliquot average |
45.4295 (N = 6) |
±0.147 | 45.2815 (N = 6) |
±0.004 |
| CRM 136, grand average ± SD |
45.3555
(N = 12) |
±0.21 | ||
| CRM 137 Aliquot 1 |
43.6385 (N = 2) |
±0.028 | 43.7785 (N = 3) |
±0.031 |
| CRM 137 Aliquot 2 |
43.5477 (N = 3) |
±0.047 | 43.718 (N = 3) |
±0.042 |
| CRM 137 Aliquot average |
43.5931 (N = 5) |
±0.147 | 43.7483 (N = 6) |
±0.098 |
| CRM 137, grand average ± SD |
43.6707
(N = 11) |
±0.23 | ||
| CRM 138 Aliquot 1 |
46.868 (N = 3) |
±0.11 | 46.924 (N = 3) |
±0.062 |
| CRM 138 Aliquot 2 |
46.843 (N = 3) |
±0.068 | 46.902 (N = 3) |
±0.066 |
| CRM 138 Aliquot average |
46.856 (N = 6) |
±0.038 | 46.913 (N = 6) |
±0.033 |
| CRM 138, grand average ± SD |
46.884
(N = 12) |
±0.076 | ||
Within the precision of the data, cut-to-cut differences are evident in the data. As expected, the most likely cause of this cut-to-cut difference is the weighing accuracy. Note that for the Pu element content measurements by the IDMS technique, the solution aliquot received from the dissolution task area undergoes a double dilution (by a factor of at least 1,000) before the aliquot for spiking are taken. Thus, any small accuracy issues with the weighing during the dissolution and initial aliquoting gets amplified by the dilution factor.
The precision of the aliquot averages for CRMs 136 and 137 suggest an expanded uncertainty of 0.30 % for the Pu element content measurements by the IDMS technique. However, due to cut-to-cut differences the uncertainty obtained for the grand average is ∼0.50 %. Only for CRM 138, the data did not indicate a cut-to-cut difference and an expanded uncertainty of ∼0.16 % is obtained for the Pu element content of this CRM (Figure 3).
![Figure 3:
Plutonium element content data on CRMs 136, 137, and 138. Both the Lewatit resin and 50 to 100 mesh AG MP-1M resin yielded identical results for each CRM. Though these CRMs are not certified for Pu assay, values for the Pu assay have been established through an inter-comparison study [1] performed as part of a multi-laboratory radio-chronometric investigation.](/document/doi/10.1515/ract-2025-0012/asset/graphic/j_ract-2025-0012_fig_003.jpg)
Plutonium element content data on CRMs 136, 137, and 138. Both the Lewatit resin and 50 to 100 mesh AG MP-1M resin yielded identical results for each CRM. Though these CRMs are not certified for Pu assay, values for the Pu assay have been established through an inter-comparison study [1] performed as part of a multi-laboratory radio-chronometric investigation.
Model purification dates for the Pu CRMs 136, 137, and 138 may be estimated by combining the Pu, U, and Am results presented in Sections 4.1–4.3. A model purification date of 4/16/1970 ± 72 days, consistent with published model purification date of 5/23/1970 ± 146 days and with manufacturer’s production date of 3/30/1970 ± 60 days (see [1], for additional information), is estimated for CRM 136. A model purification date of 8/27/1970 ± 52 days, consistent with published model purification date of 12/25/1970 ± 295 days and with manufacturer’s production date of 9/15/1970 ± 60 days (see [1], for additional information), is estimated for CRM 137. A model purification date of 9/22/1963 ± 476 days, consistent with published model purification date of 10/11/1963 ± 536 days and a manufacturer’s production date of 9/15/1963 ± 180 days (see [1], for additional information), is estimated for CRM 138. For all three CRMs, the agreement of the calculated model production dates with values available in literature obtained through an inter-laboratory comparison study [1] demonstrates the completeness of the element recoveries using the Lewatit and AG MP-1M resins.
4.4 Evaluation of U/Ga separation by UV–vis
A key challenge in this study was the separation of uranyl (UO22+) and gallium (Ga3+) on the AG MP-1M anion exchange resin. Under the separation conditions described here, UO22+ and Ga3+ co-elute from the column. Although it was determined that isotope ratio measurements by TIMS of uranium and gallium likely do not interfere with one another (this was demonstrated by independently analyzing the U and Ga isotope ratios in a U + Ga mixture of CRMs 112-A and SRM 994), we were interested in achieving this difficult (anionic) separation from a fundamental perspective. Uranyl and gallium are readily separated on cation exchange resins; 12 , 13 , 14 , 15 , 32 , 33 the +3 charge of aqueous gallium, Ga(OH2)63+(aq) allows this ion to interact with resin-bound anions more strongly than aqueous uranyl, which has a +2 charge. However, for anion exchange resins such as the one used in this study, the cationic charge is irrelevant, and instead the formation of differently charged anionic complexes determines the resolution power. This property makes the separation of UO22+/Ga3+ on AG MP-1M more challenging.
Upon reviewing dissociation equilibrium constant (Kd) measurements pioneered at LANL in the 1970s, 33 it was realized that there was an opportunity to achieve the resolution of uranyl and gallium on AG MP-1M using nitric acid (HNO3). Uranyl and gallium have maximally differing affinities for anion exchangers in 8 M HNO3 (Kd,U:Kd,Ga ≈ 10:0). We found that eluting mixtures of UO22+ and Ga3+ with HNO3 resulted in separation of the cations, but it was difficult to quantitatively determine the extent to which the ions were partitioned.
We developed a colorimetric technique for quantifying the amount of UO22+ or Ga3+ in fractions collected from the anion exchange resin columns (Figure 4) based on a literature method for detecting Ga3+. 34 Due to high demand for measurements on programmatic samples, TIMS and ICP-MS/AES analyses were not available for use. Instead, we turned to UV–vis spectroscopy as an analytical tool. This technique has the advantages of fast sampling time (about 1 min per sample) and facile operation. While UO22+ does have a distinct UV–vis signature (vibronic progression from 470 to 590 nm), 29 Ga3+ has no optical or UV absorption features, rendering it invisible to UV–vis measurements. Instead, we used a commercial, water-soluble dye (Alizarin Red S, ARS) that undergoes dramatic color changes in the presence of polyvalent metal ions (Figure 4). 35 That is, solutions of the free ARS dye are orange with a maximum absorption occurring at 420 nm (ε420 = 2,820(10) M−1 cm−1). When Ga3+ was added to these solutions, a distinct color change to pink-red was observed (λmax = 480 nm, ε480 = 4,300(30) M−1 cm−1). In the presence of UO22+, ARS takes on a deep purple color (λmax = 565 nm, ε565 = 2,220(30) M−1. cm−1). 35
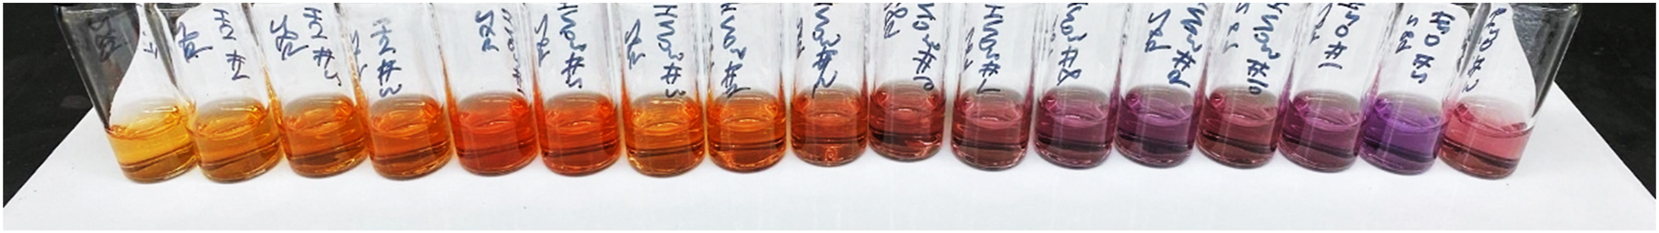
Example of how ARS changes color in the presence of metal ions. ARS is an orange-yellow color in its free form, takes on a pinkish hue with Ga3+, and attains a purple color with UO22+. See Figure 5 for corresponding UV–vis spectra.
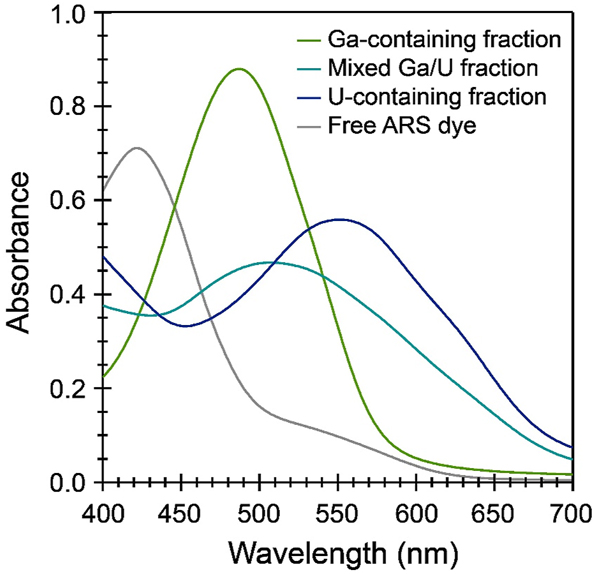
Representative UV–vis spectra of fractions of a UO22+/Ga3+ mixture eluted from AG MP-1M with 8 M HNO3. Spectra were selected to span a range of a purely Ga3+-containing fraction (green), a purely UO22+-containing fraction (navy), and a fraction containing both Ga3+ and UO22+ (teal). The corresponding spectrum of free ARS dye (gray) is included for comparison. Spectra were recorded in unbuffered deionized water. 13 , 36
We sought to take advantage of the sensitivity of ARS’s color profile to Ga3+ and UO22+ ions. In principle, it is straightforward to measure molar extinction coefficients of the ARS–metal complexes and use these values to fingerprint the composition of solutions coming off of the anion exchange column. However, these studies were complicated by several factors. For instance, absorption at 480 nm became non-linear in the presence of excess gallium (Figure 6). That is, sub-stoichiometric complexes with putative formulas Ga(ARS)2+ and Ga(ARS)3 did not adhere to Beer’s law, which obfuscated quantitative measurements. We tried to overcome this issue by ensuring that ARS was always in excess of Ga3+, but in these instances the resolution of absorption features corresponding to free ARS versus Ga(ARS)2+ versus UO2(ARS)±, which might all be in solution simultaneously was non-trivial. The broad peak shapes associated with each species made absolute deconvolution of the spectra infeasible. Consequently, we view the results presented in Figures 4 and 5 as qualitative assessments of the separation of gallium and uranyl cations on AG MP-1M.
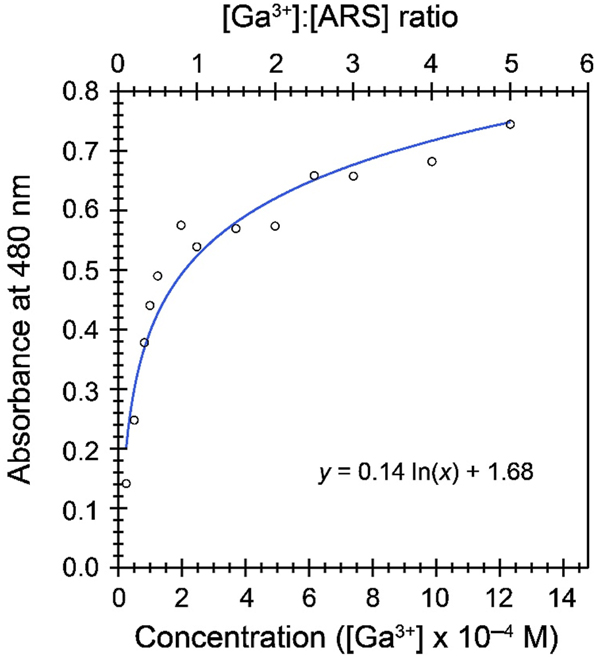
The titration of ARS (2.47 × 10 – 4 M) with varying equivalents of Ga3+ in water produces absorbances that deviate strongly from linearity at Ga:ARS ratios greater than 1. A logarithmic function fits the data reasonably well, but at high equivalences of Ga3+ the slope of this function becomes very small, making it difficult to accurately calculate gallium concentration from an absorbance measurement.
These results could be leveraged in testing separation conditions on an HPLC column of AG MP-1M. We anticipate that HPLC will afford even better separations of UO22+ and Ga3+ since Brownian motion (i.e., diffusion) will be decreased greatly compared to a gravity column. In sum, the preliminary results obtained indicate that the sequential separation of actinides (and gallium) on AG MP-1M is likely to succeed, and we expect to achieve this goal in planned follow-on studies.
5 Conclusions
Using traceable plutonium isotopic standards with known production history, we demonstrated:
Equivalence in the purification of the plutonium isotopic fraction using the Lewatit & AG MP-1M resins (within the uncertainties realized for TIMS isotope ratio measurements, statistically significant differences between the data obtained using Lewatit and AG MP-1M resins are not observed).
The reproducibility of the purification process for plutonium isotopic fraction analyzed by TIMS using AG MP-1M resin was also demonstrated.
Both Lewatit and AG MP-1M resins have been shown to yield identical values for element content data for plutonium progeny (Am & U) using the IDMS technique by TIMS.
Lewatit and AG MP-1M resins have also been confirmed to yield consistent Pu amount content values for three different traceable Pu isotopic CRMs.
For all three traceable Pu CRMs production dates in agreement with literature data and with manufacturer’s production dates are calculated using the measured Pu, U, and Am data.
Qualitative UV–vis measurements suggested that UO22+ and Ga3+ can be separated on AG MP-1M anion exchange resin using nitric acid (8 M) as the mobile phase.
Consistency in the purification of the plutonium isotopic fraction used for TIMS isotope amount ratio measurements and in the separation of the plutonium progeny was demonstrated for Pu materials with distinct compositions.
Acknowledgements
Authors acknowledge fruitful discussions with Russ Keller on separation chemistry and with Nicholas Hubley and Desiree Martinez on operation of the HPLC system. Help from Steven Levesque, James Fulwyler, and Chelsea Ottenfeld on instrumental analysis is greatly appreciated. Actinide analytical chemistry (CAAC) group management support as well as funding from LANL LDRD program (Project Number 20230731DI, P.I. Mathew, K.J.) are gratefully acknowledged. J. C. G. was partially supported by the G. T. Seaborg Institute.
-
Research ethics: Not applicable.
-
Informed consent: Not applicable.
-
Author contributions: All authors have accepted responsibility for the entire content of this manuscript and approved its submission.
-
Use of Large Language Models, AI and Machine Learning Tools: None declared.
-
Conflict of interest: The authors state no conflict of interest.
-
Research funding: Project Number 20230731DI, P.I. Mathew, K.J. LANL.
-
Data availability: Not applicable.
References
1. Mathew, K.; Kayzar-Boggs, T.; Varga, Z.; Gaffney, A.; Denton, J.; Fulwyler, J.; Garduno, K.; Gaunt, A.; Inglis, J.; Keller, R.; Kinman, W.; Labotka, D.; Lujan, E.; Maassen, J.; Mastren, T.; May, I.; Mayer, K.; Nicholl, A.; Ottenfeld, C.; Parsons-Davis, T.; Porterfield, D.; Rim, J.; Rolison, J.; Stanley, F.; Steiner, R.; Tandon, L.; Thomas, M.; Torres, R.; Treinen, K.; Wallenius, M.; Wende, A.; Wimpenny, J. Anal. Chem. 2019, 91, 11643; https://doi.org/10.1021/acs.analchem.9b02156.Search in Google Scholar
2. Kristo, M. J.; Gaffney, A. M.; Marks, N.; Knight, K.; Cassata, W. S.; Hutcheon, I. D. Annu. Rev. Earth Planet. Sci. 2016, 44, 555; https://doi.org/10.1146/annurev-earth-060115-012309.Search in Google Scholar
3. Mayer, K.; Wallenius, M.; Varga, Z. Chem. Rev. 2013, 113, 884; https://doi.org/10.1021/cr300273f.Search in Google Scholar
4. Boulyga, S.; Konegger-Kappel, S.; Richter, S.; Sangly, L. J. Anal. At. Spectrom. 2015, 30, 1469; https://doi.org/10.1039/c4ja00491d.Search in Google Scholar
5. Stanley, F. E.; Mathew, K. J.; Byerly, B. L.; Keller, R.; Spencer, K. J.; Thomas, M. R. J. Radioanal. Nucl. Chem. 2017, 311, 1819; https://doi.org/10.1007/s10967-016-5133-6.Search in Google Scholar
6. De Bièvre, P.; Peiser, H. S. Fresenius J. Ana. Chem. 1997, 359, 523.10.1007/s002160050625Search in Google Scholar
7. Crozet, M.; Roudil, D.; Rigaux, C.; Bertorello, C.; Picart, S.; Maillard, C. J. Radioanal. Nucl. Chem. 2019, 319, 1013; https://doi.org/10.1007/s10967-018-6399-7.Search in Google Scholar
8. Mathew, C. E.; Rai, V. K.; Ottenfeld, C.; Keller, R. J. Radioanal. Nucl. Chem. 2021, 328, 235; https://doi.org/10.1007/s10967-021-07646-7.Search in Google Scholar
9. Essex, R. M.; Williams, R. W.; Treinen, K. C.; Hubert, A.; Humphrey, M. A.; Inglis, J. D.; Kinman, W. S.; Maassen, J.; Pénkin, M. V.; Steiner, R. E. J. Radioanal. Nucl. Chem. 2020, 324, 257; https://doi.org/10.1007/s10967-020-07075-y.Search in Google Scholar
10. Mathew, K. J.; Canaan, R. D.; Hexel, C.; Giaqunito, J.; Krichinsky, A. M. Qualification and Initial Characterization of a High-Purity 233U Spike for Use in Uranium Analyses. Int. J. Mass Spectrom. 2015, 389, 47–53; https://doi.org/10.1016/j.ijms.2015.08.013.Search in Google Scholar
11. Buják, R.; Jakopič, R.; Eykens, R.; Kehoe, F.; Kühn, H.; Richter, S.; Aregbe, Y. Certification of 244Pu Spike Reference Material: IRMM-042a, JRC108889, 2017, JRC Science Hub. https://ec.europa.eu/jrc.Search in Google Scholar
12. Fan, J.; Wang, Y.; Li, Z.; Zhai, X.; Shang, P.; Duan, L.; Yu, G.; Liang, J.; Bai, T. J. Radioanal. Nucl. Chem. 2023, 332, 2667; https://doi.org/10.1007/s10967-023-08920-6.Search in Google Scholar
13. Saito, N. Pure Appl. Chem. 1984, 56, 523.10.1351/pac198456040523Search in Google Scholar
14. Birkett, J. E.; Carrott, M. J.; Danny, O.; Jones, C. J.; Maher, C. J.; Roube, C.V.; Taylor, R. J.; Woodhead, D. A. Chimia 2005, 59, 898.10.2533/000942905777675327Search in Google Scholar
15. Metzger, S. C.; Rogers, K. T.; Bostick, D. A.; McBay, E. H.; Ticknor, B. W.; Manard, B. T.; Hexel, C. R. Talanta 2019, 198, 257; https://doi.org/10.1016/j.talanta.2019.02.034.Search in Google Scholar
16. AG MP-1M Anion Exchange Resins, https://www.bio-rad.com/en-us/product/ag-mp-1m-anion-exchange-resins?ID=9d70419d-626a-4ca1-9928-cc25738eff99.Search in Google Scholar
17. Mathew, K. J.; Ottenfeld, C.; Keller, R. J. Radioanal. Nucl. Chem. 2022, 331, 4897; https://doi.org/10.1007/s10967-022-08487-8.Search in Google Scholar
18. Abernathey, R. M.; Matlack, G. M.; Rein, J. E. In Analytical Methods in the Nuclear Fuel Cycle; International Atomic Energy Agency: Vienna, Austria, 1972; p. 513.Search in Google Scholar
19. Horwitz, E. P.; Chiarizia, R.; Dietz, M. L.; Diamond, H.; Nelson, D. M. Anal. Chim. Acta 1993, 281, 361; https://doi.org/10.1016/0003-2670(93)85194-o.Search in Google Scholar
20. Romkowski, M.; Franzini, S.; Koch, L. Proceedings of the 8th Annual ESARDA Symposium; ESARDA: London, 1987; pp 12–14.Search in Google Scholar
21. IAEA Report. Total Evaporation Measurements of Plutonium with a Thermal Quadrupole Mass Spectrometer (THQ) International Atomic Energy Agency, Seibersdorf (Austria). Laboratories March 1989 IAEA-AL-020; DE89634732.Search in Google Scholar
22. Callis, E. L.; Abernathy, R. M. Int. J. Mass Spectrom. 1991, 103, 93.10.1016/0168-1176(91)80081-WSearch in Google Scholar
23. Mathew, K. J.; O’Connor, G.; Hasozbek, A.; Kraiem, M. J. J. Anal. At. Spectrom. 2013, 28, 866; https://doi.org/10.1039/c2ja30321c.Search in Google Scholar
24. Standard Test Method for Determination of Uranium or Plutonium Isotopic Composition or Concentration by the Total Evaporation Method Using a Thermal Ionization Mass Spectrometer, C1672-07. ASTM International.Search in Google Scholar
25. Richter, S.; Kühn, K.; Aregbe, Y.; Hedberg, M.; Horta-Domenech, J.; Mayer, K.; Zuleger, E.; Bürger, S.; Boulyga, S.; Köpf, A.; Poths, J.; Mathew, K.; J. Anal. At. Spectrom. 2011, 26, 550.10.1039/C0JA00173BSearch in Google Scholar
26. Mathew, K. J.; Ottenfeld, C.; Levesque, S.; Keller, R. J. Radioanal. Nucl. Chem. 2022, 331, 1005; https://doi.org/10.1007/s10967-021-08170-4.Search in Google Scholar
27. Rim, J. H.; Kuhn, K. J.; Tandon, L.; Xu, N.; Porterfield, D. R.; Worley, C. G.; Thomas, M. R.; Spencer, K. J.; Stanley, F. E.; Lujan, E. J.; Garduno, K.; Holly, R. Forensic Sci. Int. 2017, 273, e1; https://doi.org/10.1016/j.forsciint.2017.01.014.Search in Google Scholar
28. International Target Values 2010 for Measurement Uncertainties in Safeguards Nuclear Materials, International Atomic Energy Agency 2010, STR-368: Vienna, Austria.Search in Google Scholar
29. Mathew, K. J.; Ottenfeld, C.; Butterfield, N. J. Radioanal. Nucl. Chem. 2022, 331, 4881; https://doi.org/10.1007/s10967-022-08505-9.Search in Google Scholar
30. Mathew, K. J.; Ottenfeld, C. F.; Keller, R. C.; Kuhn, K. J.; Fulwyler, J. B. Int. J. Mass Spectrom. 2020, 458, 116430; https://doi.org/10.1016/j.ijms.2020.116430.Search in Google Scholar
31. Mason, P.; Narayanan, U. A Documentary History of the United States’ First Plutonium Isotopic Reference Materials. New Brunswick Laboratory Report NBL-RM-2010-Pu-History. New Brunswick Laboratory.Search in Google Scholar
32. Burgess, J. Metal Ions In Solution; Ellis Horwoord: Chichester, 1978.Search in Google Scholar
33. Sterlow, F. W. E. Anal. Chim. Acta 1980, 113 (2), 323; https://doi.org/10.1016/s0003-2670(01)93747-x.Search in Google Scholar
34. Görller-Warland, C.; De Jaegere, S. Spectrochim. Acta Part Mol. Spectrosc. 1972, 28 (2), 257.10.1016/0584-8539(72)80250-2Search in Google Scholar
35. Venkateswarlu, K. S.; Raghava Rao, Bh. S. V. Anal. Chim. Acta 1955, 13, 79; https://doi.org/10.1016/s0003-2670(00)87905-2.Search in Google Scholar
36. Justino, L. L. G.; Braz, S.; Ramos, M. L. Photochem. 2023, 3 (1), 61; https://doi.org/10.3390/photochem3010005.Search in Google Scholar
© 2025 the author(s), published by De Gruyter, Berlin/Boston
This work is licensed under the Creative Commons Attribution 4.0 International License.
Articles in the same Issue
- Frontmatter
- Original Papers
- Utilization of traceable standards to validate plutonium isotopic purification and separation of plutonium progeny using AG MP-1M resin for nuclear forensic investigations
- DFT study of Se(-II) sorption on biotite in reducing conditions
- 140Ba → 140La radionuclide generator: reverse-tandem scheme
- Estimation of valuable metals content in tin ore mining waste of the Russian Far East region by instrumental neutron activation analysis
- Optimizing vulcanized natural rubber: the role of phenolic natural antioxidants and ionizing radiation
- The gamma radiation shielding properties of tin-doped composites: experimental and theoretical comparison
- Effect of replacing ZnO with La2O3 on the physical, optical, and radiation shielding properties of lanthanum zinc tellurite