Cup drawing predictions for a 6016-T4 aluminum alloy
-
Emre Esener
Dr. Emre Esener is Associate Prof. Dr at Bilecik Seyh Edebali University. He finished his Ph.D. thesis in Mechanical Engineering from Sakarya University in 2015. Finite element modeling, plasticity, mechanical testing, and sheet metal forming are his primary topics of interest.
Dr. Toros Arda Akşen is Assistant Prof. Dr. at the University of Sakarya. He finished his Ph.D. program in Mechanical Engineering at the University of Sakarya. Currently, he is a post-doctoral researcher at Aalto University as well. Ductile fracture, cyclic plasticity, anisotropic plasticity, and sheet metal forming are his primary topics of interest.
Dr. Mehmet Firat is a Professor at the University of Sakarya, Turkey. He received his Ph.D. in Mechanical Engineering from the University of Sakarya in 2003. His research interests include cyclic plasticity, fatigue, sheet metal forming, and computational mechanics.


Abstract
This study investigates the interplay between process and computation parameters affecting the accuracy of finite element analysis (FEA) results for cup manufacturing. By revisiting the Esaform-2021 benchmark, this research aims to elucidate the impact of process parameters on FEA accuracy and recommend strategies for enhancing cup drawing fidelity. By conducting a parametric study focusing on the force–displacement behavior of a 6016-T4 alloy cup drawing process, an “optimized” force–displacement curve was obtained, demonstrating improved agreement with reference results. Die clearance, friction coefficient, time step size, and termination time are used in parametric finite element study. Key findings from the parametric study can be concluded that die clearance significantly affects punch force; a die clearance of 1.4 mm yielded the best match with experimental results, attributed to reduced blank-stuck phenomenon compared to smaller clearances. The friction coefficient showed a direct impact; a friction coefficient of μ = 0.1 accurately replicated the experimental peak force, highlighting the sensitivity of force predictions to friction parameters. Time step size and termination time demonstrated minimal influence on FEA results, suggesting prioritization of parameters accelerating solution time. Finally, the relationships between process and FEA computation parameters and predictions were revealed for more realistic cup drawing process prediction accuracy.
1 Introduction
Earing is a common defect that can affect the quality of the final product in sheet metal forming, specifically characterized by the formation of non-uniform wavy edges at the flange of the drawn cup. Earing arises from the anisotropic mechanical properties of sheet metal, typically caused by the grain structure developed during the rolling process. The yield stress and plastic flow behavior vary depending on the loading direction relative to the rolling direction, leading to non-uniform material flow during drawing [1], [2], [3]. The number of ears typically corresponds to the crystallographic texture of the sheet metal, with four ears being the most common for cubic crystal structures [4], [5]. Optimizing process parameters such as draw ratio, blankholder force, and lubrication can help control material flow and mitigate earing formation [6], [7], [8]. Ipekoglu et al. [9] investigated the effect of different blank holder forces on the product quality. Koowattanasuchat et al. [10] employed response surface methodology to predict the thickness value and specific locations of the draw cup. They correlated the blank holder force with the thinning behavior of the drawn cups. Ünal and Özek [11] investigated the impact of the die and blank angles on the quality of the final product in cup-deep drawing processes. They reported that the angular deep drawing process led to better quality when compared to the conventional dies. Singh et al. [12] conducted a study on blank shape optimization to reduce the earing amount in the cup drawing process. They obtained good approximations.
Therefore, accurate analyses of the cup drawing process are crucial for ensuring the quality of the final product. Numerical techniques like finite element analysis have made it possible to predict force-stroke behavior and earing in cup drawing. Still, the accuracy of these predictions depends heavily on the calculation parameters used in the simulation [13], [14], [15], [16], [17]. Understanding the individual and combined effects of these calculation parameters is vital for optimizing FEA models and achieving accurate predictions of the cup drawing behavior of materials. Careful selection, calibration, and sensitivity analysis are necessary to balance computational efficiency with prediction accuracy, guide process optimization, and ultimately lead to high-quality sheet metal parts with minimal earing defects. In recent decades, researchers have focused on developing more realistic material models to enhance the accuracy of process simulations [18], [19], [20], [21], [22]. In the sheet metal cup drawing process, the force-stroke curve refers to a graphical representation of the drawing force plotted against the punch stroke during the deformation of the sheet metal blank. It provides valuable insights into the forming behavior of the material, process stability, and potential challenges. Experimental force-stroke curves can be employed to validate and calibrate FEA models for accurate process simulation.
Finite element analysis (FEA) has become a mainstay in the realm of sheet metal forming, offering valuable insights into the complex interplay of forces and material behavior during processes like cup drawing. However, the accuracy of these predictions relies not only on the sophistication of the FEA model but also on a delicate balance between process parameters and calculation settings. This study meticulously navigates this intricate landscape, delving into the specific case of cup drawing to refine our understanding of how these factors influence the reliability of FEA results. The Esaform-2021 cup drawing benchmark was studied to present enhanced prediction accuracy. This established platform provides a robust testing ground, allowing us to systematically explore the impact of various parameters on the predicted force–displacement behavior of a 6016-T4 alloy cup drawing process. Throughout this exploration, we leverage the power of parametric studies, meticulously varying both process and FEA calculation parameters to uncover their influences.
2 Summary of experimental studies
In Esaform-2021 [23], a cylindrical cup drawing test is performed on 6016-T4 aluminum alloy. Thirteen research groups from different universities participated in this benchmark study, including the authors of this research (USakarya). Within the scope of this benchmark, the mechanical tests were conducted in different universities from different countries, such as the University of Aveiro, Tokyo University of Agriculture and Technology (TUAT), the University of Porto, and the University of Liege. These tests cover the uniaxial tensile tests (University of Aveiro, TUAT), monotonic and reversal shear tests (University of Liege), and cup drawing tests (University of Porto). The research groups participating in this benchmark endeavored to understand the earning phenomenon of a highly anisotropic aluminum alloy 6016-T4 under ironing conditions. They utilized or implemented different material models mainly focusing on the anisotropic yield criteria in different finite element software and tried to predict the ear formation in cup drawing. However, the necessity of an advanced anisotropic yield criterion is emphasized under the ironing condition since the ironing phenomenon hinders the accurate prediction of the formation.
The experimental deep drawing cylindrical cup tests were performed using a 300 kN hydraulic universal testing machine. Die tools are consist of a die, a blank holder, a stopper, and a punch (cylindrical). Die tool geometries are summarized in Figure 1. Blank diameter and initial blank thickness were used as 107.54 mm and 0.98 mm, respectively. Blank holder force was applied as 40 kN. Punch stroke speed was considered 0.5 mm/s, and punch stroke was 54 mm for fully drawn cup. As a result of experiments a force–displacement curve is obtained to use as a reference for finite element analysis results with a 50 Hz data acquisition. The experimental force–displacement curve and an experimental sample are shown in Figure 2. As the figure shows, some polished regions occur at the upper locations of the cylindrical cup. This situation shows there is an ironing occurrence in the process, which can be seen with the plateau in the force–displacement curve.
![Figure 1:
Die tool geometries of cup drawing process [23].](/document/doi/10.1515/mt-2024-0488/asset/graphic/j_mt-2024-0488_fig_001.jpg)
Die tool geometries of cup drawing process [23].
![Figure 2:
Cup drawing process, a) force–displacement curve, b) experimental sample [23].](/document/doi/10.1515/mt-2024-0488/asset/graphic/j_mt-2024-0488_fig_002.jpg)
Cup drawing process, a) force–displacement curve, b) experimental sample [23].
The second part of the experimental studies was uniaxial tensile tests to obtain the mechanical properties of the aluminum alloy for plasticity modeling. The uniaxial tensile tests were performed at the Tokyo University of Agriculture and Technology (TUAT) with the sheet metals from the same batch with cup drawing test samples. Standard specimens (JIS Z 2241) with 50 mm gauge length and 12.5 mm gauge width were conducted. Tensile tests were performed at a strain rate of 10−3 s−1 by a Shimadzu-Autograph AG Model tensile test machine with 250 kN capacity. Test samples are generated with a 15° interval angle from the rolling direction (RD). A mechanical extensometer was used to obtain displacements, and for the Lankford parameters another test group was performed, which was up to 10 % nominal strain.
3 Parametric finite element modeling
In this stage of the study, parametric modeling of the cup drawing process was performed. As a beginning, process conditions and die geometries were used as given in the benchmark cup drawing process report to obtain a reference finite element result. Eta/Dynaform explicit commercial finite element software was used in reference simulation.
In sheet metal forming analysis, the incremental finite element solution technique is often utilized to handle material nonlinearity, contact conditions, and large deformation. This method splits the analysis into small increments, with the solution at each step obtained by adding the incremental deformation to the previous solution. The incremental deformation is calculated assuming that the deformation during each time increment is small enough to be considered linear. The explicit time-integration scheme is widely used in sheet metal forming analysis for its computational efficiency and ease of implementation [24], [25], [26]. This scheme calculates the element stiffness matrix and nodal forces at each time step based on the current values of nodal displacements, velocities, and accelerations. The element stresses and strains are then calculated using the updated nodal forces and the current values of element strains. These updated material properties include yield stress and hardening modulus. The explicit scheme has been successful in sheet metal forming simulations, including deep drawing, stretch forming, and bending. However, the explicit time-integration scheme is challenging. The explicit scheme has stability and accuracy issues in sheet metal forming analysis. The stability issue occurs when the time step size is too large, leading to unstable solutions and nonphysical results. Meanwhile, the accuracy issue occurs when the time step size needs to be increased, leading to excessive computational time and memory requirements. Therefore, choosing an appropriate time step size ensures stability and accuracy in sheet metal forming analysis. Nevertheless, explicit schemes have a more straightforward structure and are easier to implement than implicit FE schemes. Furthermore, explicit schemes are more suitable for problems with many elements or nodes, where implicit schemes become computationally expensive.
In this study, full integration shell elements and seven integration points through thickness were used for blank mesh design. The cup drawing process was studied as a quarter model. 3,072 quadratic shell elements were generated for the quarter blank part. The finite element model of the cup drawing process is shown in Figure 3.
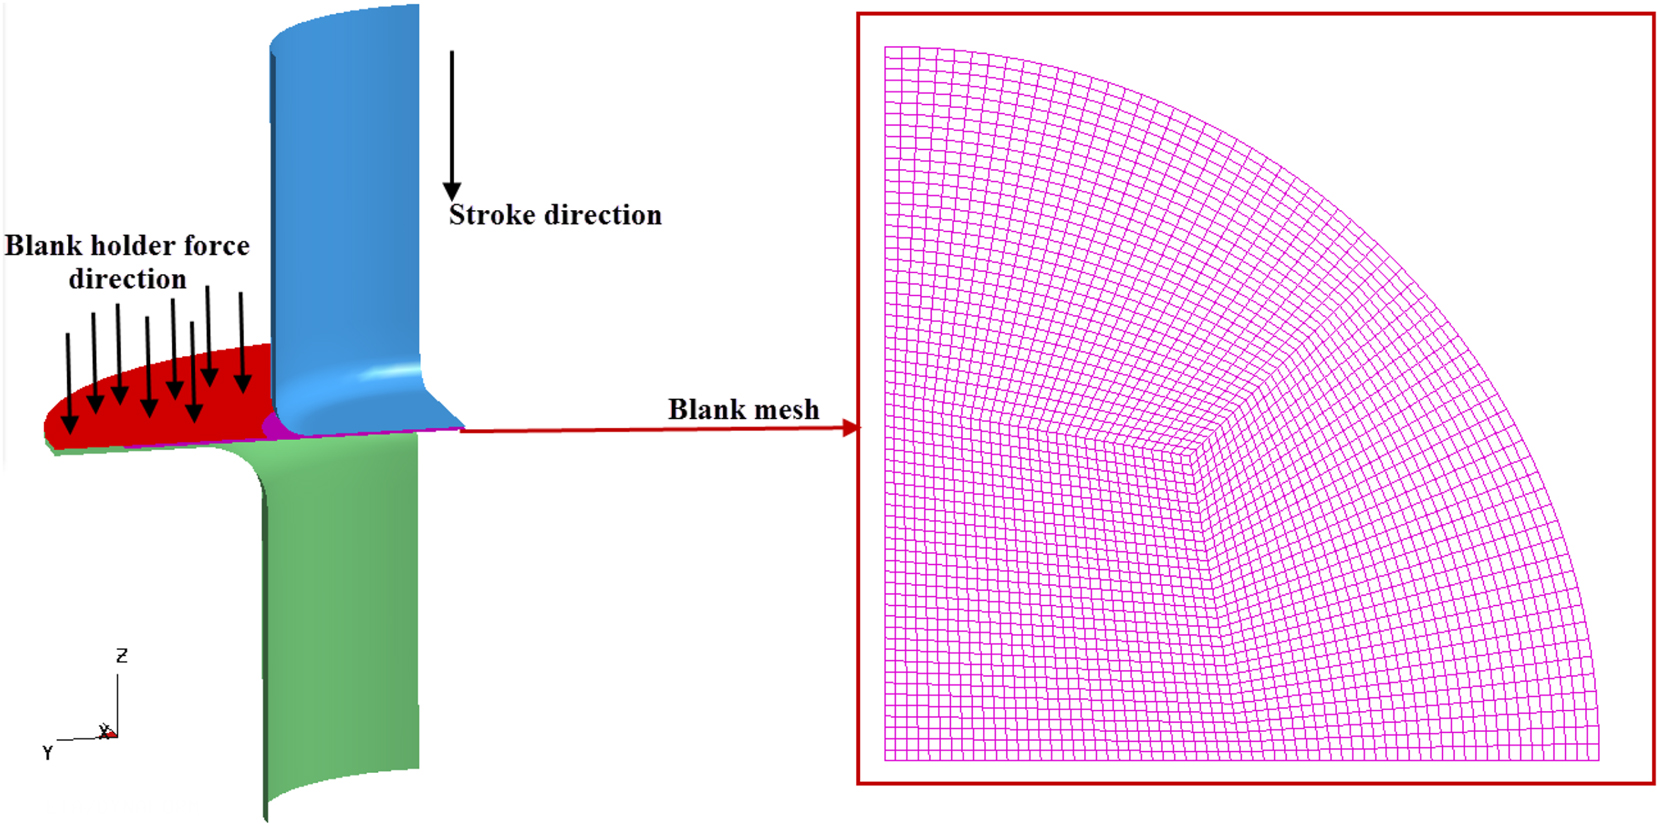
Finite element model of the cup drawing process.
In plasticity modeling Yld2000 yield criterion [27] was used for determining material behavior in finite element analyses. The Yld2000-2D yield function was defined as:
with
and similar expression with the appropiate double prime indices for
with α j:(−), j: 1…8 (−): Independent anisotropy coeffcients involved in the formulation of Yld2000-2D [23].
Yield locus and angular variations of stress ratios and Lankford coefficients (r values) were predicted using the Yld2000 yield criterion for 6016-T4 alloy. Prediction results were compared with the experimental results obtained at Tokyo University. Yld2000 parameters of the 6016-T4 alloy is presented in Table 1. Figures 4 and 5 shows the yield locus and angular variations of stress ratios and Lankford coefficients (r values) comparisons. As it can be seen from these figures the Yld2000 criterion can accurately define the directionality of stress and Lankford coefficients.
Parameters used as inputs for Yld2000 model.
| Yld2000 | α1 | α2 | α3 | α4 | α5 | α6 | α7 | α8 |
|---|---|---|---|---|---|---|---|---|
| Tokyo University | 0.9238 | 0.9967 | 0.9365 | 1.0227 | 1.0303 | 1.0075 | 0.8385 | 1.3761 |
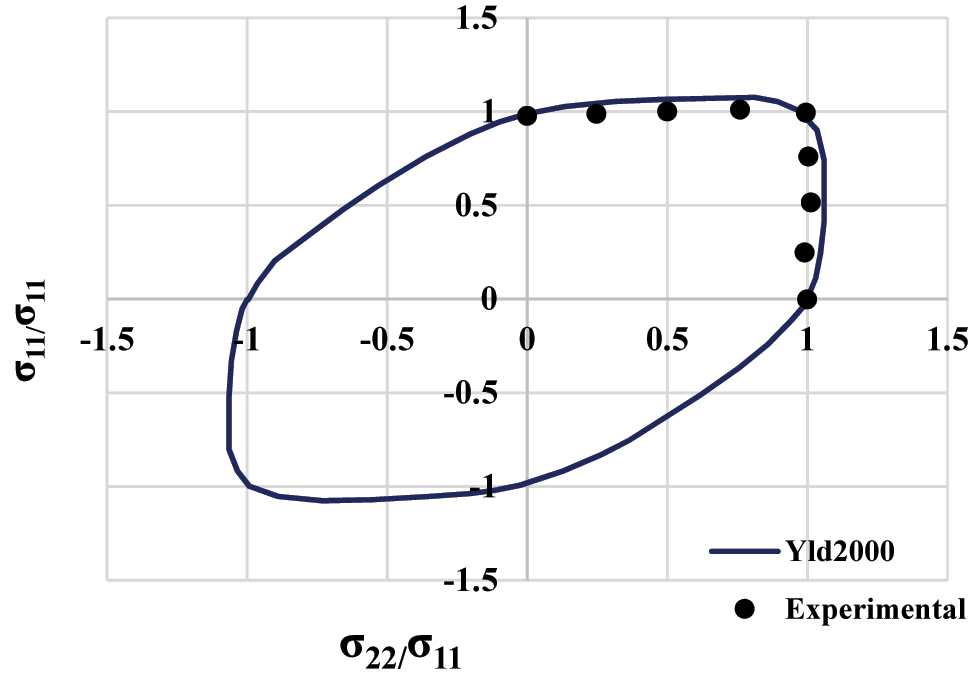
Yield locus obtained with Yld2000 criterion for 6016-T4 alloy.
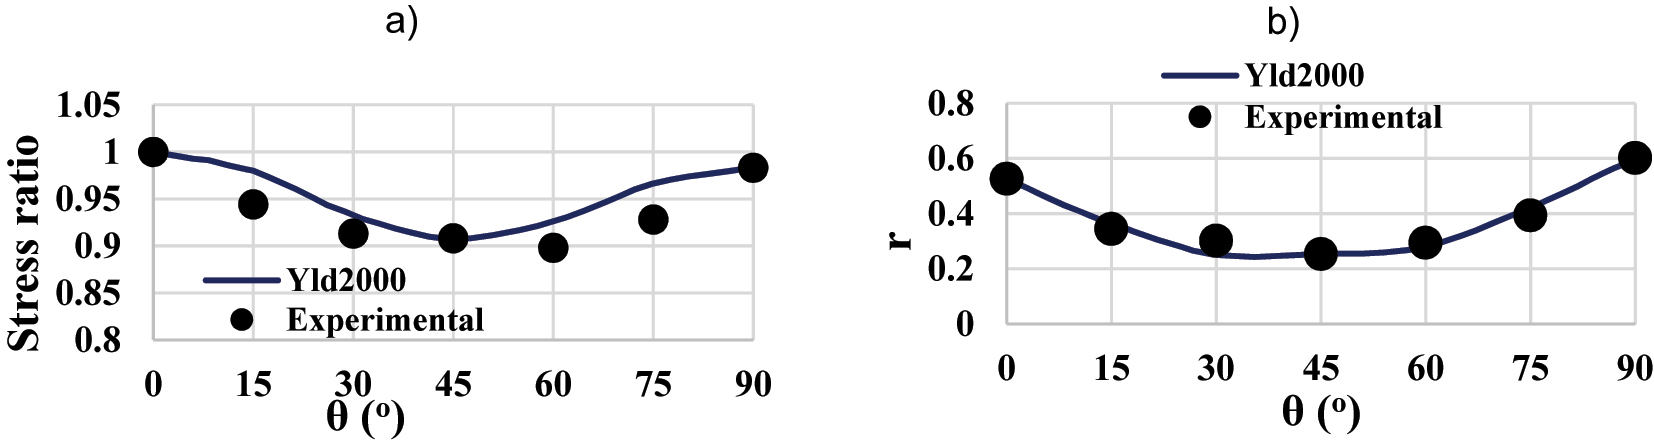
Angular variation of, a) stress ratio, b) r values obtained with Yld2000 plasticity model for 6016-T4 alloy.
After finite element analyses, a force–stroke curve comparison was obtained to understand the current status of the reference data. The comparison result is given in Figure 6. It is seen that the finite element analyses have good agreement with experimental data until the blank disposes of the blank holder. When flange areas were drawn into the die cavity, sheet thickness became approximately 1.48 mm. However, the clearance between the die and the punch was given as 1.2 mm, so in this stage, thick areas of the blank are stuck in this clearance, and the punch force increases due to this situation.
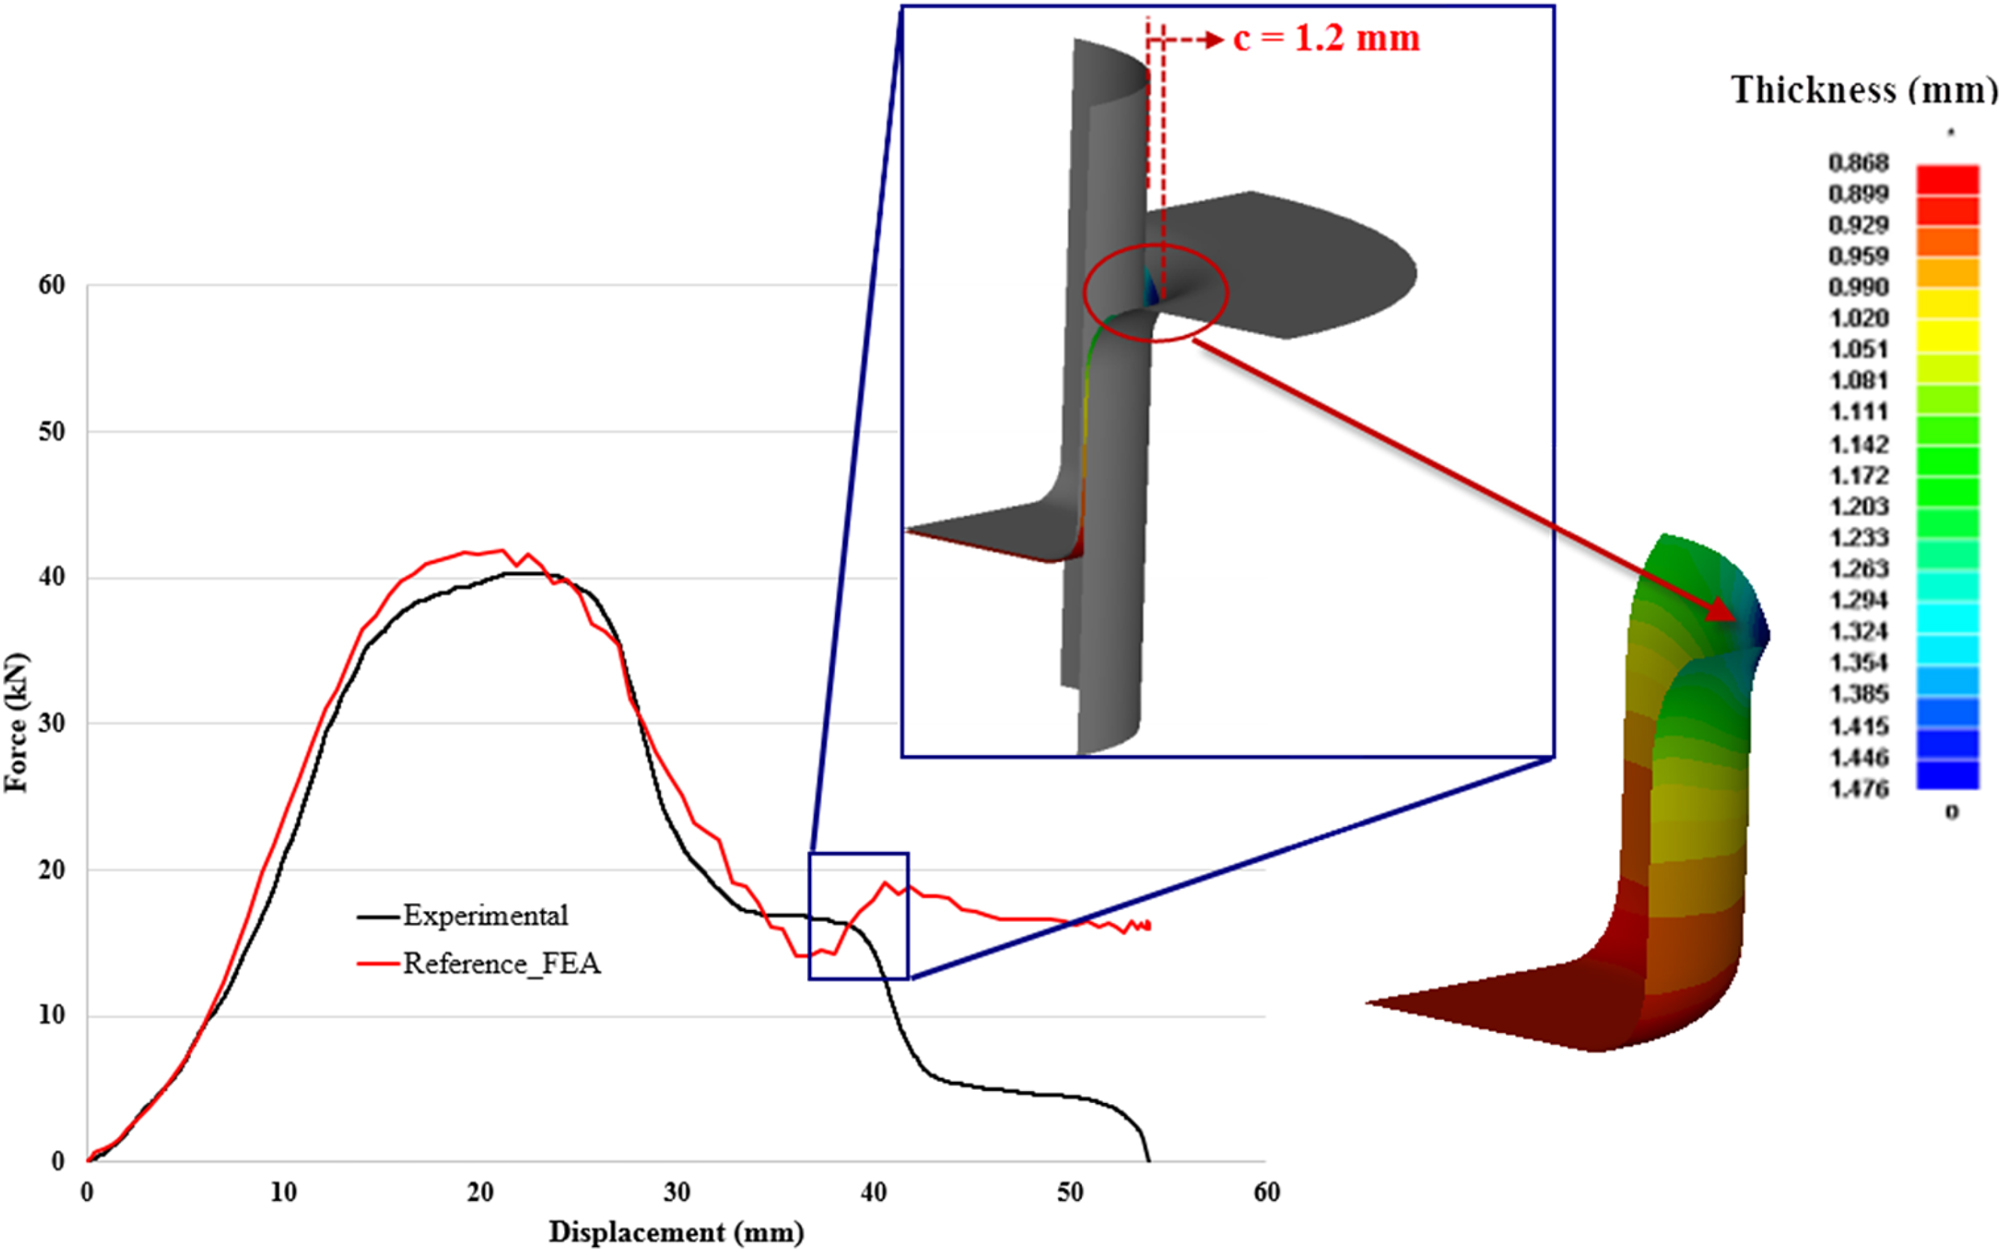
Force-displacement curve comparison of reference finite element analyses with experimental data.
A parametric study was organized to eliminate this situation. Firstly, die geometry was investigated through die clearance. Die clearance was studied as 1.9, 1.7, and 1.4 mm, and then the finite element analyses were performed with the same parameters as the reference simulation. It is seen that the die clearance has a strong effect on punch force (Figure 7), and the clearance value of 1.4 mm showed a good agreement with the experimental data, and this value is selected for further finite element analyses.
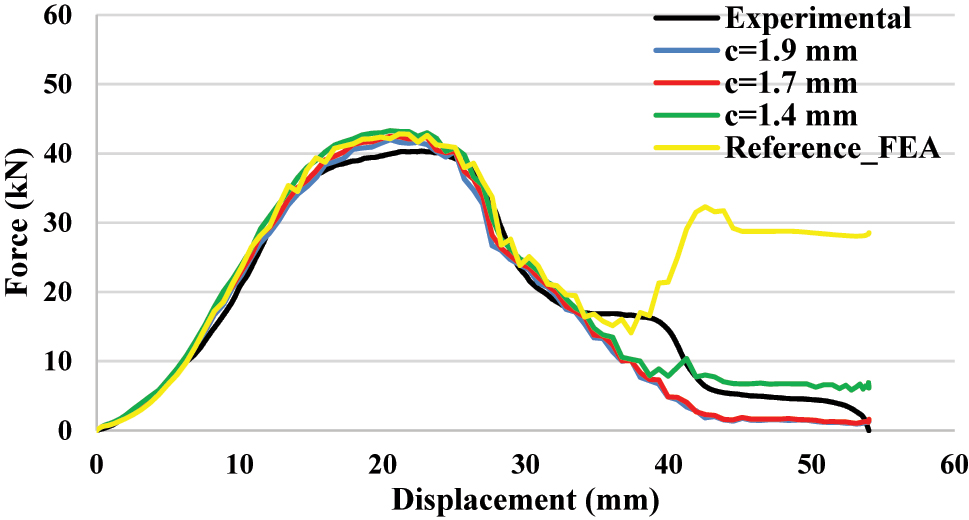
Die clearence ‘c’ effect on force–displacement curves of cup drawing process.
Still, it can be seen in Figure 7 that maximum force values are overpredicted with different die clearance values. For this reason, the friction situation is addressed to have a better agreement with the experimental data. For this purpose, the friction coefficient is used with three different values: 0.125, 0.11, and 0.1. In reference to finite element analyses, the friction coefficient was used as 0.125. Force–displacement curves with different friction coefficients are given in Figure 8. It can be clearly seen that maximum force values decrease when using a lower friction coefficient, and a friction coefficient of 0.1 is in good agreement with the experiment. For this reason, the friction coefficient is used as 0.1 for further finite element analyses.
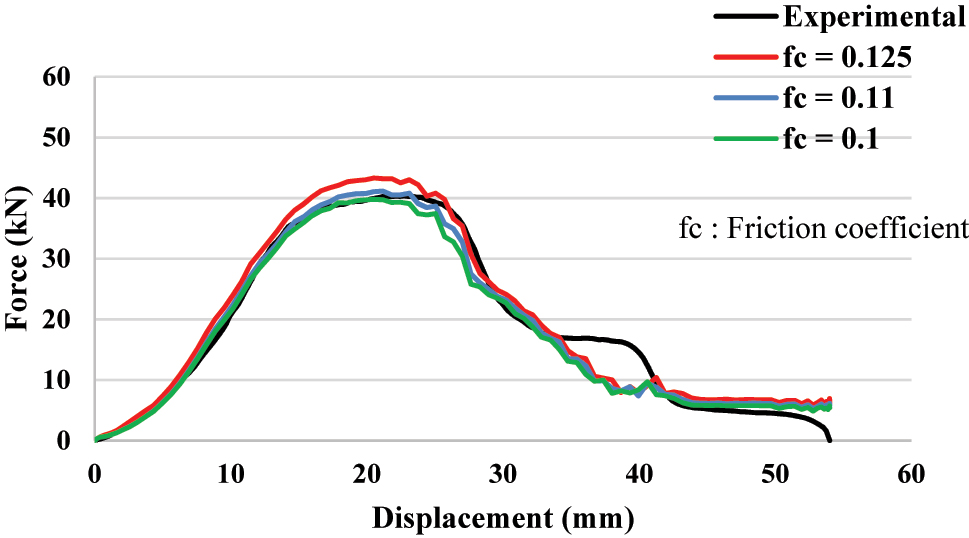
Friction coefficient effect on force–displacement curves of cup drawing process.
It is known that the finite element calculation parameters affect prediction results like process conditions [28], [29], [30]. For this situation, in the second part of the parametric study, time step size and termination time effects were investigated via force–displacement curves of the cup drawing process. The time step size roughly corresponds to the transient time of an acoustic wave through an element using the shortest characteristic distance [31]. For the shell elements, the time step size can be written by Eq.(5).
with L s: Characteristic length and c: Sound speed.
Sound speed can be calculated according to Equation (6).
In reference finite element analyses, the time step size was used as 0.0000012 s as a default, and in the parametric study, 0.00000012 s was used to decrease the time step size. Force-displacement curves for different time step size can be seen in Figure 9. It can be seen from the figure that the time step sizes does not have an efficient effect on punch force predictions.
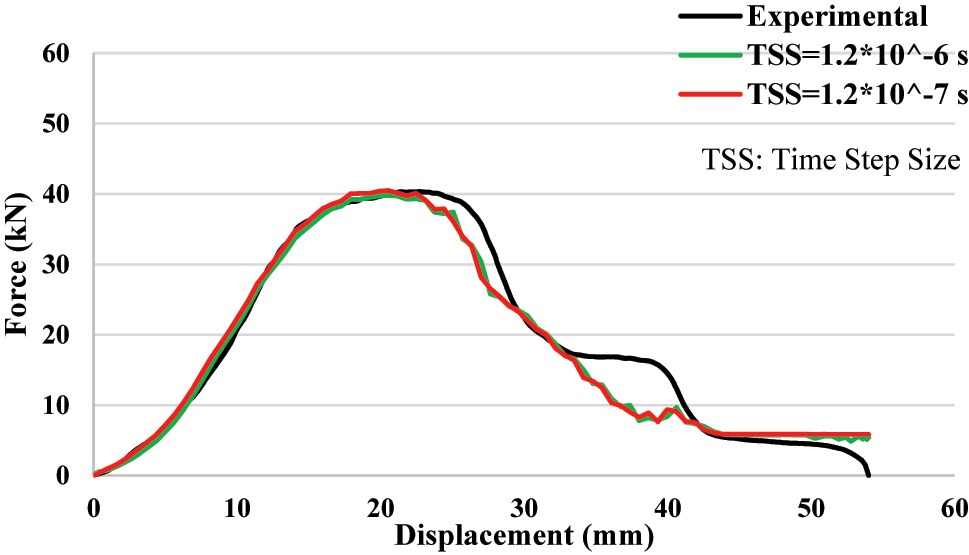
Time step size effect on force–displacement curves of cup drawing process.
The second variable is chosen as the termination time of the simulation. In reference simulation, punch movement was completed with 0.0324 s. For the parametric study, this time step was used as 0.0648 s and 1.13 s. Punch movement curves can be seen in Figure 10 for different termination times. Finite element analyses were performed for these values, and force-displacement curves are compared in Figure 11. It is seen that the increasing termination time causes a data increase, and the force–displacement curves show more vibrations. However, there is no influence on punch force values. As a result, 0.0324 s termination time was found suitable for further analyses since it saves an important amount of calculation time.
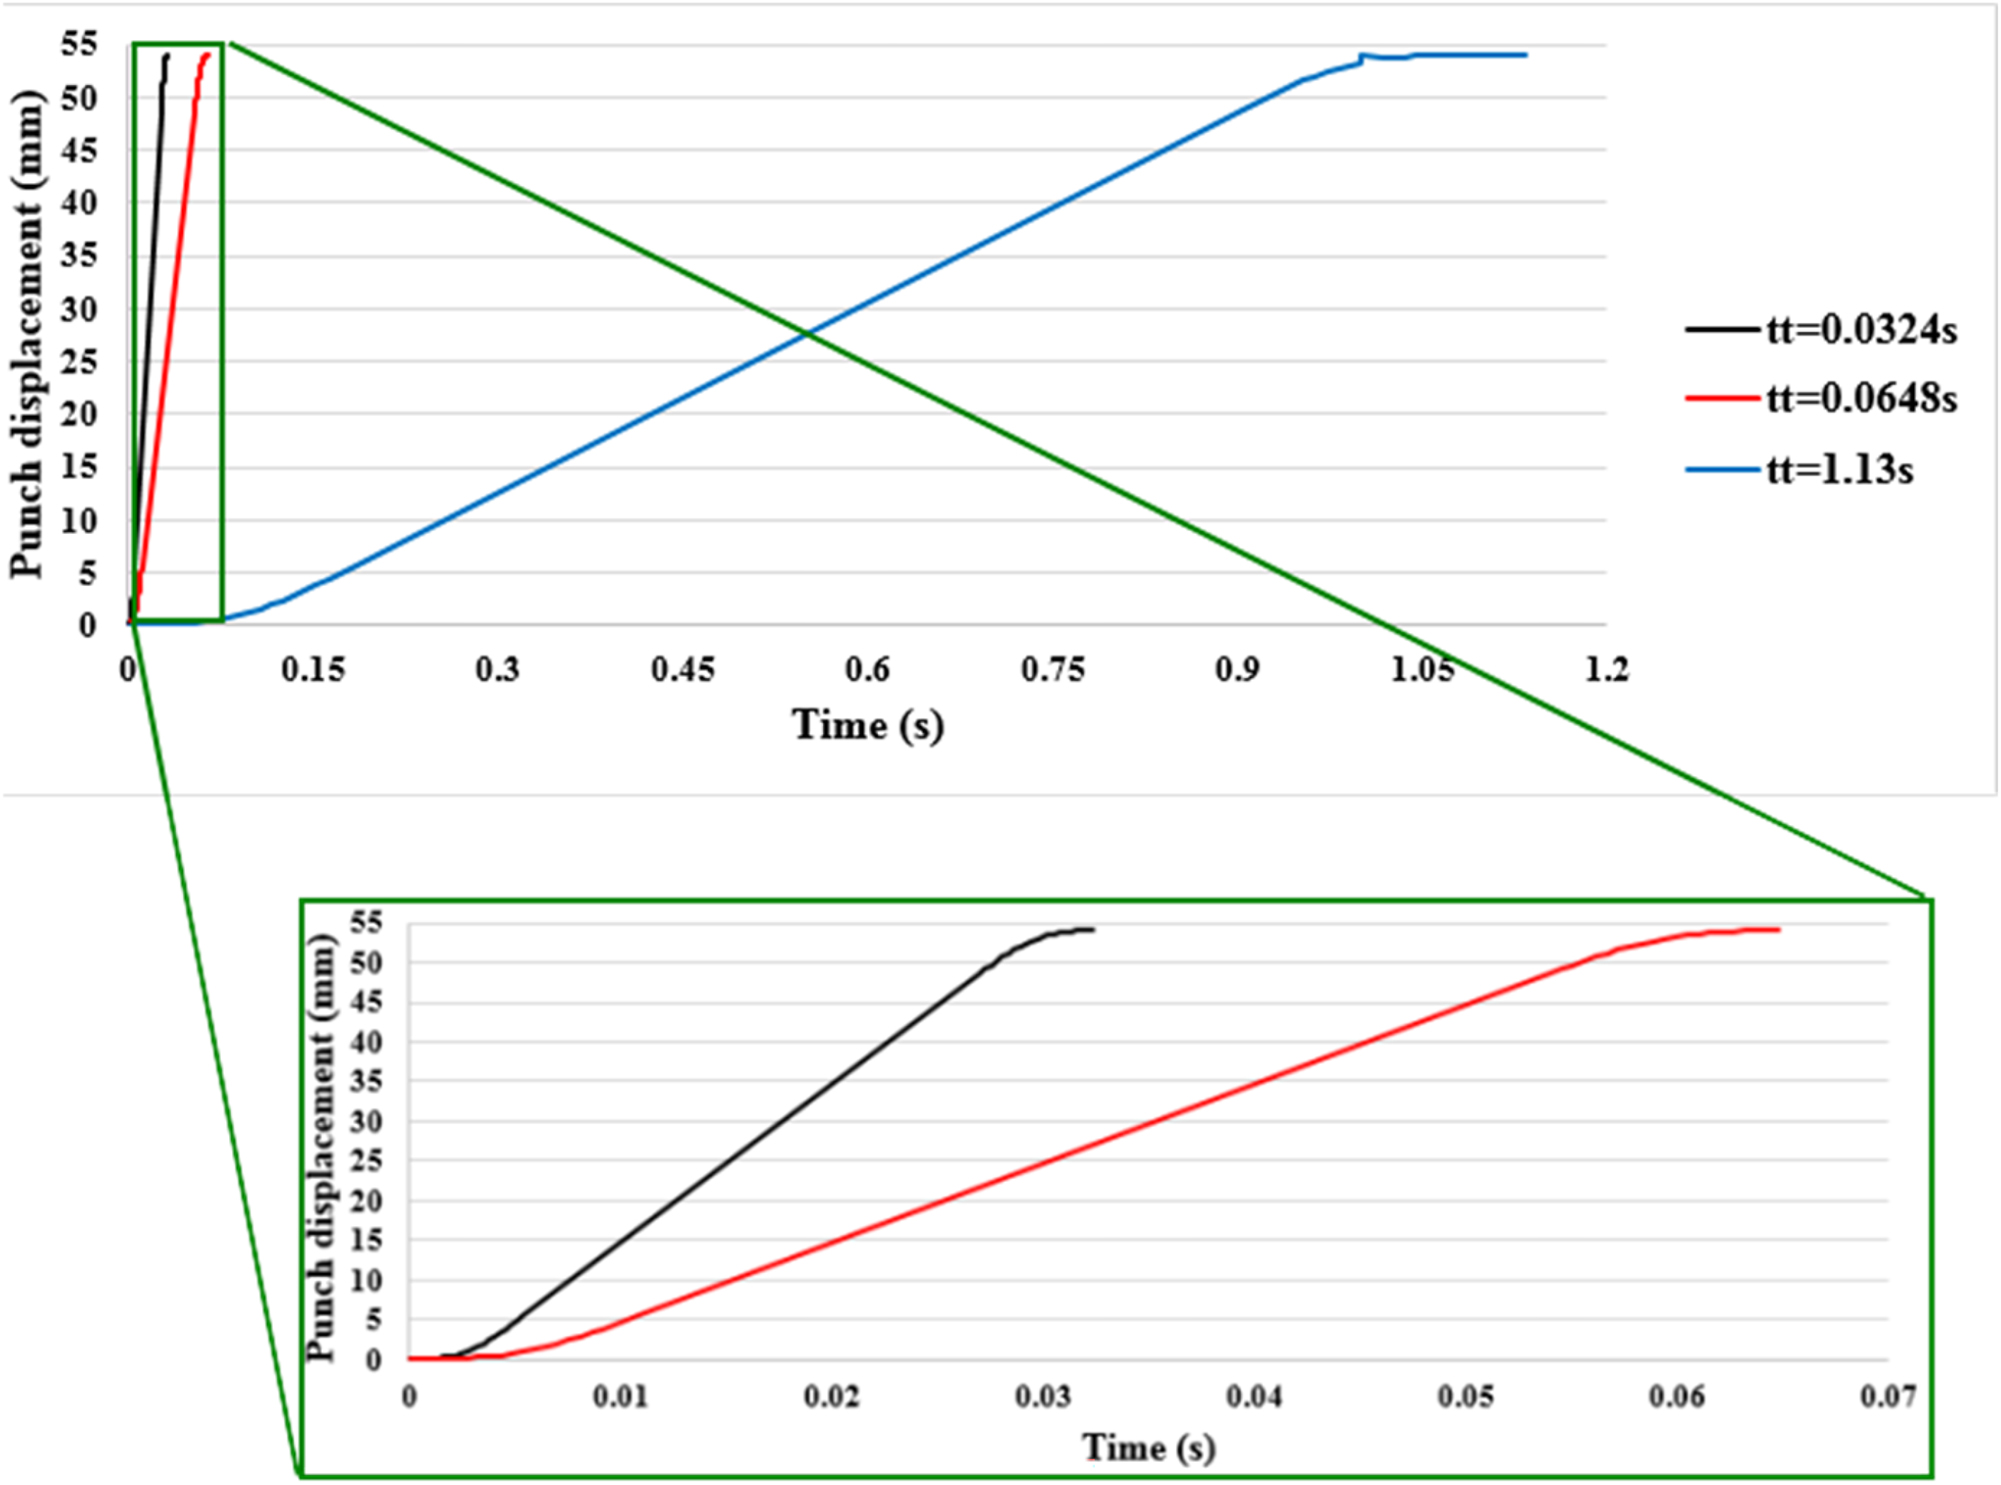
Punch displacement–time curves for different finite element termination. Time (tt).
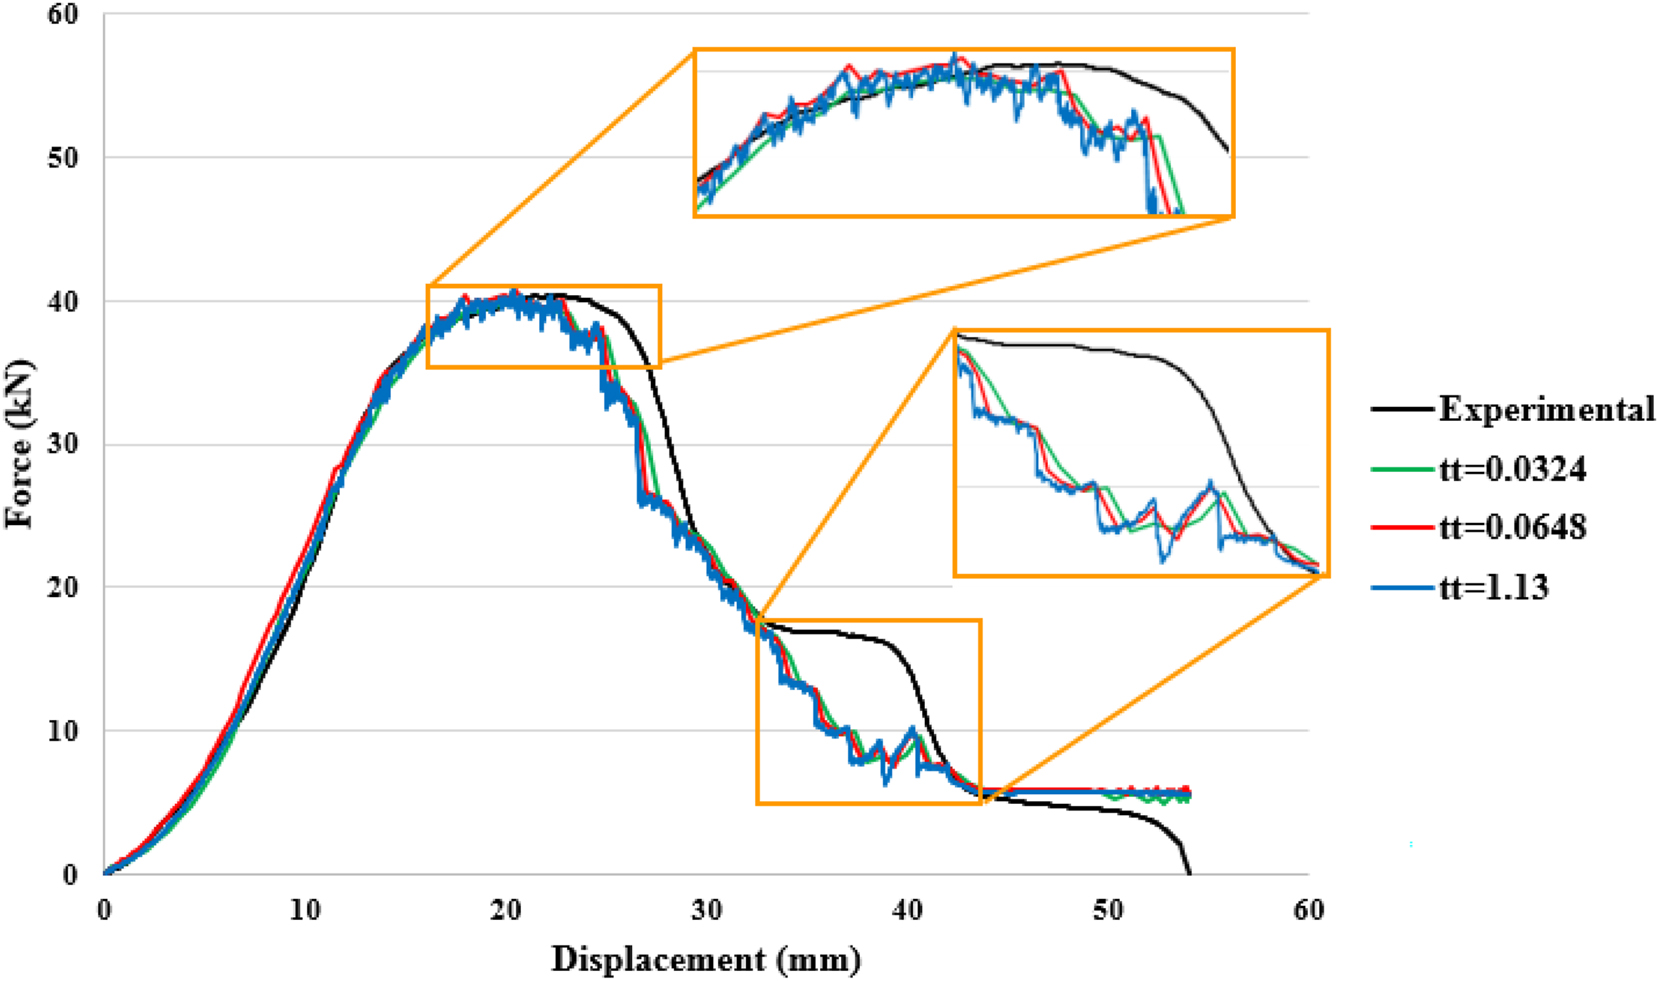
Termination time (tt) effect on force–displacement curves of cup drawing process.
As a result, the parametric study showed that the die clearance and the friction coefficient have an efficient effect on punch stroke; however, calculation parameters showed poor effort.
4 Conclusions
The study aimed to examine the effect of process and calculation parameters on the accuracy of finite element analysis results for cup drawing. Therefore, an application study was conducted using the Esaform-2021 cup drawing benchmark, with the goal of providing insights into how process parameters influence the accuracy of finite element analyses and suggesting ways to develop more realistic models to improve cup drawing predictions’ accuracy. Specifically, this study focused on predicting the force–displacement behavior of the 6016-T4 alloy cup drawing process through a parametric study based on process and finite element calculation parameters. As a result, an improved force–displacement curve named “optimized” was obtained and compared to reference results (Figure 12).
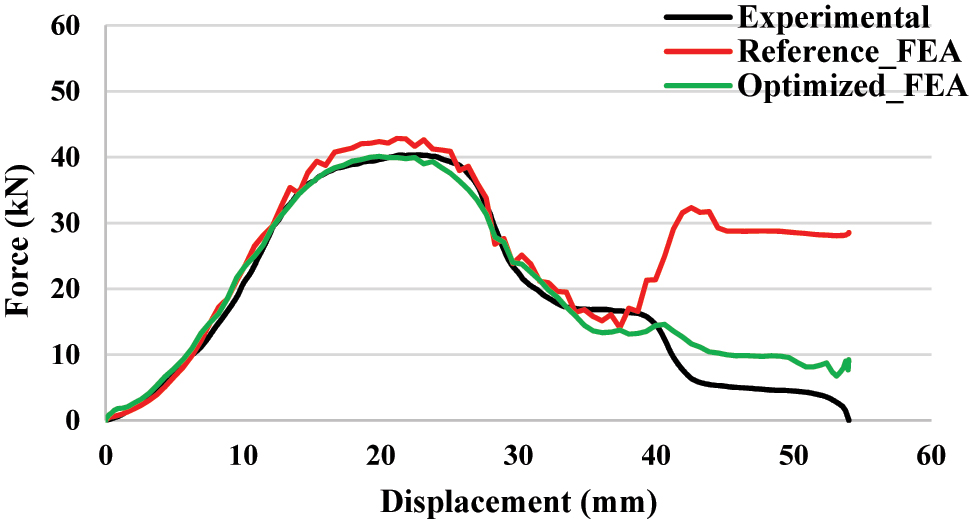
Comparison of force–displacement curves obtained with reference finite element analyses and finite element analyses after parametric study.
Based on the parametric study with plasticity model validation, these results were concluded:
Die clearance has a significant impact on punch force in finite element analyses. In this study, the material’s initial thickness was 0.9 mm, and it thickened by approximately 1.48 mm when flowing into the die cavity (initial clearance was 1.2 mm). This thickening caused an increase in punch force due to the blank stuck. A clearance of 1.4 mm performed well in finite element analyses compared to the experimental results for the cup drawing process used in this study.
The friction coefficient has a direct effect on punch force. Dry friction (μ = 0.125) and friction coefficients of μ = 0.11 and μ = 0.1 were studied to achieve agreement with experimental results. Using lower friction coefficients decreased punch force, and a value of μ = 0.1 matched the experimental results, particularly for the maximum force value.
The authors also investigated time step size and termination time as finite element calculation parameters. However, it was found that these parameters do not efficiently affect the finite element analysis results. Therefore, the parameters that brought the minimum solution time were specified and used.
About the authors
Dr. Emre Esener is Associate Prof. Dr at Bilecik Seyh Edebali University. He finished his Ph.D. thesis in Mechanical Engineering from Sakarya University in 2015. Finite element modeling, plasticity, mechanical testing, and sheet metal forming are his primary topics of interest.
Dr. Toros Arda Akşen is Assistant Prof. Dr. at the University of Sakarya. He finished his Ph.D. program in Mechanical Engineering at the University of Sakarya. Currently, he is a post-doctoral researcher at Aalto University as well. Ductile fracture, cyclic plasticity, anisotropic plasticity, and sheet metal forming are his primary topics of interest.
Dr. Mehmet Firat is a Professor at the University of Sakarya, Turkey. He received his Ph.D. in Mechanical Engineering from the University of Sakarya in 2003. His research interests include cyclic plasticity, fatigue, sheet metal forming, and computational mechanics.
-
Research ethics: Not applicable.
-
Informed consent: Not applicable.
-
Author contributions: All the authors have accepted responsibility for the entire content of this submitted manuscript and approved submission.
-
Use of Large Language Models, AI and Machine Learning Tools: None declared.
-
Conflicts of interest: The authors declare no conflicts of interest regarding this article.
-
Research funding: None declared.
-
Data availability: Not applicable.
References
[1] I. Salehinia and A. R. Shahani, “Effect of sheet anisotropy on the wear in deep-drawing process of a cylindrical cup,” Int. J. Mech. Sci., vol. 51, nos. 11–12, pp. 856–868, 2009, https://doi.org/10.1016/j.ijmecsci.2009.09.025.Search in Google Scholar
[2] H. J. Choi, K. J. Lee, Y. Choi, G. Bae, D. C. Ahn, and M. G. Lee, “Effect of evolutionary anisotropy on earing prediction in cylindrical cup drawing,” JOM, vol. 69, no. 5, pp. 915–921, 2017. https://doi.org/10.1007/s11837-016-2241-2.Search in Google Scholar
[3] M. Džoja, V. Cvitanić, M. Safaei, and L. Krstulović-Opara, “Modelling the plastic anisotropy evolution of AA5754-H22 sheet and implementation in predicting cylindrical cup drawing process,” Eur. J. Mech. A/Solids, vol. 77, 2019, Art. no. 103806, https://doi.org/10.1016/j.euromechsol.2019.103806.Search in Google Scholar
[4] B. Revil-Baudard, “Forming of materials with cubic crystal structure,” Proced. Manuf., vol. 47, pp. 1300–1307, 2020, https://doi.org/10.1016/j.promfg.2020.04.245.Search in Google Scholar
[5] F. Barlat, S. Panchanadeeswaran, and O. Richmond, “Earing in cup drawing face-centered cubic single crystals and polycrystals,” Metall. Trans. A, vol. 22, no. 7, pp. 1525–1534, 1991. https://doi.org/10.1007/BF02667366.Search in Google Scholar
[6] M. T. Tran, Z. Shan, H. W. Lee, and D. K. Kim, “Earing reduction by varying blank holding force in deep drawing with deep neural network,” Met., vol. 11, no. 3, 2021, Art no. 395, https://doi.org/10.3390/met11030395.Search in Google Scholar
[7] K. Ganesan, S. Sambasivam, and R. Ramadass, “Predicting and improving the novel process parameters involved in deep drawing process of Inconel 718 sheet at room temperature using hybrid DNN-SSO approach,” J. Strain Anal. Eng. Des., vol. 58, no. 8, pp. 633–648, 2023, https://doi.org/10.1177/0309324723117900.Search in Google Scholar
[8] Y. S. Khairnar, D. Deshmukh, K. Dhembre, G. Sawant, and A. Bhosale, “Review on optimization of process parameter in square shaped components in deep drawing process,” IOSR J. Mech. Civ. Eng., vol. 8, pp. 30–34, 2018.Search in Google Scholar
[9] M. Ipekoglu, O. Erbas, and H. Hassan, “Comparison of deep drawability of AA5754-H22 and AA6061-T6 aluminum alloys for automotive applications,” Mater. Test., vol. 59, nos. 11–12, pp. 1003–1008, 2017, https://doi.org/10.3139/120.111100.Search in Google Scholar
[10] O. Koowattanasuchat, N. Mahayotsanun, and S. Mahabunphachai, “Tearing defect maps for the deep drawing of AISI 304 rectangular cups,” Mater. Test., vol. 62, no. 8, pp. 769–774, 2020, https://doi.org/10.3139/120.111551.Search in Google Scholar
[11] E. Ünal and C. Özek, “A study on the wall thickness in the angular deep drawing process,” Mater. Test., vol. 59, no. 2, pp. 178–182, 2017, https://doi.org/10.3139/120.110980.Search in Google Scholar
[12] A. Singh, et al.., “Prediction of earing defect and deep drawing behavior of commercially pure titanium sheets using CPB06 anisotropy yield theory,” J. Manuf. Process., vol. 33, pp. 256–267, 2018, https://doi.org/10.1016/j.jmapro.2018.05.003.Search in Google Scholar
[13] E. Al-Momani and I. Rawabdeh, “An application of finite element method and design of experiments in the optimization of sheet metal blanking process,” JJMIE, vol. 2, no. 1, pp. 53–63, 2008.Search in Google Scholar
[14] S. W. Lee and D. Y. Yang, “An assessment of numerical parameters influencing springback in explicit finite element analysis of sheet metal forming process,” J. Mater. Process. Technol., vol. 80, pp. 60–67, 1998, https://doi.org/10.1016/S0924-0136(98)00177-0.Search in Google Scholar
[15] P. A. Prates, A. S. Adaixo, M. C. Oliveira, and J. V. Fernandes, “Numerical study on the effect of mechanical properties variability in sheet metal forming processes,” Int. J. Adv. Manuf. Technol., vol. 96, no. 1–4, pp. 561–580, 2018. https://doi.org/10.1007/s00170-018-1604-y.Search in Google Scholar
[16] J. Mackerle, “Finite element analyses and simulations of sheet metal forming processes,” Eng. Comput., vol. 21, no. 8, pp. 891–940, 2004, https://doi.org/10.1108/02644400410554371.Search in Google Scholar
[17] D. M. Neto, J. Coër, M. C. Oliveira, J. L. Alves, P. Y. Manach, and L. F. Menezes, “Numerical analysis on the elastic deformation of the tools in sheet metal forming processes,” Int. J. Solids Struct., vol. 100, pp. 270–285, 2016, https://doi.org/10.1016/j.ijsolstr.2016.08.023.Search in Google Scholar
[18] L. P. Moreira and G. Ferron, “Influence of the plasticity model in sheet metal forming simulations,” J. Mater. Process. Technol., vol. 155, pp. 1596–1603, 2004, https://doi.org/10.1016/j.jmatprotec.2004.04.269.Search in Google Scholar
[19] L. Lazarescu, I. Ciobanu, I. P. Nicodim, D. S. Comsa, and D. Banabic, “Effect of the mechanical parameters used as input data in the yield criteria on the accuracy of the finite element simulation of sheet metal forming processes,” Key Eng. Mater., vol. 554, pp. 204–209, 2013, https://doi.org/10.4028/www.scientific.net/KEM.554-557.204.D.Search in Google Scholar
[20] K. Hariharan, R. V. Prakash, and M. S Prasad, “Influence of yield criteria in the prediction of strain distribution and residual stress distribution in sheet metal formability analysis for a commercial steel,” Mater. Manuf. Process., vol. 25, no. 8, pp. 828–836, 2010, https://doi.org/10.1080/10426910903496847.Search in Google Scholar
[21] T. T. Luyen, T. B. Mac, T. L. Banh, and D. T. Nguyen, “Investigating the impact of yield criteria and process parameters on fracture height of cylindrical cups in the deep drawing process of SPCC sheet steel,” Int. J. Adv. Manuf. Technol., vol. 128, nos. 5–6, pp. 2059–2073, 2023, https://doi.org/10.1007/s00170-023-12022-8.Search in Google Scholar
[22] A. Sakash, S. Moondra, and B. L. Kinsey, “Effect of yield criterion on numerical simulation results using a stress-based failure criterion,” J. Eng. Mater. Technol., vol. 128, no. 3, pp. 436–444, 2016, https://doi.org/10.1115/1.2204951.Search in Google Scholar
[23] A. M. Habraken, et al.., “Analysis of ESAFORM 2021 cup drawing benchmark of an Al alloy, critical factors for accuracy and efficiency of FE simulations,” Int. J. Mater. Form., vol. 15, no. 5, 2022, Art no. 61, https://doi.org/10.1007/s12289-022-01672-w.Search in Google Scholar PubMed PubMed Central
[24] D. Y. Yang, D. W. Jung, I. S. Song, D. J. Yoo, and J. H. Lee, “Comparative investigation into implicit, explicit, and iterative implicit/explicit schemes for the simulation of sheet-metal forming processes,” J. Mater. Process. Technol., vol. 50, nos. 1–4, pp. 39–53, 1995, https://doi.org/10.1016/0924-0136(94)01368-B.Search in Google Scholar
[25] J. Rojek, E. Oñate, and E. Postek, “Application of explicit FE codes to simulation of sheet and bulk metal forming processes,” J. Mater. Process. Technol., vol. 80, pp. 620–627, 1998, https://doi.org/10.1016/S0924-0136(98)00169-1.Search in Google Scholar
[26] A. G. Mamalis, D. E. Manolakos, and K. E. Baldoukas, “Simulation of sheet metal forming using explicit finite-element techniques: effect of material and forming characteristics: Part 1. Deep-drawing of cylindrical cups,” J. Mater. Process. Technol., vol. 72, no. 1, pp. 48–60, 1997, https://doi.org/10.1016/S0924-0136(97)00128-3.Search in Google Scholar
[27] F. Barlat, et al.., “Plane stress yield function for aluminum alloy sheets – part 1: theory,” Int. J. Plast., vol. 19, no. 9, pp. 1297–1319, 2003, https://doi.org/10.1016/S0749-6419(02)00019-0.Search in Google Scholar
[28] R. H. DoddsJr, “Numerical techniques for plasticity computations in finite element analysis,” Comput. Struct., vol. 26, no. 5, pp. 767–779, 1987, https://doi.org/10.1016/0045-7949(87)90026-5.Search in Google Scholar
[29] P. Raut, “Impact of mesh quality parameters on elements such as beam, shell and 3D solid in structural analysis,” Int. J. Eng. Res. Appl., vol. 2, no. 6, pp. 99–103, 2012.Search in Google Scholar
[30] F. Cirak, M. J. Scott, E. K. Antonsson, M. Ortiz, and P. Schröder, “Integrated modeling, finite-element analysis, and engineering design for thin-shell structures using subdivision,” Comput. Aided Des., vol. 34, no. 2, pp. 137–148, 2002, https://doi.org/10.1016/S0010-4485(01)00061-6.Search in Google Scholar
[31] J. O. Hallquist, LS-DYNA Theory Manual, Livermore Software Technology Corporation, 2006, [Online] Available at: https://ftp.lstc.com/anonymous/outgoing/jday/manuals/lsdyna_theory_manual_2006.pdf [accessed: Feb. 2, 2025].Search in Google Scholar
© 2025 the author(s), published by De Gruyter, Berlin/Boston
This work is licensed under the Creative Commons Attribution 4.0 International License.
Articles in the same Issue
- Frontmatter
- Effect of flush grinding on corrosion fatigue behavior of step-aged 7020 aluminum alloys
- Bending behavior of corrugated sandwich panels with various core shapes
- Comparison of crash performance of auxetic structures for CF15, PA6/GF30, and GF30PP materials
- Combined effect of ball milling and high-pressure torsion on mechanical properties of Al2O3/Al composite
- Liquid metal embrittlement susceptibility of galvanized advanced high strength steel with high manganese content
- Kinetic study on nickel aluminides formed on Monel 400 alloy
- Finite element simulation of natural gas pipelines in service welding repair
- Biomechanical effects of material selection and micro-groove design for dental implants
- Design, FEA and experimental validation of 3D-printed PLA/PCL intervertebral cages for lumbar spinal fusion
- Effect of tool tilt angles on the formation of YSZ/Al2O3 hybrid surface composites on friction stir processed magnesium alloy AZ31
- Coating of AISI 304 stainless steel surface with addition of Cr3C2 to NiCrCo medium entropy alloy powder
- Numerical and analytical stress analysis for a FGM beam
- Mechanical and wear behaviour of hybrid AA8011 metal matrix composite reinforced with aluminum silicate and titanium dioxide
- A new neural network–assisted hybrid chaotic hiking optimization algorithm for optimal design of engineering components
- Cup drawing predictions for a 6016-T4 aluminum alloy