Bending behavior of corrugated sandwich panels with various core shapes
-
Seçil Ekşi


Abstract
The corrugated core sandwich structure consists of a corrugated sheet between two thin face sheets. Due to their high stiffness-to-mass ratio, metal sandwich panels in corrugated structures are an attractive industrial solution as structural components. Corrugated sandwich panels are often preferred in many applications since they are easy to manufacture process and low cost. The bending characteristics of aluminum corrugated sandwich panels with cores of various shapes subjected to three-point bending are investigated numerically in this paper. The core shapes are square, Y-form, trapezoid, diamond, triangle, sinusoid, hexagon, and symmetric Y-form. According to the numerical results, the symmetric y-form model showed optimum values for specific load-carrying capacity (SLCC) and specific energy absorption capacity (SEAC). The model that gives the optimum values by revising the symmetric y-form model has been determined. The revised model’s specific load-carrying capacity (SLCC) increased from 101.31 N·gr−1 to 106.89 N·gr−1. The specific energy absorption capacity (SEAC) increased from 3.14 J·gr−1 to 3.71 J·gr−1. It has been observed that the reduction of the section moment of inertia is also an essential factor in the collapse behavior of sandwich structures.
1 Introduction
As is known, sandwich structures, which are preferred over monolithic structures due to their high rigidity/weight ratio, stability under compressive forces, and superior acoustic properties, mainly consist of two thin, solid surface layers and a low-density core. In addition to cellular materials such as foam, lattice beams, honeycomb, or corrugated structures are used in the core section [1], [2], [3], [4], [5], [6], [7], [8], [9], [10]. Corrugated structures are essential because of their relatively easy manufacturing process and low cost. A corrugated-core sandwich panel typically comprises a corrugated sheet between two thin skins. A principal feature of this type of structure is its high strength-to-weight ratio.
The corrugated core keeps the skins apart and stabilizes the components by resisting vertical forces. This design enables the complete structure to act as a single thick plate under its high shear strength [11]. Corrugated sandwich structures are superior to hexagonal (honeycomb) sandwich panels, foam sandwich panels, and lattice sandwich panel structures due to their two-dimensional repeating periodic feature and mechanical performance. These corrugated structures have a significant specific load-carrying capacity and high bending and torsional performance [12], [13], [14], [15], [16], [17]. Moreover, thanks to their shear strength, the fact that the corrugated structure acts like a thick plate under strain offers an important privilege among sandwich structures. Due to their advantages, corrugated structures have areas of use in construction and marine structures, especially in aviation. Studies on the behavior of corrugated sandwich structures used in the manufacture of hull plates subjected to plane loads (such as hydrostatic pressure and impact) and local impact loads (such as collision, impact of floating objects on the surface, and impact of falling weight) under bending and compression and local impact at low speeds are increasing day by day [18], [19], [20], [21].
Xia et al. [22] studied corrugated beams’ longitudinal and transverse bending behaviors. They compared corrugated beams with other cellular structures such as auxetic, foam and honeycomb sandwich beams. They reported that corrugated beams’ energy absorption and bending strength in the transverse direction were several times lower than those in the longitudinal direction. Tilbrook et al. [23] studied the dynamic response of corrugated and Y-frame sandwich panels using SHPB. They evaluated the influence of inertial stabilization and shock wave effect at different loading speeds. Lu et al. [24] described four failure mechanisms (i.e., yielding in face and core, buckling face, and core buckling) and proposed failure criteria for triangular corrugated sandwich panels under bending. Based on the study, Valdevit et al. [24], [25] constructed fracture maps for supported triangular corrugated sandwich beams subjected to transverse and longitudinal three-point bending. Kazemahvazi [26] conducted experimental studies on hierarchical core corrugated sandwich panels and found that hierarchical structures have higher specific strength than their monolithic counterparts, which he attributed to the buckling resistance of the sandwich core. He also emphasized that the density of the core is an essential parameter in terms of the structure’s anti-impact ability. Another study investigated the impact resistance of corrugated structures with different geometries for ship-side hulls. The comparison between the proposed auxetic-based structures and the traditional ship hull side structures (double hull, X-core, and Y-core) indicated that the proposed side structures exhibit superior energy absorption and collision resistance capabilities and thus have the potential to be applied in protective structures [27].
As a result of the literature review, the bending behavior of sandwich panels with corrugated structures has not been sufficiently investigated in the literature. This study investigated the three-point bending behavior of corrugated sandwich panels with different geometries. As a result of the analysis, the structure that gives the optimum values will be determined, and necessary revisions will be made to this structure.
2 Simulation
2.1 Validation
In this section, a square aluminum tube was used to validate the finite element analysis of sandwich panels. The tube material is AA 6063-T832 aluminum alloy. The tube structure has 40 × 40 mm section dimensions and 1.5 mm wall thickness. Its length is 320 mm. The specimen was removed from the tube structure for a tensile test by ASTM-E8, and the tensile test was performed on an Instron test machine with a capacity of 5 tons. Strain values were measured with a video extensometer during the test. Data obtained from tensile tests for tube material were used in finite element analysis. The elastic modulus of aluminum alloy is 71 GPa; the yield strength is 280 MPa, the tangent modulus is 500 MPa, and the poison ratio is 0.33. The point-bending finite element analysis model of square section tube structure is given in Figure 1. ANSYS program was used for analyses. The model created for three-point bending analysis was designed as quarter symmetry. The mandrel and supports are defined as rigid structures. Since the problem involves large deformation, the nonlinear geometry feature is enabled during the analysis. Mesh sensitivity analysis is also performed. The friction coefficient between the contacting surfaces is taken as 0.2. The sandwich panels are modeled using a 3D 20-node solid element (Solid186). Figure 2 shows the load-displacement curves obtained from the three-point bending test and finite element analysis of the tube structure. It is seen that the maximum load value is almost convergent for an element size of 2 mm. Therefore, an element size of 2 mm with element number 3280 is considered in the validation analysis. As seen in this figure, both curves initially show excellent agreement up to and beyond the elastic regime, and the calculated peak load is less than a 1.5 % difference between the experiment and the analysis.
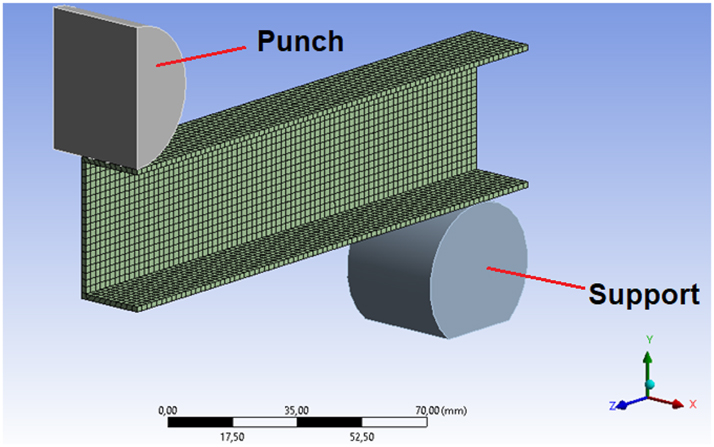
Quarter symmetry finite element simulation validation model.
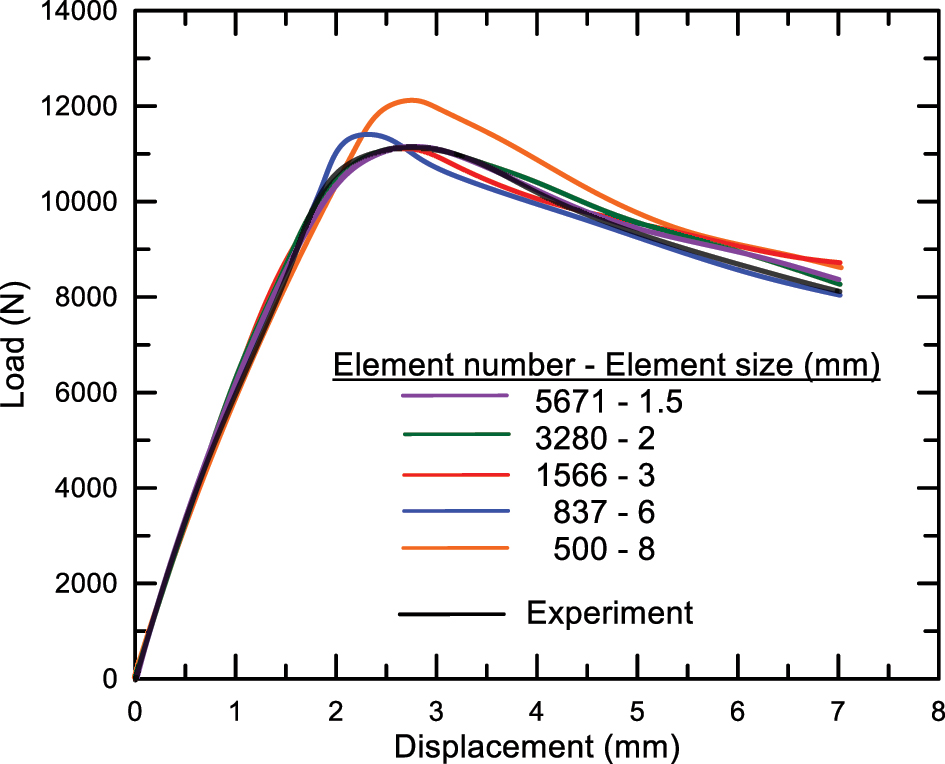
Sensitivity analysis of finite element model of square tube structure with different mesh sizes.
2.2 Finite element simulation
In this section, finite element analyses of corrugated sandwich panels with various core shapes were carried out using the aluminum alloy material used in the validation study. Square, Y-form, trapezoid, diamond, triangle, sinusoid, hexagon, and symmetric Y-form geometries are the core shapes. In the design of sandwich panels, attention was paid to ensure that the weights of the panels were almost the same. In addition, considering the production situation, the panel’s outer surface and inner core were modeled as a single piece, not separately, to provide ease of work and cost. The finite element models of three-point bending analysis for symmetric Y-form sandwich panels are given in Figure 3. The overall dimensions of sandwich panels are 64 mm × 180 mm × 20 mm. The sheet thickness is 1 mm. Cross-sectional views of sandwich panels are shown in Figure 4. Finite element analyses were carried out using the ANSYS program. Nonlinear analyses were performed. Sandwich panels were modeled using a 3-D 20-node solid element (SOLID186). The mesh size is 2 mm. An elastic-plastic bi-linear material model with the material properties (Young’s modulus, yield strength, and hardening modulus) provided in Section 2 is adopted in the simulation. Material properties of aluminum alloy are given in Table 1.
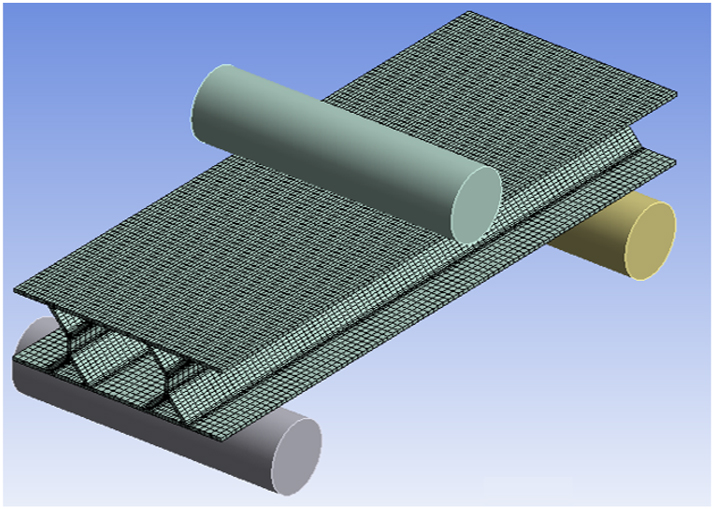
Finite element model of the three-point bending test.
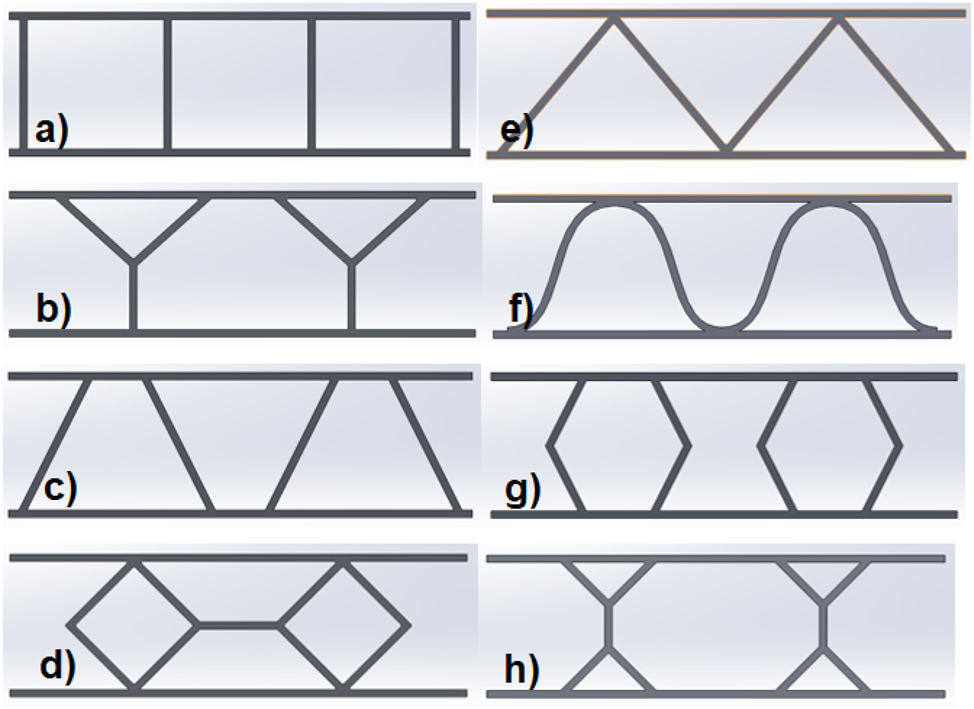
Models of the cross-sections of corrugated sandwich panels a) square, b) Y-form, c) trapezoid, d) diamond, e) triangle, f) sinusoid, g) hexagon, h) symmetric Y-form.
Elastic and plastic material properties of stainless steel and aluminum alloy.
| Material | Density (kg·m−3) | Poisson’s ratio | Young’s modulus (GPa) | Yield strength (MPa) | Tangent modulus (MPa) |
|---|---|---|---|---|---|
| Aluminium alloy | 2.770 | 0.33 | 71 | 280 | 500 |
3 Simulation results
3.1 Finite element analyses of sandwich panels
Load-displacement curves obtained from finite element analyses of sandwich panels with eight different geometries are given in Figure 5-a. Three different bending behaviors come to the fore when the plots are examined in Figure 5-b. In type A behavior, the load decreases monotonically after reaching the maximum value. In type B, the curve shows a plateau regime after a specific decrease after the maximum value. Finally, in type C, the curve exhibits a plateau regime after the maximum load value, with a tendency to increase after a partial decrease.
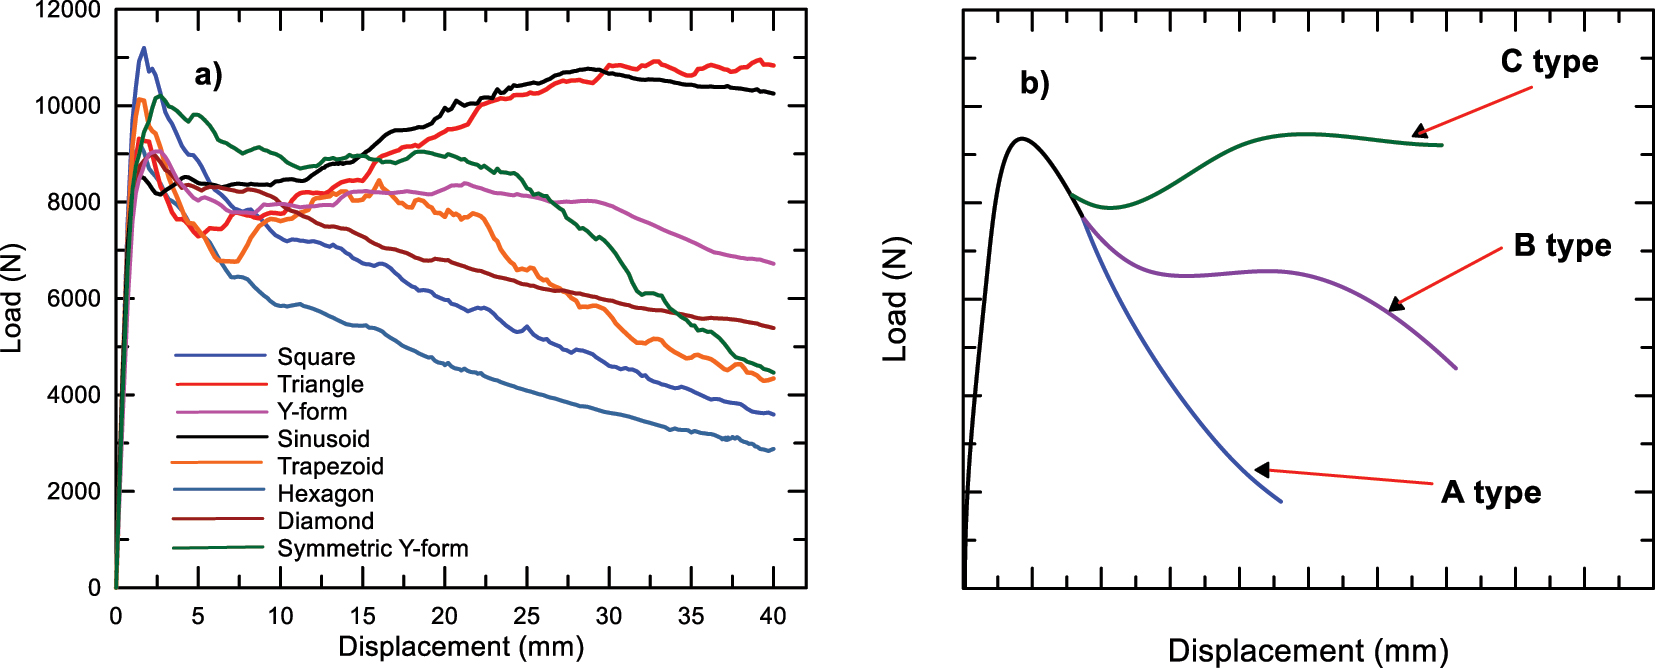
Load-displacement curves of sandwich panels, a) load-displacement curves of all panels, b) schematic load-displacement curves characterizing the three main bending behaviors.
The bending response of square, hexagon, and diamond panels decreases after the displacement value at which the maximum load is reached, as seen in Figure 5-a. It has been observed that the load values are constantly decreasing without any increase. In Group B, Y-form, trapezoid, and symmetric Y-form panels, the load decreases slightly with a low slope and then shows a plateau regime after the displacement where the load reaches its maximum value. In subsequent displacements, the decrease in load is relatively slower. Group C, sinusoid, and triangle panels, on the other hand, show that the load value reaches a plateau regime by showing an increasing trend after some decrease and maintains this behavior. Simulation results for sandwich panels are given in Table 2. Load-displacement graphs for three different types of sandwich panels are given in Figure 6.
Simulation results for sandwich panels.
| Specimen core type | Fmax (N) | Weight (g) | Specific load capacity (SLC) (N·g−1) |
Energya (J) | Specific absorbed energy (SAE) (J·g−1) |
|---|---|---|---|---|---|
| Hexagon | 9,239.8 | 105.45 | 87.62 | 187.83 | 1.78 |
| Triangle | 9,310.2 | 107.05 | 86.97 | 328.40 | 3.07 |
| Square | 11,195 | 97.20 | 115.17 | 235.23 | 2.42 |
| Y-form | 9,051.6 | 96.81 | 93.50 | 312.65 | 3.23 |
| Sinusoid | 8,533.1 | 108.4 | 78.72 | 315.20 | 2.91 |
| Trapezoid | 10,129 | 101.33 | 99.96 | 246.20 | 2.43 |
| Diamond | 8,924.2 | 118.9 | 75.06 | 261.18 | 2.20 |
| Symmetric Y-form | 10,208 | 100.76 | 101.31 | 316.02 | 3.14 |
-
aEnergy values are calculated up to 40 mm displacement.
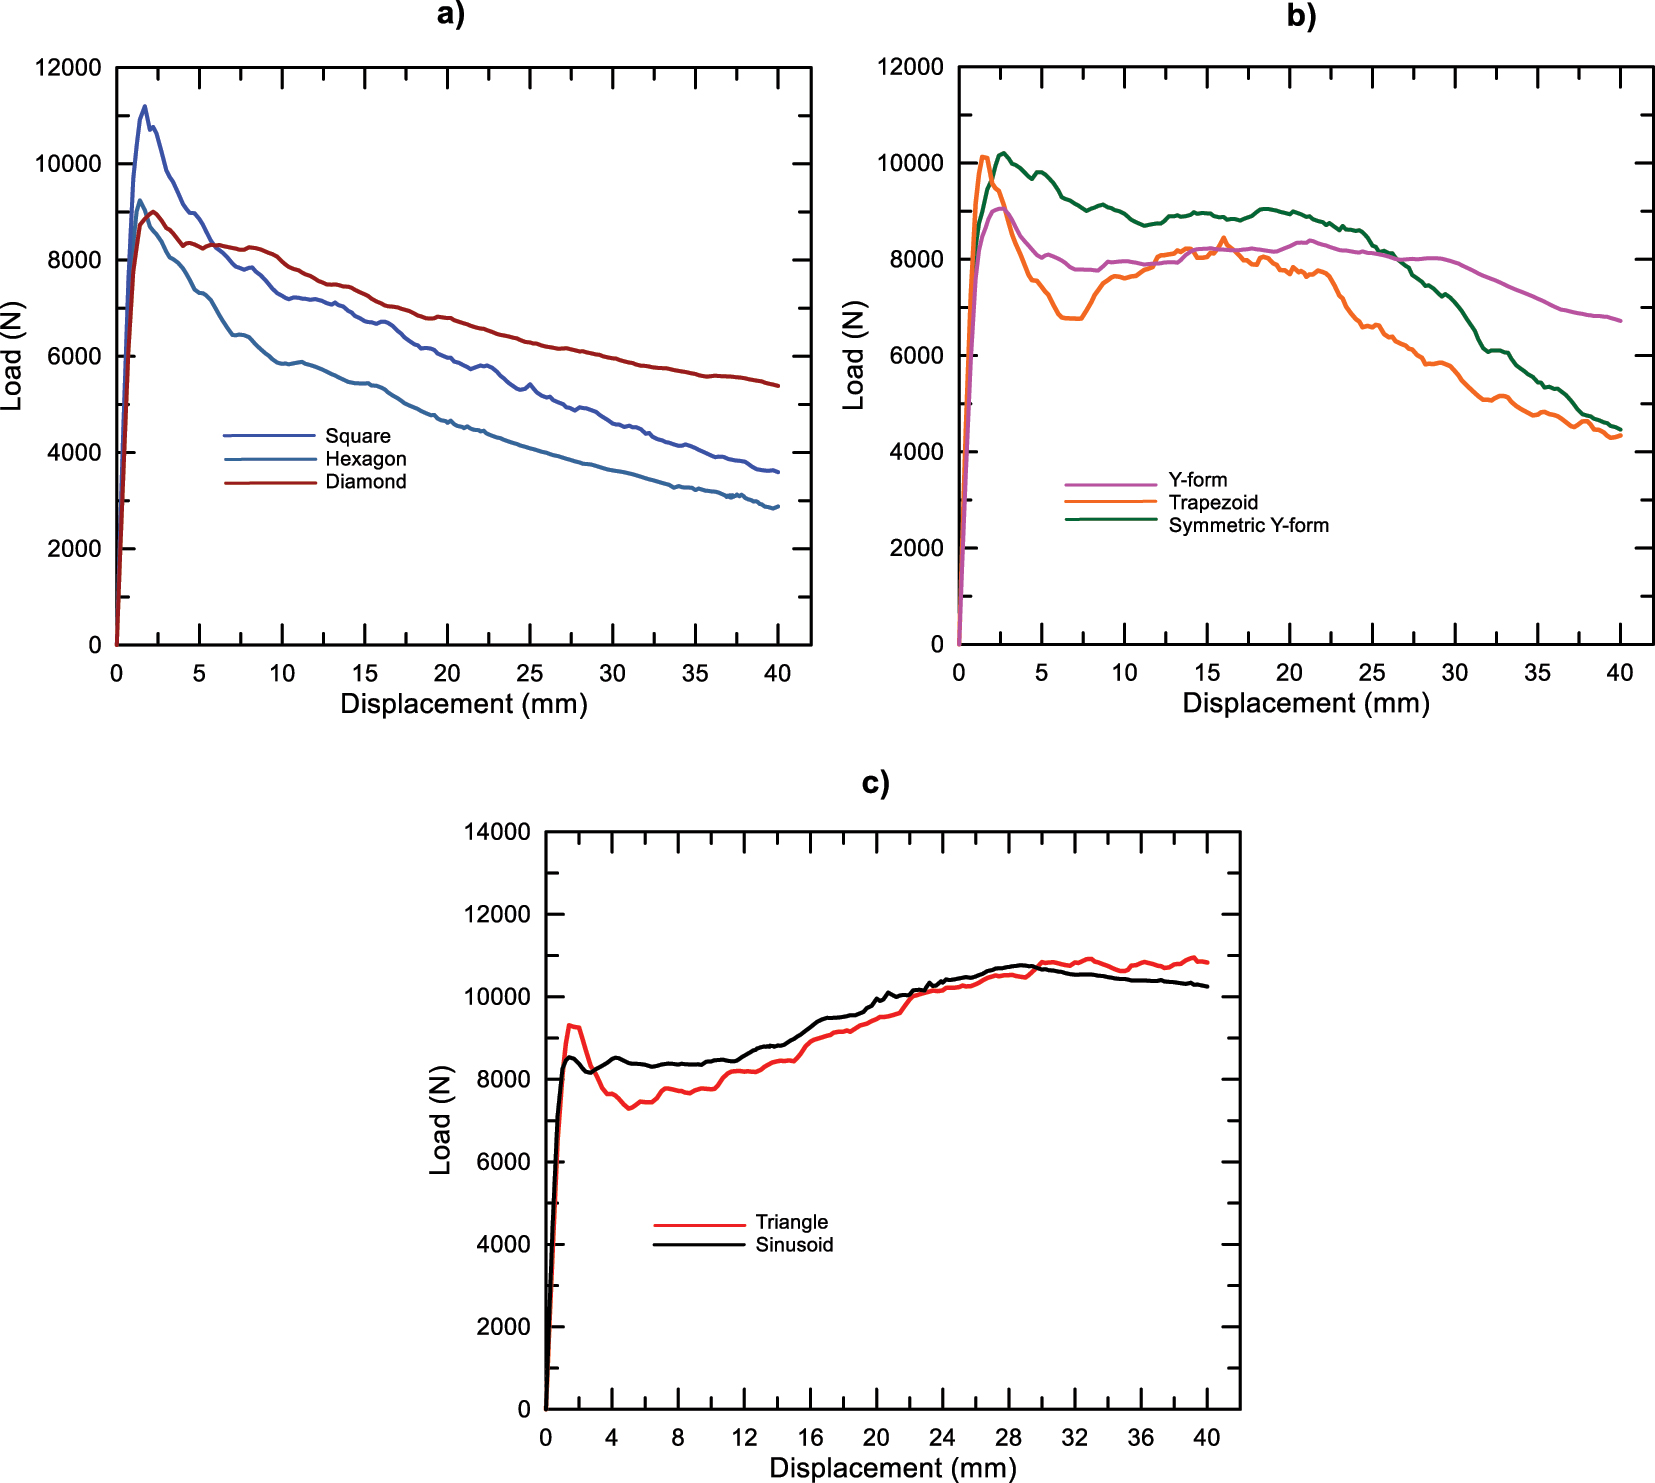
Load-displacement curves of specimens, a) type A, b) type B, c) type C.
A comparison was made to evaluate sandwich panels according to specific load-carrying and specific energy absorption values. Since the aim here is both high load-carrying, energy absorption capacity, and low panel weight, it would be more helpful to look at specific values. Table 2 and Figure 6 show that the highest specific load-carrying capacity was seen in the square panel, and the lowest value was in the diamond panel. The highest specific energy absorption capacity was obtained in the Y-form, and the lowest value was obtained in the hexagon model. However, since it would be more meaningful to find the model in which both SLCC and SEAC are optimum, the symmetric y-form model provided the most optimum values. As a result, the symmetric Y-form gave the best result in terms of both specific load-carrying capacity and specific energy absorption capacity. Von-Mises stress distributions at different displacements for one model selected from three groups are given in Figures 7, 8, and 9.
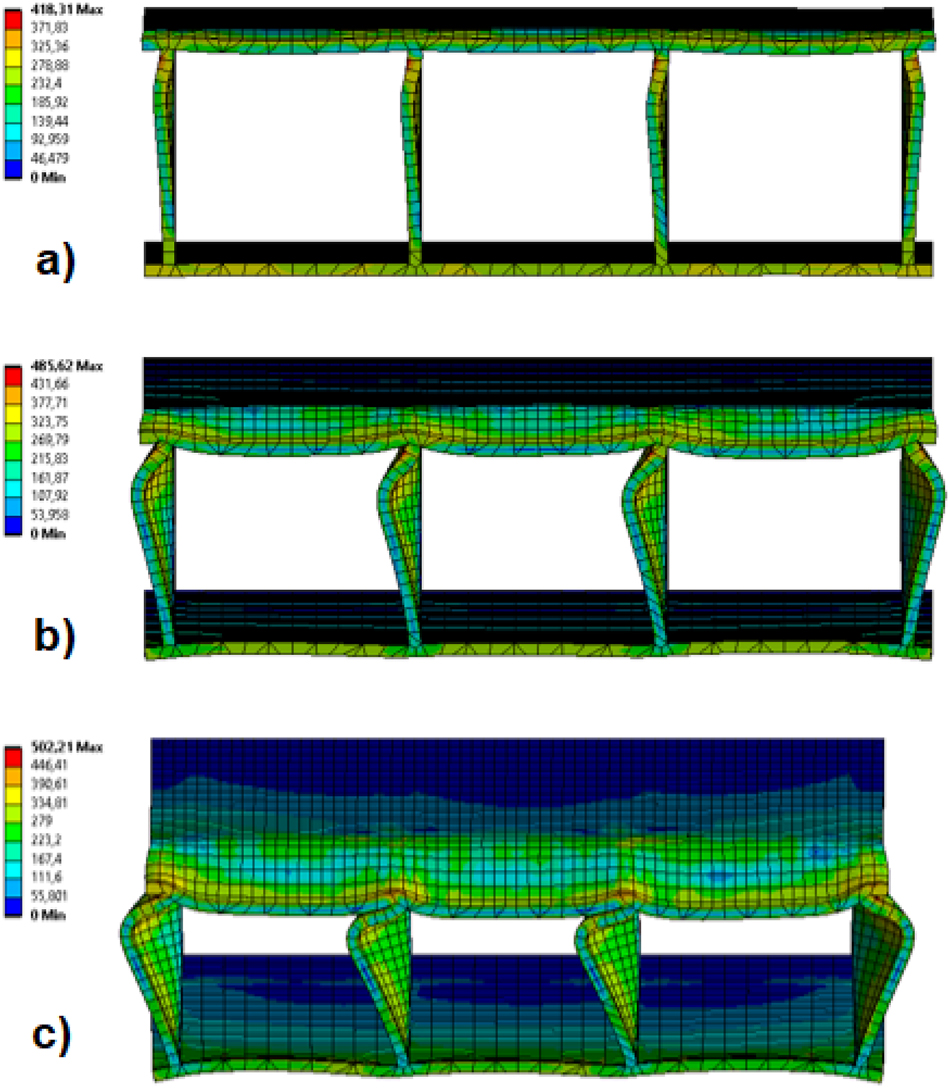
Von-Mises stress distribution of square corrugated sandwich panel at various displacements, a) 5 mm, b) 10 mm, c) 15 mm.
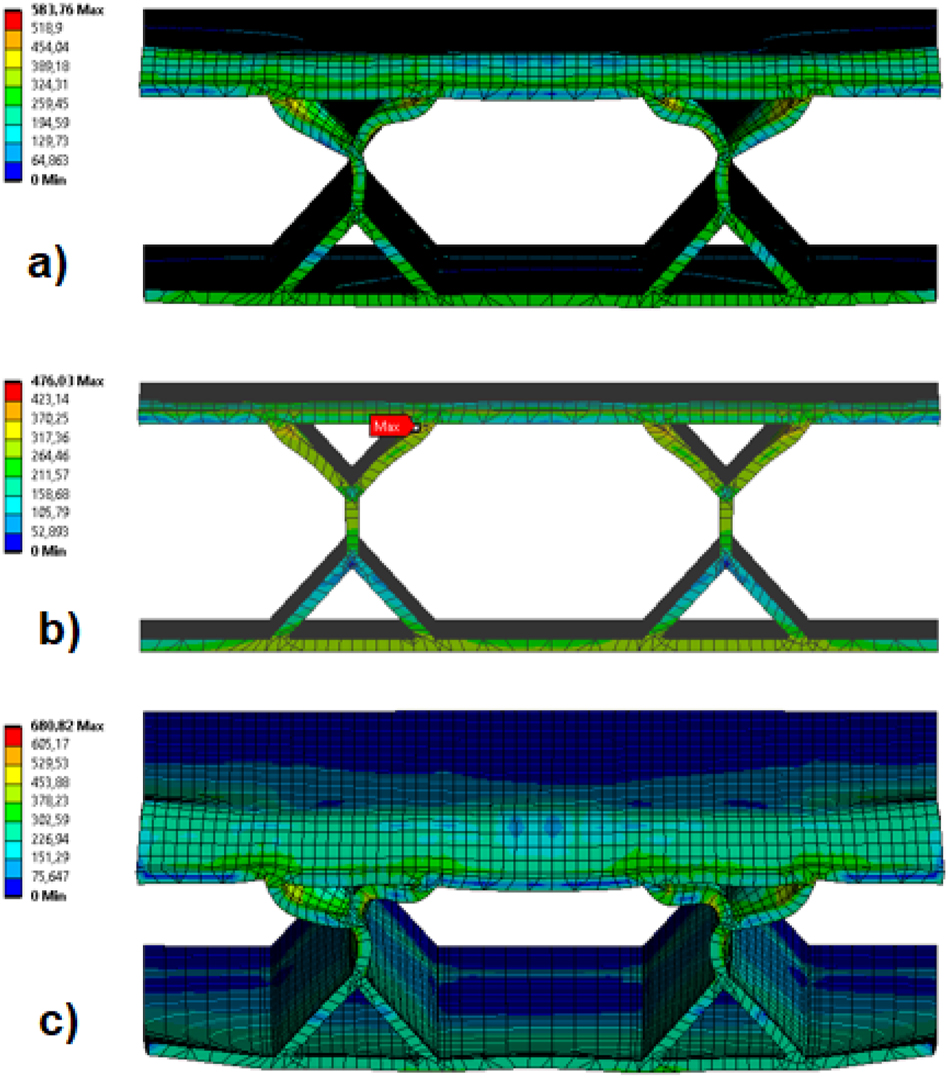
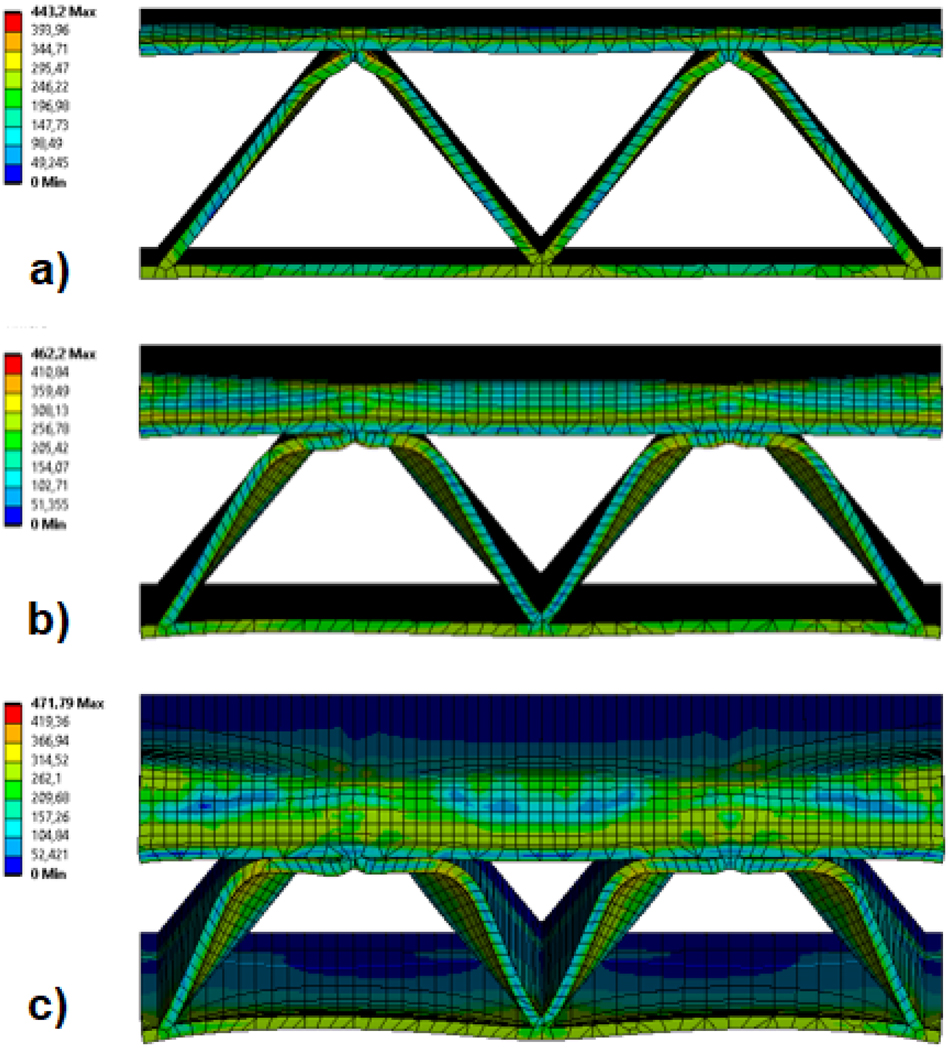
Von-Mises stress distribution of symmetric Y-form corrugated sandwich panel at various displacements, a) 5 mm, b) 10 mm, c) 15 mm.
Von-Mises stress distribution of triangle corrugated sandwich panel at various displacements, a) 5 mm, b) 10 mm, c) 15 mm.
3.2 Revision of optimum sandwich panel
The symmetrical Y-form sandwich panel gave the optimum result from the finite element analysis results. In this part of the study, geometric modifications were made to the symmetrical Y-form model to increase the specific load-carrying and energy absorbing capacities. New designs were created by changing the h and H values shown in Figure 10 in the modified panel.
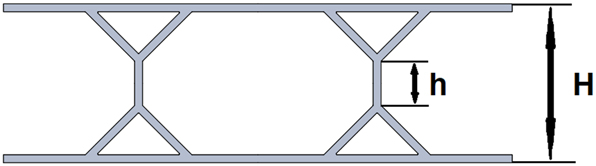
Symmetric y-form sandwich panel.
Figure 11 shows the load-displacement curves obtained from analyzing the two new modified models and the original panel. The h·H−1 ratio is 0.25 in the original model. The h·H−1 ratios of the newly created models are 0.30 and 0.35. The model with the highest load-carrying capacity and energy absorption capacity is the model with the h/H value of 0.30. When the curves are examined, it is seen that after the displacement at maximum load, when the deformation continues, the load values decrease slightly and then continue at the constant load value, showing a plateau regime.
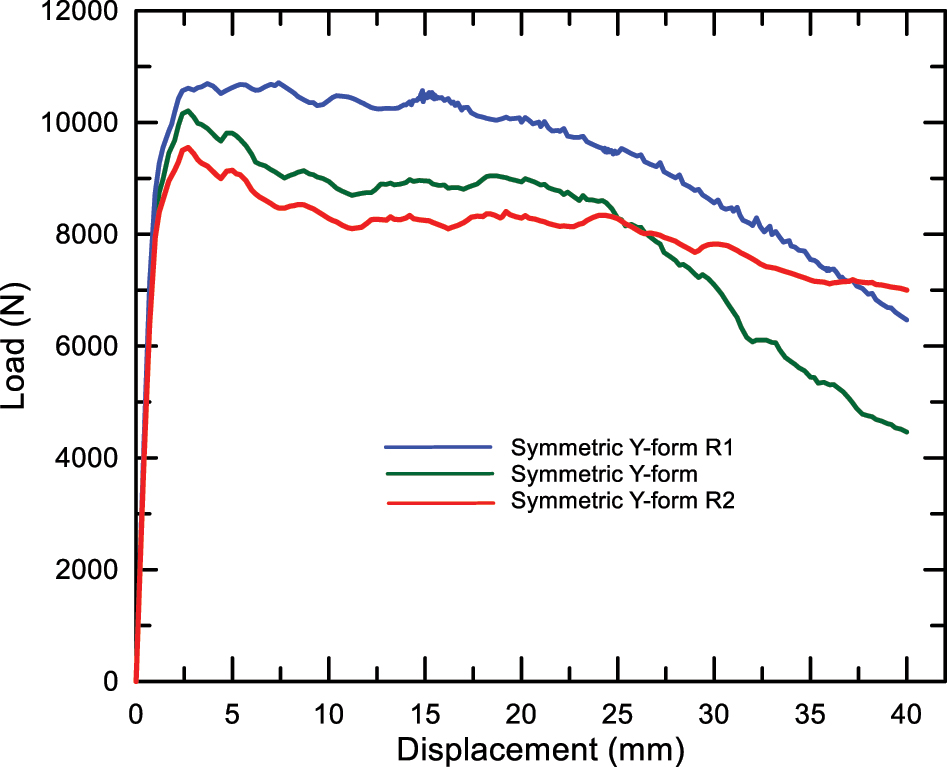
Load-displacement curves of symmetric Y-form and two revised models.
As the plateau regime’s load range increases, the sandwich panel’s load-carrying capacity increases accordingly. The plateau regime is shown schematically in the load-displacement curve in Figure 12. The plateau load is expressed as Fp. As shown in the table, when the Fp·Fmax −1 ratio is increased, the LCC and EAC values of the panel also increase. As a result of the revisions made to the symmetric Y-form model, the symmetric Y-form R1 model has emerged as the highest Fp·Fmax −1 ratio. Therefore, the optimum model is the Double Y-R1 design.
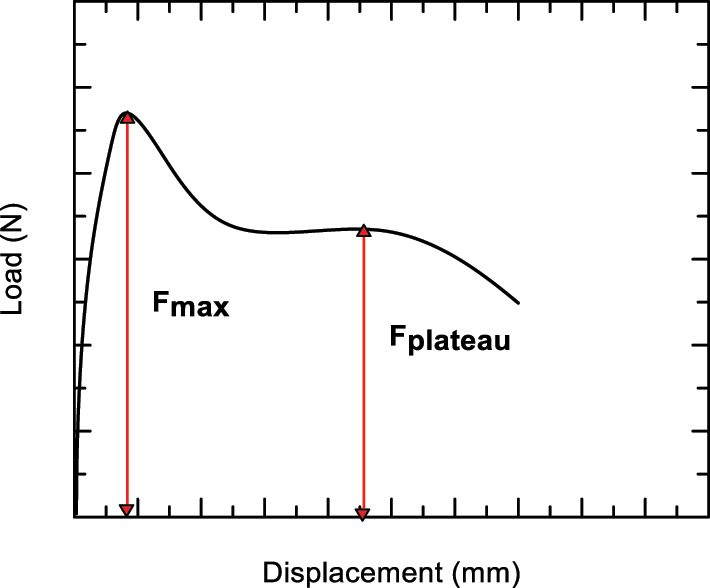
Schematic view of Fmax and Fplateau.
Simulation results of the optimized model are given in Table 3.
Simulation results of the optimized model.
| Specimen core type | Fmax (N) | Weight (g) | Specific load capacity (SLC) (N·g−1) | Energya (J) | Specific absorbed energy (SAE) (J·g−1) |
|---|---|---|---|---|---|
| Symmetric Y-form | 10,208 | 100.76 | 101.31 | 316.02 | 3.14 |
| Symmetric Y-form R1 | 10,710 | 100.20 | 106.89 | 371.80 | 3.71 |
| Symmetric Y-form R2 | 9,551.6 | 100.02 | 95.50 | 320.43 | 3.20 |
-
aEnergy values are calculated up to 40 mm displacement.
Simulation results of the optimized models are given in Table 4. If the h value is increased more than it should be, it will cause buckling in the h length, so the h value should not be increased too much. Figure 11 shows the Fp/Fmax value change depending on the h/H ratio. As seen in Figure 13, the h/H ratio of 0.30 is the optimum value for SLC and EAC.
Simulation results of the optimized models.
| Fmax | Fp | Fp·Fmax −1 | h (mm) | h·H−1 | |
|---|---|---|---|---|---|
| Double Y | 10,208 | 9,800 | 0.96 | 5 | 0.25 |
| Double Y-R1 | 10,710 | 10,600 | 0.99 | 6 | 0.30 |
| Double Y-R2 | 9,552 | 8,300 | 0.87 | 7 | 0.35 |
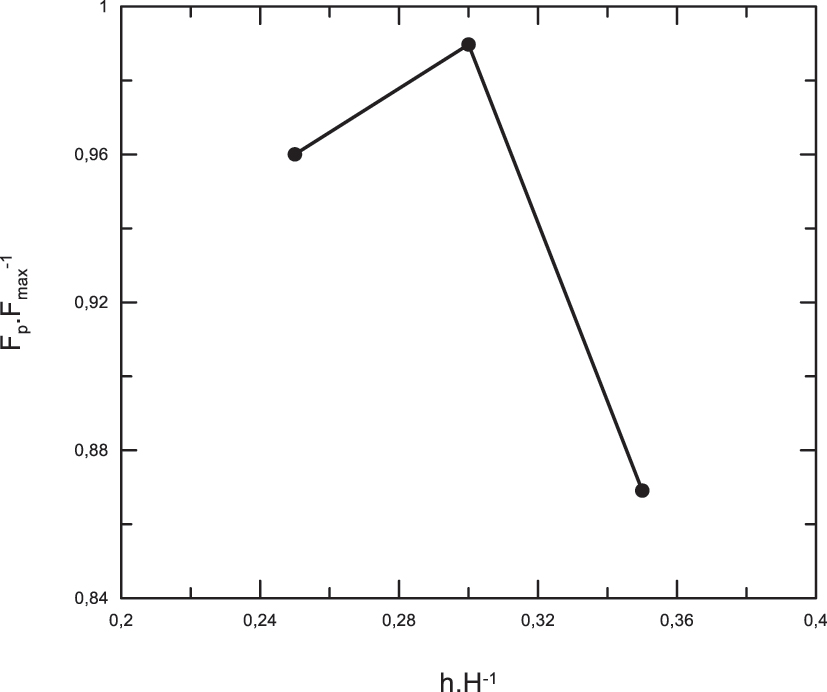
Variation of Fp·Fmax −1 depending on h·H−1.
The graph showing the section inertia moment depending on the displacement, based on a model from three different deformation modes and the optimum model that emerged as a result of the improvements made, is given in Figure 14. Figure 14 shows the inertia moments (CIM) change of the examined structures up to 30 mm displacement. From the general graph, it can be seen that the inertia moments of all sections decrease with increasing displacement. The figure shows that the section inertia moment decreases faster and more in square and triangular section structures. In contrast, less decrease occurs in the symmetric y-form model. In the modified model, the change amount of the section inertia moment is lower. Thus, an increase is provided in both SCL and EAC values. When evaluating the performance of different cell sections examined, it will be helpful to consider the panel volume, bending displacement, and change in CIM. In the following Equation (1), ΔCIM is the change amount of the section inertia moment (mm4), V is the panel volume (mm3), and dc (mm) is the displacement value at which the first maximum load is seen; therefore, the collapse sensitivity (CS) can be calculated;
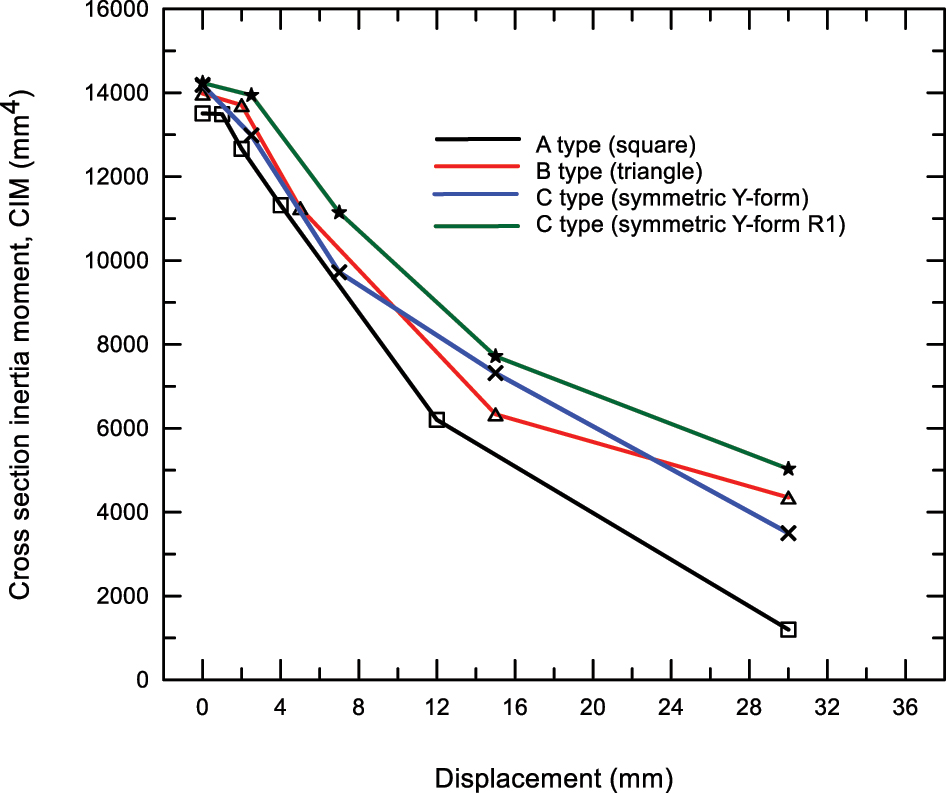
Change of cross-section inertia moment with displacement.
Figure 15 shows the Cs ratios of these cross sections. Collapse sensitivity, the susceptibility of the cross-section to collapse, is highest for the symmetric Y-form structure. It is understood that the symmetric Y-form structure is the best one among the existing multi-cellular sections. While the collapse sensitivity of the square structure was 20.1, the sensitivity of the revised symmetric Y-R1 structure decreased to 3.35, decreasing by 83 %.
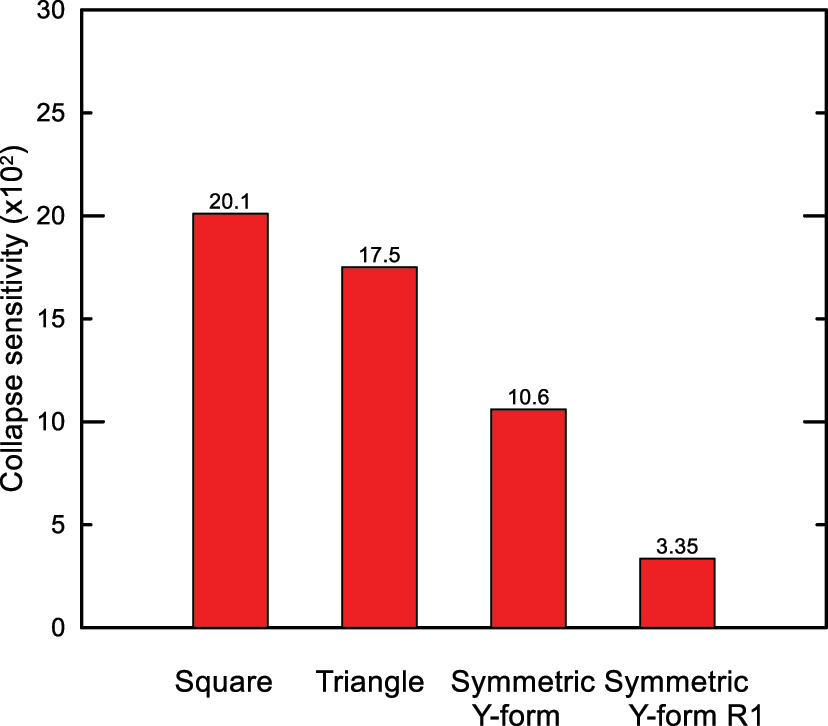
Collapse sensitivity of some selected structures.
4 Conclusions
In this study, the bending behavior of sandwich panels with corrugated structures having various geometries was investigated numerically. Three-point bending analyses of sandwich panels in the shapes of triangle, square, trapezoid, sinus, diamond, hexagon, Y, and symmetric Y-form were performed. The following results were obtained from the study.
The highest load-carrying capacity was obtained in the square structure with 11,195 N, and the specific load-carrying capacity was obtained in the square structure with 115.17 N·g–1. The lowest values were seen in the sinus structure.
The structure with the highest energy absorption capacity was the triangular structure with 328.40 J. Regarding specific energy absorption capacity, the highest value was seen in the symmetric Y-form structure with 3.23 J/g. The lowest values were seen in the hexagon structure.
The most optimum value for both SLCC and SEAC was obtained in the symmetric Y-form structure. A more optimum structure was achieved with the revisions made to this structure.
The specific load carrying capacity (SLCC) of the revised symmetric Y model increased by 5.2 % from 101.31 N·gr−1 to 106.89 N·gr−1. The specific energy absorption capacity (SEAC) increased by 15.4 % from 3.14 J·gr−1 to 3.71 J·gr−1.
It was observed that the collapse sensitivity decreased significantly in the modified model compared to the others.
-
Research ethics: Not applicable.
-
Informed consent: Not applicable.
-
Author contributions: The author has accepted responsibility for the entire content of this manuscript and approved its submission.
-
Use of Large Language Models, AI and Machine Learning Tools: None declared.
-
Conflict of interests: The author states no conflict of interest.
-
Research funding: None declared.
-
Data availability: Not applicable.
References
[1] W. Xiao, G. Sha, X. Lu, H. Zuo, M. Cao, and W. Ostachowicz, “Compressive failure analysis of composite honeycomb sandwich panels with impact damage and stepped-scarf repairs,” Thin Walled Struct., vol. 201, no. May, 2024, https://doi.org/10.1016/j.tws.2024.112012.Search in Google Scholar
[2] V. Crupi, G. Epasto, and E. Guglielmino, “Collapse modes in aluminium honeycomb sandwich panels under bending and impact loading,” Int. J. Impact Eng., vol. 43, pp. 6–15, 2012, https://doi.org/10.1016/j.ijimpeng.2011.12.002.Search in Google Scholar
[3] J. Mei, J. Liu, and W. Huang, “Three-point bending behaviors of the foam-filled CFRP X-core sandwich panel: experimental investigation and analytical modelling,” Compos. Struct., vol. 284, no. January, 2022, Art. no. 115206, https://doi.org/10.1016/j.compstruct.2022.115206.Search in Google Scholar
[4] L. Li, Q. He, X. Jing, Y. Jiang, and D. Yan, “Study on three-point bending behavior of sandwich beams with novel auxetic honeycomb core,” Mater. Today Commun., vol. 35, no. May, 2023, Art. no. 106259, https://doi.org/10.1016/j.mtcomm.2023.106259.Search in Google Scholar
[5] J. Li, W. Zhang, Z. Wang, Q. Wang, T. Wu, and Q. Qin, “Dynamic response and failure of CFRP Kagome lattice core sandwich panels subjected to low-velocity impact,” Int. J. Impact Eng., vol. 181, no. July, 2023, Art. no. 104737, https://doi.org/10.1016/j.ijimpeng.2023.104737.Search in Google Scholar
[6] B. Vahidimanesh, A. Farrokhabadi, R. Shahvari, M. S. Gazor, and M. K. Mahdiabadi, “Experimental and numerical investigation of damage in multilayer sandwich panels with square and trapezoidal corrugated cores under quasi-static three-point bending,” Eng. Struct., vol. 318, no. June, 2024, Art. no. 118715, https://doi.org/10.1016/j.engstruct.2024.118715.Search in Google Scholar
[7] W. Cai, L. Zhu, K. Zheng, et al.., “Experimental and analytical investigations on single and repetitive impact failure responses of composite sandwich panels with orthogonal woven GFRP facesheets and PVC foam cores,” Int. J. Impact Eng., vol. 194, no. May, 2024, Art. no. 105064, https://doi.org/10.1016/j.ijimpeng.2024.105064.Search in Google Scholar
[8] Z. Wang, L. Zhou, Z. Zhang, and M. A. Mwambala, “Study on bending performance of laminated bamboo sandwich panels with different lattice core layers: cleaner production of green material,” Case Stud. Constr. Mater., vol. 20, no. May, 2024, Art. no. e03379, https://doi.org/10.1016/j.cscm.2024.e03379.Search in Google Scholar
[9] F. Kamareh, B. Pang, W. Cao, R. Chi, and D. Hu, “Evaluating load-bearing and hypervelocity impact shielding capabilities of face-centered cubic lattice core sandwich panels,” Mater. Today Commun., vol. 40, no. May, 2024, Art. no. 109835, https://doi.org/10.1016/j.mtcomm.2024.109835.Search in Google Scholar
[10] E. Zurnacı and H. Gökkaya, “Evaluation of corrugated core configuration effects on low-velocity impact response in metallic sandwich panels,” Mater. Test., vol. 66, no. 2, pp. 154–165, 2024.10.1515/mt-2023-0160Search in Google Scholar
[11] M. R. M. Rejab and W. J. Cantwell, “The mechanical behaviour of corrugated-core sandwich panels,” Compos. Part B Eng., vol. 47, pp. 267–277, 2013, https://doi.org/10.1016/j.compositesb.2012.10.031.Search in Google Scholar
[12] G. G. Galletti, C. Vinquist, and O. S. Es-Said, “Theoretical design and analysis of a honeycomb panel sandwich structure loaded in pure bending,” Eng. Fail. Anal., vol. 15, no. 5, pp. 555–562, 2008, https://doi.org/10.1016/j.engfailanal.2007.04.004.Search in Google Scholar
[13] X. G. Zhang, W. Jiang, Y. Zhang, et al.., “Energy absorption properties of composite tubes with hexagonal and re-entrant honeycomb fillers,” Constr. Build. Mater., vol. 356, no. October, 2022, Art. no. 129298, https://doi.org/10.1016/j.conbuildmat.2022.129298.Search in Google Scholar
[14] D. Xiao, X. Chen, Y. Li, W. Wu, and D. Fang, “The structure response of sandwich beams with metallic auxetic honeycomb cores under localized impulsive loading-experiments and finite element analysis,” Mater. Des., vol. 176, 2019, Art. no. 107840, https://doi.org/10.1016/j.matdes.2019.107840.Search in Google Scholar
[15] Y. Zhang, L. Yan, C. Zhang, and S. Guo, “Low-velocity impact response of tube-reinforced honeycomb sandwich structure,” Thin-Walled Struct., vol. 158, no. September 2020, 2021, Art. no. 107188, https://doi.org/10.1016/j.tws.2020.107188.Search in Google Scholar
[16] C. Elibol and S. H. Wapande, “Numerical and experimental formability analysis of aluminum 3105 sandwich panels produced by continuous hot-press forming,” Mater. Test., vol. 64, no. 1, pp. 11–23, 2022, https://doi.org/10.1515/mt-2021-2003.Search in Google Scholar
[17] M. E. Çetin, “Improvement of the structural, thermal, and mechanical properties of polyurethane adhesives with nanoparticles and their application to Al/Al honeycomb sandwich panels,” Mater. Test., vol. 64, no. 2, pp. 272–283, 2022, https://doi.org/10.1515/mt-2021-2028.Search in Google Scholar
[18] S. Hou, S. Zhao, L. Ren, X. Han, and Q. Li, “Crashworthiness optimization of corrugated sandwich panels,” Mater. Des., vol. 51, pp. 1071–1084, 2013, https://doi.org/10.1016/j.matdes.2013.04.086.Search in Google Scholar
[19] Y. Rong, J. Liu, W. Luo, and W. He, “Effects of geometric configurations of corrugated cores on the local impact and planar compression of sandwich panels,” Compos. Part B Eng., vol. 152, no. August, pp. 324–335, 2018, https://doi.org/10.1016/j.compositesb.2018.08.130.Search in Google Scholar
[20] S. Hou, C. Shu, S. Zhao, T. Liu, X. Han, and Q. Li, “Experimental and numerical studies on multi-layered corrugated sandwich panels under crushing loading,” Compos. Struct., vol. 126, pp. 371–385, 2015, https://doi.org/10.1016/j.compstruct.2015.02.039.Search in Google Scholar
[21] Y. Hu, W. Li, X. An, and H. Fan, “Fabrication and mechanical behaviors of corrugated lattice truss composite sandwich panels,” Compos. Sci. Technol., vol. 125, pp. 114–122, 2016, https://doi.org/10.1016/j.compscitech.2016.02.003.Search in Google Scholar
[22] F. Xia, Y. Durandet, P. J. Tan, and D. Ruan, “Three-point bending performance of sandwich panels with various types of cores,” Thin Walled Struct., vol. 179, no. May, 2022, Art. no. 109723, https://doi.org/10.1016/j.tws.2022.109723.Search in Google Scholar
[23] M. T. Tilbrook, D. D. Radford, V. S. Deshpande, and N. A. Fleck, “Dynamic crushing of sandwich panels with prismatic lattice cores,” Int. J. Solids Struct., vol. 44, nos. 18–19, pp. 6101–6123, 2007, https://doi.org/10.1016/j.ijsolstr.2007.02.015.Search in Google Scholar
[24] L. Valdevit, Z. Wei, C. Mercer, F. W. Zok, and A. G. Evans, “Structural performance of near-optimal sandwich panels with corrugated cores,” Int. J. Solids Struct., vol. 43, no. 16, pp. 4888–4905, 2006, https://doi.org/10.1016/j.ijsolstr.2005.06.073.Search in Google Scholar
[25] L. Valdevit, J. W. Hutchinson, and A. G. Evans, “Structurally optimized sandwich panels with prismatic cores,” Int. J. Solids Struct., vol. 41, nos. 18–19, pp. 5105–5124, 2004, https://doi.org/10.1016/j.ijsolstr.2004.04.027.Search in Google Scholar
[26] S. Kazemahvazi, D. Tanner, and D. Zenkert, “Corrugated all-composite sandwich structures. Part 2: failure mechanisms and experimental programme,” Compos. Sci. Technol., vol. 69, nos. 7–8, pp. 920–925, 2009, https://doi.org/10.1016/j.compscitech.2008.11.035.Search in Google Scholar
[27] C. Jiang, L. Lin, and N. Z. Chen, “A study on auxetic-inspired side structure for enhanced crashworthiness,” Mar. Struct., vol. 93, no. August 2023, 2024, Art. no. 103545, https://doi.org/10.1016/j.marstruc.2023.103545.Search in Google Scholar
© 2025 the author(s), published by De Gruyter, Berlin/Boston
This work is licensed under the Creative Commons Attribution 4.0 International License.
Articles in the same Issue
- Frontmatter
- Effect of flush grinding on corrosion fatigue behavior of step-aged 7020 aluminum alloys
- Bending behavior of corrugated sandwich panels with various core shapes
- Comparison of crash performance of auxetic structures for CF15, PA6/GF30, and GF30PP materials
- Combined effect of ball milling and high-pressure torsion on mechanical properties of Al2O3/Al composite
- Liquid metal embrittlement susceptibility of galvanized advanced high strength steel with high manganese content
- Kinetic study on nickel aluminides formed on Monel 400 alloy
- Finite element simulation of natural gas pipelines in service welding repair
- Biomechanical effects of material selection and micro-groove design for dental implants
- Design, FEA and experimental validation of 3D-printed PLA/PCL intervertebral cages for lumbar spinal fusion
- Effect of tool tilt angles on the formation of YSZ/Al2O3 hybrid surface composites on friction stir processed magnesium alloy AZ31
- Coating of AISI 304 stainless steel surface with addition of Cr3C2 to NiCrCo medium entropy alloy powder
- Numerical and analytical stress analysis for a FGM beam
- Mechanical and wear behaviour of hybrid AA8011 metal matrix composite reinforced with aluminum silicate and titanium dioxide
- A new neural network–assisted hybrid chaotic hiking optimization algorithm for optimal design of engineering components
- Cup drawing predictions for a 6016-T4 aluminum alloy