Strain-life behavior of thick-walled nodular cast iron
-
Christoph Bleicher
Dr. Christoph Bleicher, born in 1984, studied Mechanical Engineering at the Technische Universität Darmstadt, Germany, and Industrial Engineering and Management at the Hochschule Darmstadt, University of Applied Sciences, Germany. Since 2010, he has been working as a research assistant for the Fraunhofer Institute for Structural Durability and System Reliability LBF in Darmstadt, Germany, on the fatigue assessment of cast components. In 2016, he presented his doctoral thesis with the title “Ein Beitrag zur Beurteilung der Schwingfestigkeit von Großgussbauteilen aus Gusseisen mit Kugelgraphit mit besonderer Berücksichtigung der Auswirkungen von Lunkern auf die Bauteillebensdauer” at the Technische Universität Darmstadt, Germany. From 2019 on, he led the group “Qualification of cast components” working on the overall lifetime assessment of castings. In 2022, he became Director of the Division “Structural Durability” at Fraunhofer LBF.
Christian Pittel, MSc, studied mechanical engineering at the Technical University of Darmstadt and joined the research group “Qualification of cast components” at the Fraunhofer Institute for Structural Durability and System Reliability in Darmstadt, Germany in 2019. In the context of two research projects, he worked on the linkage of information on imperfection, such as dross, shrinkages, and chunky graphite, from casting simulation and nondestructive testing into lifetime assessment concepts as well as on correlating microstructural properties with the fatigue strength of thick-walled iron castings.

 ,
Axel Kansy
,
Axel Kansy
Axel Kansy studied lightweight design at Aalen University of applied science and worked in the university’s foundry laboratory as a research assistant in the field of zinc die casting after graduating. He then joined the research group “Qualification of cast components” at the Fraunhofer Institute for Structural Durability and System Reliability in Darmstadt, Germany in 2020. His main topics are the investigation of the cyclic material behavior of lamellar graphite cast iron and nonferrous metals as well as the material behavior in corrosive and hydrogen environments.
Jan Niewiadomski, MSc, born in 1991, studied Mechanical and Process Engineering at the Technische Universität Darmstadt, Germany. Since 2018, he has been working as a research assistant for the Fraunhofer Institute for Structural Durability and System Reliability LBF in Darmstadt, Germany. In 2022, he took over the group leadership of the group “Qualification of cast components” at the Fraunhofer LBF.
Dr. Heinz Kaufmann, born in 1960, studied Mechanical Engineering at the Technische Universität Darmstadt, Germany, and graduated in 1985. In 1998, he presented his doctoral thesis on “The Dimensioning of Cyclically Loaded Thick-Walled Components of Cast Ductile Iron GGG-40 Considering Microstructural Degenerations from Casting” at Saarland University, Saarbrücken, Germany. He joined the Fraunhofer LBF in 1986 and was Head of the Competence Center “Component-Related Material Behavior” from 2003 to 2012. Since 2012, he has been Head of the Department “Materials and Components.”

Abstract
For the design of thick-walled cast iron components used for wind energy turbines, large machines, presses, and engine parts made of nodular cast iron, the assessment of fatigue life of critical component areas is a crucial point to consider. Importance increases with the demand to safe resources by applying a lightweight design in combination with a certain resistance against extreme loads and misuse situations. Moreover, this gets more important when notches or deviations in the local microstructure are present. Nevertheless, due to accessibility, a lack in the description of the local strain-based material behavior still exists. Especially new cast iron grades such as ADI are not well investigated but offer an often-discussed potential for a lightweight design of the structure or to increase the highest admissible load on the structure. To determine the cyclic material behavior of nodular cast iron, different grades EN-GJS-400-18LT, EN-GJS-450-18, EN-GJS-500-14, EN-GJS-600-3, EN-GJS-700-2, and ADI in different wall thicknesses were investigated concerning their elastic–plastic material behavior under strain control. Moreover, new possibilities for the trilinear description of the strain-life and the stress–strain curve and the statistical and technological size effect are discussed in the following based on cyclic stress–strain and strain-life curves.
1 Introduction
Nodular cast iron (GJS) stands for a wide range of different grades from low strength but high ductile ferritic up to high strength ausferritic microstructures. In combination with the casting process and its ability to produce components with a high freedom in design, the material range offers the possibility to use nodular cast iron in small automotive components but also in parts for presses and wind energy turbines both in large and small series. Nevertheless, for the design and the local strain-based fatigue assessment of large cast component, possibilities to determine their lifetime as precisely as possible need to be given by standards and guidelines like [1], [2]. But while [2] offers only a stress-based fatigue assessment concept [1], also gives a guideline for a strain-based fatigue assessment concept, at least for smaller components.
Especially for the design of thick-walled components made of nodular cast iron with more than 100 tons, it is necessary to include also locally changing microstructures and fatigue strengths and thus the technological size effect in a design procedure. Besides the technological also the influence of specimen size (statistical size effect) and notches or stress gradients (geometrical size effect) according to [3] need to be taken into account during the design phase for a proper lifetime assessment. Those effects are usually based on stress-based design approaches or in addition to standards [1], [2] but need to be investigated for a strain-based lifetime assessment. Especially the influence of the statistical and technological size effect on results of strain-controlled fatigue tests is worth to be discussed.
Some research work has been done on thick-walled GJS to investigate influences on fatigue strength coming from the changing microstructure for stress-based design purposes [4], [5], [6], [7], [8], [9]. While in these works mainly wind energy related ferritic GJS was investigated based on stress-controlled fatigue tests in terms of defects and size effects, further papers discuss also the strain-based approaches to better understand the influence of microstructures on both the stress–strain based and the strain-life based material behavior [6], [7], [10], [11], [12], [13], [14], [15], [16], [17], [18], [19]. [10], [11] discuss the influence on cyclic stress–strain behavior for large casting made of EN-GJS-400-18LT with locally different microstructures. They determine alike [6], [12], [13] a cyclic hardening effect for this material. Moreover, no strong influence from the microstructure on the stress–strain behavior is determined. Nevertheless, strain-life curves are missing making an evaluation of the microstructure on lifetime possible.
By Atzori et al. [12], detailed investigations on different GJS grades are carried out to check a model proposed by Manson [20] for a compatibility between an energy-based and strain/stress-based fatigue life assessment. Unfortunately, only data are taken into account on tests conducted until a limit number of cycles of 1·105. Nevertheless, it could be shown in agreement to former investigations on forged steel and aluminum that all nodular cast iron grades can be described by the energy-based model within a small scatter band. Moreover, a clear dependency between tensile strength R m and the fatigue strength coefficient σ′f and additionally between the ratio of tensile strength R m and yield strength R p0.2 to the fatigue ductility coefficient ε′f is present for ferritic up to ausferritic materials. Additional strain-life curves of different GJS grades can be found in [15], [16], [17], [18], [19].
Coming from the work being done so far in literature, the present paper wants to achieve several points: While it shall provide a wide range of material and fatigue data from one common source for general design interest, it will also discuss the influence of the statistical, geometrical, and technological size effect for 8 nodular cast iron grades with 29 different microstructures. Partially those microstructures result from one common component cast sample. Based on strain-based fatigue investigations, it will describe which influences are given by the microstructure on the stress–strain and the strain-life curve. Additionally, measures for determining scatter bands for a larger number of strain-controlled fatigue tests are presented.
2 Investigated materials
For a good overview and description of the cyclic strain-based material behavior, results from different research projects conducted at Fraunhofer LBF were gathered and compared. The main focus was set to larger components with wall thicknesses above 50 mm and a weight beyond 500 kg. For this purpose, fatigue tests under constant amplitude loading were performed on ferritic, ferritic solid-solution strengthened, pearlitic, and ausferritic materials: EN-GJS-400-18LT, EN-GJS-450-18, EN-GJS-500-14, EN-GJS-600-3, EN-GJS-700-2, and ADI. Nevertheless, all those materials differ in the local microstructure depending on cooling condition during the casting process and depending on wall thickness resulting in a differing quasi-static and cyclic material behavior even within one component.
To compare a large variety of data from different wall thicknesses and microstructures, different castings were produced. Those castings were plates with different wall thicknesses (Figure 1), Y-shaped blocks (Figure 2), and as well as components from serial production. The cast components were two planet carriers and a main frame (Figure 3) as well as a hollow shaft of a wind energy turbine (Figure 4). Additionally, gears and near-shape gears, so called gear samples (Figure 5), were all taken from serial production process. Within the hollow shaft, gears, and gear samples, different microstructures were investigated by specimens removed in different positions on each component. The chemical composition of each casting is given in Table 1.
![Figure 1:
Cast plate with thickness of t = 230 mm and the specimen removal plan [6].](/document/doi/10.1515/mt-2023-0307/asset/graphic/j_mt-2023-0307_fig_001.jpg)
Cast plate with thickness of t = 230 mm and the specimen removal plan [6].
![Figure 2:
Y-shaped cast block with a maximum wall thickness of t = 200 mm [26].](/document/doi/10.1515/mt-2023-0307/asset/graphic/j_mt-2023-0307_fig_002.jpg)
Y-shaped cast block with a maximum wall thickness of t = 200 mm [26].
![Figure 3:
Specimen removal plans, a) main frame (12 t) [26] and b) planet carrier (3 t) [26].](/document/doi/10.1515/mt-2023-0307/asset/graphic/j_mt-2023-0307_fig_003.jpg)
![Figure 4:
Hollow shaft (∼20 t) and the specimen removal plan [9].](/document/doi/10.1515/mt-2023-0307/asset/graphic/j_mt-2023-0307_fig_004.jpg)
Hollow shaft (∼20 t) and the specimen removal plan [9].
![Figure 5:
Specimen removal plans, a) serial gear #1 (3 t) [25] and b) gear sample (1 t) [25].](/document/doi/10.1515/mt-2023-0307/asset/graphic/j_mt-2023-0307_fig_005.jpg)
Chemical composition of the investigated materials.
| Material | Carbon C |
Silicon Si |
Manganese Mn |
Phosphor P |
Sulfur S |
Magnesium Mg |
Copper Cu |
Nickel Ni |
|
|---|---|---|---|---|---|---|---|---|---|
| [wt.%] | |||||||||
| EN-GJS-400-18LT | Plate [6] | 3.41 | 2.20 | 0.17 | 0.03 | 0.01 | 0.05 | n.d. | n.d. |
| Y-shaped block [21] | 3.73 | 2.19 | 0.15 | 0.03 | 0.01 | 0.04 | 0.03 | 0.01 | |
| Main frame [21] | 3.75 | 2.16 | 0.21 | 0.02 | 0.01 | 0.04 | 0.01 | 0.02 | |
| Hollow rotor shaft [22] | n.d. | n.d. | n.d. | n.d. | n.d. | n.d. | n.d. | n.d. | |
| EN-GJS-450-18 | Plate [6] | 3.32 | 3.18 | 0.16 | 0.02 | 0.01 | 0.05 | n.d. | n.d. |
| Y-shaped block [23] | 3.40 | 3.00 | 0.34 | 0.02 | 0.06 | 0.05 | n.d. | 0.00 | |
| EN-GJS-500-14 | Y-shaped block [24] | 3.11 | 3.48 | 0.15 | 0.03 | 0.01 | 0.04 | n.d. | 0.50 |
| EN-GJS-600-3 | Hollow rotor shaft [22] | n.d. | n.d. | n.d. | n.d. | n.d. | n.d. | n.d. | n.d. |
| EN-GJS-700-2 | Plate [6] | 3.70 | 2.41 | 0.50 | 0.02 | 0.01 | 0.05 | n.d. | n.d. |
| Y-shaped block [21] | 3.61 | 2.27 | 0.32 | 0.03 | 0.01 | 0.04 | 0.76 | 0.92 | |
| Planet carrier [21] | n.d. | n.d. | n.d. | n.d. | n.d. | n.d. | n.d. | n.d. | |
| Gear sample as-cast [25] | 3.60 | 2.10 | 0.49 | n.d. | 0.01 | 0.05 | 1.00 | 1.48 | |
| Gear sample heat treat [25]. | 3.60 | 2.10 | 0.49 | n.d. | 0.01 | 0.05 | 1.00 | 1.48 | |
| ADI-800 | Y-shaped block [21] | 3.54 | 2.12 | 0.28 | 0.03 | 0.01 | 0.05 | 0.98 | 2.36 |
| ADI-900 | Planet carrier [21] | n.d. | n.d. | n.d. | n.d. | n.d. | n.d. | n.d. | n.d. |
| Serial gear #1 [25] | 3.50 | 2.10 | 0.29 | 0.02 | n.d. | 0.05 | 0.80 | 1.72 | |
| Serial gear #2 [25] | 3.46 | 2.07 | 0.29 | 0.022 | 0.01 | 0.05 | 0.80 | 1.79 | |
| ADI-1050 | Gear sample as-cast [25] | 3.50 | 2.20 | 0.03 | n.d. | 0.01 | 0.05 | 0.88 | 1.85 |
-
n.d., not determined during investigations.
From those castings, fatigue and tensile specimens as well as etched sections were removed in different positions. For the strain-controlled fatigue tests, unnotched fatigue specimens (Figures 6 to 8) were used. In addition to the quasi-static and cyclic material investigations, etched sections of each material were prepared. Those etched sections were used to determine the local microstructure of the matrix and the graphite parameters nodularity, size, and form of each microstructure according to [27]. The determined microstructure for each material is given in Table 2, while a test matrix and the results of the tensile tests are given in Table 3 and Table 4, respectively.

Specimen geometry I (mm), K t = 1.04, HBV90 % = 442 mm³.

Specimen geometry II (mm), K t = 1.04, HBV90 % = 750 mm³.

Specimen geometry III (mm), K t = 1.05, HBV90 % = 6122 mm³.
Overview over the microstructural parameters according to [27] for the investigated materials.
| EN-GJS-400-18LT | EN-GJS-450-18 | |||||
|---|---|---|---|---|---|---|
| Plate [6] | Y-shaped block [21] | Main frame [21] | Hollow shaft [9] | Plate [6] | Y-shaped block [24] | |
| Test series | 01/02/03/04 | 05 | 06 | 07 | 08/09/10/11 | 12 |
| Microstructure |

|

|

|

|

|

|
| Nodularity | 51.0% | 74.4% | 85.3% | 85.6% | 67.0% | 78.4% |
| Graphite size | 92.0% (4 + 5 + 6) | 90.4% (5 + 6) | 85.6% (5 + 6) | 97.5% (6 + 7 + 8) | 95.0% (4 + 5 + 6) | 87.5% (5 + 6) |
| Graphite form | 88% (V + VI) | 97.1% (V + VI) | 99.2% (V + VI) | 99.2% (V + VI) | 97.0% (V + VI) | 96.2% (V + VI) |
| EN-GJS-500-14 | EN-GJS-600-3 | EN-GJS-700-2 | ||||
|---|---|---|---|---|---|---|
| Y-shaped block [24] | Hollow shaft [9] | Plate [6] | Y-shaped block [21] | Planet carrier [21] | Gear sample as cast [25] | |
| Test series | 13 | 14 | 15/16/17/18 | 19 | 20 | 21 |
| Microstructure |

|

|

|

|

|

|
| Nodularity | 57.5% | 88.0% | 58.0% | 75.9% | 90.1% | 87.5% |
| Graphite size | 80.7% (5 + 6) | 95.7% (6 + 7 + 8) | 89.0% (3 + 4) | 80.3% (5 + 6) | 88.9% (5 + 6) | 95.2% (6 + 7 + 8) |
| Graphite form | 82.5% (V + VI) | 99.1% (V + VI) | 94.0% (V) | 98.1% (V + VI) | 99.6% (V + VI) | 98.5% (V + VI) |
| EN-GJS-700-2 | ADI-800 | ADI-900 | ||||
|---|---|---|---|---|---|---|
| Gear sample as cast [25] | Gear sample as cast [25] | Gear sample heat treated [25] | Gear sample heat treated [25] | Y-shaped block [21] | Planet carrier [21] | |
| Test series | 22 | 23 | 24 | 25 | 26 | 27 |
| Microstructure |

|

|

|

|

|

|
| Nodularity | 82.6% | 80.4% | 89.3% | 80.0% | 81.9% | 91.8% |
| Graphite size | 87.1% (6 + 7) | 97.6% (5 + 6 + 7) | 99.3% (6 + 7 + 8) | 90.7% (5 + 6 + 7) | 72.7% (5 + 6) | 88.3% (5 + 6) |
| Graphite form | 98.5% (V + VI) | 98.6% (V + VI) | 99.3% (V + VI) | 98.4% (V + VI) | 81.9% (V + VI) | 99.7% (V + VI) |
| ADI-900 | ||||||
| Serial gear #1 [25] | Serial gear #1 [25] | Serial gear #1 [25] | Serial gear #2 [25] | Serial gear #2 [25] | Serial gear #2 [25] | |
| Test series | 28 | 29 | 30 | 31 | 32 | 33 |
| Microstructure |

|

|

|

|

|

|
| Nodularity | 91.1% | 81.4% | 83.7% | 74.0% | 85.2% | 74.8% |
| Graphite size | 89.6% (6 + 7) | 89.8% (5 + 6) | 97.8% (5 + 6 + 7) | 99.9% (5 + 6 + 7) | 93.6% (6 + 7) | 95.4% (5 + 6 + 7) |
| Graphite form | 99.3% (V + VI) | 99.5% (V + VI) | 98.8% (V + VI) | 96.3% (V + VI) | 98.7% (V + VI) | 97.0% (V + VI) |
| ADI-1050 | |||
|---|---|---|---|
| Gear sample [25] | Gear sample [25] | Gear sample [25] | |
| Test series | 34 | 35 | 36 |
| Microstructure |

|

|

|
| Nodularity | 94.1% | 90.9% | 89.9% |
| Graphite size | 96.0% (6 + 7) | 91.2% (5 + 6) | 94.4% (5 + 6) |
| Graphite form | 99.1% (V + VI) | 99.0% (V + VI) | 99.5% (V + VI) |
Test matrix.
| Material | EN-GJS-400-18LT | EN-GJS-450-18 | EN-GJS-500-14 |
EN-GJS-600-3 |
EN-GJS-700-2 | ADI-800 |
ADI-900 | ADI-1050 | ||||||||||||||||||||||||||||
|---|---|---|---|---|---|---|---|---|---|---|---|---|---|---|---|---|---|---|---|---|---|---|---|---|---|---|---|---|---|---|---|---|---|---|---|---|
| Removal position | Plate [6] | Y-shaped block [21] |
Main frame [21] |
Hollow shaft [28] |
Plate [6] | Y-shaped block [28] |
Y-shaped block [28] |
Hollow shaft [28] |
Plate [6] | Y-shaped block [21] |
Planet carrier [21] |
Gear sample as cast [25] | Gear sample heat treated [25] | Y-shaped block [21] |
Planet carrier [21] |
Serial gear #1 [25] | Serial gear #2 [25] | Gear sample [25] | ||||||||||||||||||
| Wall thickness [mm] | 230.0 | 230.0 | 200.0 |
85.0 |
270.0 |
120.0 | 120.0 | 200.0 |
200.0 |
270.0 |
200.0 | 200.0 | 200.0 |
100.0 |
190.0 |
190.0 |
190.0 |
190.0 |
190.0 |
200.0 |
100.0 |
164.0 |
164.0 |
164.0 |
127.0 |
127.0 |
127.0 |
190.0 |
190.0 |
190.0 |
||||||
| Position | Rim zone | Center | − | − | − | Rim zone | Center | − | − | − | Rim zone | Center | − | − | Rim zone | Medium | Center | Rim zone | Medium | − | − | Rim zone | Center | Medium | Rim zone | Medium | Center | Rim zone | Medium | Center | ||||||
| Specimen size | I | III | I | III | III | III | III | I | III | I | III | III | III | III | I | III | I | III | III | III | II | II | II | II | II | III | III | II | II | II | II | II | II | I | I | I |
| Test series (TS) | 01 | 02 | 03 | 04 | 05 | 06 | 07 | 08 | 09 | 10 | 11 | 12 | 13 | 14 | 15 | 16 | 17 | 18 | 19 | 20 | 21 | 22 | 23 | 24 | 25 | 26 | 27 | 28 | 29 | 30 | 31 | 32 | 33 | 34 | 35 | 36 |
| Number of specimens | 15 | 15 | 18 | 14 | 43 | 20 | 14 | 14 | 15 | 14 | 16 | 13 | 14 | 16 | 15 | 13 | 15 | 15 | 20 | 20 | 15 | 14 | 15 | 14 | 12 | 18 | 20 | 26 | 12 | 13 | 15 | 13 | 11 | 13 | 15 | 13 |
Results of the tensile test related to material, wall thickness, component, and number of test being performed.
| Material | EN-GJS-400-18LT | EN-GJS-450-18 | EN-GJS-500-14 | EN-GJS-600-3 | EN-GJS-700-2 | ||||||||||||||
|---|---|---|---|---|---|---|---|---|---|---|---|---|---|---|---|---|---|---|---|
| Removal position | Plate [6] | Y-shaped block [21] |
Main frame [21] |
Hollow shaft [28] |
Plate [6] | Y-shaped block [21] |
Y-shaped block [24] |
Hollow shaft [29] |
Plate [6] | Y-shaped block [21] |
Planet carrier [21] |
Gear sample as cast [25] |
Gear sample as cast [25] |
Gear sample as cast [25] |
Gear sample heat treated [25] |
Gear sample heat treated [25] |
|||
| Test series | 01/02 | 03/04 | 05 | 06 | 07 | 08/09 | 10/11 | 12 | 13 | 14 | 15/16 | 17/18 | 19 | 20 | 21 | 22 | 23 | 24 | 25 |
| Wall thickness [mm] | 230.0 |
230.0 |
200.0 |
85.0 |
270.0 |
120.0 |
120.0 |
200.0 |
200.0 |
270.0 |
200.0 |
200.0 |
200.0 |
100.0 |
190.0 |
190.0 |
190.0 |
190.0 |
190.0 |
| Position | Rim zone | Center | − | − | − | Rim zone | Center | − | − | Rim zone | Center | − | − | Rim zone | Medium | Center | Rim zone | Medium | |
| Tensile strength R m [MPa] | 350.8 ± 3.0 | 351.5 ± 0.5 | 367.0 ± 17.7 | 363.2 ± 2.5 | 374.4 ± 3.6 | 443.2 ± 2.4 | 430.7 ± 3.2 | 333.0 ± 9.1 | 477.3 ± 5.1 | 672.1 ± 20.9 | 713.3 ± 8.2 | 566.0 ± 20.4 | 531.8 ± 44.1 | 737.0 ± 26.5 | 742.0 ± 51.6 | 653.0 ± 20.9 | 654.0 | 877.0 ± 41.5 | 801.3 ± 16.5 |
| Yield strength R p0,2 [MPa] | 234.9 ± 0.9 | 232.8 ± 1.5 | 260.9 ± 2.0 | 225.4 ± 0.9 | 239.0 ± 0.5 | 325.3 ± 1.6 | 317.7 ± 1.1 | 423.5 ± 6.3 | 412.0 ± 4.7 | 407.9 ± 3.6 | 537.0 ± 2.2 | 491.7 ± 13.8 | 410.7 ± 7.7 | 418.0 ± 4.4 | 543.7 ± 14.7 | 533.3 ± 3.4 | 535.0 | 766.3 ± 22.4 | 724.0 ± 25.7 |
| Elongation A5 [%] | 13.6 ± 1.8 | 15.9 ± 0.3 | 10.6 ± 3.4 | 26.6 ± 1.5 | 15.1 ± 2.8 | 20.4 ± 0.6 | 16.8 ± 0.8 | 8.9 ± 1.7 | 5.6 ± 1.7 | 6.6 ± 1.0 | 1.9 ± 0.1 | 0.9 ± 0.3 | 2.7 ± 0.5 | 4.8 ± 0.9 | 3.2 ± 1.2 | 1.6 ± 0.2 | 1.5 | 1.6 ± 0.5 | 1.1 ± 0.1 |
| Contraction at fracture Z [%] | n.d. | n.d. | n.d. | 24.8 ± 2.2 | 6.4 ± 1.3 | n.d. | n.d. | n.d. | n.d. | n.d. | n.d. | n.d. | n.d. | 3.8 ± 0.4 | n.d. | n.d. | n.d. | n.d. | n.d. |
| Number of single tests | 3 | 3 | 10 | 10 | 7 | 6 | 6 | 4 | 4 | 7 | 3 | 3 | 9 | 6 | 3 | 3 | 1 | 3 | 3 |
| Material | ADI-800 | ADI-900 | ADI-1050 | ||||||||
|---|---|---|---|---|---|---|---|---|---|---|---|
| Removal position | Y-shaped block [21] |
Planet carrier [21] |
Serial gear #1 [25] |
Serial gear #1 [25] |
Serial gear #1 [25] |
Serial gear #2 [25] |
Serial gear #2 [25] |
Serial gear #2 [25] |
Gear sample [25] |
Gear sample [25] |
Gear sample [25] |
| Test series | 26 | 27 | 28 | 29 | 30 | 31 | 32 | 33 | 34 | 35 | 36 |
| Wall thickness [mm] | 200.0 | 100.0 | 164.0 | 164.0 | 164.0 | 127.0 | 127.0 | 127.0 | 190.0 | 190.0 | 190.0 |
| Position | - | - | Rim zone | Center | Transition zone | Rim zone | Medium | Center | Rim zone | Medium | Center |
| Tensile strength R m [MPa] | 782.0 ± 17.6 | 827.2 ± 90.4 | 631.8 ± 21.3 | 643.3 ± 21.3 | 679.7 ± 47.9 | 589.7 ± 3.4 | 592.0 ± 3.6 | n.d. | 965.7 ± 19.6 | 824.3 ± 15.5 | 825.0 ± 52.4 |
| Yield strength R p0,2 [MPa] | 614.0 ± 13.2 | 595.8 ± 17.8 | 918.0 ± 33.2 | 879.7 ± 33.2 | 812.3 ± 79.7 | 793.0 ± 6.2 | 813.3 ± 15.4 | n.d. | 649.3 ± 21.9 | 621.0 ± 6.5 | 618.3 ± 8.7 |
| Elongation A5 [%] | 2.5 ± 0.4 | 7.3 ± 4.0 | 11.8 ± 0.8 | 5.4 ± 0.8 | 1.2 ± 0.3 | 6.5 ± 1 | 8.4 ± 1.8 | n.d. | 11.2 ± 1.2 | 4.5 ± 1.7 | 4.9 ± 2.0 |
| Contraction at fracture Z [%] | 3.3 ± 0.4 | 7.2 ± 2.8 | n.d. | n.d. | n.d. | n.d. | n.d. | n.d. | n.d. | n.d. | n.d. |
| Number of single tests | 4 | 6 | 4 | 3 | 3 | 3 | 3 | - | 3 | 3 | 3 |
3 Experimental analysis
3.1 Fatigue tests and evaluation
The strain-controlled fatigue tests were performed under sinusoidal loading with constant amplitude on servo-hydraulic test rigs with a maximum load of F max = 63 kN for the specimens with a test diameter of 5 and 6 mm and on a test rig with F max = 160 kN for the specimens with a diameter of 15 mm. For applying the strain, an extensometer with a maximum gauge length of 25 mm was used. The test rig with the fatigue specimen mounted is shown in Figure 9. The investigations were done in accordance to [30]. This guidelines provides information about test frequencies in relation to the applied total strain ε a,t, fatigue specimen geometries, test conditions, and the final evaluation of the results. The fatigue tests were performed until crack initiation or until the limit number of cycles N lim = 1·107. In this test series, specimens were tested in the frequency range of f = 0.1 and 25.0 Hz [30].

Servo-hydraulic test rig used for strain-controlled fatigue tests.
From the fatigue tests, the strain-life curve according to Coffin, Manson, Basquin, and Morrow [20], [31], [32], [33] was determined. Additionally, the parameters for the trilinear strain-life curve according to Wagener [34] were determined, Equation (1).
In contrast to the single linear approach according to Basquin [32] for the elastic part of the strain-life curve, investigations in [6], [14] showed that a trilinear approach is able to approximate the strain-life curve for thick-walled GJS much more precisely. In the trilinear approach according to [34], the elastic strain-life curve is divided into three parts: one for the low cycle, one for the high cycle, and one for the very high cycle lifetime regime. The advantage of the trilinear approach is that fatigue results are much better met, that the method enables the definition of a knee point accordingly to stress-life curves, and that the compatibility constraints according to Equation (2) are met. In case of nodular cast iron materials, a further slope k* = 44.9 (b 3 = 44.9−1) is assumed after the knee point in the strain-life curve, according to Sonsino [35].
3.2 Determination of scatter bands
The scatter band of the strain-life curve is calculated from the standard deviation of the elastic ε a,ela and plastic strain ε a,pla compared to the plastic and elastic strain-life curves for a probability of survival of P S = 50 % determined by the proposed procedure in [36]. A normal distribution is assumed for the scatter of the experimental results. The standard deviation is the sum of the squared logarithmic deviation of the experimental results from the 50 %-strain-life curve, Equation (3). The scatter band T ε is calculated from the standard deviation s and the z-value for a probability of survival P S = 10 % and P S = 90 % (z = 2.5631) according to Equation (4).
The strain-life curve with a probability of survival P S = 90 % and P S = 10 % is obtained by multiplying by the square root of T ε,ela and T ε,pla and by multiplying by the square root of 1·T ε,ela −1 and 1/T ε,pla −1, respectively, according to Equations (5) and (6).
Also, for the cyclic stress–strain curves according to Ramberg-Osgood [37], Equation (7), a scatter band was derived. The elastic strain ε a,ela is determined as the quotient of the stress amplitude σ a and the Young’s modulus E. Consequently, the plastic strain ε a,pla is the difference between the elastic strain ε a,ela and the total strain ε a,t. A linear relation is found by plotting the stress amplitude σ a against the plastic strain ε a,pla in a double logarithmic diagram. From the linear relation, the cyclic strain hardening coefficient K′ is obtained as the strain amplitude σ a at 100 % plastic strain ε a,pla and the cyclic strain hardening exponent n’ from the slope of the linear relation [36].
The scatter band of the cyclic stress–strain curve is calculated from the standard deviation of the stress amplitudes σ a compared to the linear relation σ a,50 %, following the proposed procedure in [36]. A normal distribution is assumed for the scatter of the experimental results. The standard deviation is the sum of the squared logarithmic deviation of the experimental results from the linear relation σ a,50 %, Equation (8). The scatter band T σ is calculated from the standard deviation s and the z-value for a probability of occurrence of P o = 10 % and P o = 90 % (z = 2.5631) according to Equation (9).
The stress–strain curve with a probability of occurrence P o = 90 % and P o = 10 % is obtained by multiplying by the square root of T σ and by multiplying by the square root 1/T σ according to Equations (10) and Equation (11). Since the linear relation between the stress amplitude and the plastic strain is obtained in the double logarithmic diagram, while the cyclic stress–strain curve is plotted on linear axes, the scatter seems to increase toward higher strain amplitudes.
4 Results and discussion
4.1 Strain-life behavior
In the following, the determined results are discussed based on a summary of the different materials and microstructures evaluated. For this purpose, Figure 10 depicts the fatigue results determined for EN-GJS-400-18LT where in a first step the scatter bands of all fatigue results based on 5 different microstructures are evaluated separately for the trilinear elastic and plastic strain-life curve. While no comparable data for scatter bands of the plastic regime are available [4], [6], provide comparable data for the SN-curve based on stress-controlled fatigue tests. In direct comparison, results show that even a common evaluation of all available test data given in Table 3 do not exceed a maximum scatter band of T ε,el = 1:1.33, which is fairly good agreement with typical scatter bands given in [4], [6] for thick-walled nodular cast iron by T σ = 1:1.30. Remarkable: Those values given in literature were provided for only on material and one microstructure, whereas Figure 10 summarizes grades with different microstructure taken from different cast components and samples. Additionally, Figure 11 summarizes both the elastic and the plastic strain-life curve.
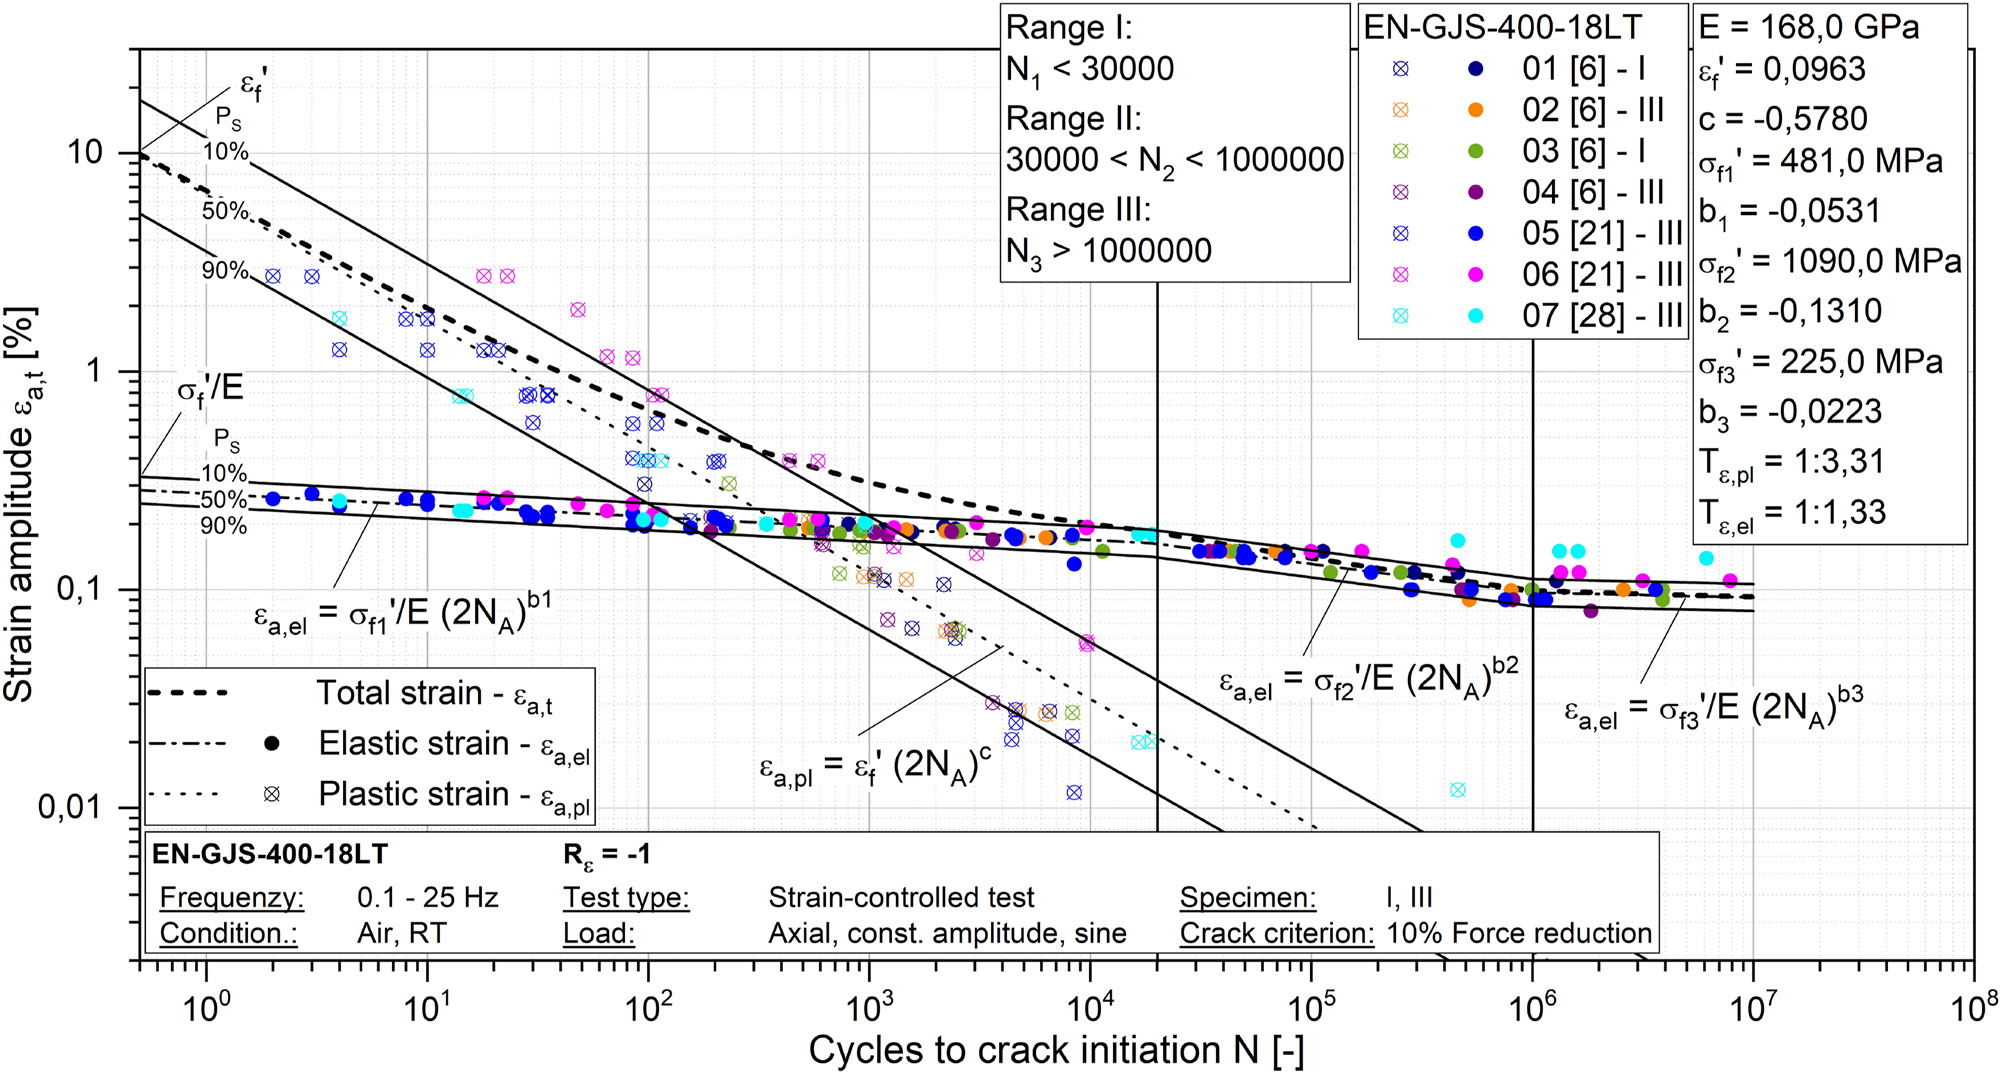
Evaluation of the scatter bands of the trilinear elastic and plastic strain-life curve for EN-GJS-400-18LT.
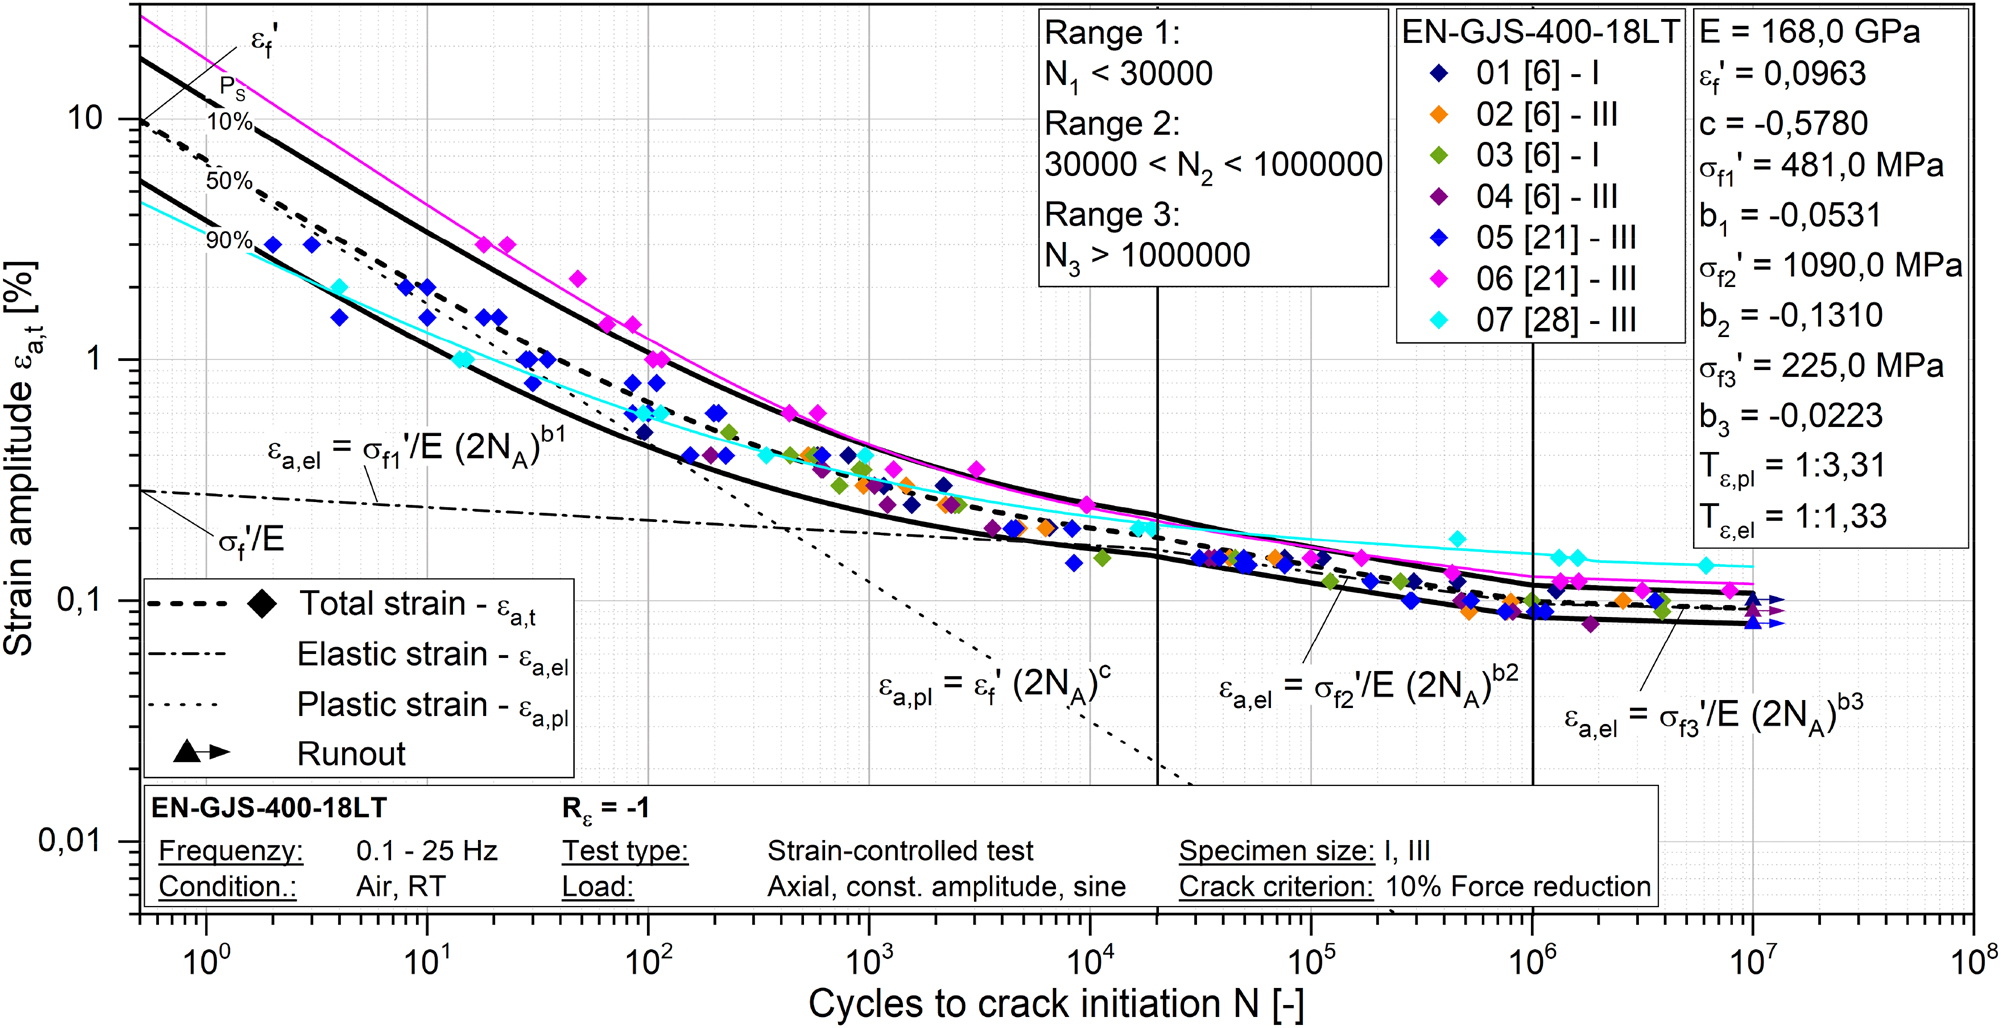
Evaluation of the scatter band of the total strain-life curve for EN-GJS-400-18LT.
Figure 12 summarizes the determined and material grade related strain-life curves with the overall scatter bands for EN-GJS-400-18LT (5 different microstructures), EN-GJS-450-18 (3 different microstructures), EN-GJS-700-2 (9 different microstructures), and ADI (11 different microstructures within a range of ADI-800 to ADI-1050). As expected, in the linear elastic regime, ADI shows the highest fatigue strength and followed by EN-GJS-700-2, EN-GJS-450-18, and EN-GJS-400-18LT. In comparison to EN-GJS-400-18LT (T ε,el,400 = 1:1.33) and EN-GJS-450-18 (T ε,el,450 = 1:1.20), the strain-life curves for EN-GJS-700-2 and ADI exceed these values with T ε,el,700 = 1:1.48 and T ε,el,ADI = 1:1.46, which can be referred to the higher maximum number of microstructures that were used for the evaluation. Nevertheless, results give a fairly good understanding of the development of the scatter band for the different materials. This helps to get a better lifetime assessment for components and a feeling of typical maximum values for a material grade in the sense of a “worst-case” approach.
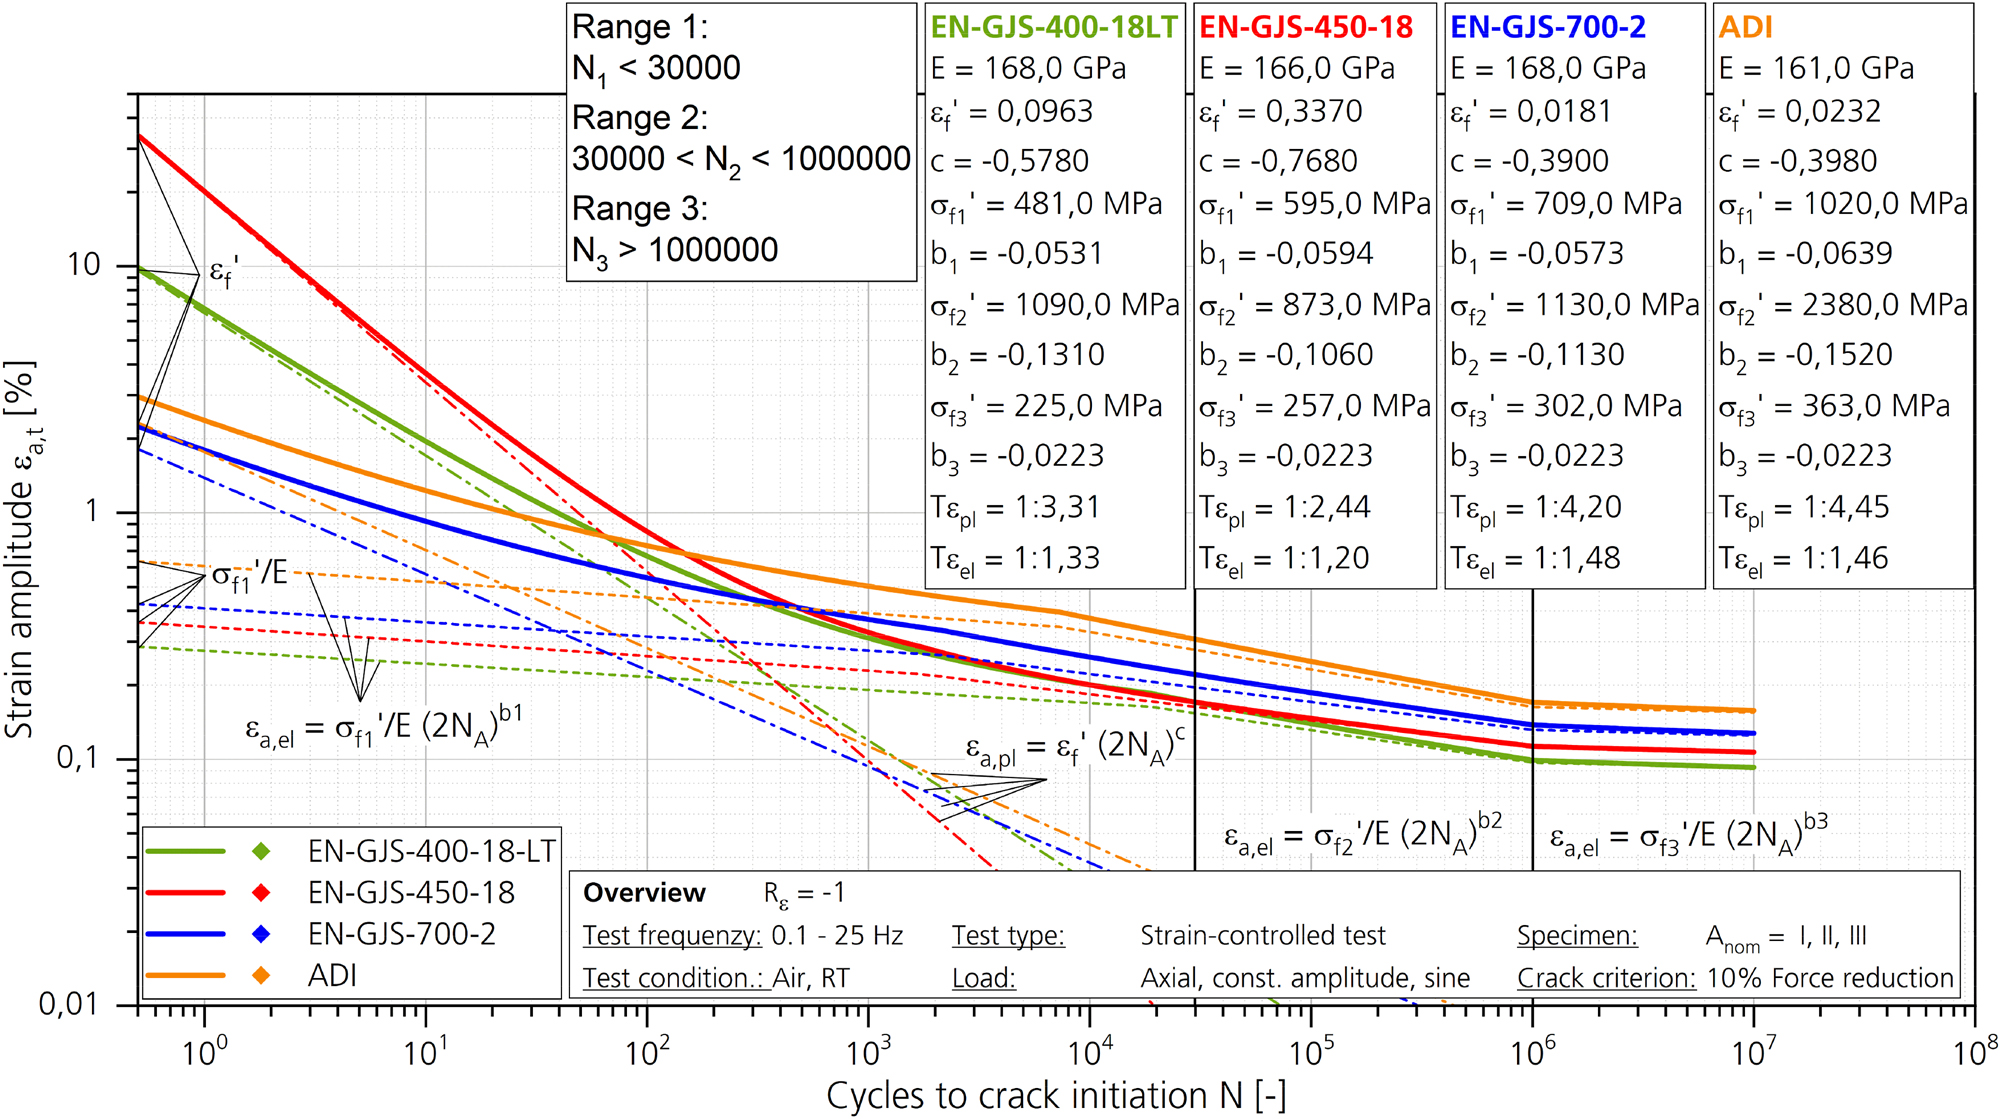
Evaluation of the strain-life curve from EN-GJS-400-18LT, EN-GJS-450-18, EN-GJS-700-2, and ADI.
For the plastic strain-life curve, scatter bands between T ε,pl = 1:4.45 for ADI and T ε,pI = 1:2.44 were determined depicting the same relationship within the materials investigated as for the elastic strain-life curve.
In the direct comparison of the high strength materials EN-GJS-700-2 and ADI, the austenitic–ferritic material shows both in the low- and high-cycle regime the best fatigue strength, which can be referred to the higher tensile strength and the higher elongation A5. A bit surprising, this is also the case for the comparison of EN-GJS-400-18LT and EN-GJS-450-18 although the solid-solution strengthened material grade regularly has a lower elasticity and elongation in comparison to EN-GJS-400-18LT. So at least for low-cycle fatigue, a lower fatigue strength for EN-GJS-450-18 could be expected. All parameters of the strain-life and cyclic stress–strain curves for each test series and as a summary of the different material investigations are gathered in Table 5 and Table 6 for EN-GJS-400-18LT, EN-GJS-450-18, EN-GJS-500-14, EN-GJS-600-3, EN-GJS-700-2, and ADI.
Determined parameters for the strain-life and cyclic stress–strain curves for each material grade.
| Material | EN-GJS-400-18LT | EN-GJS-450-18 | EN-GJS-500-14 | EN-GJS-600-3 | EN-GJS-700-2 | |||||||||||||||
|---|---|---|---|---|---|---|---|---|---|---|---|---|---|---|---|---|---|---|---|---|
| Test series | 01 | 02 | 03 | 04 | 05 | 06 | 07 | 08 | 09 | 10 | 11 | 12 | 13 | 14 | 15 | 16 | 17 | 18 | 19 | 20 |
| E [GPa] | 164.5 | 168.9 | 168.9 | 168.0 | 168.0 | 167.8 | 169.7 | 163.4 | 168.7 | 163.2 | 165.9 | 167.1 | 166.6 | 170.8 | 162.8 | 162.8 | 165.5 | 165.5 | 165.5 | 162.0 |
| K′ [MPa] | 455.1 | 453.9 | 408.0 | 421.3 | 618.6 | 568.7 | 563.0 | 590.9 | 663.5 | 641.8 | 618.9 | 584.1 | 922.7 | 1080.5 | 1004.8 | 1022.8 | 893.8 | 843.6 | 943.3 | 1030.9 |
| n′ [−] | 0.0545 | 0.0533 | 0.0391 | 0.0465 | 0.0970 | 0.0806 | 0.0754 | 0.0576 | 0.0782 | 0.0781 | 0.0724 | 0.0597 | 0.1140 | 0.1306 | 0.1056 | 0.1066 | 0.0929 | 0.0877 | 0.1152 | 0.1277 |
| T σ | 1.06 | 1.03 | 1.04 | 1.05 | 1.16 | 1.10 | 1.09 | 1.04 | 1.04 | 1.05 | 1.07 | 1.05 | 1.13 | 1.10 | 1.04 | 1.07 | 1.09 | 1.02 | 1.06 | 1.04 |
| R′ p0,2 % [%] | 324 | 326 | 320 | 316 | 339 | 345 | 352 | 413 | 408 | 395 | 395 | 403 | 454 | 480 | 521 | 527 | 502 | 489 | 461 | 466 |
| ε′f [m/m] | 0.1104 | 1.0420 | 0.2486 | 0.1792 | 0.1057 | 0.2667 | 0.0426 | 0.6855 | 1.2478 | 0.5322 | 0.5112 | 0.0673 | 0.0649 | 0.0496 | 0.3355 | 0.7784 | 0.0508 | 0.0808 | 0.0140 | 0.0894 |
| c [−] | −0.6011 | −0.8830 | −0.6970 | −0.6864 | −0.6417 | −0.6223 | −0.4649 | −0.8269 | −0.9225 | −0.8373 | −0.8184 | −0.5821 | −0.6177 | −0.4336 | −0.7487 | −0.8940 | −0.5268 | −0.6015 | −0.4091 | −0.5148 |
| σ′f,1 [MPa] | 381.4 | 449.0 | 463.7 | 369.8 | 493.8 | 507.5 | 452.4 | 630.7 | 692.2 | 607.8 | 587.5 | 526.6 | 680.2 | 729.8 | 876.9 | 986.7 | 659.3 | 791.3 | 593.5 | 756.5 |
| b 1 [−] | −0.0255 | −0.0454 | −0.0524 | −0.0252 | −0.0608 | −0.0490 | −0.0392 | −0.0608 | −0.0763 | −0.0647 | −0.0589 | −0.0462 | −0.0714 | −0.0566 | −0.0764 | −0.0941 | −0.0453 | −0.0741 | −0.0546 | −0.0656 |
| σ′f,2 [MPa] | 1564.5 | 1745.3 | 887.1 | 1249.4 | 1506.6 | 827.7 | 1386.5 | 973.1 | 1221.3 | 1648.2 | 1003.2 | 827.6 | 3224.9 | 947.1 | 2224.4 | 16629.8 | 1030.7 | 4689.1 | 1076.4 | 992.1 |
| b 2 [−] | −0.1542 | −0.1702 | −0.1158 | −0.1468 | −0.1629 | −0.0960 | −0.1153 | −0.1084 | −0.1269 | −0.1603 | −0.1216 | −0.1027 | −0.1966 | −0.0797 | −0.1698 | −0.3348 | −0.1112 | −0.2287 | −0.1237 | −0.0939 |
| σ′f,3 [MPa] | 230.6 | 204.0 | 228.2 | 205.0 | 196.0 | 283.8 | 336.9 | 278.7 | 267.6 | 202.1 | 237.5 | 257.7 | 257.1 | 411.4 | 261.6 | 221.6 | 283.7 | 203.5 | 247.0 | 350.9 |
| 1:T ε,pl | 2.31 | 1.39 | 1.43 | 1.89 | 2.42 | 1.47 | 2.26 | 1.91 | 1.74 | 1.35 | 1.29 | 1.35 | 2.80 | 1.61 | 2.04 | 2.12 | 1.96 | 1.66 | 2.28 | 1.50 |
| 1:T ε,el | 1.11 | 1.17 | 1.12 | 1.09 | 1.19 | 1.11 | 1.07 | 1.13 | 1.13 | 1.16 | 1.10 | 1.23 | 1.19 | 1.15 | 1.19 | 1.27 | 1.20 | 1.26 | 1.20 | 1.07 |
| N k,1 | 3,00·104 | 3,00·104 | 3,00·104 | 3,00·104 | 3,00·104 | 3,00·104 | 3,00·104 | 3,00·104 | 3,00·104 | 3,00·104 | 3,00·104 | 1,50·104 | 3,00·104 | 3,00·104 | 3,00·104 | 3,00·104 | 2,00·104 | 3,00·104 | 3,00·104 | 3,00·104 |
| N k,2 | 1,00·106 | 1,00·106 | 1,00·106 | 1,00·106 | 1,00·106 | 1,00·106 | 2,00·106 | 1,00·106 | 1,00·106 | 2,00·106 | 1,00·106 | 1,00·106 | 1,00·106 | 1,00·106 | 1,00·106 | 5,00·105 | 1,00·106 | 2,00·106 | 1,00·106 | 1,00·106 |
| Number of single tests | 15 | 15 | 18 | 14 | 43 | 20 | 14 | 14 | 15 | 14 | 16 | 13 | 14 | 16 | 15 | 13 | 15 | 15 | 20 | 20 |
| Material | EN-GJS-700-2 | ADI-800 | ADI-900 | ADI-1050 | ||||||||||||
|---|---|---|---|---|---|---|---|---|---|---|---|---|---|---|---|---|
| Test series | 21 | 22 | 23 | 24 | 25 | 26 | 27 | 28 | 29 | 30 | 31 | 32 | 33 | 34 | 35 | 36 |
| E [GPa] | 171.8 | 170.4 | 170.5 | 169.1 | 168.8 | 163.0 | 155.2 | 163.8 | 166.0 | 166.7 | 161.3 | 165.8 | 163.2 | 160.2 | 160.4 | 160.0 |
| K’ [MPa] | 1163.2 | 1257.5 | 1134.0 | 1706.3 | 1550.5 | 2081.1 | 1858.0 | 1681.6 | 1552.1 | 1466.7 | 1785.6 | 2046.7 | 1583.2 | 1833.1 | 1942.0 | 2108.1 |
| n’ [−] | 0.1144 | 0.1286 | 0.1133 | 0.1378 | 0.1284 | 0.1818 | 0.1631 | 0.1452 | 0.1430 | 0.1276 | 0.1517 | 0.1747 | 0.1374 | 0.1411 | 0.1644 | 0.1790 |
| T σ | 1.06 | 1.08 | 1.03 | 1.09 | 1.14 | 1.10 | 1.07 | 1.09 | 1.12 | 1.13 | 1.08 | 1.10 | 1.02 | 1.33 | 1.13 | 1.09 |
| R′ p0,2 % [%] | 571 | 565 | 561 | 725 | 698 | 672 | 674 | 682 | 638 | 664 | 696 | 691 | 674 | 763 | 699 | 693 |
| ε′f [m/m] | 0.0254 | 0.0130 | 0.0084 | 0.0193 | 0.0140 | 0.0095 | 0.1108 | 0.0482 | 0.0444 | 0.0667 | 0.0236 | 0.0157 | 0.0360 | 0.0459 | 0.0356 | 0.0158 |
| c [−] | −0.3796 | −0.3936 | −0.3830 | −0.4024 | −0.4438 | −0.3574 | −0.5726 | −0.4326 | −0.5118 | −0.5599 | −0.4627 | −0.3148 | −0.4980 | −0.4296 | −0.4649 | −0.4251 |
| σ′f,1 [MPa] | 771.3 | 722.3 | 720.5 | 988.1 | 965.2 | 901.2 | 1333.4 | 1033.3 | 1007.5 | 1037.1 | 1012.2 | 967.4 | 998.0 | 1227.1 | 1082.7 | 1006.2 |
| b 1 [−] | −0.0450 | −0.0515 | −0.0652 | −0.0551 | −0.0753 | −0.0666 | −0.0978 | −0.0555 | −0.0752 | −0.0713 | −0.0703 | −0.0491 | −0.0678 | −0.0661 | −0.0702 | −0.0759 |
| σ′f,2 [MPa] | 1641.6 | 1507.6 | 4675.2 | 2555.5 | 2041.5 | 2236.1 | 1079.6 | 7759.6 | 2861.1 | 1244.3 | 3048.8 | 2717.2 | 2411.8 | 3645.8 | 1933.9 | 1377.9 |
| b 2 [−] | −0.1100 | −0.1300 | −0.2235 | −0.1432 | −0.1598 | −0.1653 | −0.0830 | −0.2288 | −0.1733 | −0.1046 | −0.1733 | −0.1658 | −0.1756 | −0.1628 | −0.1303 | −0.1089 |
| σ′f,3 [MPa] | 459.9 | 315.9 | 219.5 | 442.0 | 252.3 | 280.6 | 447.1 | 387.7 | 330.9 | 356.2 | 340.9 | 338.7 | 234.6 | 474.5 | 403.6 | 369.3 |
| 1:T ε,pl | 2.21 | 1.63 | 1.99 | 3.71 | 1.34 | 2.16 | 2.22 | 2.92 | 2.50 | 2.26 | 3.60 | 2.13 | 2.31 | 2.42 | 2.70 | 4.11 |
| 1:T ε,el | 1.19 | 1.08 | 1.17 | 1.26 | 1.20 | 1.10 | 1.16 | 1.26 | 1.32 | 1.12 | 1.19 | 1.14 | 1.20 | 1.27 | 1.26 | 1.21 |
| N k,1 | 3,00·104 | 3,00·104 | 3,00·104 | 3,00·104 | 3,00·104 | 3,00·104 | 1,75·104 | 3,00·104 | 3,00·104 | 3,00·104 | 3,00·104 | 8,00·103 | 3,00·104 | 3,00·104 | 3,00·104 | 1,50·104 |
| N k,2 | 1,00·106 | 1,00·106 | 2,00·106 | 1,00·106 | 2,00·106 | 1,00·106 | 1,00·106 | 1,00·106 | 8,00·105 | 2,00·106 | 1,00·106 | 1,00·106 | 2,00·106 | 1,00·106 | 1,00·106 | 2,00·106 |
| Number of single tests | 15 | 14 | 15 | 14 | 12 | 18 | 20 | 26 | 12 | 13 | 15 | 13 | 11 | 13 | 15 | 13 |
Determined parameters for the material specific and summarized strain-life and cyclic stress–strain curves.
| Material | EN-GJS-400-18LT | EN-GJS-450-18 | EN-GJS-500-14 | EN-GJS-600-3 | EN-GJS-700-2 | ADI |
|---|---|---|---|---|---|---|
| E [GPa] | 168.0 | 165.7 | 166.6 | 170.8 | 166.1368 | 161.2 |
| K′ [MPa] | 588.0 | 643.8 | 922.7 | 1080.5 | 997.3 | 1911.4 |
| n′ [−] | 0.0890 | 0.0759 | 0.1140 | 0.1306 | 0.1061 | 0.1631 |
| T σ | 1.14 | 1.08 | 1.13 | 1.10 | 1.24 | 1.17 |
| R′ p0,2 % [%] | 338 | 402 | 454 | 480 | 516 | 694 |
| ε′f [m/m] | 0.0963 | 0.3368 | 0.0649 | 0.0496 | 0.0181 | 0.02323 |
| c [−] | −0.5777 | −0.7677 | −0.6177 | −0.4336 | −0.3902 | −0.3978 |
| σ′f,1 [MPa] | 480.6 | 595.4 | 680.2 | 729.8 | 708.7 | 1024.3 |
| b 1 [−] | −0.0531 | −0.0594 | −0.0714 | −0.0566 | −0.0573 | −0.06391 |
| σ′f,2 [MPa] | 1093.6 | 873.5 | 3224.9 | 947.1 | 1133.0 | 2381.3 |
| b 2 [−] | −0.1312 | −0.1065 | −0.1966 | −0.0797 | −0.1134 | −0.1519 |
| σ′f,3 [MPa] | 225.1 | 257.4 | 257.1 | 411.4 | 302.0 | 363.2 |
| 1:T ε,pl | 3.31 | 2.44 | 2.80 | 1.61 | 4.20 | 4.45 |
| 1:T ε,el | 1.33 | 1.20 | 1.19 | 1.15 | 1.48 | 1.46 |
| N k,1 | 3·104 | 3·104 | 3·104 | 3·104 | 3·104 | 3·104 |
| N k,2 | 1·106 | 1·106 | 1·106 | 1·106 | 1·106 | 1·106 |
4.2 Stress–strain behavior
Also, the cyclic stress–strain behavior was closely investigated and for each material grade summarized curves with scatter bands evaluated. The results for EN-GJS-400-18LT are to be found in Figure 13, while Figure 14 depicts a comparison for the cyclic stress–strain curves for EN-GJS-400-18LT, EN-GJS-450-18, EN GJS 700-2, and ADI. In relation to their tensile strength, ADI shows the highest strength followed by the pearlitic EN-GJS-700-2 and the two ferritic grades. Also, for the cyclic stress–strain curves, the higher scatter bands of the ausferritic and pearlitic grades are obvious related to the strain-life curves. Exemplarily at 1 %, total strain EN-GJS-400-18LT reaches with a probability of occurrence Po = 50 % a nominal stress amplitude of σ a = 381 MPa while EN-GJS-450-18 reaches an amplitude of σ a = 442 MPa. Even higher values found for EN-GJS-700-2 with σ a = 584 MPa and σ a = 805 MPa for ADI, respectively.

Cyclic stress–strain curve from EN-GJS-400-18LT.

Evaluation of the cyclic stress–strain curve from EN-GJS-400-18LT, EN-GJS-450-18, EN-GJS-700-2, and ADI.
In comparison to EN-GJS-400-18LT (T σ,400 = 1:1.14) and EN-GJS-450-18 (T σ,450 = 1:1.08), the scatter of the stress–strain curves for EN-GJS-700-2 and ADI exceed these values with T σ,700 = 1:1.24 and T σ,400 = 1:1.17. A closer look into the cyclic hardening of the different materials reveals that EN-GJS-700-2 and ADI show a more or less strong cyclic hardening effect in relation to their different microstructures. Hence, this results in an increased scatter T σ for the high-strength materials. This effect could not be determined for the microstructures related to EN-GJS-400-18LT and EN-GJS-450-18. Here, all microstructures showed a comparable hardening effect resulting in a lower scatter band.
4.3 Scatter band
Since the scatter bands shown in the log-normal probability plots in Figure 15 closely follow the reference line for the elastic and the plastic scatter bands, a logarithmic normal distribution is assumed for the occurrence of the scatter bands. Considering the logarithmic normal distribution and a probability of occurrence T o = 95 %, the elastic and plastic scatter bands are T ε,ela < 1.28 and T ε,pla < 3.33. These limit values can be used for an estimation of the elastic and plastic scatter bands when a more precise knowledge of the material or component specific scatter band is not available. For a more conservative estimate, the confidence intervals 95 % are also depicted in Figure 15. At probability of occurrence of T o = 95 % with a confidence interval of 95 %, the overall elastic and plastic scatter bands increase to T ε,ela = 1.32 and T ε,pla = 3.87.

Lognormal probability diagram of the scatter bands for the elastic and plastic as well as for the cyclic stress–strain curve.
Furthermore, a scatter band T σ = 1.13 for the cyclic stress–strain curve with a probability of occurrence T o = 95 % is calculated. If additionally a 95 % confidence interval is assumed, the scatter band reaches T σ = 1.15.
4.4 Size effects
The size effect reveals influence coming from specimen size, microstructure, and local geometrical influences of components [3]. In addition to the investigations in [38], the influence of microstructure and specimen size is discussed for the present strain-based investigations, while a geometrical size effect was not able to be determined since only fatigue tests on unnotched specimens were conducted. To assess the influence of specimen size, for each of the three materials from [6], a combined trilinear stress-life curve was evaluated. Afterward, the logarithmic distance in lifetime direction of each individual specimen tested in [6] was determined and plotted in a boxplot diagram per specimen size. Figure 16 shows the boxplot diagram where no statistical size effect can be significantly determined. So, the evaluation of the gathered data showed no significant influence of specimen size and thus a statistical size effect on the strain-life behavior for the different cast iron grades. Only in tendency, the mean values for the small specimens showed a higher fatigue strength than for the large specimens.

Influence of specimen size (statistical size effect).
For the evaluation of the technological size effect in Figure 17 depicts exemplarily the strain-life curves of three EN-GJS-400-18LT microstructures derived by sand (TS05 and TS06) and chill casting (TS07) as well as a reference picture for each microstructure. Obviously large deviations exist between the different strain-life curves. In the medium and high cycle fatigue regime, the TS07 material cast in chills shows the best performance with the highest fatigue strength compared to the sand castings. And from taking into account the fine distributed microstructure with a high graphite particle density, this seems to be reasonable. Within the sand castings, TS06 shows the better fatigue strength in comparison to the quite coarse microstructure of TS05 having mostly a graphite form V and a quite low nodularity (74 %). Nevertheless, in the low cycle fatigue regime, relations change since the chill cast EN-GJS-400-18LT performs worst within all investigated EN-GJS-400-18LT microstructures. This reveals strong influence of the microstructures and thus the technological size effect on lifetime and material performance. Moreover, it seems that a high graphite particle density will not necessarily lead to a high fatigue strength in the elasto-plastic regime. These results raise the question of whether not only the graphite particle density but also the number of grain boundaries and the size of the grains play a decisive role in this case.

Influence of microstructure (technological size effect).
4.5 Determination of the stress–strain curve parameters from quasi-static material data
The large set of data being developed and investigated opens the question if the parameters for the strain-life and the cyclic stress–strain curves might be related to certain quasi-static or other material dependent material parameters, similar to the Uniform Material Law employed by Bäumel and Seeger [39]. Thus, in a first step, Figure 18 shows a linear regression between the tensile strength with the cyclic hardening coefficient K′ including all derived data added by parameters available from literature. The strain-life curve lines found in the literature [12], [15], [16], [17], [18], [19] often consist of only a few individual test results (n > 10) and can, therefore, only be considered for qualitative comparisons. In the evaluation of the regression lines, these are not included. Although a large variety of materials and microstructures is included, a fairly good regression between both parameters is obtained. Figure 19 depicts the regression between the tensile strength R m and the cyclic hardening exponent n’. Although the regression coefficient is somewhat lower than for the correlation to the cyclic hardening coefficient K′ also, here a good relationship between R m and n′ is visible. With the help of both regressions at least an approximation of K′ and n′ is possible when measured and microstructure related data for R m are available.

Regression between the tensile strength R m and the cyclic hardening coefficient K′

Regression between the tensile strength R m and the cyclic hardening exponent n’
5 Conclusions
Within the present paper, a large number of strain-based fatigue data for thick-walled nodular cast iron materials were gathered and analyzed. It was tried to draw some wide-ranging summarizes for ferritic, pearlitic, and ausferritic materials as well as corresponding strain-life and cyclic stress–strain curves. By assessing the variety of the different microstructures within the different cast iron grades, it was possible to make an assessment of scatter bands both for the strain-life and the cyclic stress–strain curve to provide data for a strain-based lifetime assessment including safety numbers, e.g., according to [36]. In this case, it is worth mentioning that scatter bands within for the elastic and the plastic strain-life curve did not exceed T ε,el = 1:1.46 and T ε,pl = 1:4.45 for all materials.
The overall comparison of the different microstructures and grades showed some unexpected effects in the low-cycle fatigue regime, e.g., for chill cast EN-GJS-400-18LT. In further investigations, the additional effect of the microstructure like graphite particle density and grain size need to be included in the evaluation to receive a complete picture of the material behavior and thus all necessary data for an optimized lifetime assessment. So far it can clearly be stated that a technological size effect is present for all materials, which was explicitly discussed for EN-GJS-400-18LT. In any case, also for the other material grades, a comparable effect was visible for instance by different cyclic hardening effects within the pearlitic and ausferritic grades. Unfortunately, an overall statistical size effect based on a comparison of fatigue results derived from two different specimen sizes could only not be revealed clearly.
Additional attempts were made to compare quasi-static material parameters with the parameters K′ and n’ for the cyclic stress–strain curve showing good regressions between both values and the tensile strength R m. Nevertheless, the authors were not able to derive comparable regressions for the parameters of the strain-life curve, as well. This aspect will be investigated further on.
The data within the present work shall give design engineers a sufficient and good overview about the cyclic strain-based material behavior of nodular cast iron for large applications to enable a lightweight design as well as a proper reliability. Especially for components being now and then suspected to local elasto-plastic strains coming from extreme loads, the determined data will enable an improved lifetime assessment also including scatter bands for the strain-life and cyclic stress–strain curve including safety numbers.
Funding source: Bundesministerium für Wirtschaft und Klimaschutz
Award Identifier / Grant number: 0324329
Award Identifier / Grant number: 0325239
Award Identifier / Grant number: 0325707
Award Identifier / Grant number: 03EE2007
Award Identifier / Grant number: 03ET1555
About the authors
Dr. Christoph Bleicher, born in 1984, studied Mechanical Engineering at the Technische Universität Darmstadt, Germany, and Industrial Engineering and Management at the Hochschule Darmstadt, University of Applied Sciences, Germany. Since 2010, he has been working as a research assistant for the Fraunhofer Institute for Structural Durability and System Reliability LBF in Darmstadt, Germany, on the fatigue assessment of cast components. In 2016, he presented his doctoral thesis with the title “Ein Beitrag zur Beurteilung der Schwingfestigkeit von Großgussbauteilen aus Gusseisen mit Kugelgraphit mit besonderer Berücksichtigung der Auswirkungen von Lunkern auf die Bauteillebensdauer” at the Technische Universität Darmstadt, Germany. From 2019 on, he led the group “Qualification of cast components” working on the overall lifetime assessment of castings. In 2022, he became Director of the Division “Structural Durability” at Fraunhofer LBF.
Christian Pittel, MSc, studied mechanical engineering at the Technical University of Darmstadt and joined the research group “Qualification of cast components” at the Fraunhofer Institute for Structural Durability and System Reliability in Darmstadt, Germany in 2019. In the context of two research projects, he worked on the linkage of information on imperfection, such as dross, shrinkages, and chunky graphite, from casting simulation and nondestructive testing into lifetime assessment concepts as well as on correlating microstructural properties with the fatigue strength of thick-walled iron castings.
Axel Kansy studied lightweight design at Aalen University of applied science and worked in the university’s foundry laboratory as a research assistant in the field of zinc die casting after graduating. He then joined the research group “Qualification of cast components” at the Fraunhofer Institute for Structural Durability and System Reliability in Darmstadt, Germany in 2020. His main topics are the investigation of the cyclic material behavior of lamellar graphite cast iron and nonferrous metals as well as the material behavior in corrosive and hydrogen environments.
Jan Niewiadomski, MSc, born in 1991, studied Mechanical and Process Engineering at the Technische Universität Darmstadt, Germany. Since 2018, he has been working as a research assistant for the Fraunhofer Institute for Structural Durability and System Reliability LBF in Darmstadt, Germany. In 2022, he took over the group leadership of the group “Qualification of cast components” at the Fraunhofer LBF.
Dr. Heinz Kaufmann, born in 1960, studied Mechanical Engineering at the Technische Universität Darmstadt, Germany, and graduated in 1985. In 1998, he presented his doctoral thesis on “The Dimensioning of Cyclically Loaded Thick-Walled Components of Cast Ductile Iron GGG-40 Considering Microstructural Degenerations from Casting” at Saarland University, Saarbrücken, Germany. He joined the Fraunhofer LBF in 1986 and was Head of the Competence Center “Component-Related Material Behavior” from 2003 to 2012. Since 2012, he has been Head of the Department “Materials and Components.”
Acknowledgments
All project partners are thanked for their participation and support to complete this project successfully.
-
Research ethics: Not applicable.
-
Author contributions: The authors have accepted responsibility for the entire content of this manuscript and approved its submission.
-
Competing interests: All other authors state no conflict of interest.
-
Research funding: The results presented in this paper were derived during the research project „GaßnerWind“ (grant number 0325707) [21], “Lunkerfest” (grant number 0325239) [40], “Gusswelle” (grant number 0324329) [22], “Gusszahnrad” (grant number 03ET1555) [25], “SiGuphit-B3” (grant number 03EE2007) [23]. For the funding of this project, sincere thanks are given to the German Federal Ministry of Economic Affairs and Climate Action (BMWK).
-
Data availability: The raw data can be obtained on request from the corresponding author.
References
[1] Richtlinie nichtlinear, “Rechnerischer Festigkeitsnachweis unter expliziter Erfassung nichtlinearen Werkstoffverformungsverhaltens,” in FKM-Guideline, 2019, [Online]. Available at: https://www.vdmashop.de/fkm-richtlinien/4/richtlinie-nichtlinear.Search in Google Scholar
[2] Machinery for wind turbines, DNVGL-ST-0361, 2016, [Online]. Available at: https://www.dnv.com/energy/standards-guidelines/dnv-st-0361-machinery-for-wind-turbines.html.Search in Google Scholar
[3] K. H. Kloos, Einfluss des Oberflächenzustandes und der Probengröße auf die Schwingfestigkeitseigenschaften, VDI, Darmstadt, Germany, VDI-Berichte 268, 1976, pp. 63–76.Search in Google Scholar
[4] H. Kaufmann, “Zur schwingfesten Bemessung dickwandiger Bauteile aus GGG-40 unter Berücksichtigung gießtechnisch bedingter Gefügeungänzen,” Ph.D. dissertation, Fraunhofer Institute LBF, Darmstadt, Germany, 1998.Search in Google Scholar
[5] M. Shirani, “Probabilistic and Defect Tolerant Fatigue Assessment of Wind Turbine Casting,” Ph.D. dissertation, Norwegian University of Science and Technology, Trondheim, Norway, 2011.Search in Google Scholar
[6] C. Bleicher, “Ein Beitrag zur Beurteilung der Schwingfestigkeit von Gusseisen mit Kugelgraphit mit besonderer Berücksichtigung der Auswirkungen von Lunkern auf die Bauteillebensdauer,” Ph.D. dissertation, Technische Universität Darmstadt, Fraunhofer Institute LBF, Darmstadt, Germany, ISBN: 978-3-8396-1048-0, 2016.Search in Google Scholar
[7] J. R. Bisping, “Entwicklung einer Bemessungsmethode für Mahlanlagen in der Zementindustrie am Beispiel von Vertikalrollenmühlen,” Ph.D. dissertation, Technische Universität Darmstadt, Fraunhofer Institute LBF, Darmstadt, Germany, 2014.Search in Google Scholar
[8] P. Kaizinger, C. Guster, M. Severing, and H. Ballmes, “Bewertung des Einflusses von Defekten auf die Schwingfestigkeit von Gusseisen mit Kugelgraphit,” in DVM-Bericht 1681, Germany, Herzogenaurach, 2014, pp. 19–27.Search in Google Scholar
[9] J. Niewiadomski, C. Bleicher, and H. Kaufmann, “Influence of the chill casting process on the cyclic material behavior of nodular cast iron,” in International Ocean and Polar Engineering Conference 2021, Proc. of ISOPE, Rhodos, Greece, 2021, pp. 2404–2411.Search in Google Scholar
[10] P. Čanžar, Z. Tonković, N. Drvar, A. Bakić, J. Kodvanj, and J. Sorić, “Experimental investigation and modelling of fatigue behaviour of nodular cast iron for wind turbine applications,” in EURODYN 2011, Proceedings of the 8th International Conference on Structural Dynamics, 2011, pp. 3252–3257.Search in Google Scholar
[11] P. Čanžar, Z. Tonković, and J. Kodvanj, “Microstructure influence on fatigue behaviour of nodular cast iron,” Mater. Sci. Eng., vol. 556, pp. 88–99, 2012, https://doi.org/10.1016/j.msea.2012.06.062.Search in Google Scholar
[12] B. Atzori, G. Meneghetti, and M. Ricotta, “Unified material parameters based on full compatibility for low-cycle fatigue characterisation of as-cast and austempered ductile irons,” Int. J. Fatig., vol. 68, pp. 111–122, 2014, https://doi.org/10.1016/j.ijfatigue.2014.05.012.Search in Google Scholar
[13] C. Bleicher, “Influence of different load histories on the cyclic material behavior of nodular cast iron for thick-walled application, in ISOPE 2018,” Int. J. Offshore Polar Eng., vol. 28, no. 3, pp. 294–302, 2018, https://doi.org/10.17736/ijope.2018.et03.Search in Google Scholar
[14] C. Bleicher, R. Wagener, H. Kaufmann, and T. Melz, “Fatigue behavior of large cast components under variable amplitude loading with overloads,” in WCX SAE World Congress Experience 2019, SAE Technical Paper, 2019.Search in Google Scholar
[15] P. Hübner, G. Pusch, and L. Krodel, “Fatigue behaviour of cast iron with globular graphite,” Adv. Eng. Mater., vol. 6, no. 7, pp. 541–544, 2004, https://doi.org/10.1002/adem.200400409.Search in Google Scholar
[16] T. Engelke, “Beitrag zur Ermüdungsfestigkeit von ADI-Gussbauteilen,” Ph.D. dissertation, Technische Universität Clausthal, Clausthal-Zellerfeld, Germany, 2019.Search in Google Scholar
[17] B. Šamec, I. Potrč, and M. Šraml, “Low cycle fatigue of nodular cast iron used for railway brake discs,” Eng. Fail. Anal., vol. 18, no. 6, pp. 1424–1434, 2011, https://doi.org/10.1016/j.engfailanal.2011.04.002.Search in Google Scholar
[18] F. Scacco, A. Campagnolo, M. Franceschi, and G. Meneghetti, “Strain-controlled fatigue behavior of a nodular cast iron in real off-highway axles: effects of casting skin and strain ratio,” Metals, vol. 12, no. 3, 2022, Art. no. 426, https://doi.org/10.3390/met12030426.Search in Google Scholar
[19] H. U. Leutwein, Einfluss von Autofrettage auf die Schwingfestigkeit innendruckbelasteter Bauteile aus Kugelgraphitguss, Ilmenau, Germany, Ph. D. dissertation, Technische Universität Ilmenau, 2008.Search in Google Scholar
[20] S. S. Manson, “Fatigue: a complex subject – some simple approximations,” Exp. Mech., vol. 5, no. 4, pp. 193–226, 1965, https://doi.org/10.1007/BF02321056.Search in Google Scholar
[21] C. Bleicher, J. Hesseler, R. Wagener, J. Baumgartner, and H. Kaufmann, Vereinfachte Bemessung von Eisengussbauteilen für Windenergieanlagen unter Berücksichtigung von Betriebsbelastungen und Sonderereignissen, Technical Report, Grant No. 0325707, Darmstadt, Germany, Fraunhofer Institute LBF, 2019.Search in Google Scholar
[22] J. Kirsch, H. Kyling, and J. Niewiadomski, Werkstoff- und Bauteiloptimierung für leistungsfähigere Gusskomponenten im Antriebsstrang von Windenergieanlagen durch den Einsatz von Kokillenguss, Technical Report, Grant No. 0324329A, Darmstadt, Germany, Fraunhofer Institute LBF, 2022.Search in Google Scholar
[23] C. Bleicher, “Bestimmung der Leistungsfähigkeit von hochsiliziumhaltigem Gusseisen mit Kugelgraphit für die sichere Bauteilbemessung nach Betriebsfestigkeits- und Bruchmechanikaspekten,” Proposal to the BMWK, grant number 03EE2007, 2019.Search in Google Scholar
[24] C. Bleicher, J. Niewiadomski, A. Kansy, and H. Kaufmann, “High-Silicon nodular cast iron for lightweight optimized wind energy components, in ISOPE 2022,” Int. J. Offshore Polar Eng., vol. 32, no. 2, pp. 201–209, 2022, https://doi.org/10.17736/ijope.2022.et06.Search in Google Scholar
[25] C. Bleicher, K. Lipp, C. Pittel, M. Gietzen, and A. Merten, “Optimierte und energieschonende Herstellung von Großzahnrädern aus Gusseisen mit Kugelgraphit,” Technical Report, Grant No. 03ET1555, Darmstadt, Germany, Fraunhofer Institute LBF, 2022.Search in Google Scholar
[26] C. Bleicher, R. Wagener, and H. Kaufmann, “Fatigue behavior of large cast components under variable amplitude loading with overloads,” SAE Technical Paper, 2019.10.4271/2019-01-0526Search in Google Scholar
[27] Microstructure of cast irons – Part 1: graphite classification by visual analysis, ISO 945-1:2019, 2019, [Online]. Available at: https://www.beuth.de/en/standard/din-en-iso-945-1/311655881.Search in Google Scholar
[28] J. Kirsch and J. Niewiadomski, “Development of a validated design methodology for hollow rotor shafts of wind turbines made of EN-GJS-400-18-LT,” in Congress for Intelligent Combining of Design, Casting, Computer Simulation, Checking and Cyclic Behaviour for Efficient Cast Components 2021, Darmstadt, Germany, 2021, pp. 133–146.Search in Google Scholar
[29] P. Trubitz, K. Koch, S. Grützner, S. Hübner, and L. Krüger, “Contribution to the determination and numerical evaluation of cyclic crack propagation in GJS,” in Congress for Intelligent Combining of Design, Casting, Computer Simulation, Checking and Cyclic Behaviour for Efficient Cast Components 2021, Darmstadt, Germany, 2021, pp. 47–60.Search in Google Scholar
[30] Testing and documentation guideline for the experimental determination of mechanical properties of steel sheets for CAE-calculations, SEP 1240:2006-07, 2006, [Online]. Available at: https://www.beuth.de/en/technical-rule/sep-1240/102501063.Search in Google Scholar
[31] L. A. Coffin, “A study of the effects of cyclic thermal stresses on a ductile metal,” Trans. ASME, vol. 76, no. 6, pp. 931–950, 1954, https://doi.org/10.1115/1.4015020.Search in Google Scholar
[32] O. H. Basquin, “The exponential law of endurance tests,” Am. Soc. Test.Mater. Proc., vol. 10, pp. 625–630, 1910.Search in Google Scholar
[33] J. D. Morrow, Cyclic plastic Strain Energy and Fatigue of Metals, ASTM STP 378, American Society for Testing and Materials, 1965, pp. 45–87.10.1520/STP43764SSearch in Google Scholar
[34] R. W. Wagener, “Zyklisches Werkstoffverhalten bei konstanter und variabler Beanspruchungsamplitude,” Ph.D. dissertation, Germany, TU Clausthal, Clausthal-Zellerfeld, 2011.Search in Google Scholar
[35] C. M. Sonsino, “Course of SN-curves especially in the high-cycle fatigue regime with regard to component design and safety,” Int. J. Fatig., vol. 29, no. 12, pp. 2246–2258, 2007, https://doi.org/10.1016/j.ijfatigue.2006.11.015.Search in Google Scholar
[36] E. Haibach, Betriebsfestigkeit, Verfahren und Daten zur Bauteilberechnung, ISBN-10 3-540-29363-9, 3th ed., Berlin, Germany, Springer, 2006.Search in Google Scholar
[37] W. Ramberg and W. R. Osgood, Description of Stress–Strain Curves by Three Parameters, NACA Technical Report No. 902, Washington, USA, NACA, 1943.Search in Google Scholar
[38] C. Bleicher, R. Wagener, H. Kaufmann, and T. Melz, “Fatigue strength of nodular cast iron with regard to heavy-wall applications,” Mater. Test., vol. 57, no. 9, pp. 723–731, 2015, https://doi.org/10.3139/120.110782.Search in Google Scholar
[39] A. BäumelJr. and T. Seeger, Materials Data for Cyclic Loading, Supplement 1, Amsterdam, Elsevier, 1990.Search in Google Scholar
[40] A. Heinrietz, C. Bleicher, J. Kurz, and J. Rabe, Ermüdungsfestigkeitsnachweis auf Basis zerstörungsfreier Prüfungen an dickwandigen Eisengussbauteilen in der Windenergie, Technical Report, Grant No. 0325239, Darmstadt, Germany, Fraunhofer Institute LBF, 2014.Search in Google Scholar
© 2024 the author(s), published by De Gruyter, Berlin/Boston
This work is licensed under the Creative Commons Attribution 4.0 International License.
Articles in the same Issue
- Frontmatter
- Strain-life behavior of thick-walled nodular cast iron
- A novel bearing fault detection approach using a convolutional neural network
- Improved Gx40CrNi25-20 grade austenitic stainless steel
- Enhanced strength of (CoFeNiMn)100−xCrx (x = 5, 20, 35 at.%) high entropy alloys via formation of carbide phases produced from industrial-grade raw materials
- Modeling of thrust force and torque in drilling aluminum 7050
- Construction of amidinothiourea crosslinked graphene oxide membrane by multilayer self-assembly for efficient removal of heavy metal ions
- Effect of tool rotational speed on friction stir spot welds of AZ31B Mg alloy to AISI 304 stainless steel
- A new enhanced mountain gazelle optimizer and artificial neural network for global optimization of mechanical design problems
- Effect of particle volume fraction on wear behavior in Al–SiC MMC coated on DIN AlZnMgCu1.5 alloy
- Processing, microstructural characterization, and mechanical properties of deep cryogenically treated steels and alloys – overview
- Experimental and numerical investigation of patch effect on the bending behavior for hat-shaped carbon fiber composite beams
- Influence of water on microstructure and mechanical properties of a friction stir spot welded 7075-T651 Al alloy
- Effect of copper powder addition on the product quality of sintered stainless steels
- Mechanical and thermal properties of short banana fiber reinforced polyoxymethylene composite materials dependent on alkali treatment