A Yield Stress Model for a Solution-Treated Ni-Based Superalloy during Plastic Deformation
-
Yan-Xing Liu


Abstract
Up to now, there are few reports on the yield behavior of Ni-based superalloy during plastic deformation. However, an accurate yield stress model is significant for simulating the plastic forming process by cellular automaton or finite element methods. Therefore, the yield behavior of a solution-treated Ni-based superalloy is studied by hot compression tests. In order to evaluate yield stresses from the measured flow stress curves, the yield process is analyzed in terms of dislocation theory. Then, yield stresses at different deformation temperatures and strain rates are clearly determined. The experimental results show that the yield stresses are highly sensitive to deformation temperature and strain rate. The determined yield stress almost linearly increases with the increase of the logarithm of strain rate or the reciprocal of deformation temperature. A yield stress model is developed to correlate the yield behavior of the studied solution-treated Ni-based superalloy with deformation temperature, strain rate, and strengthening effect of alloying elements. The developed model can well describe the yield behavior of the studied solution-treated Ni-based superalloy.
Introduction
Generally, metals and alloys undergo a yield process before plastic deformation [1, 2]. In the yield process, the movement and multiplication of dislocations greatly affect the plastic deformation of alloys [3, 4, 5]. Thus, a comprehensive understanding of yield behavior is useful for developing accurate constitutive models to describe the plastic flow behavior [6, 7, 8, 9, 10]. Meanwhile, the physical mechanisms controlling the subsequent plastic deformation can be well interpreted [11, 12, 13, 14, 15].
Due to their high strength, excellent corrosion resistance, thermal fatigue properties, and thermal stability [16, 17], Ni-based superalloys are widely used in different industrial equipment, especially in the critical parts of nuclear fission reactors, fusion reactors, and aircraft engines [18, 19, 20, 21, 22]. In recent years, some efforts have been made to study the yield behavior of some typical Ni-based superalloys. Zhao et al. [23] investigated the discontinuous yield behavior in GH4049 superalloy during high-speed compression. Roth et al. [24] proposed a yield stress model for Ni-based alloys, considering dependences of yield stress on the chemical composition and deformation temperature. Momeni et al. [25] carried out the comparative study on the discontinuous yield behaviors in IN718 and ALLVAC 718 Plus superalloys. Weiss and Grushko [26] developed a yield stress model for IN718 superalloy at low-subroom temperatures. Galindo-Nava et al. [27] proposed a yield stress model for Ni-based superalloys, considering the unimodal and multimodal precipitation distribution. Crudden et al. [28] developed a yield stress model for Ni-based superalloys, accounting for the effects of chemical composition.
Although, some investigations have been carried out on the yield behavior of Ni-based superalloys at in-service temperatures or below, few reports the yield behavior during plastic deformation. However, an accurate yield stress model is vital for simulating the plastic forming process by cellular automaton or finite element methods. In this study, the yield behavior of a solution-treated Ni-based superalloy is investigated by isothermal hot compression tests. Yield stresses are directly determined from the measured true stress–true strain curves. Based on the determined yield stress, a yield stress model is developed to describe the effects of deformation temperature, strain rate, and critical alloying elements on yield behavior.
Material and experiments
The material used in this study is a commercial GH4169 Ni-based superalloy. Its chemical composition (wt.%) is 52.82Ni-18.96Cr-5.23Nb-3.01Mo-1.00Ti-0.59Al-0.01Co-0.03C-(bal.)Fe. Cylindrical specimens of 8 mm diameter and 12 mm height were cut from the billet. The specimens were solution treated at 1313 K for 45 min to dissolve all possible precipitates [29, 30]. Then, the solution-treated specimens were water-quenched to reserve the precipitates-free microstructure. Hot compression tests were conducted on a Gleeble 3500 thermo-mechanical simulator. The experimental conditions lie in the deformation temperature range of 1223–1313 K and strain rate range of 0.001–0.1 s–1. Figure 1 shows the detailed procedure for the hot compression tests.

Procedure for the hot compression tests.
Yield process of the studied Ni-based superalloy
In this section, the yield behavior of metals and alloys will be interpreted, and an unambiguous way to determine the yield stress is introduced.
Figure 2 shows the representative stress–strain curve obtained from the hot compression tests. The measured stress-strain curve can be divided into three stages: stage I (elastic stage), stage II (anelastic stage), and stage III (plastic stage) [18, 31]. In stage I, the elastic deformation is time-independent.

True stress–true strain curves: (a) typical experiment results; (b) detailed yield behavior.
In stage
where
The external applied stress
where
In stage II, the first derivative (
Plastic deformation of alloys derives from the movement and multiplication of linear defects known as dislocations. Figure 3(a) illustrates a dislocation with segment length

Schematic of dislocation movement and multiplication: (a) Frank-Read dislocation source; (b) dislocation multiplication.
where
The relationship between
where
The shear strain induced by the curving deformation is,
Where N is the number of dislocation segment per unit volume. S is the area swept by the curving deformation of dislocation segment AB.
where
where
where
According to the Taylor model [33], the relationship between the applied stress
where
where
Based on the principle of virtual work (
By combing eqs. (10), (12), and (13),
Thus,
In stage
where
where
Therefore, the first derivative of
Results and discussion
Yield behavior and the determination of yield stresses
Based on the analysis of yield process in section “Yield process of the studied Ni-based superalloy”, it is well known that a turning point should be found on the

Figure 4 shows that the yield stresses are very sensitive to the deformation temperature and strain rate. Thus, the yield stresses determined from

Relationship between the yield stress and deformation temperature.
Figure 6 shows the relationship between the yield stress and strain rate. An approximately linear relationship can be found between the logarithm of strain rate and yield stress. This linear relationship is related to the barrier at pinning points of dislocations, which were also observed by some other researchers [20, 37].

Relationship between the yield stress and strain rate.
Yield stress model
The studied Ni-based superalloy is a kind of materials enriched with alloying elements. So, the strengthening effect of alloying elements should be carefully considered when a yield stress model is developed.
The contribution of alloying elements to
where
Table 1 shows the concentration and strengthening constants of different alloying elements of the studied Ni-based superalloy [39]. Here, Niobium (Nb), molybdenum (Mo), and titanium (Ti) are the main strengthening elements, while chromium (Cr) and aluminum (Al) primarily provide the resistance to oxidation and corrosion. The strengthening constants shown in Table 1 were measured at the deformation temperature of 77 K. Thus, the superimposed strength based on the data shown in Table 1 corresponds to the yield stress (
Concentration and strengthening constants of alloying elements in the studied Ni-based superalloy.
| Alloying element | Cr | Fe | Nb | Mo | Ti | Al | Co | C |
|---|---|---|---|---|---|---|---|---|
| 18.96 | 18.33 | 5.23 | 3.01 | 1.00 | 0.59 | 0.03 | 0.03 | |
| 337 | 153 | 1183 | 1015 | 775 | 225 | 39.4 | 1061 |
The strengthening effect of alloying elements can be interpreted in view of the short range interaction between dislocations and alloying atoms. Based on this interpretation, Feltham [40] established the following relationship between yield stress, deformation temperature, and strengthening effects of alloying elements.
where
Based on eq. (21),
where
Therefore, the yield stress model that takes account of the strengthening effects of alloying elements, deformation temperature, and strain rate can be summarized as,
where
The shear modulus for the studied Ni-based superalloy can be calculated as [41],
Based on the measured yield stresses,
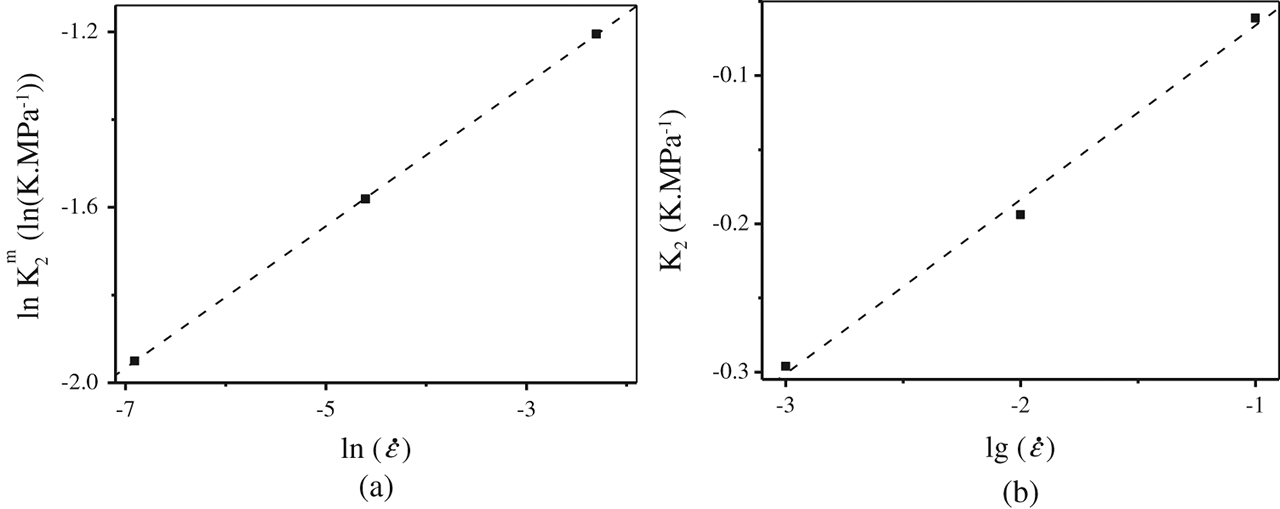
Strain rate dependence of : (a)
Summarily, the yield stress model for the studied Ni-based superalloy that takes account of the effects of deformation temperature, strain rate and alloying elements can be expressed as,
where
Figure 8 shows the comparisons between the measured (

Comparisons between the measured and predicted yield stresses.
where
Nb is an important precipitate-formatting element for the studied Ni-based superalloy. Thus, the strengthening effect of alloying element Nb is studied by the developed yield model. By changing the concentration constant of alloying element Nb (

Effect of Nb content at different: (a) deformation temperatures; (b) strain rates.
Conclusion
The yield behaviors of a solution-treated Ni-based superalloy are studied. The main conclusions can be drawn as follows.
The yield process is analyzed in terms of dislocation theory. A turning point can be found from the
A yield stress model that takes account of the strengthening effect of alloying elements, deformation temperature, and strain rate is developed. The predicted yield stresses for the studied Ni-based superalloy well agree with the measured ones.
The developed yield stress model shows that yield stress decreases with the decrease in Nb content. The deformation temperature has negative effects on the strengthening effect of alloying element Nb, while the strain rate has positive effects.
However, it should be emphasized that the developed yield stress model is only valid for the solution-treated Ni-based superalloy. The further research will incorporate the effects of precipitate strengthening into the yield stress.
Acknowledgments
This work was supported by the National Natural Science Foundation Council of China (Grant No. 51775564), the Project of Innovation-driven Plan in Central South University (Grant No. 2016CX008), the Science and Technology Leading Talent in Hunan Province (Grant No. 2016RS2006), Program of Chang Jiang Scholars of Ministry of Education (Grant No. Q2015140), and the Natural Science Foundation for Distinguished Young Scholars of Hunan Province (Grant No. 2016JJ1017), China.
References
[1] Y.C. Lin and M.S. Chen, Mater. Des., 32 (2011) 1733–1759.10.1016/j.matdes.2010.11.048Search in Google Scholar
[2] D.T. Nguyen, J.G. Park and Y.S. Kim, Trans. Indian Inst. Met., 69 (2016) 1343–1350.10.1007/s12666-015-0687-5Search in Google Scholar
[3] M.S. Chen, W.Q. Yuan, H.B. Li and Z.H. Zou, Comput. Mater. Sci., 136 (2017) 163–172.10.1016/j.commatsci.2017.05.009Search in Google Scholar
[4] Y.C. Lin, F.Q. Nong, X.M. Chen, D.D. Chen and M.S. Chen, Vacuum, 137 (2017) 104–114.10.1016/j.vacuum.2016.12.022Search in Google Scholar
[5] P.J. Geng, W.G. Li, X.H. Zhang, J.X. Shao, Y. Deng, J.Z. Ma and H.B. Kou, J. Alloys Compd., 684 (2016) 116–119.10.1016/j.jallcom.2016.05.156Search in Google Scholar
[6] R. Bobbili, V. Madhu and A.K. Gogia, J. Mater. Res. Technol., 5 (2016) 190–197.10.1016/j.jmrt.2015.12.002Search in Google Scholar
[7] R. Bobbili, B.V. Ramudu and V. Madhu, J. Alloys Compd., 696 (2017) 295–303.10.1016/j.jallcom.2016.11.208Search in Google Scholar
[8] G. Chen, X.C. Zhao and H. Wu, Adv. Mech. Eng., 9 (2017) 1–21.Search in Google Scholar
[9] G. Chen, Z.S. Zhang, Y.H. Mei, X. Li, D.J. Yu, L. Wang and X. Chen, Mech. Materials., 72 (2014) 61–71.10.1016/j.mechmat.2014.02.001Search in Google Scholar
[10] D.D. Chen, Y.C. Lin, Y. Zhou, M.S. Chen and D.X. Wen, J. Alloys Compd., 708 (2017) 938–946.10.1016/j.jallcom.2017.03.029Search in Google Scholar
[11] J. Cai, X.L. Zhang, K.S. Wang and C.P. Miao, High Temp. Mater. Process., 35 (2016) 1037–1045.10.1515/htmp-2015-0094Search in Google Scholar
[12] X.L. Han, S.D. Zhao, C.Y. Zhang, S.Q. Fan and F. Xu, High Temp. Mater. Process, 34 (2015) 529–538.10.1515/htmp-2014-0019Search in Google Scholar
[13] M.C. Cui, S.D. Zhao, C. Chen, D.W. Zhang and Y.Y. Li, Adv. Mech. Eng., 9 (2017) 1–11.Search in Google Scholar
[14] M. Azarbarmas, M. Aghaie-Khafri, J.M. Cabrera and J. Calvo, Mater. Sci. Eng. A, 678 (2016) 137–152.10.1016/j.msea.2016.09.100Search in Google Scholar
[15] Y.Q. Ning, B.C. Xie, H. Li and M.W. Fu, Adv. Eng. Mater., 17 (2015) 648–655.10.1002/adem.201400223Search in Google Scholar
[16] D.Y. Hu, Q. Yang, H.W. Liu, J.X. Mao, F.C. Meng, Y.F. Wang, M.X. Ren and R.Q. Wang, Int. J. Fatigue, 95 (2017) 90–103.10.1016/j.ijfatigue.2016.10.011Search in Google Scholar
[17] Y.C. Lin, H. Yang, L. Li, Vacuum, 144 (2017) 86–93.10.1016/j.vacuum.2017.07.025Search in Google Scholar
[18] Y.C. Lin, X.M. Chen, D.X. Wen and M.S. Chen, Comput. Mater. Sci., 83 (2014) 282–289.10.1016/j.commatsci.2013.11.003Search in Google Scholar
[19] H.B. Li and Y.L. Feng, High Temp. Mater. Process., 35 (2016) 55–64.10.1515/htmp-2014-0173Search in Google Scholar
[20] S.A. Sajjadi, A. Chaichi, H.R. Ezatpour, A. Maghsoudlou and M.A. Kalaie, J. Mater. Eng. Perform., 25 (2016) 1269–1275.10.1007/s11665-016-1967-xSearch in Google Scholar
[21] Y.H. Liu, Y.Q. Ning, Z.K. Yao, H. Li, X.P. Miao, Y.Z. Li and Z.L. Zhao, J. Alloys Compd., 675 (2016) 73–80.10.1016/j.jallcom.2016.03.093Search in Google Scholar
[22] A. Momeni, J. Mater. Res., 31 (2016) 1077–1084.10.1557/jmr.2016.81Search in Google Scholar
[23] Z.L. Zhao, Y.Q. Ning, H.Z. Guo, Z.K. Yao and M.W. Fu, Mater. Sci. Eng. A, 620 (2014) 383–389.10.1016/j.msea.2014.10.041Search in Google Scholar
[24] H. Roth, C. Davis and R. Thomson, Metall. Mater. Trans. A, 28 (1997) 1329–1335.10.1007/s11661-997-0268-2Search in Google Scholar
[25] A. Momeni, S.M. Abbasi, M. Morakabati and H. Badri, Metall, Mater. Trans. A, 48 (2017) 1216–1229.10.1007/s11661-016-3904-xSearch in Google Scholar
[26] B. Weiss and B. Grushko, Weld. J., 62 (1983) 282–289.10.3382/ps.0620282Search in Google Scholar
[27] E. Galindo-Nava, L. Connor and C. Rae, Acta Mater., 98 (2015) 377–390.10.1016/j.actamat.2015.07.048Search in Google Scholar
[28] D. Crudden, A. Mottura, N. Warnken, B. Raeisinia and R. Reed, Acta Mater., 75 (2014) 356–370.10.1016/j.actamat.2014.04.075Search in Google Scholar
[29] Y.X. Liu, Y.C. Lin and Y. Zhou, Mater. Sci. Eng. A, 691 (2017) 88–99.10.1016/j.msea.2017.03.039Search in Google Scholar
[30] X.M. Chen, Y.C. Lin, D.X. Wen, J.L. Zhang and M. He, Mater. Des, 57 (2014) 568–577.10.1016/j.matdes.2013.12.072Search in Google Scholar
[31] Y.C. Lin, M.S. Chen and J. Zhong, Mech. Res. Commun., 35 (2008) 142–150.10.1016/j.mechrescom.2007.10.002Search in Google Scholar
[32] P. Alexopoulos, C. Cho, C. Hu and L. Che-Yu, Acta Mater, 29 (1981) 569–577.10.1016/0001-6160(81)90138-3Search in Google Scholar
[33] R. Stoller and S. Zinkle, J. Nucl. Mater., 283 (2000) 349–352.10.1016/S0022-3115(00)00378-0Search in Google Scholar
[34] Y. Estrin, L. Toth, A. Molinari and Y. Bréchet, Acta Mater, 46 (1998) 5509–5522.10.1016/S1359-6454(98)00196-7Search in Google Scholar
[35] Y.C. Lin, D.X. Wen, M.S. Chen, Y.X. Liu, X.M. Chen and X. Ma, J. Mater. Res., 31 (2016) 2415–2429.10.1557/jmr.2016.220Search in Google Scholar
[36] Y.C. Lin, D.X. Wen, M.S. Chen and X.M. Chen, Appl. Phys. A, 122 (2016) 805.10.1007/s00339-016-0333-zSearch in Google Scholar
[37] G. Stepanov, J. Appl. Mech. Tech. Phys., 23 (1982) 141–146.10.1007/BF00911993Search in Google Scholar
[38] L. Gypen and A. Deruyttere, J. Mater. Sci., 12 (1977) 1028–1033.10.1007/BF00540987Search in Google Scholar
[39] Y. Mishima, S. Ochiai, N. Hamao, M. Yodogawa and T. Suzuki, Trans. Jpn. Inst. Met., 27 (1986) 656–664.10.2320/matertrans1960.27.656Search in Google Scholar
[40] P. Feltham, J. Phys. D., 1 (1968) 303–308.10.1088/0022-3727/1/3/305Search in Google Scholar
[41] Y.X. Liu, Y.C. Lin, H.B. Li, D.X. Wen, X.M. Chen and M.S. Chen, Mater. Sci. Eng. A, 626 (2015) 432–440.10.1016/j.msea.2014.12.092Search in Google Scholar
© 2018 Walter de Gruyter GmbH, Berlin/Boston
This article is distributed under the terms of the Creative Commons Attribution Non-Commercial License, which permits unrestricted non-commercial use, distribution, and reproduction in any medium, provided the original work is properly cited.
Articles in the same Issue
- Frontmatter
- Research Articles
- Numerical Simulation of the Electron Beam Welding and Post Welding Heat Treatment Coupling Process
- Effect of Ti and Ta on Oxidation Kinetic of Chromia Forming Ni-Base Superalloys in Ar-O2-Based Atmosphere
- Effects of Cerium on the Inclusions and Pitting Corrosion Behavior of 434 Ferritic Stainless Steel
- Critical Assessment of Activities of Structural Units in Fe–Al Binary Melts Based on the Atom and Molecule Coexistence Theory
- A Yield Stress Model for a Solution-Treated Ni-Based Superalloy during Plastic Deformation
- Stress Relaxation Behaviour and Creep Constitutive Equations of SA302Gr.C Low-Alloy Steel
- Effects of Inner Defects on Creep Damage and Crack Initiation for a Brazed Joint
- Experimental and Numerical Investigations on Hot Deformation Behavior and Processing Maps for ASS 304 and ASS 316
- Production of Iron Based Alloys from Mill Scale through Metallothermic Reduction
- Effect of Nb and V on Austenite Grain Growth Behavior of the Cr-Mo-V Steel for Brake Discs
- A Thermodynamic Study of the Reduction of a Limonitic Laterite Ore by Methane
- Electrochemical and Phase Analysis of Si(IV) on Fe Electrode in Molten NaCl-NaF-KCl-SiO2 System
- Characterization of Hot Deformation Behavior for Pure Aluminum Using 3D Processing Maps
- Effect of Chromium Addition on the Cyclic Oxidation Resistance of Pseudo-Binary (Mo,Cr)3 Si Silicide Alloy
- Equiaxed Solidification of 430 Ferritic Stainless Steel Nucleating on Core-Containing Ti
- FE Analysis of Dynamical Recrystallization during the Seamless Tube Extrusion of Semicontinuous Casting Magnesium Alloy and Experimental Verification
- Study on the Reblow Model for Medium-High Carbon Steel Melting by Converter
- Short Communication
- Effect of B2O3 on Slag-Metal Reaction between CaO-Al2O3-Based Mold Flux and High Aluminum Steel
- Review Article
- Computation of the Thermal Residual Stresses in SiC/SiC Composites with Multi-Layered Interphases by Using ANN with the Structure of Random Forest
- Research Articles
- Failure Analysis of the Corroded Water Wall Tube in a 50MW Thermal Power Plant
- CO2 Absorption of Powdered Ba2Fe2O5 with Different Particle Size
- Induced-Pitting Behaviors of MnS Inclusions in Steel