Critical Assessment of Activities of Structural Units in Fe–Al Binary Melts Based on the Atom and Molecule Coexistence Theory
-
Xue-min Yang
 ,
Jin-yan Li
,
Jin-yan Li

Abstract
A thermodynamic model for calculating the mass action concentrations
The reported activities
Introduction
Thermodynamic properties of Fe–Al binary system, especially reaction ability of Al, i. e., activity
With the rapid development of computing science over the past several decades, the calculation of phase diagrams (CALPHAD) technique [22, 23, 24, 25] has become an important method to determine the accurate information of Fe–Al binary phase diagram [26, 27, 28] from 298 K (25 °C) to above the liquidus temperatures based on accumulated thermodynamic properties of Fe–Al binary melts, certainly including the accumulated data of activity
Five kinds of stoichiometrical intermetallic compounds as Fe3Al, FeAl, FeAl2, Fe2Al5, and FeAl6 can be formed through covalent bonds in solid Fe–Al binary alloys from the phase diagram of Fe–Al binary system [26, 27, 28]. Qin et al. [33] determined the liquid structure of Fe–Al binary melts through measuring the positions and heights of the pre-peaks of liquid Al–Fe alloys using a high temperature X–ray diffractometer. It was concluded by Qin et al. [33] that the atomic configuration with the Fe2Al5 type cluster persisted into the melts in the medium range and the Fe–Al distance in liquid Fe–Al alloys was nearly the same as that in the solid state. Zaitsev et al. [34]. confirmed by the integral effusion method and Knudsen mass spectrometry that three associates or clusters as FeAl, FeAl2, and Fe2Al5 existed in Fe–Al binary melts at elevated temperatures to form icosahedral quasicrystal (i-QC) precipitation. This means that atoms of both Fe and Al as well as at least three associates or clusters of FeAl, FeAl2, and Fe2Al5 can coexist in Fe–Al binary melts.
For the purpose of emphasizing the structural property of coexistence between atoms and associates or clusters or molecules in metallic melts, the conclusions from the literature [29, 32, 33, 34, 35, 36, 37, 38, 39], which were summarized by Yang et al. [40], are briefly introduced in this contribution. Hoffman et al. [35] used the diffuse intensity to specify the state of clustering or short–range order structures in metallic melts. Lee et al. [36] verified that the metallic melts could maintain a short-range order structures with the similar structures as those of the close–packed in solid. Bouteiller et al. [37]. suggested that the short–range order structures could exist in metallic melts. Sommer et al. [32, 38, 39] proposed that the short–range order structures in metallic melts could be treated as compounds. Pelton et al. [29] advised that the nearest–neighbor pairs in metallic melts should be considered as components for simplifying computation during developing the modified quasichemical model [29, 30, 31] for metallic melts. Evidently, the so-called short-range order structures [32, 33, 35, 36, 37, 38, 39] or nearest-neighbor pairs [29, 30, 31, 37] or associative complexes [34] in metallic melts have the same meaning like molecules or compounds or components as FexAly in Fe–Al binary melts.
Therefore, it has become a consistent viewpoint from results of Zaitsev et al. [34] that five kinds of stoichiometrical intermetallic compounds or associates or clusters of Fe3Al, FeAl, FeAl2, Fe2Al5, and FeAl6 can constitute the equilibrium phases in Fe–Al binary system at temperatures above liquidus lines. This means that two atoms of both Fe and Al as well as five molecules or associates or clusters or short-range ordering radicals of Fe3Al, FeAl, FeAl2, Fe2Al5, and FeAl6 can coexist in Fe–Al binary melts. It should be clarified that the covalent bonds of the applied molecules in this study is to some degree weaker than those of traditionally defined molecules.
Similar to the proposed ion and molecule coexistence theory (IMCT) by Zhang [41] for metallurgical slags [41, 42, 43, 44, 45, 46, 47, 48, 49, 50, 51, 52, 53, 54, 55], the atom and molecule coexistence theory (AMCT) [40, 41, 56, 57, 58, 59, 60, 61] was also developed to represent reaction abilities of structural units by the mass action concentrations
It is well known from the classical metallurgical physicochemistry [69, 70] that three activities of elements in metallic melts have been widely applied to describe the reaction ability of element i in metallic melts as activity
According to the accumulated experiences of predicting reaction abilities of structural units in Fe–S [56], Fe–Si [56, 57], Fe–P [40], Fe–O [59] and Fe–C [60, 61] binary melts based on the AMCT, the thermodynamic model for calculating the mass action concentrations
Assessment of nine collected data sources on activity a R , i
Nine data sources [3, 10, 11, 12, 13, 14, 15, 16, 17] on activity
Summary of reported activity coefficient
| No. | Expressions of γ | Experimental or calculation method | Researchers | Year | Ref. | Category(–) | Note |
|---|---|---|---|---|---|---|---|
| D1(a) | T=1873 K (1600 °C), | Distribution of liquid Al between liquid Fe and Ag at 1873 K (1600 °C). | Chipman and Floridis | 1955 | [3] | I | |
| D2(a) | T=1873 K (1600 °C), 0< | High-temperature solution calorimeter at 1873 K (1600 °C). | Wooley and Elliott | 1967 | [10] | I | |
| D3(b) | T=1588 K (1315 °C), 0.6< | Transportation method by Al vapor pressure at 1588 K (1315 °C). | Coskun and Elliott | 1968 | [11] | II | |
| D4(b) | T=1573 K (1500 °C), 0.6< | Bubbling method by vapor pressure at 1473 K and 1373 K (1200 °C and 1100 °C). | Mitani and Nagai | 1968 | [12] | II | |
| T=1473 K (1200 °C), 0.6< | |||||||
| D5 | T=1873 K (1600 °C), 0< | Knudsen cell–mass spectrometer combination at 1873 K (1600 °C). | Belton and Fruehan | 1969 | [13] | III | SCd) |
| D6(a) | T=1873 K (1600 °C), 0< | EMF at 1873 K (1600 °C). | Fruehan | 1970 | [14] | I | |
| D7(c) | T=1673 K (1400 °C), 0.6< | Knudsen cell–mass spectrometer combination at 1673 K (1400 °C). | Ichise et al. | 1977 | [15] | III | SC |
| D8 | T=1873 K (1600 °C), 0< | Critical literature review and evaluation at 1873 K (1600 °C). | Desai | 1987 | [16] | III | SC |
| D9(c) | T=1573 K (1300 °C), 0.6< | Knudsen cell–mass spectrometer combination at 1573 K (1300 °C). | Jacobson and Mehrotra | 1993 | [17] | III | SC |
| D10 | 1823 K (1550 °C)<T< 1973 K (1700 °C), 0< | AMCT– | Present authors | This study | III |
Note:
(a) Expression of activity coefficient
(b) Expression of activity coefficient
(c) Expression of activity coefficient
(d) SC means the original data of activity coefficient
Classification of nine collected data sources on activity a R , i
Nine collected data sources [3, 10, 11, 12, 13, 14, 15, 16, 17] on activity coefficient
Among the third category of four data sources [13, 15, 16, 17] in Table 1, Ichise et al. [15] (D7) reported activity coefficients
Four data sources [13, 15, 16, 17] of the third category reported activity coefficients
Assessment of nine collected data sources on activity a R , i
Primary assessment of nine collected data sources on activity coefficient γAl of Al in Fe–Al binary melts
Comparison among reported results of activity coefficient

Comparison among reported activity coefficient
With respect to the reported [3, 10, 14] results of
The reported [11, 12] results of
The reported results of
Methods of determining activity coefficient γFe of Fe in Fe–Al binary melts at fixed temperature
It is well known that accurate expression of activity coefficient
According to the reported activity coefficient
Using alpha function
With regard to four data sources [13, 15, 16, 17] of the third category in Figure 1(c) or Table 1, activity coefficient
where the applied alpha function
It should be emphasized that the second term of Gibbs–Duhem integral equation in eq. (4) is equal to Raoultian activity coefficient
In order to distinguish two kinds of Gibbs–Duhem integral equation in eqs (2) and (4), eq. (2) is named as the first method, while eq. (4) is assigned as the second method. Theoretically, the calculated results of activity coefficient
With respect to the Fe-rich corner of Fe–Al binary melts, i. e., three data sources [3, 10, 14] of the first category in Figure 1(a) or Table 1, activity coefficient
The involved parameter
It can be deduced from Darken’s quadratic formalism in eqs (7) and (8) that it is not a difficult task to calculate activity coefficient
With regard to the Al-rich corner of Fe–Al binary melts, i. e., two data sources [11, 12] of the second category in Figure 1(b) or Table 1, Al is solvent relative to Fe as solute. Thus, activity coefficient
Under this circumstance, activity coefficient
Thus, the absent results of activity coefficient
Assessment of self-consistency between activity a R , A l a R , F e
Taking the reported results of activity coefficient

Comparison among calculated activity coefficient
With respect to the Al–rich corner of Fe–Al binary melts, taking the reported results of activity coefficient
With regard to the full composition range of Fe–Al binary melts, taking the reported results of activity coefficient
Assessment of reported or obtained activity coefficient γFe of Fe in Fe–Al binary melts
Comparison among results of activity coefficient

Comparison among reported or calculated activity coefficient
It can be observed in Figure 3(a) that results of
Figure 3(c) indicates that results of
Combining activity coefficients
Assessment of reported Raoultian activity coefficients γi 0
Based on a thorough literature survey by the present authors, 14 data sources [1, 2, 3, 4, 5, 6, 10, 11, 12, 13, 14, 15, 16, 17, 19] on Raoultian activity coefficient
Summary of expressions of Raoultian activity coefficients
| No. | T [K(°C)] | ln γ | ln γ | Experimental or calculation method | Researchers | Year | Ref. | |||||
|---|---|---|---|---|---|---|---|---|---|---|---|---|
| i=Al | i=Fe | |||||||||||
| S1 | 1873 (1600) | −3.69 | NDa) | −117,994.07 | ND | ND | ND | ND | Recalculated from experimental data of Al distribution between liquid Fe and Ag at 1873 K (1600 °C) by Chipman in 1934[1]. | Chipman | 1934,1948 | [1, 2] |
| S2=D1 | 1873 (1600) | −3.48 | ND | −114,690.61 | ND | 6.6 | ND | 0.049 | Same as that of D1 in Table 1. | Chipman and Floridis | 1955 | [3] |
| S3 | 1823–1923 (1550–1650) | ND | ND | −48,976.2 − 32.32T | ND | ND | ND | ND | Recalculation of Chipman’s data in 1934[1], in which Al distribution between liquid Fe and Ag at 1873 K (1600 °C). | Chou and Elliott | 1956 | [4] |
| 1873 (1600) | −3.15 | ND | −109,548.93 | ND | ND | ND | ND | |||||
| S4 | 1873 (1600) | −3.00 | ND | −107,199.79 | ND | ND | ND | ND | Recalculation of experimental data by Chipman and Floridis in 1955[3], in which Al distribution between liquid Fe and Ag at 1873 K (1600 °C). | Pehlke | 1958 | [5] |
| S5 | 1873 (1600) | −2.76 | ND | −103,601.39 | ND | 5.3 | ND | 0.043 | EMF at 1873 K (1600 °C). | Wilder and Elliott | 1960 | [6] |
| S6=D2 | 1873 (1600) | −2.80 | ND | −10,3601.39 | ND | 5.6 | ND | 0.045 | Same as that of D2 in Table 1. | Wooley and Elliott | 1967 | [10] |
| S7=D3b) | 1588 (1315) | ND | −3.42 | ND | −115,425.01 | ND | 13.4 | ND | Same as that of D3 in Table 1. | Coskun and Elliott | 1968 | [11] |
| S8=D4b) | 1473 (1200) | ND | −4.48 | ND | −120,094.48 | ND | 6.0 | ND | Same as that of D4 in Table 1. | Mitani and Nagai | 1968 | [12] |
| 1373 (1100) | ND | −0.89 | ND | −70,961.14 | ND | 3.8 | ND | |||||
| S9=D5b) | 1873 (1600) | −3.77 | −2.51 | −119,314.12 | −122,096.73 | 10.2 | 4.4 | 0.087 | Same as that of D5 in Table 1. | Belton and Fruehan | 1969 | [13] |
| S10=D6 | 1873 (1600) | −3.88 | ND | −120,902.71 | ND | 10.8 | ND | ND | Same as that of D6 in Table 1. | Fruehan | 1972 | [14] |
| S11=D7 | 1673–1873 (1400–1600) | −90,040.62 − 7.30T | 3,658.1 − 80.04233T | Same as that of D7 in Table 1. | Ichise et al. | 1977 | [15] | |||||
| 1873 (1600) | −3.02 | −4.07 | −103,718.92 | −146,261.13 | 6.4 | 8.2 | 0.049 | |||||
| S12=D8b) | 1873 (1600) | −2.90 | −3.60 | −105,709.54 | −139,018.80 | 5.28 | 4.4 | ND | Same as that of D8 in Table 1. | Desai | 1987 | [16] |
| S13=D9 b) | 1573 (1300) | ND | −3.96 | ND | −121,460.09 | ND | 8.06 | ND | Same as that of D9 in Table 1. | Jacobson and Mehrotra | 1993 | [17] |
| S14c)d) | 1823–1923 (1550–1650) | ND | –23,257.11–42.49T | ND | ND | metal–nitride-gas equilibration under various nitrogen partial pressures. | Kim et al. | 2007 | [19] | |||
| 1873 (1600) | −2.71 | –102,823.28 | 2.36 | ND | 0.043 | |||||||
| S15=D10 | 1823–1973 (1550–1700) | −80,199.53 − 14.07T | −9,772.67 − 69.41T | AMCT– | Present authors | This study | ||||||
| 1873 (1600) | −2.95 | −3.65 | −106,554.48 | −139,779.97 | 5.36 | 9.52 | 0.044 | |||||
Note:
(a) ND means no datum or expression was reported by the original author(s).
(b) Result of
(c) Expression of
(d) Expression of
Assessment of 11 collected data sources on Raoultian activity coefficient γA l 0
The defined Raoultian activity coefficient
In addition, Raoultian activity coefficient
To Fe–Al binary melts, the standard molar Gibbs-free energy change
Comparison among 11 collected data sources [1, 2, 3, 4, 5, 6, 10, 13, 14, 15, 16, 19] on
![Figure 4: Comparison of reported results of Raoultian activity coefficient lnγAl0\ln \gamma _{{\rm{Al}}}^0 of Al by various researchers with obtained ones by developed AMCT–Ni{N_i} model (a) or comparison of reported results of standard molar Gibbs free energy change ΔsolGm,Al(l)→[Al][%Al]=1.0Θ,%{\Delta _{{\rm{sol}}}}G_{{\rm{m, Al(l)}} \to {{{\rm{[Al]}}}_{{\rm{ [ \% Al] = 1}}{\rm{. 0}}}}}^{\Theta {\rm{, \% }}} by various researchers with obtained ones by developed AMCT–Ni{N_i} model (b) for Fe–Al binary melts over a temperature range from 1823 to 1973 K (1550 to 1700 °C), respectively.](/document/doi/10.1515/htmp-2017-0018/asset/graphic/j_htmp-2017-0018_fig_004.jpg)
Comparison of reported results of Raoultian activity coefficient
Similarly, comparison among the calculated
Assessment of six collected data sources on Raoultian activity coefficient γF e 0
Comparison among six collected data sources [11, 12, 13, 15, 16, 17] on
![Figure 5: Comparison of reported Raoultian activity coefficient lnγFe0\ln \gamma _{{\rm{Fe}}}^0 of Fe by various researchers with obtained ones by developed AMCT–Ni{N_i} model (a) or comparison of reported results of standard molar Gibbs free energy change ΔsolGm,Fe(l)→[Fe][%Fe]=1.0Θ,%{\Delta _{{\rm{sol}}}}G_{{\rm{m, Fe(l)}} \to {{{\rm{[Fe]}}}_{{\rm{ [ \% Fe] = 1}}{\rm{. 0}}}}}^{\Theta {\rm{, \% }}} by various researchers with obtained ones by developed AMCT–Ni{N_i} model (b) for Fe–Al binary melts over a temperature range from 1373 to 1973 K (1100 to 1700 °C), respectively.](/document/doi/10.1515/htmp-2017-0018/asset/graphic/j_htmp-2017-0018_fig_005.jpg)
Comparison of reported Raoultian activity coefficient
Analogically, comparison among the calculated
Assessment of six collected data sources on first-order activity interaction coefficients ε j j
According to Darken’s quadratic formalism [73, 74, 75], activity coefficient
Thus, the first-order activity interaction coefficient
With respect to Fe–Al binary melts,
As mentioned in “Methods of determining activity coefficient
AMCT–N i
Hypotheses
It has been briefly introduced in “Introduction” that two atoms of both Fe and Al as well as five molecules of Fe3Al, FeAl, FeAl2, Fe2Al5, and FeAl6 are assumed to coexist in Fe–Al binary melts at elevated temperatures above liquidus lines. Therefore, the AMCT [40, 41, 56, 57, 58, 59, 60, 61] can be applied to describe structural properties of Fe–Al binary melts. The hypotheses of the developed AMCT–
Establishment of AMCT–N i
Mole numbers of two atoms as Fe and Al before equilibrium or before forming five molecules in 100 g Fe–Al binary melts are assigned as
Expressions of structural units as atoms and molecules, their equilibrium mole numbers
| Item | Structural units as atoms or molecules | No. of structural units | Mole numbers | Mass action concentrations |
|---|---|---|---|---|
| Atom (2) | Fe | 1 | ||
| Al | 2 | |||
| Molecules(5) | Fe3Al | c1 | ||
| FeAl | c2 | |||
| FeAl2 | c3 | |||
| Fe2Al5 | c4 | |||
| FeAl6 | c5 |
According to the definition of the mass action concentrations
The chemical reaction formulae of forming five molecules, the related standard reaction equilibrium constants
Chemical reaction formulae of possibly formed molecules or compounds as Fe3Al, FeAl, FeAl2, Fe2Al5, and FeAl6, their standard equilibrium constants
| Reactions | Expressions of | Expressions of | Expressions of | Ref. |
|---|---|---|---|---|
| 3[Fe]+[Al]=[Fe3Al] | −120,586.85 + 48.61T | [41] | ||
| −72,933.58 + 22.96T | This study | |||
| [Fe]+[Al]=[FeAl] | −47,813.257 + 7.893T | [41] | ||
| −58,063.73 + 12.62T | This study | |||
| [Fe]+2[Al]=[FeAl2] | 130,186.64 − 84.582T | [41] | ||
| −185,903.37 + 91.12T | This study | |||
| 2[Fe]+5[Al]=[Fe2Al5] | −165,372.213 + 43.05T | [41] | ||
| 96,818.26 − 103.84T | This study | |||
| [Fe]+6[Al]=[FeAl6] | −14,710.17 − 18.712T | [41] | ||
| −26,299.94 − 12.81T | This study |
The mass conservation equations of Fe and Al atoms in 100 g Fe–Al binary melts can be established based on aforementioned definitions [40, 41, 42, 43, 44, 45, 46, 47, 48, 49, 50, 51, 52, 53, 54, 55, 56, 57, 58, 59, 60, 61] of
According to the principle that the sum of mole fraction of all structural units in a fixed amount of metallic melts under equilibrium condition is equal to unity, the following equation can be established
The governing equations of the developed AMCT–
Determination of standard molar Gibbs free energy changes Δ r G m , c i Θ , R
Unfortunately, no expressions of the standard molar Gibbs-free energy changes
Determination method of standard equilibrium constants K c i Θ , R
With regard to a multiple linear regression equation
One general equation in the form of
The derivation process of five sub-equations in eqs (26)–(30) is described in details in Appendix. Replacing
Selection of determined standard equilibrium constants K c i Θ , R
In order to calculate
The calculated
Regressed values of standard equilibrium constants
| T [K(°C)] | Method(–) | Regressed value of | Adjusted coefficient | Calculated value of | Note | Original data Ref. | ||||||||
|---|---|---|---|---|---|---|---|---|---|---|---|---|---|---|
| Fe3Al | FeAl | FeAl2 | Fe2Al5 | FeAl6 | Fe3Al | FeAl | FeAl2 | Fe2Al5 | FeAl6 | |||||
| 1673(1400) | M1 | 17.16 | 13.16 | 15.88 | −181.06 | 26.33 | 1.0 | −39,541.98 | −35,842.63 | −38,459.49 | ND(c) | −45,494.20 | [15] | |
| M2 | 11.96 | 14.24 | 11.09 | 252.03 | 30.92 | 0.9996 | −34,519.10 | −36,947.92 | −33,461.85 | −76,912.07 | −47,726.98 | Applied | ||
| M3 | −0.44 | 15.37 | 7.07 | 0 | −31.86 | 0.478 | ND | −38,004.2 | 100,906.00 | ND | ND | |||
| M4 | 0 | 16.66 | 0 | 1.35 | 0 | 0.247 | ND | −39,125.0 | ND | 188,036.50 | ND | |||
| M5 | 0 | 10.98 | 21.05 | 0 | 7.61 | 0.333 | ND | −33,323.9 | −42,378.60 | ND | 163,943.40 | |||
| 1873(1600) | M1 | 6.83 | 9.12 | 2.66 | 529.96 | 25.26 | 1.0 | −29,926.81 | −34,423.61 | −15,238.11 | −97,680.79 | −50,288.49 | Applied | [16] |
| M2 | 9.75 | 7.10 | 12.97 | −166.61 | 15.56 | 0.991 | −35,460.4 | −30,531.10 | −39,904.50 | ND | −42,745.60 | |||
| M3 | 4.18 | 9.79 | −7.90 | 746.67 | 28.66 | 1.0 | −22,258.6 | −35,519.40 | ND | −10,3019.00 | −52,253.00 | |||
| M4 | 0 | 8.23 | 8.79 | −7.30 | 0 | 0.666 | ND | −32,823.50 | −33,852.60 | ND | ND | |||
| M5 | 0 | 4.98 | 16.96 | 0 | 3.10 | 0.666 | ND | −25,009.80 | −44,084.40 | ND | 197,510.40 | |||
Note:
(a) The regressed standard equilibrium constant
(b) The corresponding value of
(c) ND means no datum.
It should be emphasized that negative values of calculated
The results of
Comparison between calculated

Comparison of reported first-order activity interaction coefficient
![Figure 7: Comparison between regressed results of standard molar Gibbs free energy change ΔrGm,ciΘ,R{\Delta _{\rm{r}}}G_{{\rm{m, c}}i}^{\Theta {\rm{, R}}} in this study and reported ones by Zhang [41] for forming five complex compounds or molecules as Fe3Al, FeAl, FeAl2, Fe2Al5 and FeAl6 by Fe and Al atoms in Fe–Al binary melts over a temperature range from 1673 to 1873 K (1400 to 1600 °C), respectively.](/document/doi/10.1515/htmp-2017-0018/asset/graphic/j_htmp-2017-0018_fig_007.jpg)
Comparison between regressed results of standard molar Gibbs free energy change
As pointed out by Zhang [41], the reported activities
Results and discussion for calculated mass action concentrations N i N i
The mass action concentrations
Chemical composition of Fe–Al binary melts with changing mole fraction
| No. | Chemical composition of Fe–Al binary melts | Calculated mass action concentrations | ||||||||||
|---|---|---|---|---|---|---|---|---|---|---|---|---|
| Mole fraction (–) | Mass percentage (–) | |||||||||||
| [% Fe] | [% Al] | |||||||||||
| 1 | 1.00 | 0.00 | 100.00 | 0.00 | 1.000 | 0.000 | 0.000 | 0.000 | 0.000 | 0.000 | 0.000 | 1.79 |
| 2 | 0.95 | 0.05 | 97.52 | 2.48 | 0.945 | 0.004 | 2.045 | 0.031 | 3.156 | 2.641 | 4.716 | 1.68 |
| 3 | 0.90 | 0.10 | 94.91 | 5.09 | 0.881 | 0.009 | 4.046 | 0.070 | 1.756 | 1.998 | 9.353 | 1.58 |
| 4 | 0.85 | 0.15 | 92.14 | 7.86 | 0.806 | 0.016 | 5.794 | 0.119 | 5.610 | 3.809 | 3.641 | 1.50 |
| 5 | 0.80 | 0.20 | 89.22 | 10.78 | 0.723 | 0.027 | 6.992 | 0.178 | 1.409 | 4.019 | 7.169 | 1.44 |
| 6 | 0.75 | 0.25 | 86.13 | 13.87 | 0.635 | 0.042 | 7.414 | 0.246 | 3.044 | 2.945 | 9.392 | 1.39 |
| 7 | 0.70 | 0.30 | 82.85 | 17.15 | 0.545 | 0.063 | 7.018 | 0.315 | 5.836 | 1.617 | 8.974 | 1.38 |
| 8 | 0.65 | 0.35 | 79.36 | 20.64 | 0.459 | 0.091 | 5.987 | 0.380 | 1.007 | 6.889 | 6.504 | 1.38 |
| 9 | 0.60 | 0.40 | 75.64 | 24.36 | 0.379 | 0.125 | 4.638 | 0.432 | 1.575 | 2.323 | 3.657 | 1.40 |
| 10 | 0.55 | 0.45 | 71.67 | 28.33 | 0.307 | 0.166 | 3.288 | 0.465 | 2.251 | 6.296 | 1.621 | 1.42 |
| 11 | 0.50 | 0.50 | 67.42 | 32.58 | 0.245 | 0.213 | 2.139 | 0.476 | 2.963 | 1.401 | 5.817 | 1.43 |
| 12 | 0.45 | 0.55 | 62.87 | 37.13 | 0.191 | 0.267 | 1.270 | 0.465 | 3.623 | 2.625 | 1.750 | 1.43 |
| 13 | 0.40 | 0.60 | 57.98 | 42.02 | 0.144 | 0.329 | 6.700 | 0.432 | 4.146 | 4.235 | 4.616 | 1.43 |
| 14 | 0.35 | 0.65 | 52.71 | 47.29 | 0.103 | 0.402 | 3.013 | 0.378 | 4.428 | 5.897 | 1.095 | 1.42 |
| 15 | 0.30 | 0.70 | 47.01 | 52.99 | 0.069 | 0.486 | 1.112 | 0.308 | 4.361 | 6.918 | 2.307 | 1.44 |
| 16 | 0.25 | 0.75 | 40.83 | 59.17 | 0.044 | 0.578 | 3.344 | 0.231 | 3.903 | 6.591 | 4.136 | 1.50 |
| 17 | 0.20 | 0.80 | 34.10 | 65.90 | 0.026 | 0.673 | 8.089 | 0.160 | 3.132 | 4.939 | 6.090 | 1.62 |
| 18 | 0.15 | 0.85 | 26.75 | 73.25 | 0.014 | 0.767 | 1.435 | 0.098 | 2.189 | 2.751 | 7.188 | 1.84 |
| 19 | 0.10 | 0.90 | 18.70 | 81.30 | 0.006 | 0.858 | 1.478 | 0.049 | 1.238 | 9.847 | 6.377 | 2.21 |
| 20 | 0.05 | 0.95 | 9.82 | 90.18 | 0.002 | 0.939 | 5.300 | 0.017 | 4.744 | 1.583 | 3.506 | 2.82 |
| 21 | 0.00 | 1.00 | 0.00 | 100.00 | 0.000 | 1.000 | 0.000 | 0.000 | 0.000 | 0.000 | 0.000 | 3.71 |
Comparison between calculated mass action concentration N A l N i a R , A l
Comparison between calculated

Comparison of reported results of activity
The defined [40,41, 42, 43, 44, 45, 46, 47, 48, 49, 50, 51, 52, 53, 54, 55, 56, 57, 58, 59, 60, 61]

Relationship between mole fraction
The expression of obtained activity coefficient
The regressed expression of activity coefficient
Comparison between calculated mass action concentration N F e N i a R , F e
Comparison between calculated

Comparison of reported or obtained results of activity
The calculated results of
The relationships of calculated activity coefficient
The expression of activity coefficient
The regressed expression of activity coefficient
Assessment of obtained Raoultian activity coefficients γi 0 N i
Assessment of obtained Raoultian activity coefficient γA l 0 N i
Raoultian activity coefficient
The expression
The obtained expressions of both
Assessment of obtained Raoultian activity coefficient γF e 0 N i
Similarly, Raoultian activity coefficient
The expression
The obtained expressions of both
Assessment of obtained first-order activity interaction coefficients ε j j e j j h j j N i
Assessment of obtained first-order activity interaction coefficients ε j j N i
The relationship between mole fraction

Relationship between mole fraction

Relationship between reciprocal of temperature and obtained first-order activity interaction coefficient
Meanwhile, the relationship between reciprocal of temperature T and obtained
The obtained expression of
Assessment of obtained first-order activity interaction coefficients e j j h j j N i
The first-order activity interaction coefficient
With regard to Fe–Al binary melts,
According to the obtained expressions of
The obtained expression of
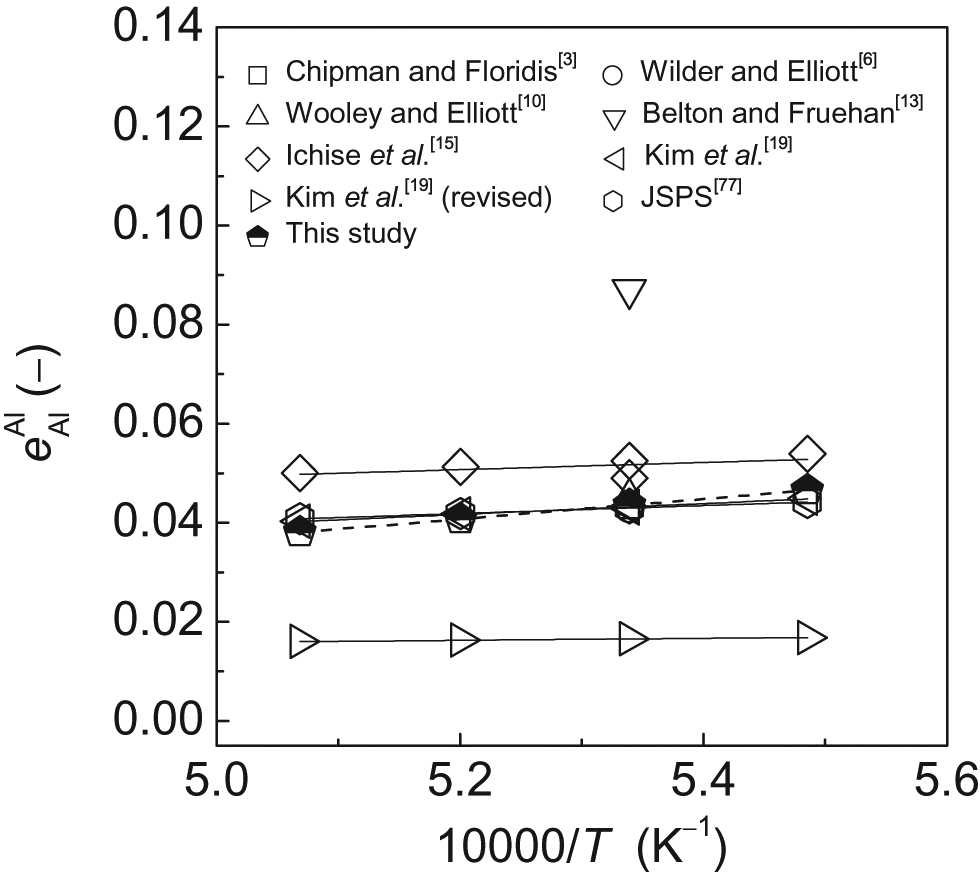
Comparison of reported results of first-order activity interaction coefficient
The expression of
Thus, the recalculated expression of
Certainly, the originally reported results of
To the knowledge of the present authors, no results of
Relationships among calculated mass action concentrations N i n i
Profiles of calculated mass action concentrations N i
The profiles of calculated

Relationship between mole fraction
Changing temperature from 1823 to 1973 K (1550 to 1700 °C) cannot cause an obvious variation tendency on profiles of calculated

Relationship between mole fraction
Relationship between calculated mass action concentrations N i n i
The relationship between calculated mass action concentrations

Relationship between calculated mass action concentration
To further explain the spindle-shaped relationships of

Relationship between mole fraction
Changing temperature from 1823 to 1973 K (1550 to 1700 °C) cannot cause an obvious variation tendency of the maximum data of
It can be easily deduced from eq. (22) that slope of the relationships of

Relationship between mole fraction
Conclusions
A thermodynamic model for calculating the mass action concentrations
1) The calculated mass action concentration
2) The calculated mass action concentration
3) The obtained Raoultian activity coefficient
4) The obtained Raoultian activity coefficient
5) The obtained first-order activity interaction coefficients
6) The developed AMCT–
7) The calculated equilibrium mole numbers
Notes
The authors declare no competing financial interest. This work was presented in part at the 9th European Metallurgical Conference, June 25–29th, 2017, Leipzig, Germany, pp. 907–928.
Funding statement: This work is supported by the Beijing Natural Science Foundation (Grant No. 2182069) and the National Natural Science Foundation of China (Grant No. 51174186).
Appendix
Multiplied eq. (23) by mole number
Similarly, multiplied eq. (24) by mole number
Thus, the following equation can be obtained by subtraction eq. (56) from eq. (55) as
This means that two equations of eqs (23) and (24) are reduced to one equation as eq. (57).
Inserting the expressions of
Combining eqs (57) and (58) gives the following equation
Dividing eq. (59) by coefficient of
Nomenclatures
Activity of element i or compound i, (–);
Activity of element i or compound i relative to pure matter i (l or s or g) as standard state with mole fraction
Activity of element i referred to 1 mass percentage of element i as standard state with mass percentage [% i] as concentration unit and obeying Henry’s law under the condition of taking infinitely dilute ideal solution as reference state, i. e.,
Activity of element i relative to hypothetical pure matter i (l or s or g) as standard state with mole fraction
Mole number of element i in 100 g metallic melts before reaction equilibrium for forming associated molecules or compounds, having the same meaning with
Coefficient of independent variable
First-order activity interaction coefficient of element i to i in metallic melts related with activity coefficient
Activity coefficient of element i in metallic melts related with activity
Activity coefficient of element i in metallic melts related with activity
Standard molar Gibbs free energy change of reaction for forming compound i based on activity
Standard molar Gibbs free energy change of dissolved liquid j(l) for forming [% j] as 1.0 in i–j binary melts referred to 1 mass percentage of j as reference state, (J/mol);
Standard equilibrium constant of chemical reaction for forming compound i based on activity
Relative atomic mass of element i, (–);
Mole number of element i in 100 g metallic melts before reaction equilibrium for forming associated molecule or compound, having the same meaning of
Equilibrium mole number of structural unit i in 100 g metallic melts based on the AMCT, (mol);
Total equilibrium mole number of all structural units in 100 g metallic melts based on the AMCT, (mol);
Mass action concentrations of structural unit i in metallic melts based on the AMCT, (–);
Gas constant, (8.314 J/(mol⋅K));
Absolute temperature, (K);
Mole fraction of element i or compound i in metallic melts, (–);
Independent variable, (–);
Dependent variable, (–);
- [% i]
Mass percentage of element i or compound i in metallic melts, (×10−2,–).
- Greek symbols
Activity coefficient of element i related with activity
Raoultian activity coefficient of element i in infinitely dilute metallic melts relative to pure matter i (l or s or g) as standard state and taking infinitely dilute ideal solution as reference state, i. e., equal to value of
First-order activity interaction coefficient of element i in metallic melts related with activity coefficient
- Subscripts
- ci
Molecule i or compound i, (–).
References
[1] J. Chipman, Trans. Am. Soc. Met., 22 (1934) 385–446.Search in Google Scholar
[2] J. Chipman, Discuss. Faraday Soc., 4 (1948) 23–49.10.1039/df9480400023Search in Google Scholar
[3] J. Chipman and T.P. Floridis, Acta Metall., 3 (1955) 456–459.10.1016/0001-6160(55)90135-8Search in Google Scholar
[4] Y.H. Chou and J.F. Elliott, Acta Chim. Sinica, 22 (1956) 14–23.Search in Google Scholar
[5] R.D. Pehlke, Trans. Metall. Soc. AIME, 212 (1958) 486–487.Search in Google Scholar
[6] T.C. Wilder and J.F. Elliott, J. Electrochem. Soc., 107 (1960) 628–635.10.1149/1.2427788Search in Google Scholar
[7] E.A. Gulbransen and K.F. Andrew, Trans. Metall. Soc. AIME, 221 (1961) 1247–1252.Search in Google Scholar
[8] S.V. Radcliffe, B.L. Averbach and M. Cohe, Acta Metall., 9 (1961) 169–176.10.1016/0001-6160(61)90066-9Search in Google Scholar
[9] J. Eldridge and K.L. Komarek, Trans. Metall. Soc. AIME, 230 (1964) 226–233.Search in Google Scholar
[10] F. Wooley and J.F. Elliott, Trans. Metall. Soc. AIME, 239 (1967) 1872–1883.Search in Google Scholar
[11] A. Coskun and J.F. Elliott, Trans. Metall. Soc. AIME, 242 (1968) 253–255.Search in Google Scholar
[12] H. Mitani and H. Nagai, J. Jpn. Inst. Met., 32 (1968) 752–755.10.2320/jinstmet1952.32.8_752Search in Google Scholar
[13] G.R. Belton and R.J.R. Fruehan, Trans. Metall. Soc. AIME, 245 (1969) 113–117.Search in Google Scholar
[14] R.J. Fruehan, Metal. Trans., 1 (1970) 3403–3410.10.1007/BF02643418Search in Google Scholar
[15] E. Ichise, T. Yamauchi and T. Mori, Tetsu-to-Hagané, 63 (1977) 417–424.10.2355/tetsutohagane1955.63.3_417Search in Google Scholar
[16] P.D. Desai, J. Phys. Chem. Ref. Data, 16 (1987) 109–124.10.1063/1.555788Search in Google Scholar
[17] N.S. Jacobson and G.M. Mehrotra, Metall. Trans. B, 24B (1993) 481–486.10.1007/BF02666431Search in Google Scholar
[18] D. Raj, L. Bencze, D. Kath, W.A. Oates, J. Herrmann, L. Singheiser and K. Hilpert, Intermetallics, 11 (2003) 1119–1124.10.1016/S0966-9795(03)00149-3Search in Google Scholar
[19] W.Y. Kim, J.G. Kang, C.H. Park, J.B. Lee and J.J. Pak, ISIJ Int., 47 (2007) 945–954.10.2355/isijinternational.47.945Search in Google Scholar
[20] Y.Z. Huang, W.X. Yuan, Z.Y. Qiao, O. Semenova, G. Bester and H. Ipser, J. Alloys Compd., 458 (2008) 277–281.10.1016/j.jallcom.2007.04.208Search in Google Scholar
[21] A.K. Misra, Metall. Trans. A, 21A (1990) 441–446.10.1007/BF02782424Search in Google Scholar
[22] B. Sundman, I. Ohnuma, N. Dupin, U.R. Kattner and S.G. Fries, Acta Mater., 57 (2009) 2896–2908.10.1016/j.actamat.2009.02.046Search in Google Scholar
[23] A.T. Phan, M.K. Paek and Y.B. Kang, Acta Mater., 91 (2014) 1–15.10.1016/j.actamat.2014.07.006Search in Google Scholar
[24] M.K. Paek, J.J. Pak and Y.B. Kang, Metall. Mater. Trans. B, 46B (2015) 2224–2233.10.1007/s11663-015-0369-zSearch in Google Scholar
[25] M.K. Paek, K.H. Do, Y.B. Kang, I.H. Jung and J.J. Pak, Metall. Mater. Trans. B, 47B (2016) 2837–2847.10.1007/s11663-016-0728-4Search in Google Scholar
[26] O. Kubaschewski, Iron-Binary Phase Diagrams, Springer-Verlag Berlin Heidelberg, New York (1982).10.1002/abio.370020210Search in Google Scholar
[27] Binary Alloy Phase Diagrams, eds. T.B. Massalski, J.L. Murray, L.H. Bennett and H. Baker, ASM, Metals Park, OH (1986), p. 112.Search in Google Scholar
[28] ASM Handbook Volume 3-Alloy Phase Diagrams, ASM International, The Materials Information Company, US (1992).Search in Google Scholar
[29] A.D. Pelton, S.A. Degterov, G. Eriksson, C. Robelin and Y. Dessureault, Metall. Mater. Trans. B, 31B (2000) 651–659.10.1007/s11663-000-0103-2Search in Google Scholar
[30] A.D. Pelton and P. Chartrand, Metall. Mater. Trans. A, 32a (2001) 1355–1360.10.1007/s11661-001-0226-3Search in Google Scholar
[31] P. Chartrand and A.D. Pelton, Metall. Mater. Trans. A, 32A (2001) 1397–1407.10.1007/s11661-001-0229-0Search in Google Scholar
[32] O. Akinlade, R.N. Singh and F. Sommer, J. Alloys Compd., 299 (2000) 163–168.10.1016/S0925-8388(99)00682-9Search in Google Scholar
[33] J.Y. Qin, X.F. Bian, S.I. Sliusarenko and W.M. Wang, J. Phys.: Cond. Matt., 10 (1998) 1211–1218.10.1088/0953-8984/10/6/004Search in Google Scholar
[34] A.I. Zaitsev, N.E. Zaitseva, R.Y. Shimko, N.A. Arutyunyan, S.F. Dunaev, V.S. Kraposhin and H.T. Lam, J. Phys.: Condens. Matter, 20 (2008) 114–121.10.1088/0953-8984/20/11/114121Search in Google Scholar PubMed
[35] D.W. Hoffman, Metal. Trans., 3 (1972) 3231–3238.10.1007/BF02661338Search in Google Scholar
[36] Y.E. Lee, Metall. Mater. Trans. B, 29B (1998) 397–403.10.1007/s11663-998-0116-9Search in Google Scholar
[37] M.L. Bouteiller, A.M. Martre, R. Farhi and C. Petot, Metall. Mater. Trans. B, 8B (1977) 339–344.10.1007/BF02657665Search in Google Scholar
[38] F. Sommer, Z. Metallkde, 73 (1982) 72–76.Search in Google Scholar
[39] F. Sommer, Z. Metallkde, 73 (1982) 77–86.10.1515/ijmr-1982-730203Search in Google Scholar
[40] X.M. Yang, P.C. Li, J.Y. Li, J.L. Zhang, M. Zhang and J. Zhang, Steel Res. Int., 85 (2014) 426–460.10.1002/srin.201300036Search in Google Scholar
[41] J. Zhang, Computational Thermodynamics of Metallurgical Melts and Solutions, Metallurgical Industry Press, Beijing, China (2007), pp. 40–70.Search in Google Scholar
[42] X.M. Yang, J.S. Jiao, R.C. Ding, C.B. Shi and H.J. Guo, ISIJ Int., 49 (2009) 1828–1837.10.2355/isijinternational.49.1828Search in Google Scholar
[43] C.B. Shi, X.M. Yang, J.S. Jiao, C. Li and H.J. Guo, ISIJ Int., 50 (2010) 1362–1372.10.2355/isijinternational.50.1362Search in Google Scholar
[44] X.M. Yang, C.B. Shi, M. Zhang, G.M. Chai and F. Wang, Metall. Mater. Trans. B, 42B (2011) 1150–1180.10.1007/s11663-011-9547-9Search in Google Scholar
[45] X.M. Yang, C.B. Shi, M. Zhang, G.M. Chai and J. Zhang, Metall. Mater. Trans. B, 43B (2012) 241–266.10.1007/s11663-011-9612-4Search in Google Scholar
[46] X.M. Yang, J.P. Duan, C.B. Shi, M. Zhang, Y.L. Zhang and J.C. Wang, Metall. Mater. Trans. B, 42B (2011) 738–770.10.1007/s11663-011-9491-8Search in Google Scholar
[47] X.M. Yang, C.B. Shi, M. Zhang, J.P. Duan and J. Zhang, Metall. Mater. Trans. B, 42B (2011) 951–977.10.1007/s11663-011-9527-0Search in Google Scholar
[48] X.M. Yang, C.B. Shi, M. Zhang and J. Zhang, Steel Res. Int., 83 (2012) 244–258.10.1002/srin.201100233Search in Google Scholar
[49] X.M. Yang, M. Zhang, J.L. Zhang, P.C. Li, J.Y. Li and J. Zhang, Steel Res. Int., 85 (2014) 347–375.10.1002/srin.201200138Search in Google Scholar
[50] J.Y. Li, M. Zhang, M. Guo and X.M. Yang, Metall. Mater. Trans. B, 45B (2014) 1666–1682.10.1007/s11663-014-0085-0Search in Google Scholar
[51] X.M. Yang, J.Y. Li, G.M. Chai, M. Zhang and J. Zhang, Metall. Mater. Trans. B, 45B (2014) 2118–2137.10.1007/s11663-014-0122-zSearch in Google Scholar
[52] X.M. Yang, G.M. Chai, M. Zhang, J.Y. Li, Q. Liang and J. Zhang, Ironmaking Steelmaking, 43 (2016) 663–687.10.1179/1743281215Y.0000000032Search in Google Scholar
[53] X.M. Yang, J.Y. Li, G.M. Chai, D.P. Duan and J. Zhang, Metall. Mater. Trans. B, 47B (2016) 2279–2301.10.1007/s11663-016-0652-7Search in Google Scholar
[54] X.M. Yang, J.Y. Li, G.M. Chai, D.P. Duan and J. Zhang, Metall. Mater. Trans. B, 47B (2016) 2302–2329.10.1007/s11663-016-0653-6Search in Google Scholar
[55] X.M. Yang, J.Y. Li, G.M. Chai, D.P. Duan and J. Zhang, Ironmaking Steelmaking, 44 (2017) 437–454.10.1080/03019233.2016.1214384Search in Google Scholar
[56] X.M. Yang, M. Zhang, P.C. Li, J.Y. Li, J.L. Zhang and J. Zhang, Metall. Mater. Trans. B, 43B (2012) 1358–1387.10.1007/s11663-012-9707-6Search in Google Scholar
[57] X.M. Yang, M. Zhang, P.C. Li, J.Y. Li and J. Zhang, Steel Res. Int., 84 (2013) 784–811.10.1002/srin.201200181Search in Google Scholar
[58] X.M. Yang, J.Y. Li, P.C. Li, M. Zhang and J. Zhang, Steel Res. Int., 85 (2014) 164–206.10.1002/srin.201200215Search in Google Scholar
[59] X.M. Yang, J.Y. Li, M.F. Wei and J. Zhang, Metall. Mater. Trans. B, 47B (2016) 174–206.10.1007/s11663-015-0482-zSearch in Google Scholar
[60] X.M. Yang, J.Y. Li, D.P. Duan, F.J. Yan and J. Zhang, J. Iron Steel Res. Int., 25 (2018) 37–56.10.1007/s42243-017-0008-9Search in Google Scholar
[61] X.M. Yang, J.Y. Li, F.J. Yan, D.P. Duan and J. Zhang, J. Iron Steel Res. Int., 25 (2018) 181–199.10.1007/s42243-018-0019-1Search in Google Scholar
[62] K. Wasai and K. Mukai, J. Jpn. Inst. Metals, 45 (1981) 593–602.10.2320/jinstmet1952.45.6_593Search in Google Scholar
[63] K. Wasai and K. Mukai, J. Jpn. Inst. Metals, 46 (1982) 266–274.10.2320/jinstmet1952.46.3_266Search in Google Scholar
[64] J.H. Hildebrand and E.D. Eastman, J. Am. Chem.Soc., 37 (1915) 2452–2459.10.1021/ja02176a002Search in Google Scholar
[65] A.S. Jordan, Metall. Trans., 1 (1970) 239–249.10.1007/BF02819267Search in Google Scholar
[66] Z. Moser, E. Kawecka, F. Sommer and B. Predel, Metall. Trans. B, 13B (1982) 71–76.10.1007/BF02666957Search in Google Scholar
[67] S. Wasiur-Rahman and M. Medraj, Intermetallics, 17 (2009) 847–864.10.1016/j.intermet.2009.03.014Search in Google Scholar
[68] A.D. Pelton and Y.B. Kang, Int. J. Mater. Res., 98 (2007) 907–917.10.3139/146.101554Search in Google Scholar
[69] J.Y. Zhang, Metallurgical Physicochemistry, Metallurgical Industry Press, Beijing (2004).Search in Google Scholar
[70] S.K. Wei, Thermodynamics of Metallurgical Processes, Science Press, Beijing (2010).Search in Google Scholar
[71] X.H. Huang, Principles of Ironmaking and Steelmaking, 3rd ed, Metallurgical Industry Press, Beijing (2005).Search in Google Scholar
[72] S.K. Wei, Application of Activity into Metallurgical Physicochemistry, China Industry Press, Beijing (1964).Search in Google Scholar
[73] L.S. Darken, Trans. Metall. Soc. AIME, 239 (1967) 80–89.Search in Google Scholar
[74] L.S. Darken, Trans. Metall. Soc. AIME, 239 (1967) 90–96.Search in Google Scholar
[75] E.T. Turkdogan and L.S. Darken, Trans. Metall. Soc. AIME, 242 (1968) 1997–2005.Search in Google Scholar
[76] L.E. Rohde, A. Choudhury and M. Wahlster, Arch. Eisenhüttenwes., 42 (1971) 165–167.10.1002/srin.197102580Search in Google Scholar
[77] Steelmaking Data Sourcebook (Revised Edition), edited by the Japan Society for the Promotion of Science, the 19th Committee on Steelmaking, Gordon and Breach Science Publishers S. A., Montreux, Switzerland (1988).Search in Google Scholar
[78] Thermodynamic Data for Steelmaking, edited by M. Hino and K. Ito. Tohoku University Press, Sendai, Japan (2010).Search in Google Scholar
[79] H. Itoh, M. Hino and S. Ban-Ya, Tetsu-to-Hagané, 83 (1997) 773–778.10.2355/tetsutohagane1955.83.12_773Search in Google Scholar
© 2018 Walter de Gruyter GmbH, Berlin/Boston
This article is distributed under the terms of the Creative Commons Attribution Non-Commercial License, which permits unrestricted non-commercial use, distribution, and reproduction in any medium, provided the original work is properly cited.
Articles in the same Issue
- Frontmatter
- Research Articles
- Numerical Simulation of the Electron Beam Welding and Post Welding Heat Treatment Coupling Process
- Effect of Ti and Ta on Oxidation Kinetic of Chromia Forming Ni-Base Superalloys in Ar-O2-Based Atmosphere
- Effects of Cerium on the Inclusions and Pitting Corrosion Behavior of 434 Ferritic Stainless Steel
- Critical Assessment of Activities of Structural Units in Fe–Al Binary Melts Based on the Atom and Molecule Coexistence Theory
- A Yield Stress Model for a Solution-Treated Ni-Based Superalloy during Plastic Deformation
- Stress Relaxation Behaviour and Creep Constitutive Equations of SA302Gr.C Low-Alloy Steel
- Effects of Inner Defects on Creep Damage and Crack Initiation for a Brazed Joint
- Experimental and Numerical Investigations on Hot Deformation Behavior and Processing Maps for ASS 304 and ASS 316
- Production of Iron Based Alloys from Mill Scale through Metallothermic Reduction
- Effect of Nb and V on Austenite Grain Growth Behavior of the Cr-Mo-V Steel for Brake Discs
- A Thermodynamic Study of the Reduction of a Limonitic Laterite Ore by Methane
- Electrochemical and Phase Analysis of Si(IV) on Fe Electrode in Molten NaCl-NaF-KCl-SiO2 System
- Characterization of Hot Deformation Behavior for Pure Aluminum Using 3D Processing Maps
- Effect of Chromium Addition on the Cyclic Oxidation Resistance of Pseudo-Binary (Mo,Cr)3 Si Silicide Alloy
- Equiaxed Solidification of 430 Ferritic Stainless Steel Nucleating on Core-Containing Ti
- FE Analysis of Dynamical Recrystallization during the Seamless Tube Extrusion of Semicontinuous Casting Magnesium Alloy and Experimental Verification
- Study on the Reblow Model for Medium-High Carbon Steel Melting by Converter
- Short Communication
- Effect of B2O3 on Slag-Metal Reaction between CaO-Al2O3-Based Mold Flux and High Aluminum Steel
- Review Article
- Computation of the Thermal Residual Stresses in SiC/SiC Composites with Multi-Layered Interphases by Using ANN with the Structure of Random Forest
- Research Articles
- Failure Analysis of the Corroded Water Wall Tube in a 50MW Thermal Power Plant
- CO2 Absorption of Powdered Ba2Fe2O5 with Different Particle Size
- Induced-Pitting Behaviors of MnS Inclusions in Steel