Comparison of waterline corrosion of a weathering steel in static and dynamic simulated seawater
-
Zhuoran Li

 ,
Xinjing Meng
und
Yuzeng Zhao
,
Xinjing Meng
und
Yuzeng Zhao

Abstract
Waterline corrosion behavior of a weathering steel in static and dynamic simulated seawater was studied by means of wire beam electrode (WBE), scanning electron microscopy, and Fourier transform infrared spectroscopy in this paper. The results show that the distribution of cathode and anode on WBE surface was relatively stable under static condition with large cathode and anode structure. The region near the waterline was always a stable cathode, and the total anode current density decreased with time and basically stabilized after 6 days. Under dynamic condition, a large anode structure was formed on the WBE surface within 1 day, and the anodic current density rapidly decreased with time. The anode area gradually decreased and the WBE surface showed an alternating distribution of small anode and cathode after 3 days. The total anodic current density continued to decrease with time after 6 days. Under dynamic condition, the mass transfer of oxygen and other substances related to electrode reactions was accelerated, so that the anode surface was rapidly corroded in the early stage of immersion and covered by denser corrosion products, resulting in a positive shift in the potential and electrode reversal of some anode areas in the later stage.
1 Introduction
Waterline corrosion is a common corrosion behavior that mainly occurs at the air/water interface and is common in the corrosion process of ships and steel sheet piles in water (Feng et al. 2020; Melchers 2014; Melchers et al. 2014; Païssé et al. 2013; Wall and Wadsö 2013). Evans et al. (1961) proposed the view of waterline corrosion as early as 1942 and found that when iron or zinc was partially immersed in sodium chloride or potassium chloride solutions, corrosion initially did not occur at the waterline but occurred in an area below the waterline. The cathode region was mainly located at the waterline, while the anode region was located at a certain distance below the waterline, and there were many microgalvanic cells in the anode region. This is because the dissolved oxygen near the waterline is abundant and could be continuously supplemented from the atmosphere, causing this region to mainly undergo cathodic reactions. However, in the underwater region away from the waterline, dissolved oxygen is lacking and tends to undergo anodic reactions (Jeffrey et al. 2009; Tomashov 1966).
Wire beam electrode technique (WBE) is the main method to study waterline corrosion. Local electrochemical information of complex surfaces can be obtained by measuring local potential and coupling current (Liu et al. 2006; Tan 1998; Tan et al. 2001a, 2001b; Yu et al. 2018), mainly obtaining the galvanic current and corrosion potential and their distribution. This technique has been used to study the waterline corrosion behavior of Q235, X65 carbon steel, E690, 980 high-strength steel in simulated seawater (Chen et al. 2014, 2020; Li et al. 2020; Pathirana et al. 2023; Tan et al. 2005; Wu et al. 2017; Yao et al. 2023; Yu et al. 2021). It has been found that there was yellow corrosion products γ-FeOOH and black corrosion products Fe3O4 (Chen et al. 2020) on the surface of steel. γ-FeOOH shows high reducing activity (Zhang et al. 2023) and may participate in the cathodic reaction, resulting in an increase in cathodic current and accelerating the corrosion process. The Fe3O4 layer on steel surface affects the diffusion of dissolved oxygen and the transport of ions (Doherty et al. 2004; Reddy et al. 2005; Vargas et al. 2009; Xue et al. 2018; Zou et al. 2011), and a dense Fe3O4 oxide layer can lead to electrode inversion. When a crevice is formed between the rust layer and the metal matrix, crevice corrosion will also occur, leading to intensified corrosion (Li et al. 2020; Melchers 2003; Wang et al. 2023). In the process of waterline corrosion, under the action of surface tension and chemical condensation (Pang et al. 2020), a “thin liquid film” would form in the upper region of the waterline to enhance the cathode reaction, leading to intensified corrosion in the anode region (Tan 2005; Wang et al. 2016). WBE was also used to study cathodic protection, and the effect of calcium deposition on the reaction in cathodic region has been studied by measuring current density (Yu et al. 2021). WBE was further used for the study of waterline corrosion in water containing microorganisms and found that in natural seawater, electrode inversion occurred due to microbial corrosion in the cathode region. Studies have also shown that sulfate reducing bacteria often stay at the waterline of steel surface to obtain electrons, resulting in serious corrosion of the steel surface at the waterline (Wu et al. 2017). WBE was even used in coating researches to determine the degradation areas by observing the anode potential, where corrosion will preferentially occur and cause peeling of the coating (Hu et al. 2022; Yao et al. 2023).
Previous studies on waterline corrosion of carbon steel mainly focus on static environment; however, some studies also involve waterline corrosion in dynamic environments (Jeffrey et al. 2009; Mao et al. 2022; Pathirana et al. 2023; Walsh et al. 2016; Zhu et al. 2023). It was found that the corrosion in the splash zone is much higher than the corrosion at the waterline and in the atmosphere, and the humidity of the atmosphere has a great influence on the local corrosion of metals in the seawater splash zone. Metals in the atmospheric region corrode more severely than those under water, because the oxygen available for cathodic reactions on the surface of the steel under water is limited. WBE analysis was also used to effectively simulate flow accelerated corrosion and local erosion corrosion behavior on the surface of steel pipes (Laleh et al. 2023a; Xu and Tan 2018), and a three-dimensional electrode array probe was designed to research localized corrosion and waterline corrosion (Laleh et al. 2023b; Pathirana et al. 2023). In a dynamic environment, the flow of the medium enhances the transport process of ions and dissolved oxygen in the solution, leading to an accelerated electrode reaction rate. Therefore, the waterline corrosion behavior under dynamic conditions should be different from that under static conditions. In this paper, WBE technique and surface analysis were used to study the waterline corrosion behavior of a weathering steel in simulated seawater under dynamic and static conditions and the influence of medium flow.
2 Materials and methods
2.1 Material and medium
The experimental material was a weathering steel, and its main composition is presented in Table 1. Wire beam specimen with dimensions of 3 mm × 3 mm × 30 mm was machined from a steel plate. A total of 100 wire beam specimens were prepared to form a wire beam electrode (WBE), as depicted in Figure 1, showcasing surface morphology of the WBE and the schematic diagram of WBE corrosion system. The WBE consisted of an array of small electrodes with a side length of approximately 3 mm, which were insulated from each other and sealed with epoxy resin to form a 4 × 25 matrix WBE. The distance between adjacent small electrodes was approximately 1 mm. The small electrodes were numbered from top to bottom in rows (1–25) and left to right in columns (1–4), as shown in Figure 2. Prior to each experiment, the surface of the WBE was sequentially polished using sandpaper with grit sizes of #60, #400, #800, and #1600, respectively, and then degreased with ethanol and rinsed with deionized water. During the experiment, the concave surface of water intersected with the WBE surface at the middle position of the small electrodes in rows 3 and 4, as marked by a line in Figure 2. That is, the rows 1–3 above the waterline were in the air, and the rows 4–25 below the waterline were in the water solution. During the experiments, the ambient temperature was kept at 29 °C, and the relative humidity was maintained at 70 % through air conditioning control, and distilled water was added to the beaker twice a day in the morning and evening to keep the water level unchanged.
The main composition of the experimental steel.
| Elements | Cr | Mn | Si | Al | Cu | Ti | C | Ni | P | S | Fe |
|---|---|---|---|---|---|---|---|---|---|---|---|
| wt% | 0.64 | 0.63 | 0.44 | 0.32 | 0.23 | 0.081 | 0.075 | 0.009 | 0.009 | 0.006 | Bal |
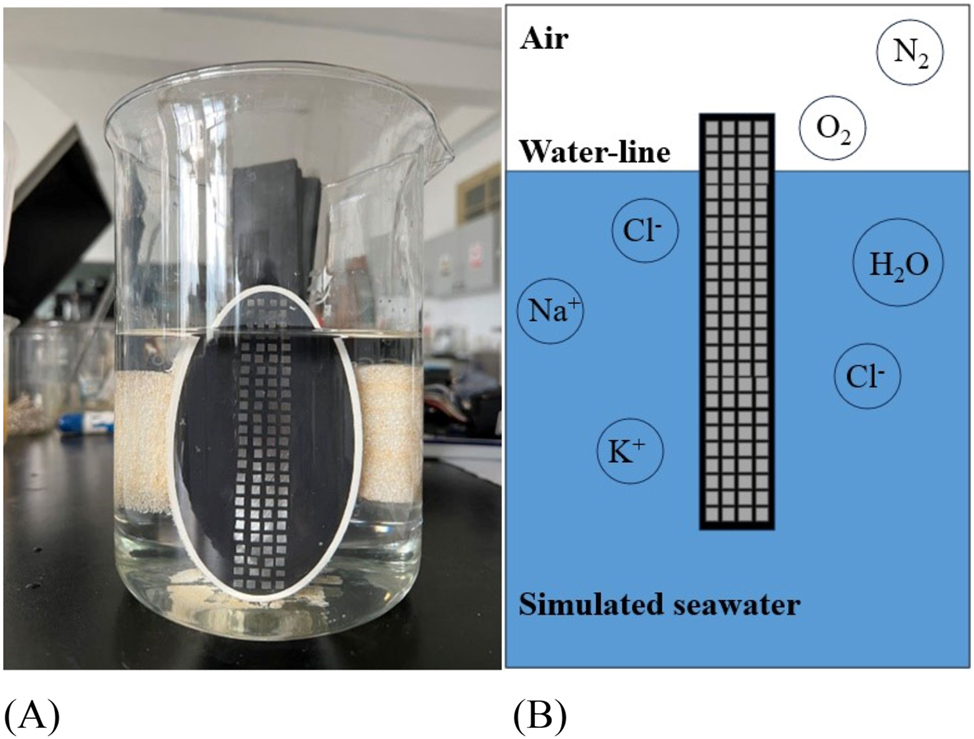
Surface morphology and schematic diagram of WBE in corrosion system. (A) Surface morphology and (B) schematic diagram.
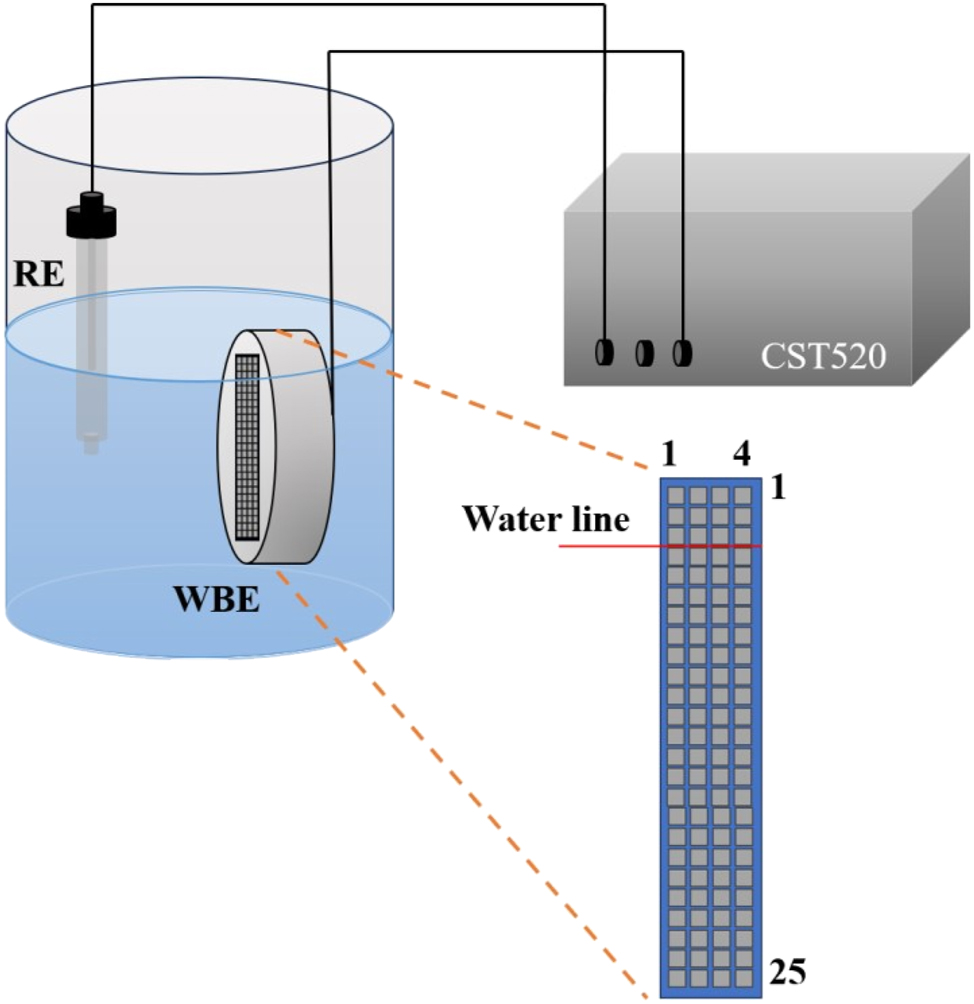
Schematic diagram of experimental apparatus (RE was SCE).
The experimental medium was a simulated seawater, prepared according to the standard ASTM D1141, and the composition is shown in Table 2. In the experiment, WBE was immersed in a 2,000 mL beaker filled with the simulated seawater, as shown in Figures 1 and 2. The surface of WBE was perpendicular to the water surface of the solution. The dynamic experiment was conducted in a constant temperature shaker (produced by Shanghai Precision Experimental Equipment Company, type THZ-320) with a rotating speed of 45 r/min. The experimental temperature was 29 °C.
Composition of the simulated seawater.
| Chemical substance | C (g/L) | Chemical substance | C (g/L) |
|---|---|---|---|
| NaCl | 24.53 | NaHCO3 | 0.201 |
| MgCl2 | 5.20 | KBr | 0.101 |
| Na2SO4 | 4.09 | H3BO3 | 0.027 |
| CaCl2 | 1.16 | SrCl2 | 0.025 |
| KCl | 0.695 | NaF | 0.003 |
2.2 Electrochemical measurements
Electrochemical tests were performed on a Coster CST520 array wire beam electrode potential current scanner, with a saturated calomel electrode (SCE) as reference. The software WBEScan was used to control the test automatically.
In the default state of the CST520 ((including unpowered state), all the 100 small electrodes on WBE were short circuit connected to each other and connected to the ground end, so the 100 small electrodes could be regarded as a complete metal plane. Potential measurement adopted high input impedance mode, while current measurement adopted zero resistance current mode. When conducting current measurement, the single electrode nx to be measured was connected to the reverse end of the zero-resistance galvanometer, while the remaining 99 electrodes were short circuit connected to the ground, and the galvanic current between the single electrode nx and the remaining 99 electrodes was measured. By sequentially switching the current measurement circuit consisting of small electrodes nx (x = 1–100) and the other 99 small electrodes, the current distribution on the entire WBE surface can be scanned. When conducting potential measurement, the single small electrode nx to be measured was short connected to the ground, while the remaining 99 small electrodes were suspended in the air, and the potential between nx and the reference (saturated calomel electrode, SCE) was measured. By sequentially switching the small electrode nx (x = 1–100) and forming a circuit with the reference, the potential distribution on the entire WBE surface can be scanned. All potentials in this paper were relative to SCE.
2.3 Surface analysis
Take out yellow and black corrosion product specimens from the surface of the test piece after 30 days, and analyze them after drying. The composition of corrosion products was analyzed by Fourier transform infrared (FTIR) spectroscopy (Spectrum two). The morphology of the corrosion products was analyzed by a scanning electron microscope (SEM) (SU-1500, Hitachi Ltd, Tokyo, Japan).
3 Results and discussion
3.1 Waterline corrosion behavior of steel in static simulated seawater
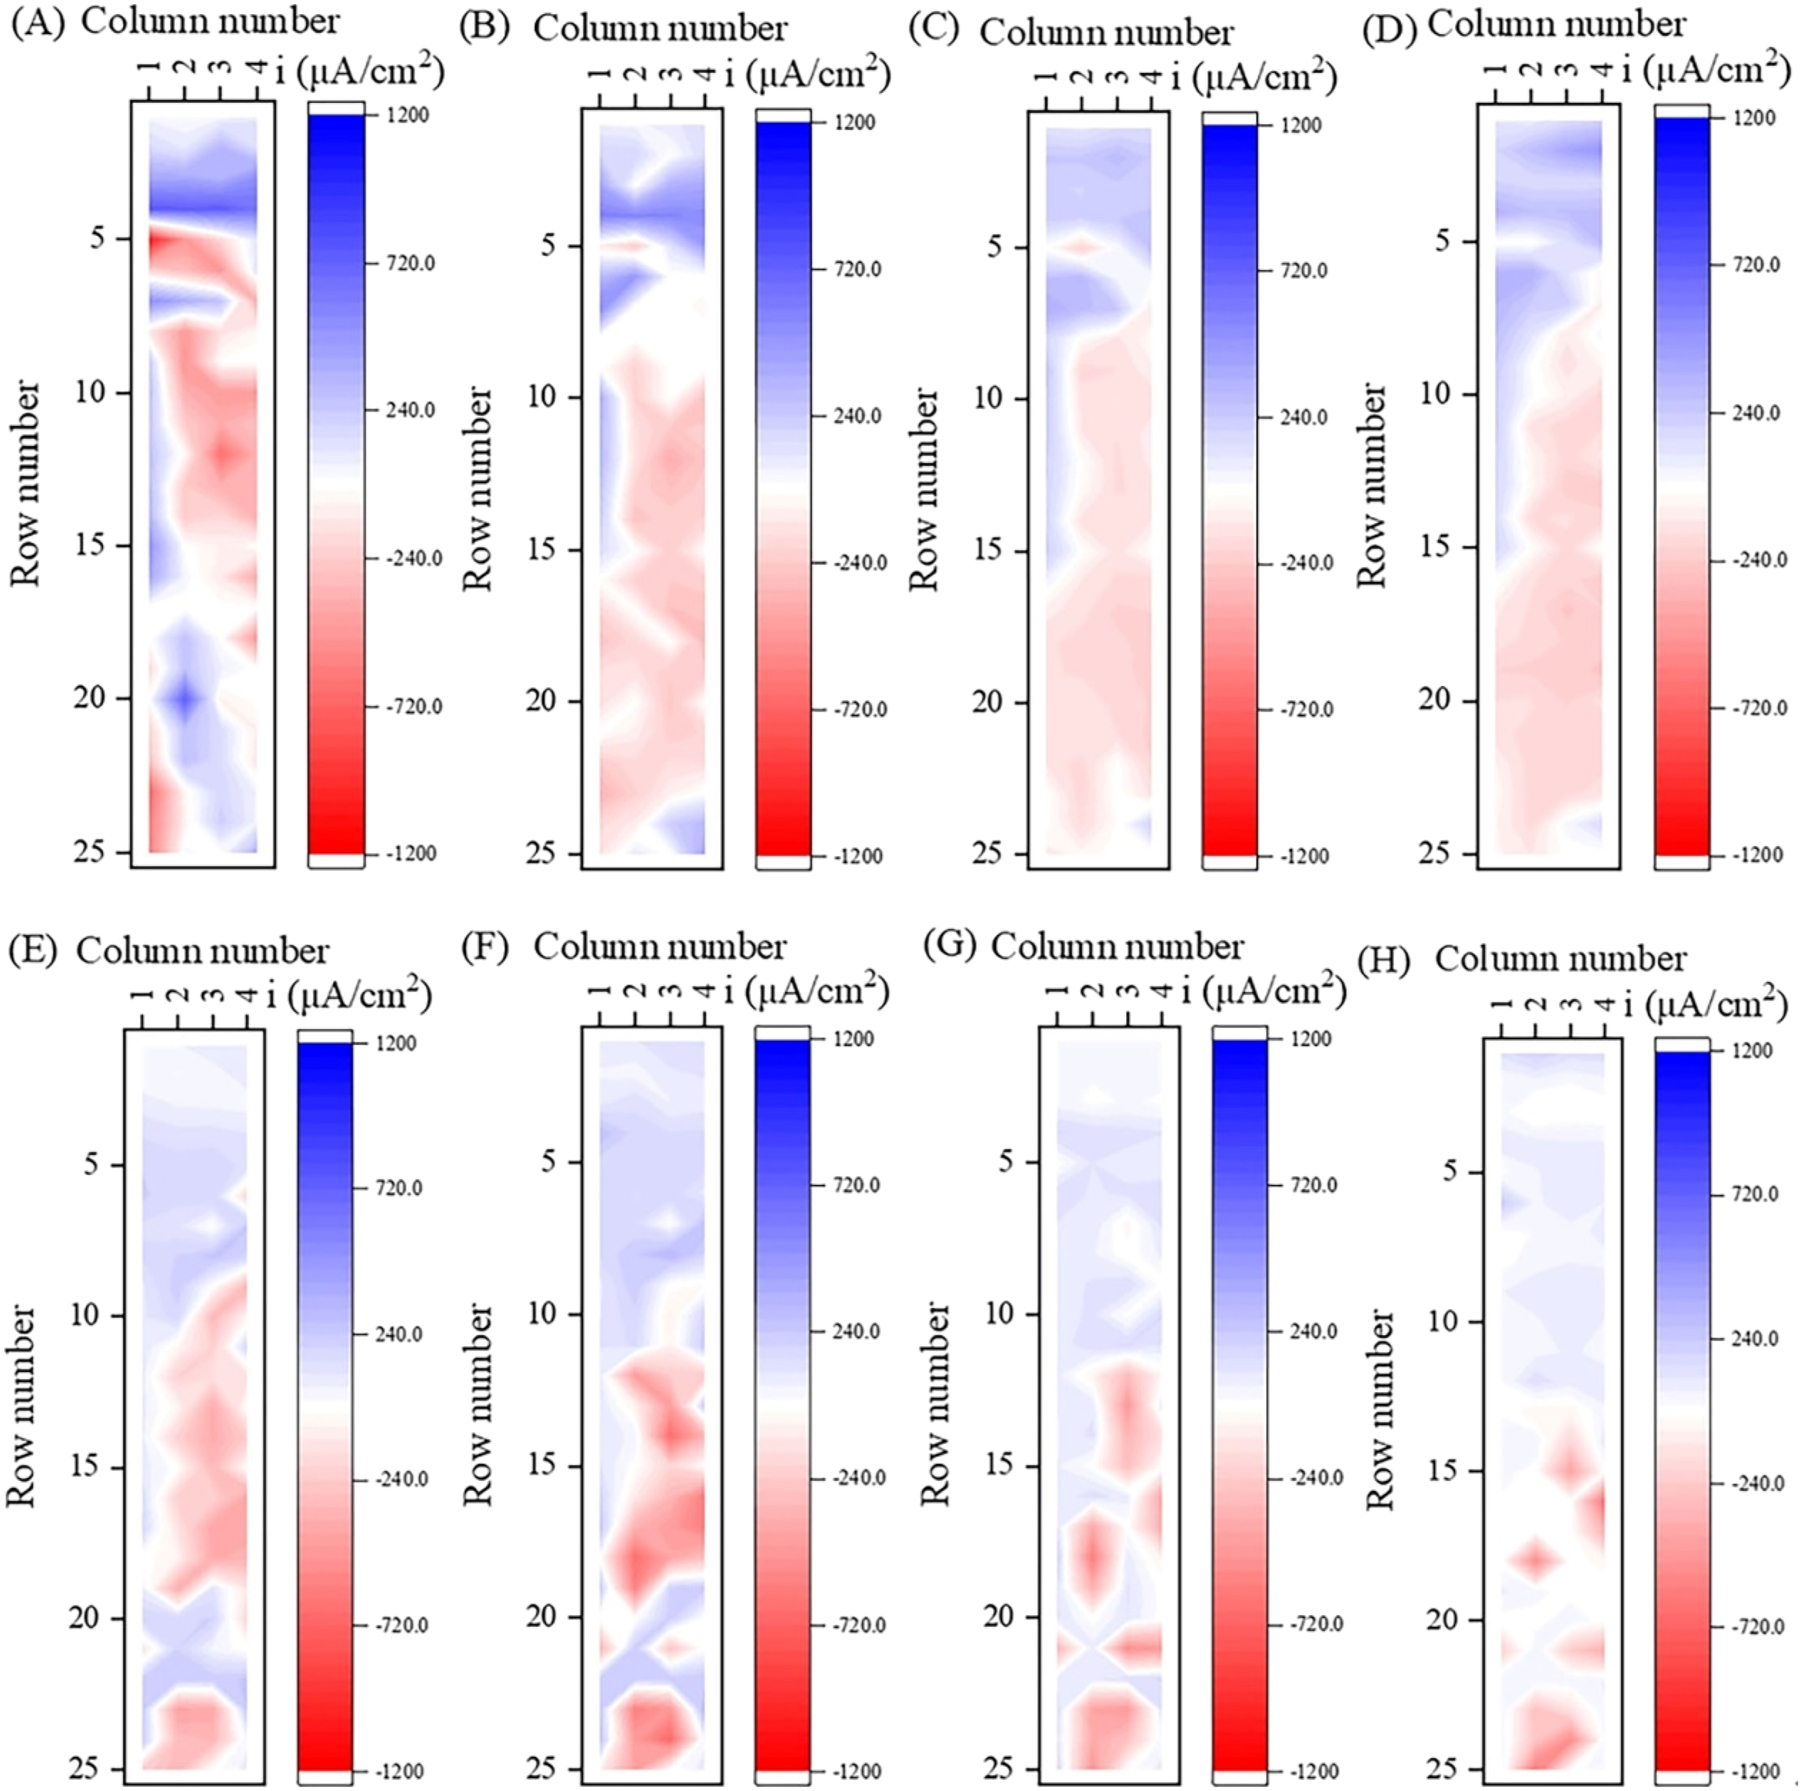
Firstly, the change of current density distribution on the surface of WBE in static simulated seawater with time was measured, as shown in Figure 3. The anodic current was set to negative and the cathodic current to positive in figures. That is, the blue represents the cathode region where oxygen reduction reaction mainly occurs, and the red represents the anode region where metal oxidation reaction mainly occurs. The darker the color, the greater the current density.
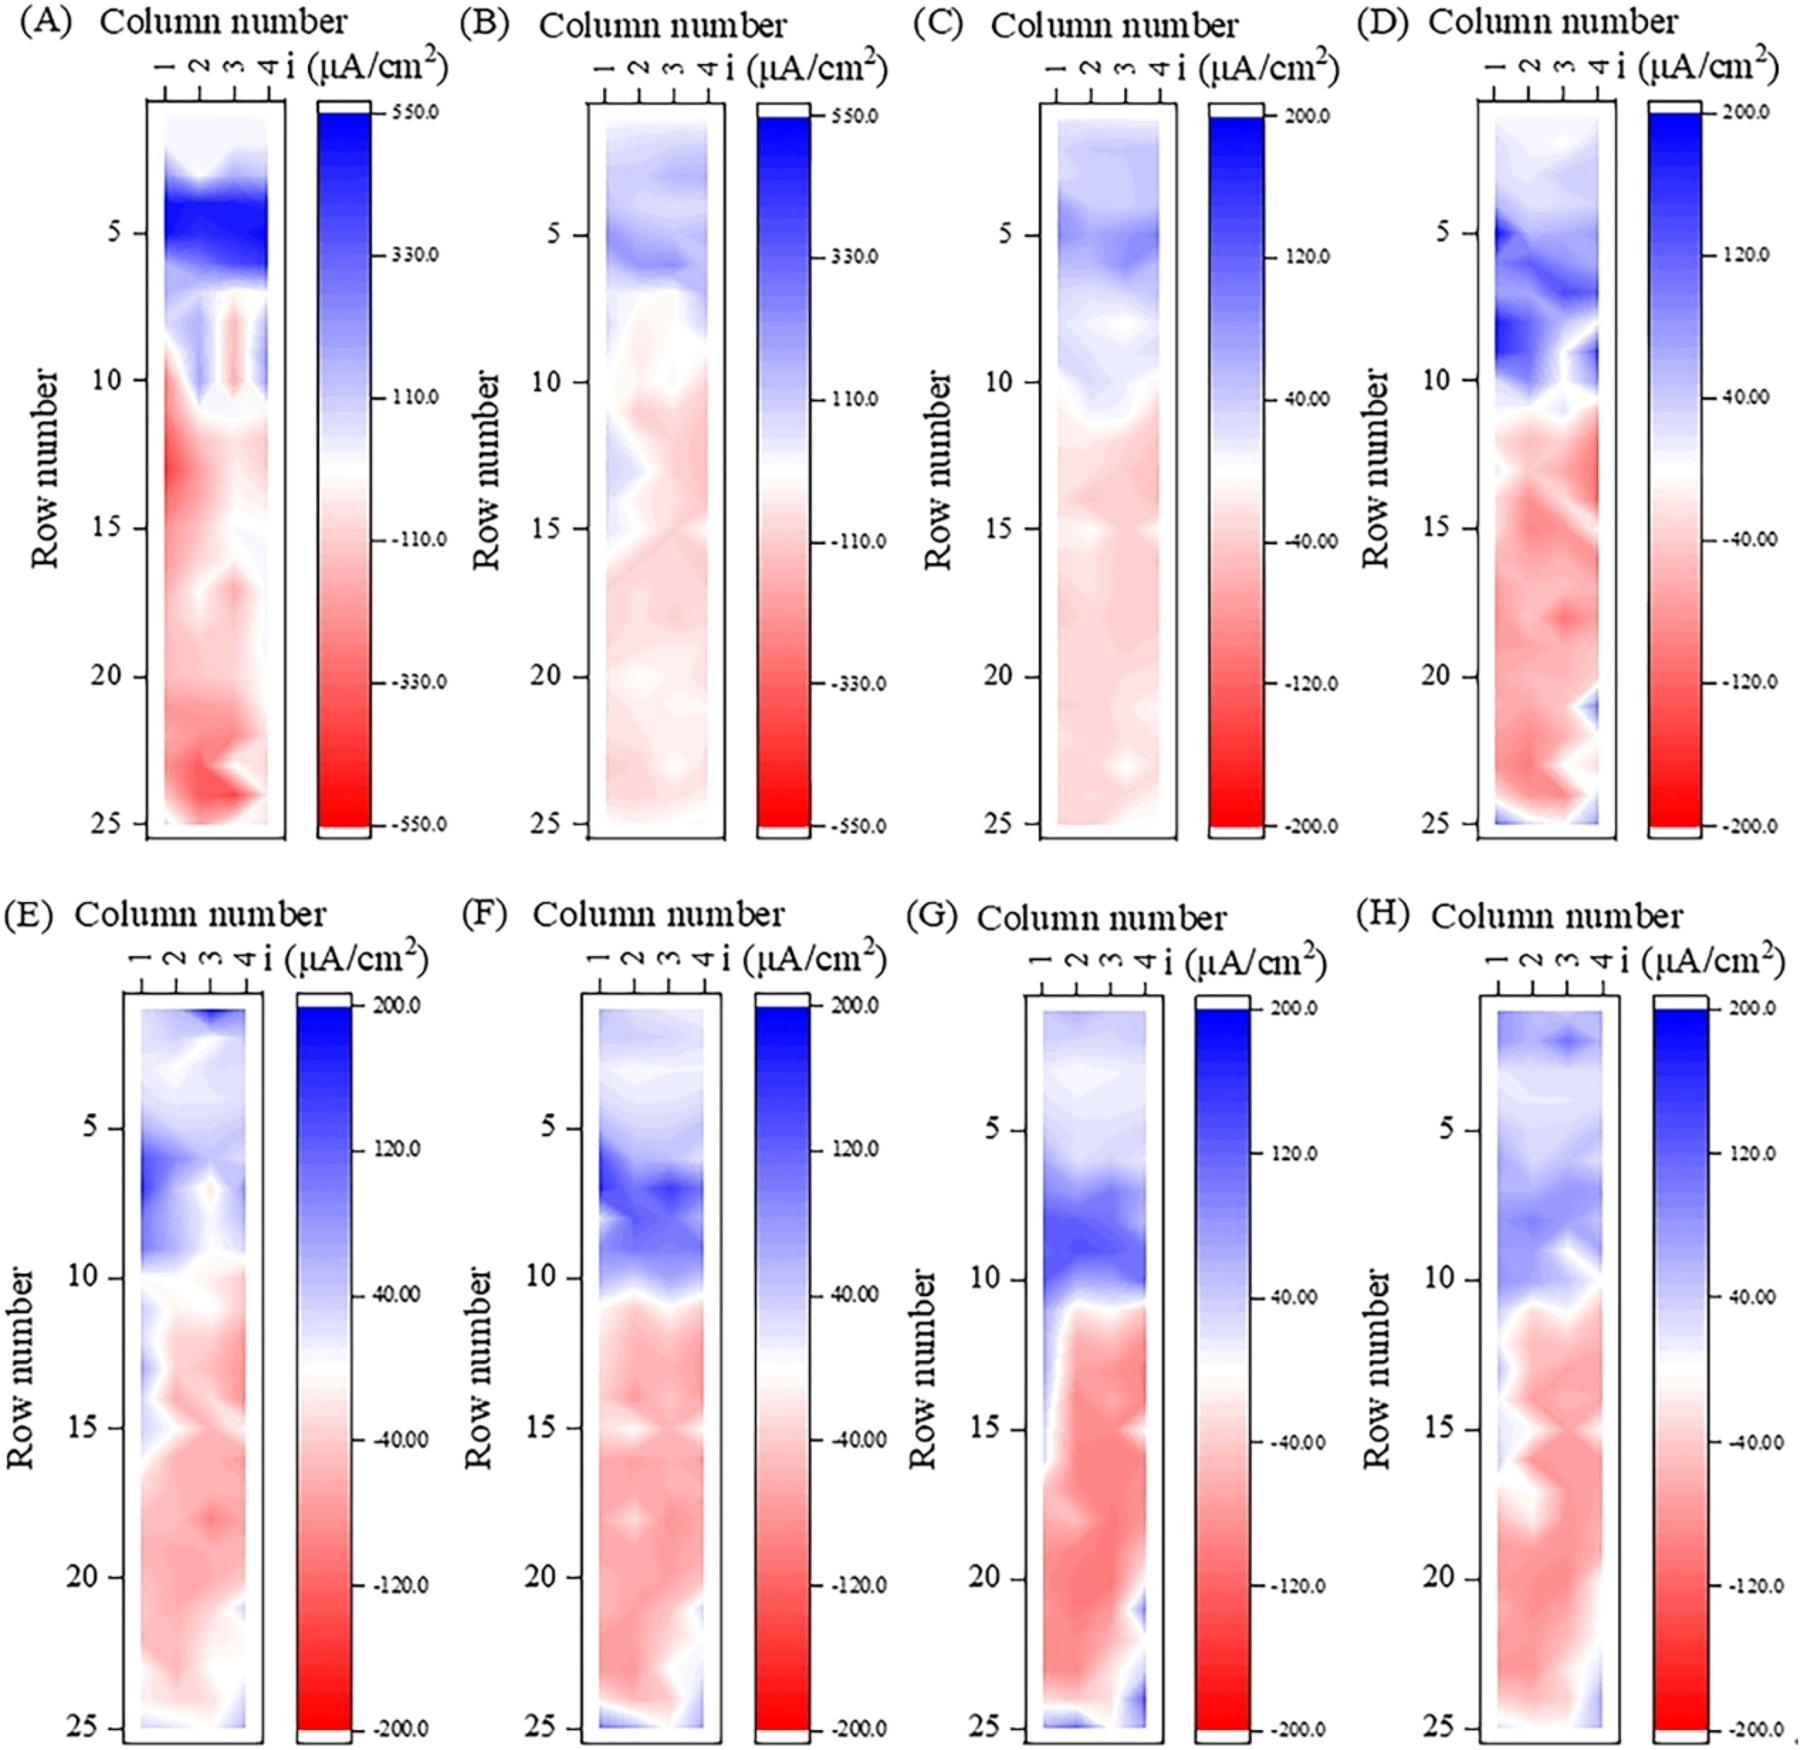
Current density distribution of the WBE after immersing in static simulated seawater for (A) 1 h, (B) 1 d, (C) 3 d, (D) 6 d, (E) 12 d, (F) 18 d, (G) 24 d, and (H) 30 d.
Figure 3 shows that during the 30 d experiment, the small electrodes above the waterline exhibited cathodic current, while the small electrodes below the waterline were divided into two regions: the electrodes in rows 4–10 (below the waterline by 0.5 mm–27.5 mm) near the waterline were mainly the cathodic region where cathodic current mainly occurred, while the electrodes below row 10 (below the waterline by 27.5 mm) were mainly the anodic region where anodic current mainly occurs.
From Figure 3A, it can be observed that stable cathode and anode regions have not yet formed on the surface of WBE in the early stage of the experiment (immersing for 1 h), which was similar to the results mentioned by Jeffrey (Jeffrey et al. 2009). The region in rows 4–6 (below the waterline by 0.5 mm–11.5 mm) displayed dark blue, indicating a region with strong cathode reaction. At the initial stage of corrosion, the distribution of dissolved oxygen in the water solution was relatively uniform, and the distribution of anode and cathode on the surface of WBE was random. The region with strong cathode reaction disappeared at 1 d, and the cathode region gradually extended to rows 1–3 (above the waterline by 0.5–11.5 mm), indicating the formation of thin liquid film in the upper region of waterline (Tan 2005). Although the cathode area increased at this time, the cathode was mainly borne by the underwater area. The color of the blue and red areas became significantly darker at 6 d, indicating an increase in the galvanic current. This may be related to the generation of some specific corrosion products on the steel surface, such as corrosion product γ-FeOOH, which can undergo a reduction reaction and increase the cathodic current density (Chen et al. 2020). The cathodic reaction rate in the upper region of the waterline increased at 12 d, and the cathodic current in row 1 was greater than that in row 3. After 12 d, the change in current density distribution was small, and the distribution in cathode and anode regions was relatively fixed.
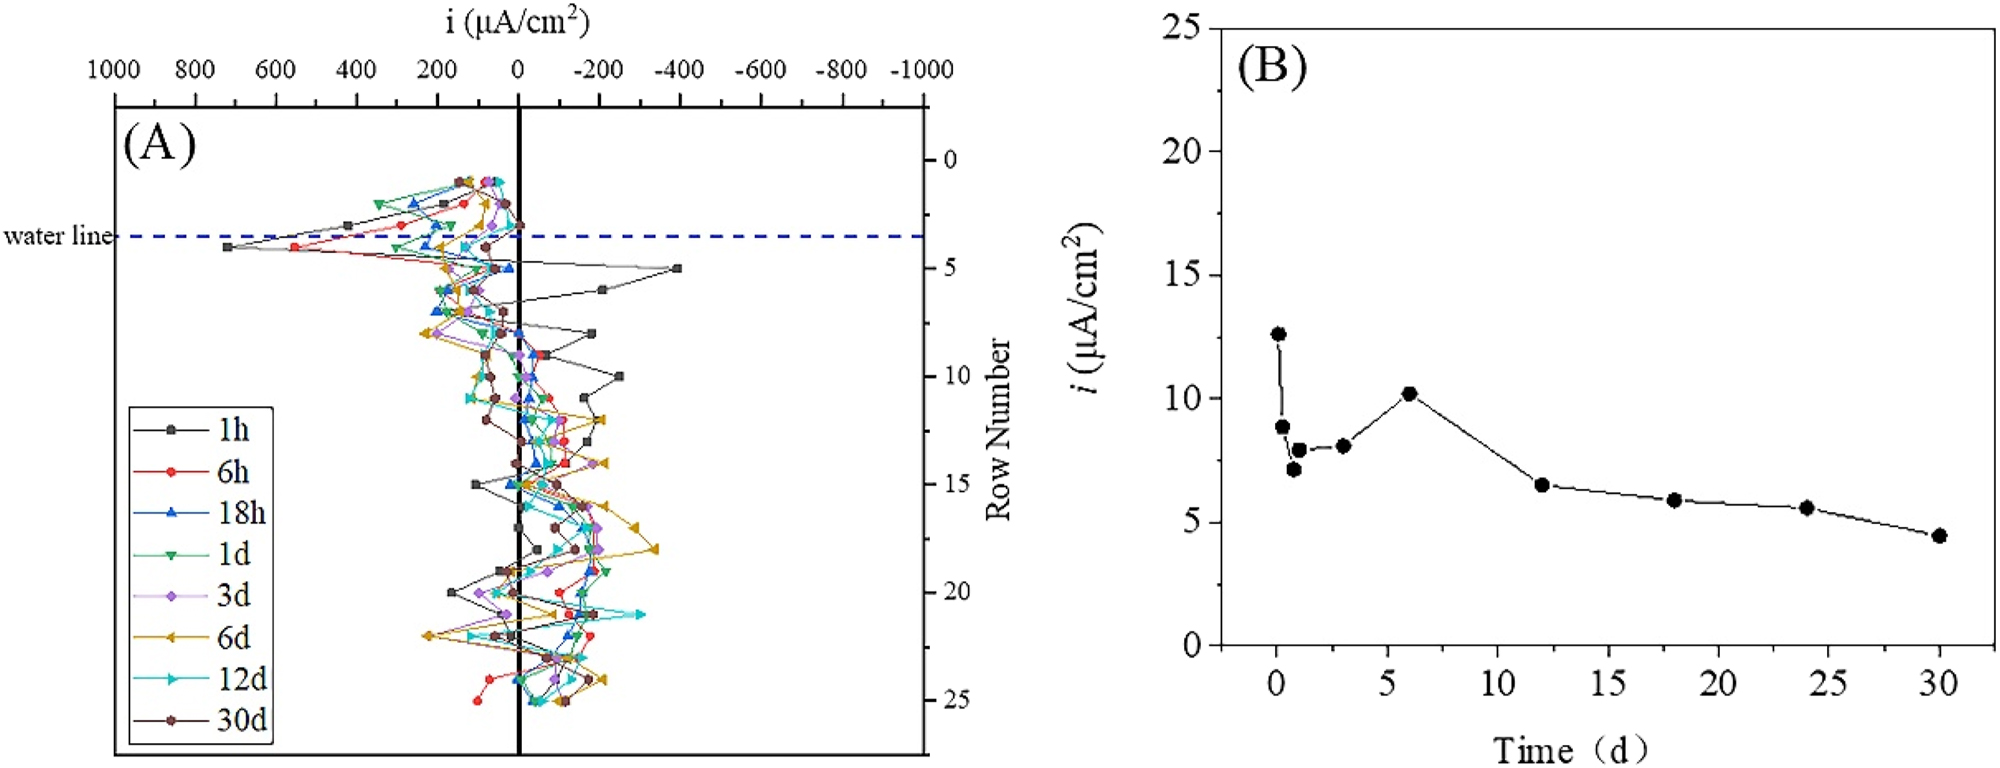
Figure 4 shows the single-row current density and total anode current density of the WBE in simulated seawater. The single-row current density was obtained by summing the current density vectors of four small electrodes in the same row and then calculating the average value, while the total anode current density was obtained by summing the anode current density of all the small anodes in different time. The single-row current density can more intuitively display the variation of metal corrosion at different positions with time (Tan 2005). The maximum cathodic and anodic current densities appeared at 1 h, with the maximum cathodic current density located in rows 4 and 5 (below the waterline by 0.5 mm–7.5 mm), and the maximum anodic current density located in rows 12 and 24 (below the waterline by 35.5 mm and 83.5 mm, respectively). However, in the first 3 days, there was a rapid decrease in cathodic and anodic current densities with time, which may be related to the quick formation and thickening of corrosion products on the steel surface, leading to an increase in the resistance of metal dissolution reaction. The main cathodic reaction occurred in rows 5–9 (below the waterline by 7.5 mm–23.5 mm) at 6 d, and the maximum single-row current density (reaching 102.5 μA/cm2) was located at row 7 (below the waterline by 15.5 mm). The maximum single-row current density on the upper of the waterline was located in the row 3 (above the waterline by 0.5 mm), reaching 28.6 μA/cm2. At 12 d, the single-row current density of the row 1 (above the waterline by 8.5 mm) was 86.2 μA/cm2, which exceeded the maximum cathodic single-row current density of 72.1 μA/cm2 below the waterline. The distribution of cathodic and anodic current density tended to be stable after 12 d. Figure 4B shows that the total anodic current density did not change significantly after 6 d, fluctuating around 2.5 mA/cm2.
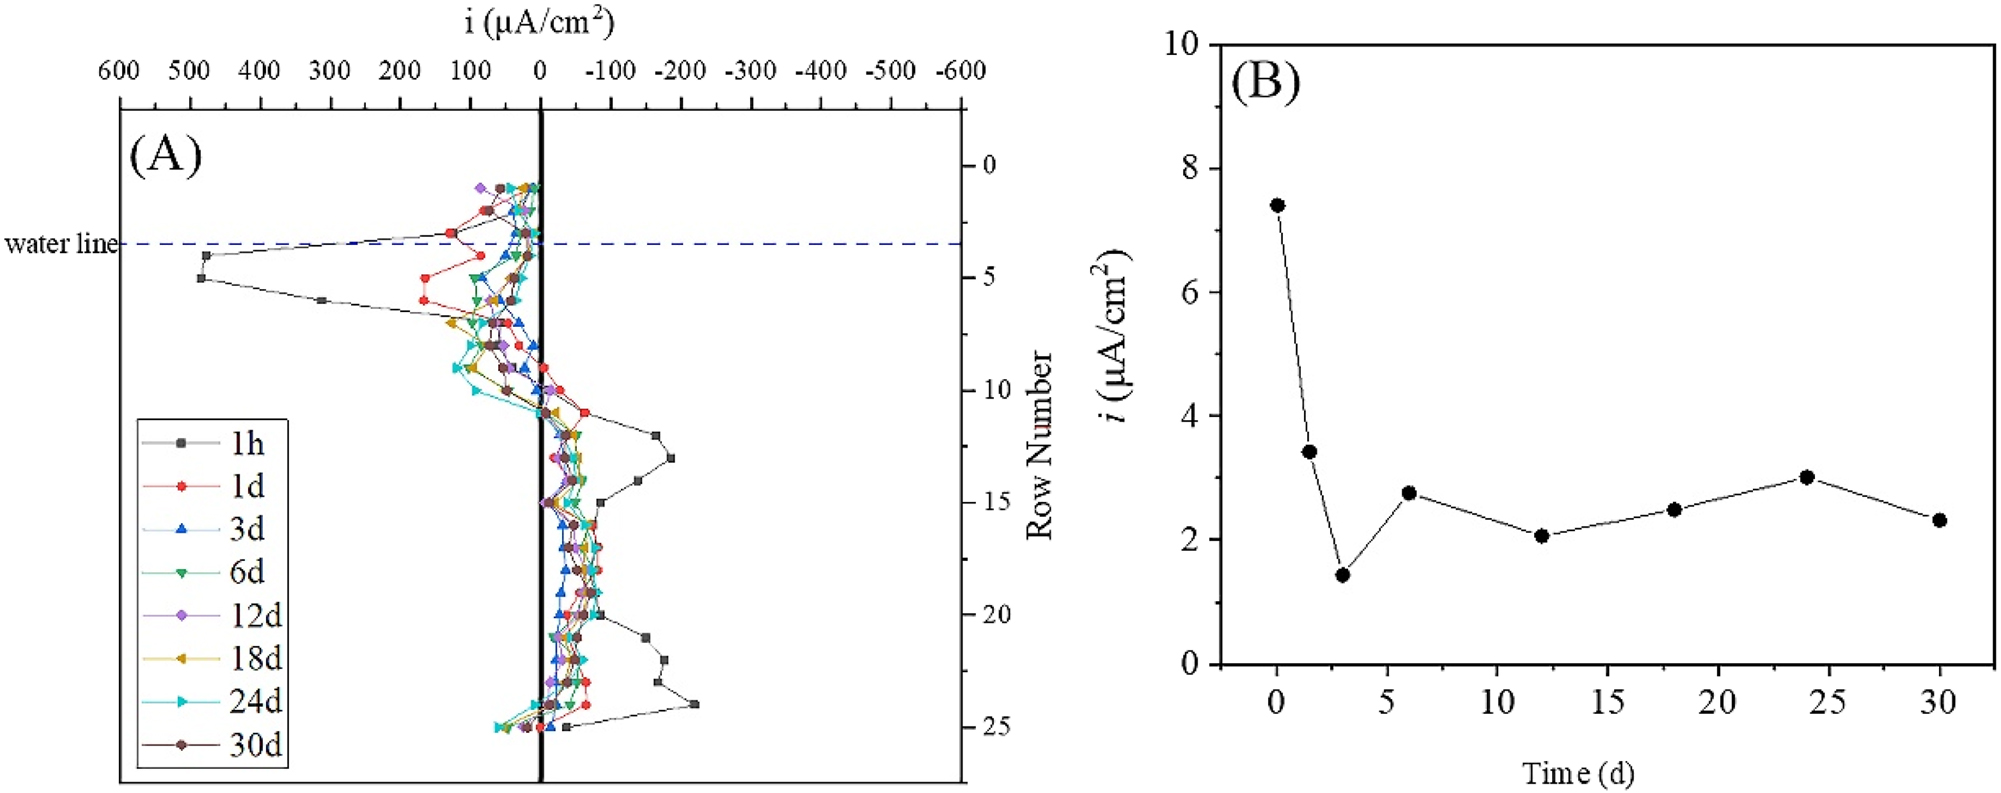
Single-row current density and total anodic current density of the WBE in static simulation of seawater. (A) Single-row current density and (B) total anodic current density.
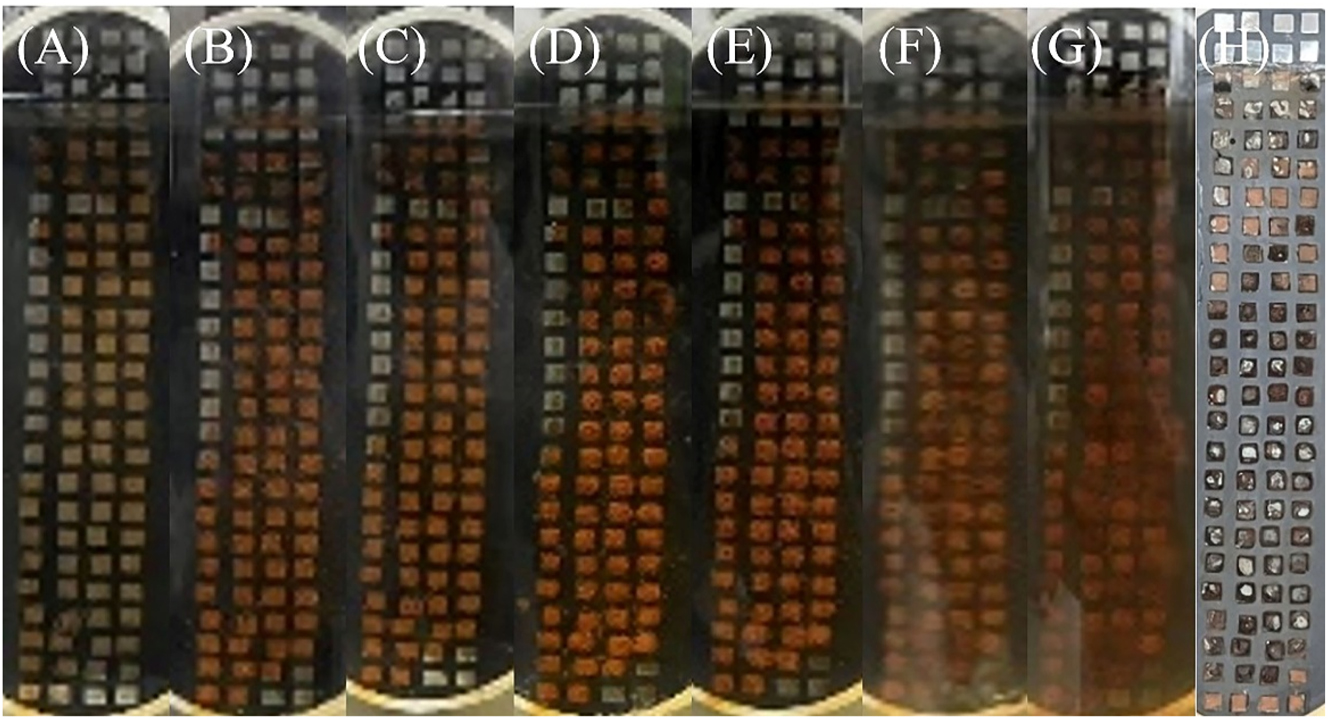
Figure 5 shows the surface morphology of WBE after corrosion at different times. It can be observed that the corrosion products gradually increased with the extension of time. At 6 d, all small electrodes from row 6 (below the waterline by 11.5 mm) to the bottom of the WBE were obviously covered with corrosion products. Figure 5I shows the surface of WBE after ultrasonic treatment to remove loose corrosion products. It could be observed that there was almost no corrosion on the row 4 and above, and the metal surface presented the original metallic luster, while regions located on row 6 and below were corroded to varying degrees. Some black corrosion products were found on the WBE surface in rows 6–9 (below the waterline by 8.5 mm–23.5 mm), and it is generally believed that these relatively dense black residues have a certain protective effect on the metal (Chen et al. 2020). The metal surfaces in the remaining anode region have undergone varying degrees of corrosion, with more severe corrosion occurring downward, especially on the surfaces in rows 23–24 (below the waterline by 76.5 mm–83.5 mm) at the bottom.
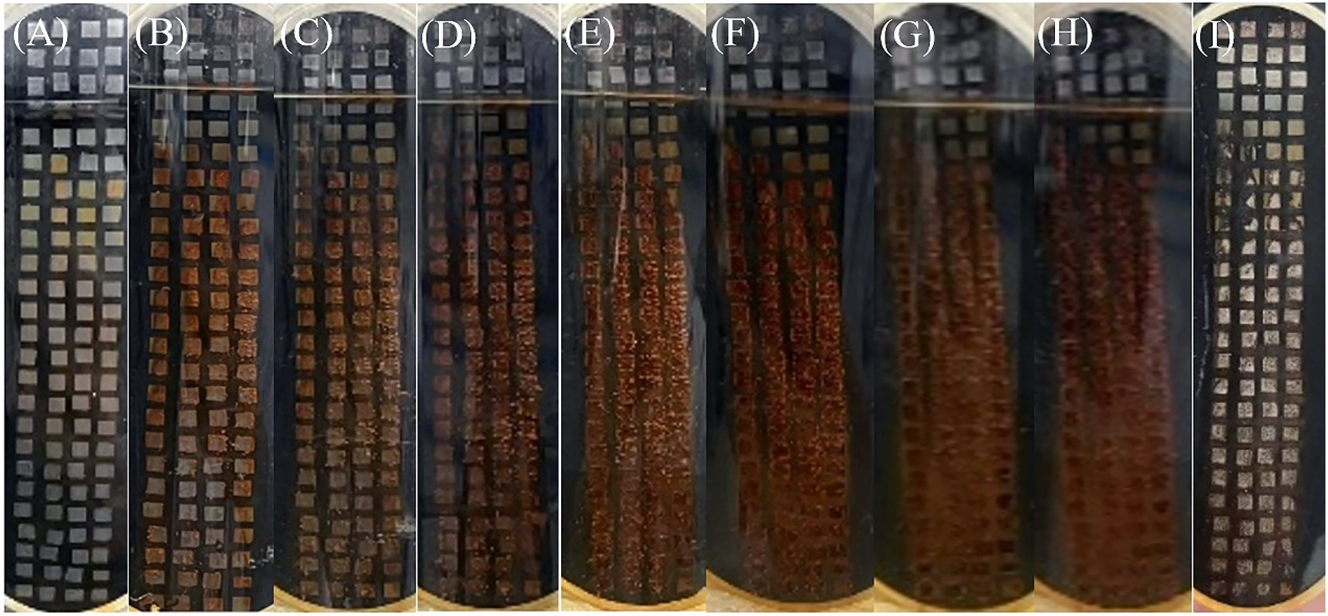
Surface corrosion morphology of the steel after immersing in static simulated seawater for (A–H) 1 h, 1 d, 3 d, 6 d, 12 d, 18 d, 24 d, 30 d, and (I) after removal of loose surface corrosion products.
It can also be observed from Figure 5 that at the end of the experiment, except for the small electrodes in row 4, the surface of all the other small electrodes below the waterline was covered with a layer of yellowish-brown corrosion products. The small electrodes in row 4 was close to the waterline, where the surface solution could quickly replenish the consumed dissolved oxygen, making it a fixed cathode region that underwent oxygen reduction reaction, as shown in equation (1).
Therefore, the surface solution at row 4 has a high concentration of OH− (Gallagher 2016; Wang et al. 2006), which can cause passivation of the steel surface (Bellanger 1995; Cui et al. 2017; Lee and Rasaiah 2013). The passivated surface had a higher potential, so the steel surface here hardly underwent anodic dissolution. For example, at 1 h, the average potentials in row 4 and row 5 were −0.663 V and −0.669 V, respectively, while the potential in row 13 (below the waterline by 36.5 mm) was −0.699 V. The measured potential difference between the cathode and anode was relatively small, as these small electrodes were short-circuit connected for most of the experimental process and only separated when measuring the potential and galvanic current. Figure 6A shows a schematic diagram of pH distribution on the surface of WBE under static condition. The OH− generated by oxygen reduction reaction continuously diffused from the cathode region at the waterline to the anode region below the waterline due to the concentration difference (Gallagher 2016), gradually forming a pH concentration gradient (Sainis et al. 2020; Yu et al. 2015). Taking the “critical point” of the pH gradient as the boundary (the pH value of the “critical point” is the pH value of the original solution), the following experimental phenomena can be observed: the upper part of the “critical point” was mainly the cathode region, and the lower part was the large anode region. Starting from 12 d, the cathode region was located above the row 11 (below the waterline by 28.5 mm) and the anode region was located below the row 11 in the WBE, until the end of the experiment. At the end of the 30 d experiment, there were fewer or even no corrosion products near the waterline, while the black corrosion products were thicker in the underwater areas far from the waterline, which was consistent with the results in the literature (Chen et al. 2014; Laleh et al. 2023a,b; Li et al. 2020; Pathirana et al. 2023).
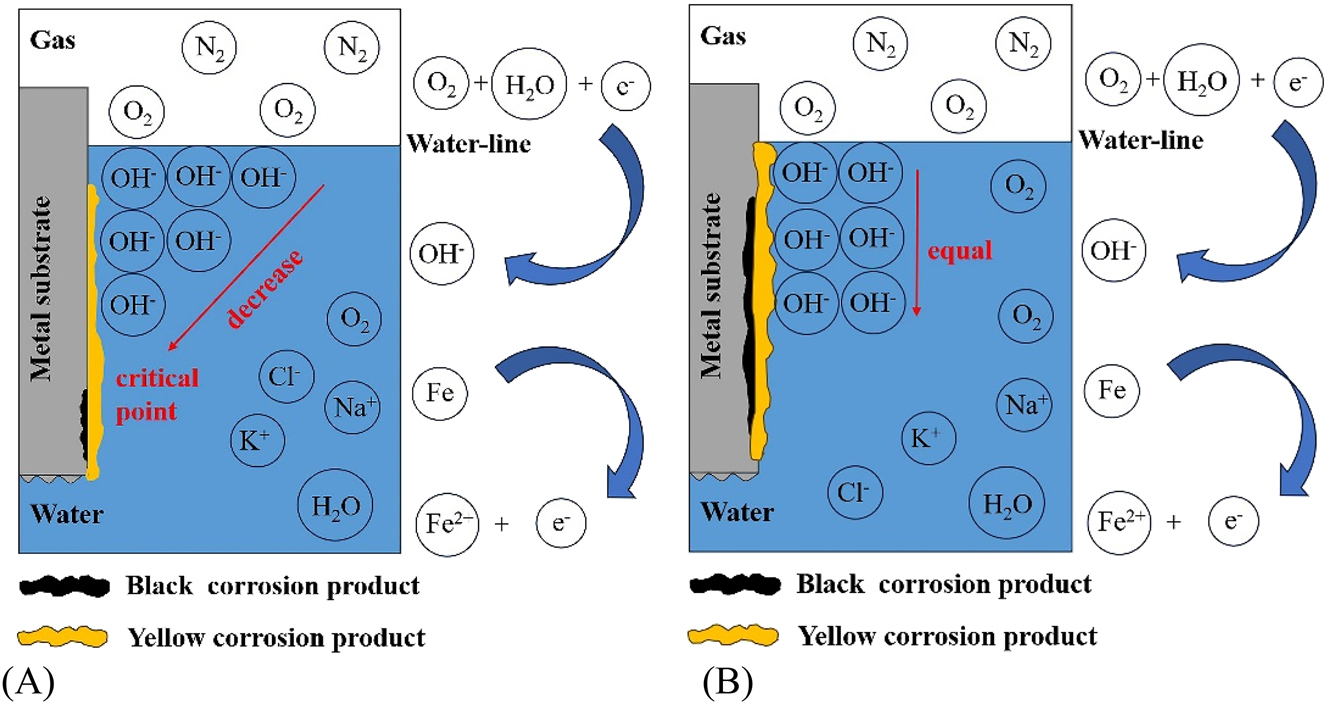
Schematic diagram of pH distribution on WBE surface under (A) static and (B) dynamic condition.
Three stages of waterline corrosion could be observed in the process of static waterline corrosion: initial stage, development stage, and stable stage. The time period of 0∼1 d was the initial stage, during which there was sufficient dissolved oxygen in the water. The oxygen concentration difference at different positions in the WBE was not obvious, and due to the lack of corrosion products on the WBE surface, the resistance to oxygen and electron transfer was small, resulting in a high total anodic current density at this stage. The time period of 1 d–6 d was the development stage, during which the dissolved oxygen in the surface solution of the WBE below the waterline was depleted and cannot be replenished in time, resulting in the formation of an oxygen concentration cell. At this stage, the total anodic current density was greatly reduced because the metal surface was gradually covered by corrosion products. In addition, a thin water film appeared on the upper region of the waterline, but due to the thin thickness, rapid cathodic reaction could not be achieved (Pang et al. 2020). The time period of 6 d–30 d was the stable stage, during which the total anodic current density increased a little and remained stable, possibly due to the formation of a stable water film on the upper of the WBE and the generation of stable corrosion products.
3.2 Waterline corrosion in dynamic seawater
Under dynamic condition, waterline corrosion behavior will undergo change due to the acceleration of mass transfer. Figure 7 shows the variation of the current density distribution on the surface of WBE in dynamic simulated seawater with time, while Figure 8 shows the single-row current density of WBE in simulated seawater, indicating that the waterline corrosion rate under dynamic condition was significantly higher than that under static condition. The accelerated mass transfer of substances related to corrosion reactions, such as oxygen and corrosion products in a flowing state, will promote the reaction of cathode and anode in the corrosion cell.
Current density distribution of the WBE after immersing in dynamic simulated seawater solution for different times: (A) 1 h, (B) 6 h, (C) 18 h, (D) 1 d, (E) 3 d, (F) 6 d, (G) 12 d, and (H) 30 d.
Single-row current density and total anodic current density of the WBE in dynamic simulated seawater. (A) Single-row current density and (B) total anodic current density.
It can be observed in Figure 7 that the distribution of anodes and cathodes on the WBE surface was relatively random at 1 h (Figure 7A), which was consistent with the initial waterline corrosion behavior in static simulated seawater. The strongest anode region was located on the small electrode numbered #5-1 below the waterline, with an anodic current density of −1,035.6 μA/cm2. At 6 h of corrosion, the anodic current density decreased significantly, and the anode region gradually moved downward to rows 6–23 (below the waterline by 8.5 mm–79.5 mm), forming a large anode structure (Figure 7B). After 3 d, the anode region split into two or more smaller anode regions, and the anode area was significantly smaller at 6 d. It may be that under dynamic condition, the waterline corrosion rate was high in the initial stage, resulting in the rapid formation of relatively dense corrosion products on the anode surface, leading to an increase in reaction resistance (Chen et al. 2020; Raman et al. 1991), even causing electrode reversal in some anode regions due to an increase in potential. For example, from 3 d to 6 d, the potential of the small electrode numbered #11-4 shifted positively from −0.701 V to −0.690 V, and the potential of the small electrode numbered #12-4 shifted positively from −0.710 V to −0.707 V. At 30 d, the anode area further reduced and scattered below 13th row.
Figure 8 shows the single-row current density of WBE in dynamic simulated seawater. The single-row cathodic current density reached its maximum value 719.7 μA/cm2 at 1 h, which was located at the 4th row below the waterline. This value was significantly higher than 485.0 μA/cm2 under static condition and should be related to the mass transfer acceleration of dissolved oxygen in water. The maximum single-row anodic current density appeared in the 5th row, with a value of −391.8 μA/cm2, which was the average of the current density vectors in this row, so it differed significantly from that of the small electrode numbered #5-1 (−1,035.6 μA/cm2). At 6 h, the single-row current density of the 5th row was reversed from anodic current to cathodic current. The maximum single-row anodic current density at 3 d was located in the 18th row (below the waterline by 56.5 mm) with a value of −195.7 μA/cm2. After 6 d, the corrosion region was further moved down to row 11 (below the waterline by 28.5 mm) and below. The reason for the reversal of the small electrodes in rows 8–10 (below the waterline by 16.5 mm–27.5 mm) from anode to cathode may be mainly due to the accumulation of relatively dense corrosion products on the steel surface, which thereby increased the anode reaction resistance of the metal and led to a positive shift in the potential. For example, the potential of the small electrode at #10-4 shifted from −0.723 V at 1 d to −0.693 V at 6 d, which was close to the potential −0.692 V of the small cathode #4-4 at 6 d. The electrode reversal phenomenon also appeared in rows 20–22 at 3 d. At 1 d, there was anode current density of −157.22 μA cm−2, −168.06 μA cm−2, −143.56 μA cm−2, respectively, in rows 20–22. While it changed to cathode current density at 3 d, which was 98.61 μA cm−2, 30.06 μA cm−2, and 223.33 μA cm−2, respectively. From the perspective of potential distribution, the average potential of the small electrodes in rows 20–22 at 1 d was −0.725 V, −0.726 V, and −0.724 V, respectively, while that at 3 d was −0.703 V, −0.705 V, and −0.700 V, respectively, indicating a positive shift in the potential. Meanwhile, the average potential of the 23rd row, which was still in the anode region, was more negative (−0.710 V). The anode area further decreased at 30 d. At this time, rows 1–14 (above the waterline by 12.5 mm ∼ below the waterline by 43.5 mm) acted as cathode, rows 15–17 (below the waterline by 44.5 mm–55.5 mm) acted as anode, and rows 18–25 (below the waterline by 56.5 mm–87.5 mm) acted as a cross distribution of anode and cathode.
Figure 9 shows the surface morphology of WBE in dynamic simulated seawater at different times. It could be found that black or brown corrosion products appeared on the surface of small electrodes in rows 3–25 (above the waterline by 3.5 mm ∼ below the waterline by 87.5 mm), which was different from the results under static condition.
Surface corrosion morphology of the WBE immersing in dynamic simulated seawater for (A–G) 6 h, 18 h, 1 d, 3 d, 6 d, 12 d, and 30 d and (H) after removal of surface loose corrosion products.
From Figures 7–9, it can be observed that under dynamic conditions, column 1 (rows 6–15) shows a cathodic reaction. This phenomenon did not occur in the static state and only occurred under dynamic conditions, which should be related to the shaking of the shaker in the experiment. The shaker caused the beaker to shake clockwise in the experiment, which may cause some changes in the distribution of solution components in the beaker. Column 1 was at the leading edge of rotation and may come into contact with more oxygen molecules.
The development process of waterline corrosion under dynamic condition can be mainly divided into three stages: initial stage (<6 h), development stage (1 d–3 d), and deceleration stage (3 d–30 d). The characteristics of the initial stage and the development stage were the same as those under static condition, distinguished by whether the oxygen concentration difference was formed. However, due to the high metal corrosion rate, the time of these two stages was shortened under dynamic condition. In the deceleration stage, the total anodic current density decreased continuously with time. The formation of this stage should also be related to the high waterline corrosion rate in the early stage under dynamic condition, and the relatively dense corrosion products covering on the anode surface in a short period of time. This first raised the potential of part of the anode surface and reversed to the cathode, resulting in a decrease in the total anode area and an increase in the local anodic current density (such as at 6 d). However, further thickening of the corrosion products led to a continuous increase in the anodic dissolution resistance, and the local anodic current density also decreased with time after 12 d. In addition, under dynamic condition, the pH gradient on the cathode surface was difficult to form and the pH value of the liquid layer on the metal surface near the waterline should be significantly lower than that under static condition. Therefore, the metal surface at rows 3–4 near the waterline was not easily passivated. With the positive shift of the anode potential caused by the coverage of corrosion products, the potential difference between the cathode and the anode decreased. The potential of some original anode underwater even moved positively above the potential of the small electrodes at rows 3–4, causing the corrosion of some small electrodes at rows 3–4 (above the waterline by 3.5 mm ∼ below the waterline by 3.5 mm).
By comparing potentials of the small electrodes in WBE, it was found that the potential difference between the cathode and the anode in WBE under dynamic condition was generally smaller than that at static condition, and decreased continuously with time, and even electrode reversal occurred in the later stage of the experiment. However, the anodic current density under dynamic condition was much higher than that under static condition, indicating that the potential difference was not the main factor accelerating the corrosion of WBE. Mass transfer processes such as dissolved oxygen may have a greater impact on it.
The above results indicate that for the steel studied in this paper, under dynamic conditions, the corroded anode area had shifted from the area far away from the waterline to the waterline position, which was different from the results under static conditions. Therefore, in dynamic corrosion systems, attention should be paid to corrosion control at the waterline.
3.3 Analysis of corrosion products
Figure 10 shows the morphology of corrosion products under SEM. Figures 10A and B shows the morphology of the outer yellow corrosion product and the inner black corrosion product, respectively. It can be observed that the yellow corrosion product was relatively loose and porous, and the black corrosion product was denser. Figure 11 shows the FTIR spectra of black and yellow corrosion products under static and dynamic condition. It can be observed that for yellow corrosion products, there are peaks of 1,017 cm−1 and 737 cm−1 under both static and dynamic condition, corresponding to γ-FeOOH (Raman et al. 1991). A peak at 467 cm−1 corresponding to α-FeOOH was also observed in the static specimen and a peak at 550 cm−1 corresponding to γ-Fe2O3 was observed in the dynamic specimen. For the black corrosion products, broad and strong absorption peaks at 1,059 cm−1 and 1,068 cm−1 indicated the presence of σ-FeOOH under both static and dynamic condition, and the peaks at 1,246 cm−1, 1,399 cm−1, and 1,260 cm−1 correspond to α-FeOOH. However, a broad and weak absorption peak at 566 cm−1 was also observed under dynamic condition, indicating the presence of Fe3O4.
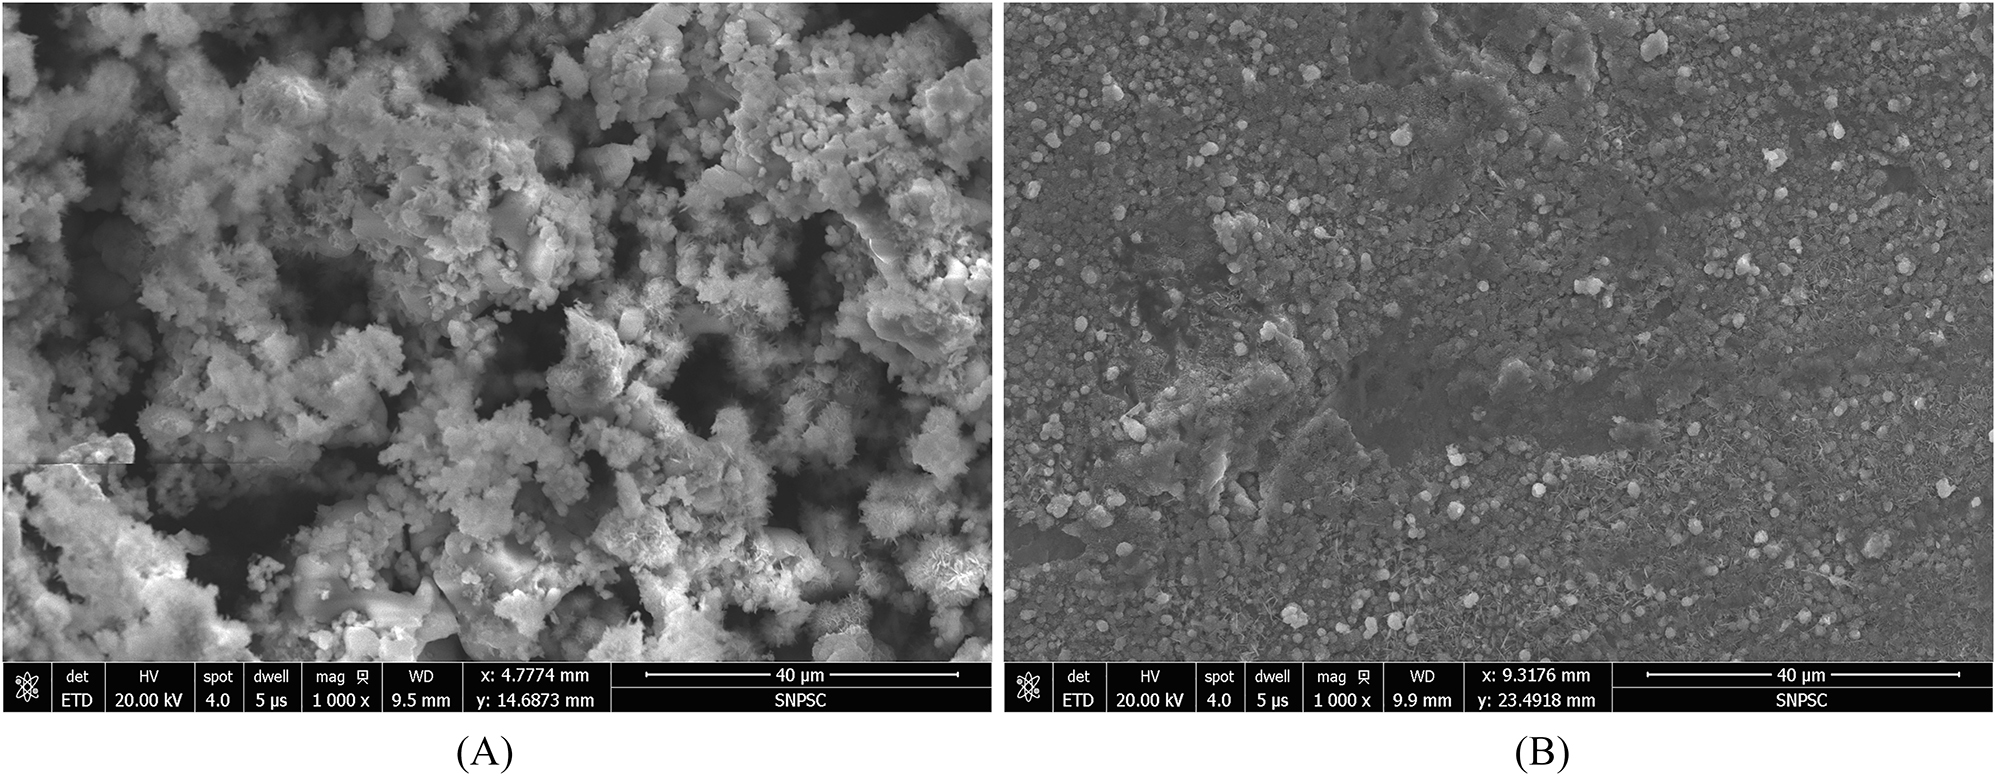
Morphology of (A) the yellow corrosion product and (B) the black corrosion product.

Infrared analysis of corrosion products: (A) under static condition and (B) under dynamic condition.
The formation process of the yellow corrosion product γ-FeOOH is shown in equations (2) to (4). As a thermodynamically metastable phase, γ-FeOOH can be converted into Fe3O4 by cathodic reduction reaction [equation (5)] (Zhang et al. 2023). Fe3O4, as a thermodynamically stable phase (Gao et al. 2018), can form a relatively dense corrosion product film on the steel surface, which increased the reaction resistance of the corrosion system. This may be the reason for the polarity reversal in some anode regions and the decrease of total anode area and total anodic current density after dynamic experiment for 3 days.
4 Conclusions
The waterline corrosion behavior of a weathering steel in static and dynamic simulated seawater was investigated by WBE. The following conclusions can be drawn:
Under static condition, the distribution of anode and cathode on the WBE surface was relatively stable, maintaining a large cathode and a large anode structure with the cathode above the 10th row and the anode below the 10th row. At the initial stage of corrosion, both the cathodic and anodic current densities were relatively high. With the extension of time, both the cathodic and anodic current densities gradually decreased due to the coverage of corrosion products on the WBE surface. The region near the waterline remained in a stable cathode, and after 6 d, the anode and cathode region and the total anodic current density of the WBE changed little with time.
Under dynamic condition, the surface of the WBE exhibited a large anode structure at the initial corrosion stage (within 1 d), and the total anodic current density decreased rapidly with time but was significantly higher than that under static condition. After 3 d, the anode area reduced continuously with time, and some of the original anode transformed into cathode region, and gradually presenting a structure characterized by cross distribution with small cathodes and small anodes. After 6 d, both the total anode area and the total anodic current density continued to decline with time, and corrosion also occurred near the waterline. Under dynamic condition, the mass transfer of oxygen and corrosion products was enhanced, leading to accelerated corrosion on the anode surface and being covered by dense corrosion products, resulting in electrode reversal in some anode regions in the later stage.
Surface analysis reveals that the corrosion products primarily consisted of γ-FeOOH, α-FeOOH, and σ-FeOOH under static condition. In addition to these substances, γ-Fe2O3 and Fe3O4 were also observed in the corrosion products under dynamic condition. It is possible that the formation of these two oxides enhanced the density of the corrosion product film and raised the electrode potential, thereby increasing the anodic reaction resistance and even leading to electrode reversal.
Funding source: Science and Technology Commission of Shanghai Municipality
Award Identifier / Grant number: 23010501300
-
Research ethics: Not applicable.
-
Informed consent: Informed consent was obtained from all individuals included in this study, or their legal guardians or wards.
-
Author contributions: All authors have accepted responsibility for the entire content of this manuscript and approved its submission.
-
Use of Large Language Models, AI and Machine Learning Tools: None declared.
-
Conflict of interest: The authors state no conflict of interest.
-
Research funding: This work was financially supported by the Science and Technology Commission of Shanghai Municipality (23010501300).
-
Data availability: Not applicable.
References
Bellanger, G. (1995). Effect of pH and hydrogen peroxide in radioactive water on the passivity of 1018 carbon steel. J. Mater. Sci. 30: 1259–1265, https://doi.org/10.1007/bf00356128.Suche in Google Scholar
Chen, Y.L., Zhang, W., Wang, W., Wang, J., Wang, Q., and Cai, G.X. (2014). Study on Q235 carbon steel corrosion in waterline region by WBE technology. Corros. Protect. 34: 451–458.Suche in Google Scholar
Chen, Z.W., Zhang, W., Zhan, Y., Lei, B., Sun, T.Y., and Li, W.H. (2020). Coating deterioration and underlying metal corrosion processes in water-line area: role of DACs. Coatings 10: 684, https://doi.org/10.3390/coatings10070684.Suche in Google Scholar
Cui, J., Yuan, W.J., Yuan, D.H., and Pei, Y.S. (2017). Effect of pH on the passivation of carbon steel by sodium borosilicate controlled-release inhibitor in simulated recirculating cooling water. Ind. Eng. Chem. Res. 56: 7239–7252, https://doi.org/10.1021/acs.iecr.7b01433.Suche in Google Scholar
Doherty, M. and Sykes, J.M. (2004). Micro-cells beneath organic lacquers: a study using scanning Kelvin probe and scanning acoustic microscopy. Corros. Sci. 46: 1265–1289, https://doi.org/10.1016/j.corsci.2003.09.016.Suche in Google Scholar
Evans, U.R. and King, C.V. (1961). The corrosion and oxidation of metals. J. Electrochem. Soc. 108: 94C, https://doi.org/10.1149/1.2428098.Suche in Google Scholar
Feng, X.G., Yan, Q.X., Lu, X.Y., Wu, T., Zhang, Y.J., Zuo, Y., and Wang, J.L. (2020). Protection performance of the submerged sacrificial anode on the steel reinforcement in the conductive carbon fiber mortar column in splash zones of marine environments. Corros. Sci. 174: 108818, https://doi.org/10.1016/j.corsci.2020.108818.Suche in Google Scholar
Gallagher, J. (2016). Oxygen reduction reaction: counting active sites. Nat. Energy 1: 16198, https://doi.org/10.1038/nenergy.2016.198.Suche in Google Scholar
Gao, S.J., Brown, B., Young, D., and Singer, M. (2018). Formation of iron oxide and iron sulfide at high temperature and their effects on corrosion. Corros. Sci. 135: 167–176, https://doi.org/10.1016/j.corsci.2018.02.045.Suche in Google Scholar
Hu, C.Z., Pei, Z.X., Shi, L., Tang, D.W., and Bai, M.L. (2022). Phase transition properties of thin liquid films with various thickness on different wettability surfaces. Int. Commun. Heat. Mass. 135: 106125, https://doi.org/10.1016/j.icheatmasstransfer.2022.106125.Suche in Google Scholar
Jeffrey, R. and Melchers, R.E. (2009). Corrosion of vertical mild steel strips in seawater. Corros. Sci. 51: 2291–2297, https://doi.org/10.1016/j.corsci.2009.06.020.Suche in Google Scholar
Laleh, M., Pathirana, M., and Tan, M.Y. (2023a). Site-specific local polarisation curve measurements for probing localised corrosion and inhibition. Corros. Sci. 214: 111019, https://doi.org/10.1016/j.corsci.2023.111019.Suche in Google Scholar
Laleh, M., Xu, Y., and Tan, M.Y.J. (2023b). A three-dimensional electrode array probe designed for visualising complex and dynamically changing internal pipeline corrosion. Corros. Sci. 211: 110924, https://doi.org/10.1016/j.corsci.2022.110924.Suche in Google Scholar
Lee, S.H. and Rasaiah, J.C. (2013). Proton transfer and the diffusion of H+ and OH− ions along water wires. J. Chem. Phys. 139: 124507, https://doi.org/10.1063/1.4821764.Suche in Google Scholar PubMed
Li, C.P., Zhang, L.W., Lu, Z.H., Ding, R., Zhao, X.D., Wang, B., Cui, H.T., and Liu, J. (2020). Studies on waterline corrosion processes and corrosion product characteristics of carbon steel in 3.5 wt% NaCl solution. Mater. Corros. 72: 732–742, https://doi.org/10.1002/maco.202012064.Suche in Google Scholar
Liu, T., Tan, Y.J., Zee, B., Lin, M., and Aung, N.N. (2006). Novel corrosion experiments using the wire beam electrode. (IV) Studying localised anodic dissolution of aluminium. Corros. Sci. 48: 67–78, https://doi.org/10.1016/j.corsci.2004.11.022.Suche in Google Scholar
Mao, Y., Zhu, Y., Deng, C.M., Sun, S., and Xia, D.H. (2022). Analysis of localized corrosion mechanism of 2024 aluminum alloy at a simulated marine splash zone. Enf. Fail. Anal. 142: 106759, https://doi.org/10.1016/j.engfailanal.2022.106759.Suche in Google Scholar
Melchers, R.E. (2003). Mathematical modelling of the diffusion controlled phase in marine immersion corrosion of mild steel. Corros. Sci. 45: 923–940, https://doi.org/10.1016/s0010-938x(02)00208-1.Suche in Google Scholar
Melchers, R.E. (2014). Long-term immersion corrosion of steels in seawaters with elevated nutrient concentration. Corros. Sci. 81: 110–116, https://doi.org/10.1016/j.corsci.2013.12.009.Suche in Google Scholar
Melchers, R.E., Jeffrey, R.J., and Usher, K.M. (2014). Localized corrosion of steel sheet piling. Corros. Sci. 79: 139–147, https://doi.org/10.1016/j.corsci.2013.10.038.Suche in Google Scholar
Païssé, S., Ghiglione, J.F., Marty, F., Abbas, B., Gueuné, H., Amaya, J.M.S., Muyzer, G., and Quillet, L. (2013). Sulfate-reducing bacteria inhabiting natural corrosion deposits from marine steel structures. Appl. Microbiol. Biot. 97: 7493–7504, https://doi.org/10.1007/s00253-012-4464-7.Suche in Google Scholar PubMed
Pang, L., Wang, Z.B., Zheng, Y.G., Lai, X.M., and Han, X. (2020). On the localised corrosion of carbon steel induced by the in-situ local damage of porous corrosion products. J. Mater. Sci. Technol. 54: 95–104, https://doi.org/10.1016/j.jmst.2020.03.041.Suche in Google Scholar
Pathirana, M., Laleh, M., Somers, A., Hinton, B., and Tan, Y.J. (2023). The critical effect of rust layers on localised corrosion of steel exposed to waterline environments. Corros. Sci. 221: 111333, https://doi.org/10.1016/j.corsci.2023.111333.Suche in Google Scholar
Raman, A., Kuban, B., and Razvan, A. (1991). The application of infrared spectroscopy to the study of atmospheric rust systems. I. Standard spectra and illustrative applications to identify rust phases in natural atmospheric corrosion products. Corros. Sci. 32: 1295–1306, https://doi.org/10.1016/0010-938x(91)90049-u.Suche in Google Scholar
Reddy, B. and Sykes, J.M. (2005). Degradation of organic coatings in a corrosive environment: a study by scanning Kelvin probe and scanning acoustic microscope. Prog. Org. Coat. 52: 280–287, https://doi.org/10.1016/j.porgcoat.2004.04.004.Suche in Google Scholar
Sainis, S., Roșoiu, S., Ghassemali, E., and Zanella, C. (2020). The role of microstructure and cathodic intermetallics in localised deposition mechanism of conversion compounds on Al (Si, Fe, Cu) alloy. Surf. Coat. Tech. 402: 126502, https://doi.org/10.1016/j.surfcoat.2020.126502.Suche in Google Scholar
Tan, Y.J. (1998). Wire beam electrode: a new tool for studying localised corrosion and other heterogeneous electrochemical processes. Corros. Sci. 41: 229–247, https://doi.org/10.1016/s0010-938x(98)00120-6.Suche in Google Scholar
Tan, Y.J. (2005). An experimental comparison of three wire beam electrode based methods for determining corrosion rates and patterns. Corros. Sci. 47: 1653–1665, https://doi.org/10.1016/j.corsci.2004.08.005.Suche in Google Scholar
Tan, Y.J., Bailey, S., and Kinsella, B. (2001a). Mapping non-uniform corrosion using the wire beam electrode method. II. Crevice corrosion and crevice corrosion exemption. Corros. Sci. 43: 1919–1929, https://doi.org/10.1016/s0010-938x(00)00191-8.Suche in Google Scholar
Tan, Y.J., Bailey, S., and Kinsella, B. (2001b). Mapping non-uniform corrosion using the wire beam electrode method. III. Water-line corrosion. Corros. Sci. 43: 1931–1937, https://doi.org/10.1016/s0010-938x(00)00192-x.Suche in Google Scholar
Tomashov, N.D. (1966). The theory of corrosion and protection of metals. Macmillan, New York, NY, USA.Suche in Google Scholar
Vargas, I.T., Alsina, M.A., PasténP, A., and Pizarro, G., E. (2009). Influence of solid corrosion by-products on the consumption of dissolved oxygen in copper pipes. Corros. Sci. 51: 1030–1037, https://doi.org/10.1016/j.corsci.2009.02.014.Suche in Google Scholar
Wall, H. and Wadsö, L. (2013). Corrosion rate measurements in steel sheet pile walls in a marine environment. Mar. Struct. 33: 21–32, https://doi.org/10.1016/j.marstruc.2013.04.006.Suche in Google Scholar
Walsh, M.T., and Sagüés, A.A. (2016). Steel corrosion in submerged concrete structures. Part 1: field observations and corrosion distribution modeling. Corrosion 72: 518-533.10.5006/1945Suche in Google Scholar
Wang, J.S., Tang, X., Li, Y., and Qiu, X.Q. (2016). Observation and micro-electrochemical characterisation for micro-droplets in initial marine atmospheric corrosion. Corros. Eng. Sci. Techn. 51: 308–312, https://doi.org/10.1080/1478422x.2015.1110373.Suche in Google Scholar
Wang, Q.Y., Tan, X.Y., Wu, Y.F., Zhang, X.S., Dong, L.J., Zheng, H.B., Liu, T.Y., Xi, Y.C., Bai, S.L., Zhang, H.L., et al.. (2023). Crevice corrosion behaviour and mechanism of laser additive manufacturing nickel-based alloy by using wire beam electrode. Corros. Eng. Sci. Technol. 58: 431–444, https://doi.org/10.1080/1478422x.2023.2197334.Suche in Google Scholar
Wang, T. and Tan, Y.J. (2006). Understanding electrodeposition of polyaniline coatings for corrosion prevention applications using the wire beam electrode method. Corros. Sci. 48: 2274–2290, https://doi.org/10.1016/j.corsci.2005.07.012.Suche in Google Scholar
Wu, J.J., Wang, P., Gao, J.Y., Tan, F.Q., Zhang, D., Cheng, Y., and Chen, S.Q. (2017). Comparison of water-line corrosion processes in natural and artificial seawater: the role of microbes. Electrochem. Commun. 80: 9–15, https://doi.org/10.1016/j.elecom.2017.05.003.Suche in Google Scholar
Xu, Y. and Tan, M.Y. (2018). Visualising the dynamic processes of flow accelerated corrosion and erosion corrosion using an electrochemically integrated electrode array. Corros. Sci. 139: 438–443, https://doi.org/10.1016/j.corsci.2018.05.032.Suche in Google Scholar
Xue, F., Wei, X., Dong, J.H., Etim, I.I.N., Wang, C.G., and Ke, W. (2018). Effect of residual dissolved oxygen on the corrosion behavior of low carbon steel in 0.1M NaHCO3 solution. J. Mater. Sci. Technol. 34: 1349–1358, https://doi.org/10.1016/j.jmst.2017.11.004.Suche in Google Scholar
Yao, C.Q., Wang, X.R., Zhang, W., Xia, W.T., Chen, Z.W., and Han, B. (2023). Formation of calcareous deposits in the tidal zone and its effect on cathodic protection. npj Mater. Degrad. 7: 30, https://doi.org/10.1038/s41529-023-00340-x.Suche in Google Scholar
Yu, C., Yuan, P., Erickson, E.M., Daly, C.M., Rogers, J.A., and Nuzzo, R.G. (2015). Oxygen reduction reaction induced pH-responsive chemo-mechanical hydrogel actuators. Soft Matter 11: 7953–7959, https://doi.org/10.1039/c5sm01892g.Suche in Google Scholar PubMed
Yu, J.X., Wang, H.K., Yu, Y., Luo, Z., Liu, W.D., and wang, C.M. (2018). Corrosion behavior of X65 pipeline steel: comparison of wet–dry cycle and full immersion. Corros. Sci. 133: 276–287, https://doi.org/10.1016/j.corsci.2018.01.007.Suche in Google Scholar
Yu, X.Y., Xu, Y.Z., Zhu, Y.S., Chang, W., and Huang, Y. (2021). Waterline corrosion behavior based on resistance-multi-electrode measurement. Corros. Protect. 42: 13–18.Suche in Google Scholar
Zhang, Y.Z., Zhang, T.S., Wan, H.H., Li, G.F., and Liu, H.F. (2023). Mechanism of microbiologically induced anaerobic water-line corrosion of 980 high strength steel in nutrient-rich artificial seawater. Corros. Sci. 220: 111268, https://doi.org/10.1016/j.corsci.2023.111268.Suche in Google Scholar
Zhu, Y., Hu, T., Li, Y., Hao, J., Han, B., and Yuan, Q. (2023). Pitting corrosion of 2A12 aluminum alloy long-scale specimen in simulated seawater splash zone, dynamic waterline zone and full immersion zone. Anti Corros. Method. Mat. 70: 101–107, https://doi.org/10.1108/acmm-01-2023-2747.Suche in Google Scholar
Zou, Y., Wang, J., and Zheng, Y.Y. (2011). Electrochemical techniques for determining corrosion rate of rusted steel in seawater. Corros. Sci. 53: 208–216, https://doi.org/10.1016/j.corsci.2010.09.011.Suche in Google Scholar
© 2024 the author(s), published by De Gruyter, Berlin/Boston
This work is licensed under the Creative Commons Attribution 4.0 International License.
Artikel in diesem Heft
- Frontmatter
- Reviews
- A review on the mechanical and biocorrosion behaviour of iron and zinc-based biodegradable materials fabricated using powder metallurgy routes
- Advances in understanding biofilm-based marine microbial corrosion
- Progress of material degradation: metals and polymers in deep-sea environments
- Theoretical and experimental exploration of organic molecules adsorption on iron surfaces for corrosion inhibition: a review
- Original Articles
- Evaluation of surface properties of modified Ti6Al4V alloy with copper nanoparticles organic nanostructure for biomedical applications: dependency on anticorrosive, antibacterial, and biocompatibility
- Comparison of waterline corrosion of a weathering steel in static and dynamic simulated seawater
- Numerical study on characteristics of flow accelerated corrosion in a globe valve under different working conditions