Assessment of reinforced concrete structures in marine environment: a case study
-
Giovanni Loreto
 ,
Matteo Di Benedetti
,
Matteo Di Benedetti

Abstract
This paper presents the results of a series of investigations that were performed on a reinforced concrete bridge structure exposed to marine environment in subtropical weather. Data were obtained by assessing the structural conditions using visual observations, nondestructive evaluations, and laboratory testing in order to define the cause and the level of concrete deterioration due to corrosion. In addition, a probabilistic methodology was used to compute the time of corrosion initiation focusing on reinforced concrete subjected to a similar chloride environment. The initial service life was predicted with a method that employed the use of statistical models of the governing parameters obtained from field data. Results show that this approach could be utilized for assessment of existing and new constructions and/or as a tool for decision-making process during the structural design phase.
1 Introduction
In 2017 the American Society of Civil Engineers depicted the condition and performance of the US infrastructure by releasing the latest version of the Report Card for America’s Infrastructure. According to this report, in the US there are currently over 610,000 bridges that were designed with an average service life of 75 years. While the number of bridges considered being structurally deficient is decreasing (American Society of Civil Engineering, 2017), many bridges are now approaching the end of their design life. In addition, the Federal Highway Administration (FHWA) estimates that over 36,000 bridges are located no further than 15 miles from coastal waters (FHWA, 2015) with approximately 32% of them made of reinforced concrete (RC) systems (National Association of Corrosion Engineers, 2015). In marine structures, corrosion of the reinforcement has been identified as the predominant deterioration mechanism for RC structures, with potential critical repercussions on serviceability and safety (American Concrete Institute, 2000; Bertolini et al., 2000; Winston Revie 2000; Bossio et al., 2017). Concrete damage resulting from corrosion is usually manifested in the form of expansions leading to cracking and eventually spalling of the cover. In addition to the loss of cover, RC members may suffer structural damage because of the loss of bond between steel and concrete and the loss of reinforcement in the cross section, to the extent that structural failure becomes inevitable in certain instances.
Although concrete is the ideal material to protect the steel reinforcement given its high alkalinity, RC marine structures are highly vulnerable to corrosion because of chloride attack, with the severity of the attack being dependent, among other factors, on climatic condition. For example, RC specimens exposed to a marine intertidal zone at Port Hueneme, CA, were observed to have about one third less corrosion compared with companion specimens located in Key West, FL. It is believed that the difference in the rate of corrosion was due to the lower water temperature; 13–18°C is the yearly average water temperature in Port Hueneme, which compares to 26°C as recorded in Key West (Burke, 1994). The aggressiveness of the warm marine environment in Florida generally leads to the premature deterioration of numerous bridges and buildings along the coastline. In fact, it is reported that for conventional RC, a typical Florida marine substructure can exhibit visible signs of corrosion distress in the first 12 years of exposure (Sagüés et al., 1990; Scannel & Sohanghpurwala, 1992; Krauss & Nmai, 1996).
The consequences of corrosion can affect the load-bearing structural capacity in different ways, some of which are still not fully understood. The lack of knowledge is reflected in the nature of the current approaches to assess the residual service life, which are empirical or simply based on engineering experience or intuition (Ahmad, 2003; Frangopol et al., 2004; March & Frangopol, 2008; Otieno et al., 2012; Samindi et al., 2015). This is a vast and controversial topic, and different opinions and models crowd the literature. This paper fits within this context with the specific scope to validate the onsite tests methodology for assessing existing RC bridge conditions and to present a practical method based on current codes of practice and guidelines to estimate the corrosion initiation time of an RC structural member.
2 Background
The performance and service life of RC structures exposed to highly aggressive environments, such as the ones containing high chloride content, can be idealized by a modified version of Tuutti’s (1982) model. In looking at service life performance, a failure criterion based on serviceability requirements needs to be defined. In order to define such criterion, the first step is to characterize the service life behavior of RC structures, which can be divided into two phases as schematically diagrammed in Figure 1.
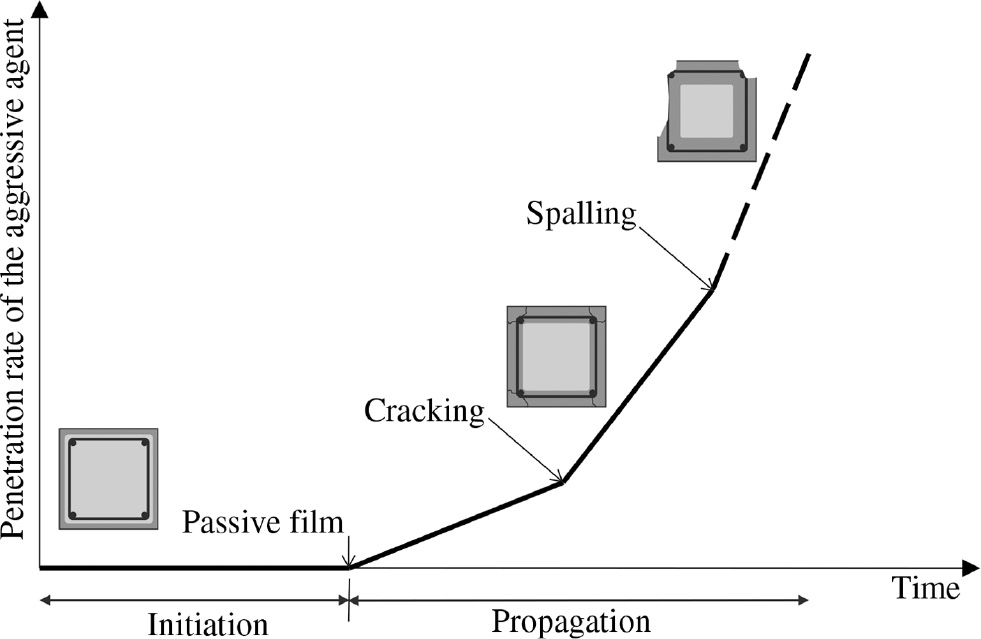
Corrosion initiation and propagation phases in the RC structure (Tuutti’s model).
The first phase consists of the corrosion initiation that coincides with the breakage of the thin protective film of hydrated iron oxides (passive film) on the surface of the steel reinforcement. This phase mostly depends on three elements: (i) the cover depth of the RC section, (ii) the penetration rate of the aggressive agent, and (iii) the concentration necessary to depassivate the internal steel reinforcement (Elsener, 2001). The influence of the concrete cover is well documented, and design codes define cover depths according to the expected environmental class (Eurocode 2). The rate of ingress of the agents as well as the critical concentration depends on the quality of the concrete cover (i.e. porosity and permeability) and on the microclimatic conditions (wetting and drying) at the concrete surface.
The second phase, or propagation phase (Figure 1), is considered the time to move from the onset of corrosion to a critical damage level. This level can be variously defined and in its broader description is assumed to be the limit state of a structure in terms of serviceability that still meets structural requirements (e.g. cracking, delamination, spalling, or accumulated superficial damages). Research has shown that although at early stages of cracks propagation, many cracks can appear; ultimately a single crack that breaks the cover can be detected at a location where the generated stress exceeds the strength of concrete. When this crack appears, the internal stresses relax halting the propagation of other internal cracks [Atkinson & Droffelaar, 1982; Bardal et al., 1993; American Society of Testing and Materials (ASTM, 2000) G46].
In order to assess the residual service life, both the initiation and propagation phases have to be calculated. Several formulae and models have been proposed to estimate the time at which a detectable crack in the concrete cover caused by the reinforcement corrosion appears (Vu & Stewart, 2000; Kessler et al., 2005; Shi et al., 2012; Helland, 2013; Papakonstantinou & Shinozuka, 2013; Yu et al., 2014; Faroz et al., 2016; Jasniok, 2017). In general, methodologies for serviceability design can be divided into the two following groups: (a) First are the prescriptive methods that are based on knowledge obtained by investigating performances of existing structures. They are usually characterized by minimal or no mathematical deterioration modeling and are considered simplistic models with the lowest level of reliability [i.e. American Association of State Highway and Transportation Officials (AASHTO) Load and Resistance Factor Design]. (b) Second are the probabilistic methods that are based on mathematical models to describe the observed physical deterioration behavior [i.e. Fédération internationale du béton (fib) Bulletin 34 Model Code for Service Life Design (fib, 2006); fib Model Code for Concrete Structures (fib, 2010); International Organization for Standardization (ISO) 16204 Service Life Design of Concrete Structures (ISO, 2012)]. These models use many variables that can be grouped into two families: environmental exposure actions (demands) and material resistances (capacities). Variables are represented using mean values and distribution functions. In addition, residual performance is evaluated through probabilistic methods (i.e. Monte Carlo simulations). These methods are highly reliable, but experimental data used to fit the models are generally difficult to gather and require extensive computation.
In this paper, a third option to predict the corrosion initiation on RC structure is proposed. The prediction is based on a durability model currently available in literature (fib Bulletin 34) and uses data representative of service conditions obtained during field investigations. This approach can be considered as semi-probabilistic where governing parameters obtained from field data are represented as statistical values and a probabilistic mechanistic model is used to generate the distribution of the time to corrosion initiation.
3 Procedure analysis
The evaluation of deteriorating structures is generally composed of the following steps: (a) inspection; (b) diagnosis; (c) prognosis, which determines the urgency of intervention; (d) repairing options; and (e) maintenance and surveillance regime. Steps (a) and (b) can be performed with sufficient accuracy at the material level using onsite analysis and instrumentation spanning from nondestructive tests (i.e. cover analysis, concrete resistivity, corrosion mapping, and acoustic emission) to semidestructive tests (i.e. core extraction and laboratory test procedures). Obtained data are used to draw a damage classification map of the structure and to assess the deterioration level. From this damage map, intervention urgency or risk levels are established in order to further decide the optimal time and repair option along with the monitoring regimes. These levels of urgency may differ from structure to structure or adapt based on owner’s requirements (Pedeferri & Bertolini, 2000).
This procedure for evaluation of structures was applied in the condition assessment of a bridge located in Boca Chica Road in Monroe County, FL, following the three steps discussed here below:
Visual survey: this helped to identify the areas that exhibited obvious signs of concrete deterioration. The observations were summarized in maps highlighting concrete cracking, delamination, spalling, and steel reinforcement corrosion. These maps were also used to identify chloride exposure, such as columns in the tidal zone, girder ends in proximity of expansion joints, deck areas near drains, and drain scuppers.
Onsite testing: this was conducted to quantify the level of deterioration in specific locations. Such testing aimed at evaluating the concrete cover, the concrete resistivity, the corrosion potential, and the corrosion rate.
Laboratory testing: this was conducted to gain more in depth information on the deteriorated materials extracted from the structure. These tests relied on samples taken at different locations, and the results were used in the predictive model of corrosion initiation. The tests had the objective to evaluate the concrete compressive strength and the chloride content.
4 Structure overview
The Geiger Creek Bridge (structure no. 904110) is a 40 m [130 ft.] long RC bridge that was constructed in 1955. The bridge is part of a series of infrastructures built during the 1950s and 1960s to connect islands in the Florida Keys archipelago. The bridge was designed as five simply supported spans with each of those spanning approximately 7.6 m [25 ft.]. Structural elements such as girders and beams were precast and assembled on site and completed with a cast-in-place RC deck. A total of 24 columns support the horizontal structures of the bridge with variable heights between 2.5 and 6 m [8–20 ft.] and a tidal zone located between 1.2 [4 ft.] and 2.4 m [8 ft.] from the bottom of the concrete deck depending on the time of the year. Figure 2A and B show the bridge from the north side and its cast-in-place concrete deck, respectively. Similar construction techniques and materials were used for all the bridges located in the same area, making the Geiger Bridge an important case study for providing data on RC bridge structures subjected to natural aging in subtropical monsoon climate. However, it is important to clarify that this type of investigation is usually subjected to some difficulties because of the presence of many unknown variables that can vary from information on the actual material used during construction, to changes that occurred because of previous interventions, and/or to changes that occurred in materials through time because of environmental factors. These difficulties were taken into account during the inspection. For instance, while it was known that the concrete mixture information used in the bridge contained Type II Portland cement, a water/binder ratio of 0.4 with a specified 28 day compressive strength of 35 MPa (5000 psi; Table 1), limited documentation of the reinforcement configuration was available, and it was therefore derived during the site investigation.
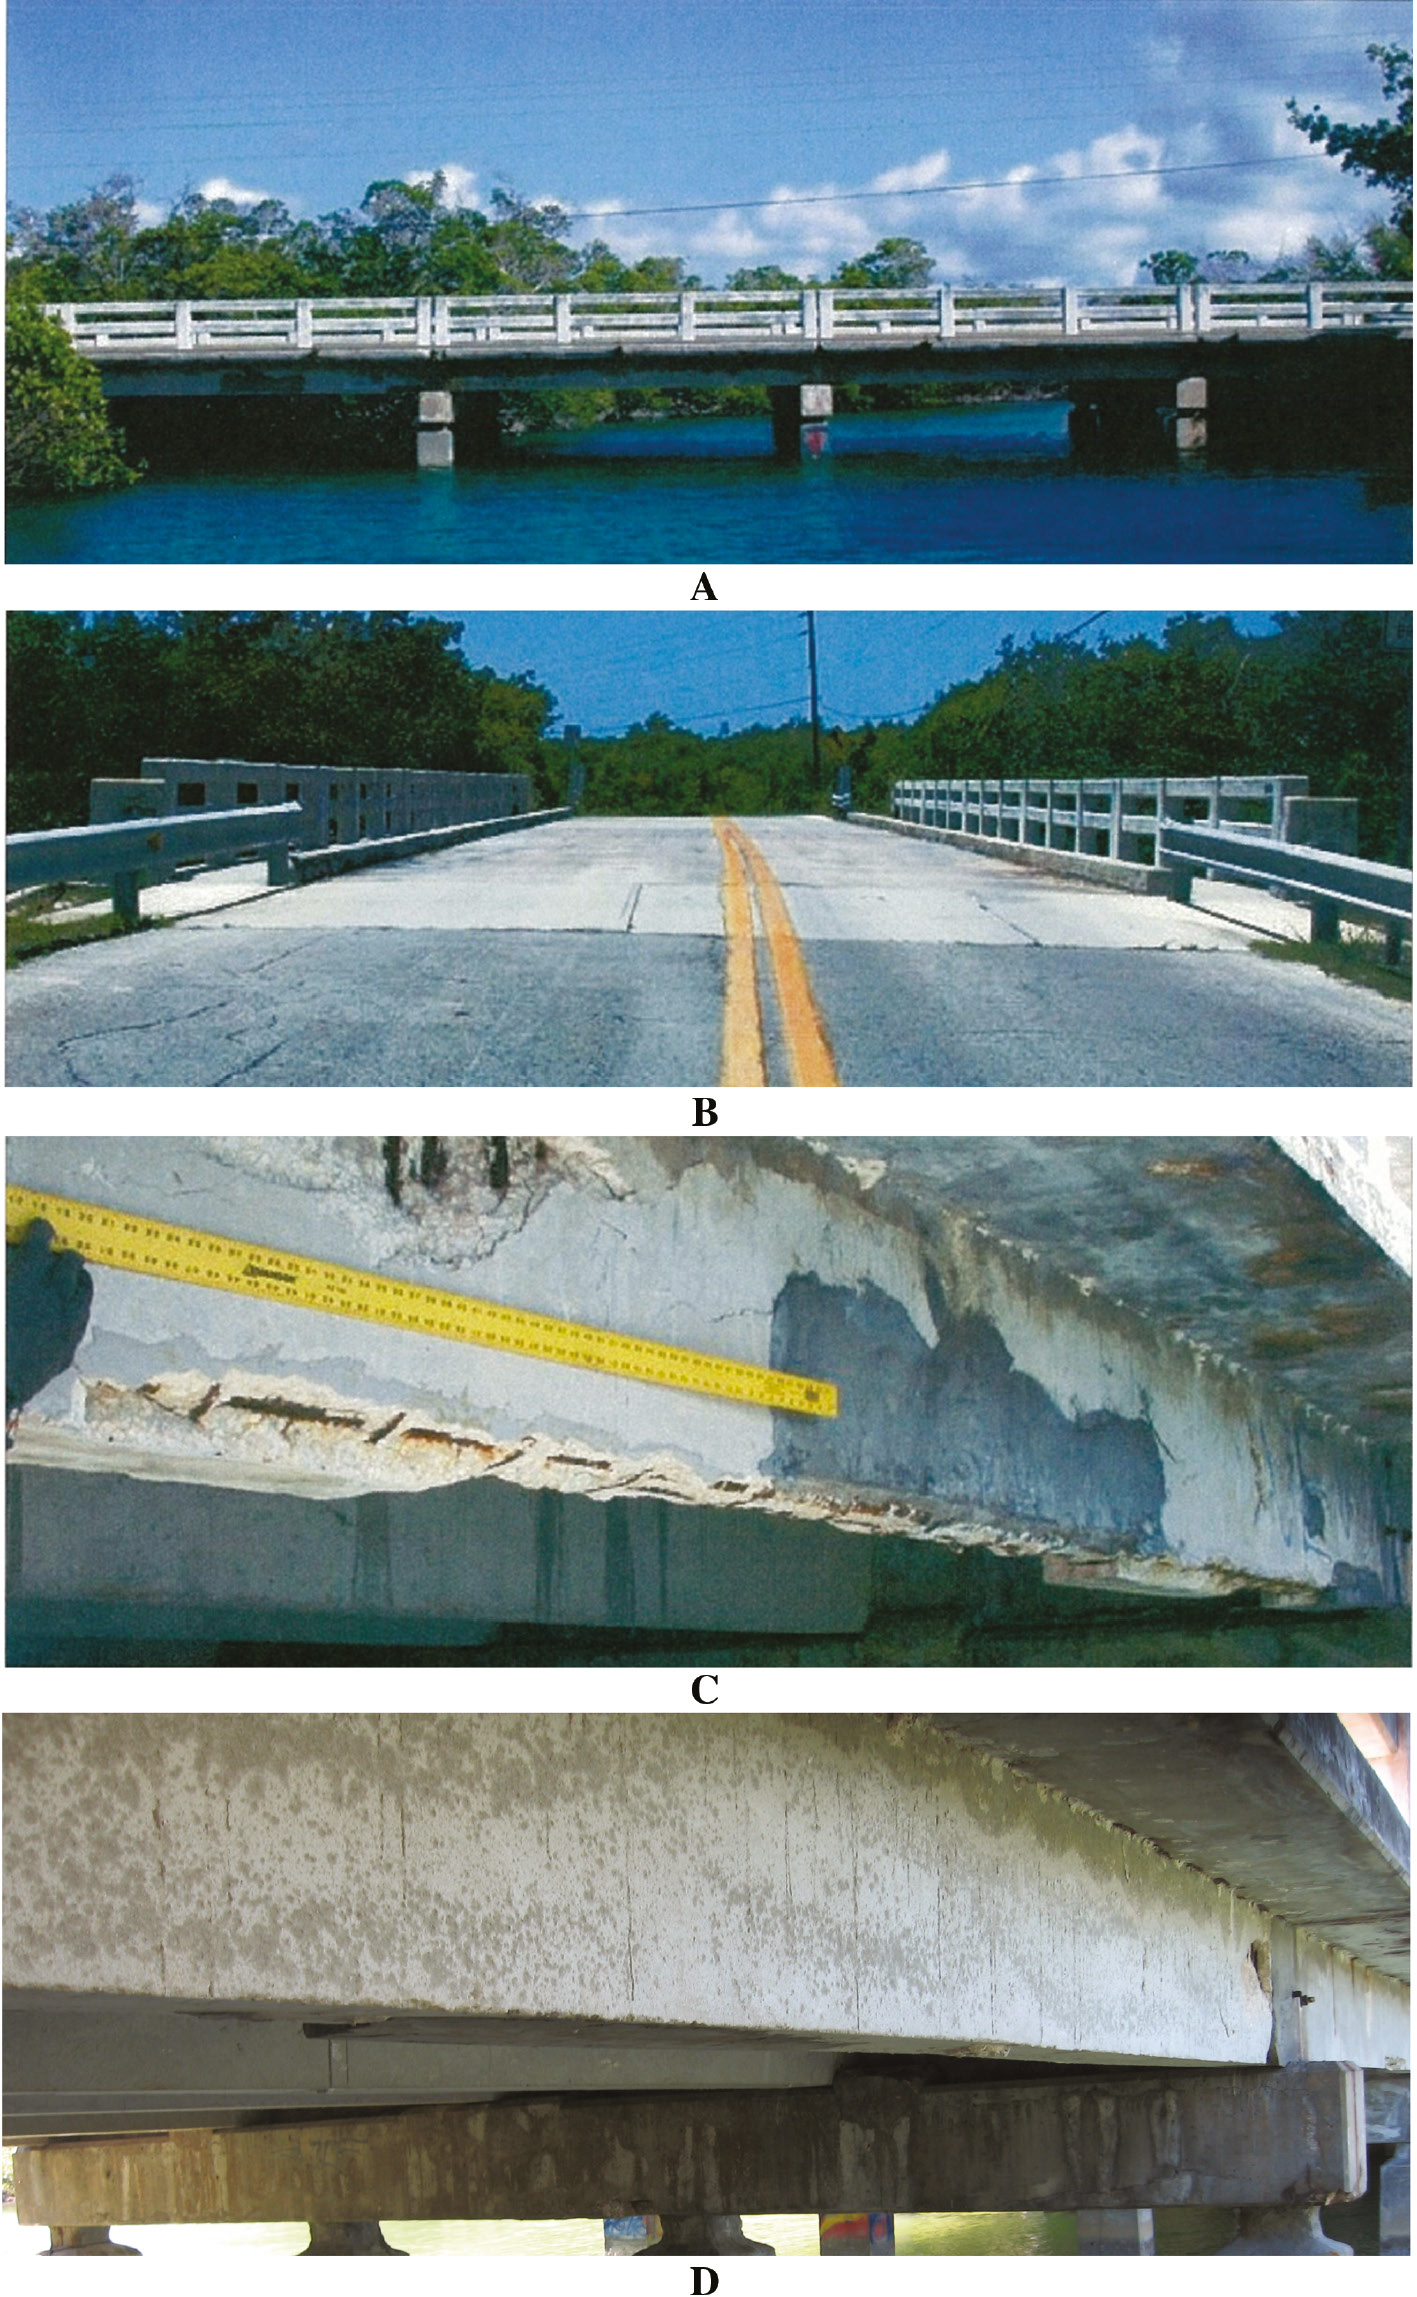
Geiger bridge. (A) Overview of the north profile; (B) west approach; (C) south beam face, spall/delamination; and (D) north beam.
Concrete mix design.
| Material | Quantity |
|---|---|
| Cement, type II | 385 kg/m3 |
| Fine aggregate | 500 kg/m3 |
| Coarse aggregate | 950 kg/m3 |
| Water | 205 l/m3 |
| Water-binder ratio | 0.4 |
| Slump | S4 |
-
1 mm=0.039 in.; 1 MPa=145 psi; 1 kg/m3=1.68 lb/yd3; 1 l/m3=0.20 gal/yd3.
5 Visual inspection
A visual inspection was performed in order to provide an initial assessment of the structural elements and was used to make decisions for further investigations. Pile caps, beams, and girders were visually surveyed, and the elements were classified based on the rust staining, cracking, and spalling present on the surface. Depending on the extent of deterioration, tapping with a hammer was also used to determine the presence and, to a degree, the extent of possible delamination. During this phase, it was observed that the orientation of the bridge in respect to the river had some influence in the aging of the bridge. In particular, beams and girders located on the south area of the bridge were found more deteriorated when compared with the ones on the opposite side (Figure 2C and D). Spalling of concrete cover was present on the underside of portions of the concrete deck, beams, and girders. A more accurate inspection of those members revealed the presence of extensive deterioration including possible corrosion of reinforcements. Many leakage paths had developed in the deck through which salt-laden water penetrated and ran down the faces of the main beams. On the opposite side, no visual deterioration was detected in the columns.
Starting from this inspection, the analysis narrowed on structural elements that showed opposite levels of damages. In particular, two concrete decks (D1 and D2), two girders from the north side (B1 and B2), four external beams from the south side (B3, B4, B5, and B6), two girders (G1 and G2) and six columns (C1, C2, C3, C4, C5, and C6) were investigated. The selection was made among elements that showed different levels of deterioration and based on elements that were scheduled for maintenance and/or replacement. The location of each element is highlighted in red in Figure 3.
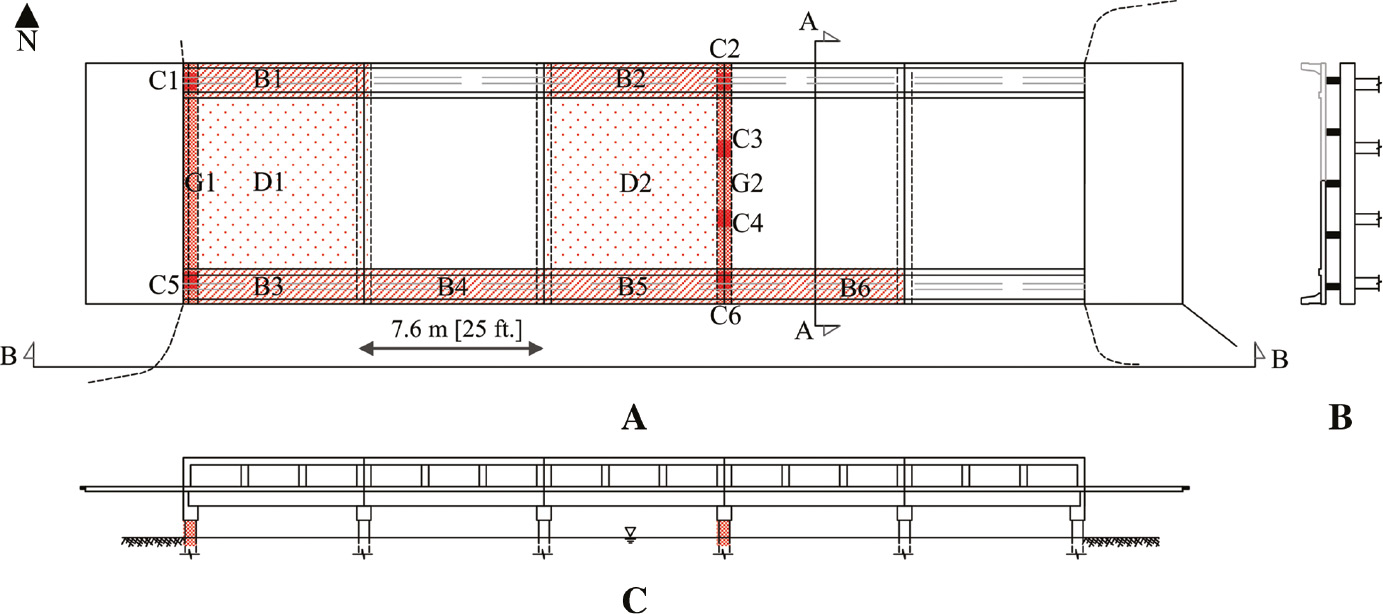
Geiger bridge diagrams. (A) Plan view (B=beam, C=column, D=deck, G=Geiger); (B) section AA, and (C) section BB.
6 Onsite investigations
6.1 Concrete cover
A pachometer testing equipment was used to determine the concrete cover, to locate existing reinforcements, and to estimate their size (i.e. diameter). These were important measurements as the thicker the concrete cover, the longer it would take for the chloride ions to penetrate to the level of the reinforcing steel, therefore increasing the time to the onset of corrosion. In addition, as a result of these measurements, a grid showing the location of the steel reinforcement was generated in order to minimize the error when using electrochemical measurements. These measurements are generally known to be affected by the presence of nearby rebars and cracks.
6.2 Surface resistivity
Surface resistivity was measured using a four-point Wenner probe following the provisional test method reported in the AASHTO T 358-17 (AASHTO, 2017). This test method has been accepted for use by Louisiana and Florida DOTs and addresses several of the concerns regarding probe spacing and sample geometry. In particular, it specifies the use of an electrode spacing of 40 mm [1.5 in.] with an AC frequency of 13 Hz. A total of eight readings were taken per location or specimen. Table 2 shows the numerical correlation of surface resistivity for the differing chloride ion permeability groupings and sample geometries (Kessler et al., 2005; AASHTO, 2017). The term semi-infinite slab in Table 2 indicates that the sample was nominally flat, like the bridge deck tested in the field, instead of cylindrical as the samples tested in the laboratory.
Correlation of surface resistivity with chloride ion penetrability.
| Chloride ion penetrability | Surface resistivity test | ||
|---|---|---|---|
| 100 mm×200 mm (4 in.×8 in.) (kΩ cm), a=40 [1.5] | 150 mm×300 mm (6 in.×12 in.) (kΩ cm), a=40 [1.5] | Semi-infinite slab | |
| High | <12 | <9.5 | <6.7 |
| Moderate | 12–21 | 9.5–16.5 | 6.7–11.7 |
| Low | 21–37 | 16.5–29 | 11.7–20.6 |
| Very low | 37–254 | 29–199 | 20.6–141.1 |
| Negligible | >254 | >199 | >141.1 |
-
a is the Wenner probe spacing, in mm [in.].
6.3 Half-cell corrosion potentials
The half-cell corrosion potential, Ecorr, was measured as the difference in potential (i.e. voltage) between the rebar and a reference electrode (half-cell). The corrosion probability was estimated in accordance with ASTM C876 (ASTM, 2015) standard where the numerical value of the measured potential difference between the steel in concrete and the reference electrode depended on the type of reference electrode used. The reference electrode used in this test was a copper/copper sulfate, and the classification criteria are reported in Table 3.
Ranges of half-cell corrosion potential related to the corrosion probability.
| Corrosion potential (Ecorr; mV vs. copper/copper sulfate) | Corrosion probability |
|---|---|
| ≤−350 mV | 90% |
| (−350 mV) to (−200 mV) | Uncertain |
| >−200 mV | 10% |
6.4 Corrosion rate
Estimation of the corrosion rate was obtained through galvanostatic linear polarization technique, which was performed using an advanced rebar corrosion rate determination system (Gecor). Results were interpreted using the criteria developed by Andrade and Alonso (2004), allowing the conversion of the measured corrosion rate into μA/cm2 (Table 4).
Corrosion rate related to corrosion level.
| Icorr (μA/cm2) | Vcorr (mm/year) | Corrosion level |
|---|---|---|
| ≤0.1 | ≤0.001 | Negligible |
| 0.1–0.5 | 0.001–0.005 | Low |
| 0.5–1.0 | 0.005–0.010 | Moderate |
| >1.0 | >0.010 | High |
7 Laboratory tests
The compressive strength and chloride content were determined by the removal of 26 cores at different locations of decks (D1 and D2), beams (B1–B6), and columns (C2 and C6). In particular, sample areas were chosen among those elements that were scheduled for maintenance and/or replacement in the near future. Cores were drilled perpendicular to the surface and sufficiently apart from joints or edges. After drilling, specimens were placed in separate plastic bags to prevent moisture loss. When possible, in addition to compressive strength and chloride content, surface resistivity of the cores was measured in order to compare these values with the ones obtained directly from field analysis. The depth of carbonation was also investigated through the use of a phenolphthalein solution as per RILEM (2018).
7.1 Compressive strength
Compression tests were conducted as per ASTM C39 (ASTM, 2012a,b) and within 7 days from obtaining the cores. Specimens were 94 mm [3.70 in.] in diameter and 205 mm [8.14 in.] in length with their ends sawn to obtain a flat surface perpendicular to the longitudinal axis. Lengths were measured to the nearest 2 mm [0.1 in.], and values were used to compute the length-diameter (L/D) ratio, which was kept between 1.9 and 2.1. Specimens were loaded linearly using a rate of 0.25±0.05 MPa/s [35±7 psi/s] till failure.
7.2 Chloride content
In marine environments, reinforcement corrosion is directly related to the chloride content in the concrete around the steel surface. This value is recommended to be not greater than 0.4% in relation to the cement mass for RC structures (Bertolini et al., 2000). Chloride content was determined as per ASTM C1152 (ASTM, 2012a,b). For this test, specimens were carefully drilled with a length of approximately 20 mm [0.8 in.] in beams and deck and 50 mm [2.00 in.] in columns. Concrete cores were cut longitudinally to provide thick sections representative of the core.
8 Results and discussion
Figures 4–9 summarize the results of compression strength, resistivity, chloride content, half-cell potential, and corrosion rate.
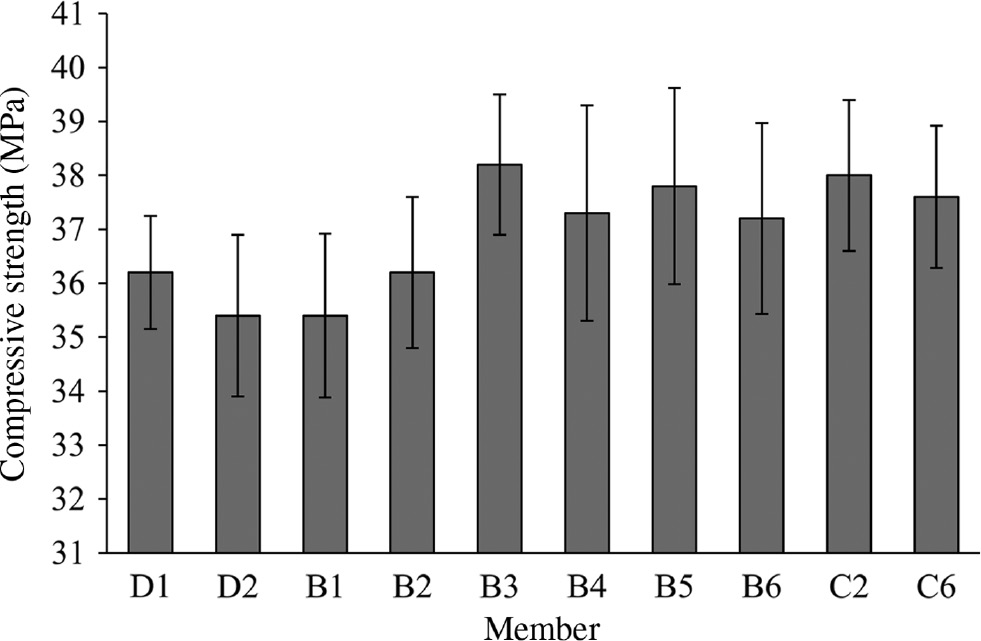
Compression strength.
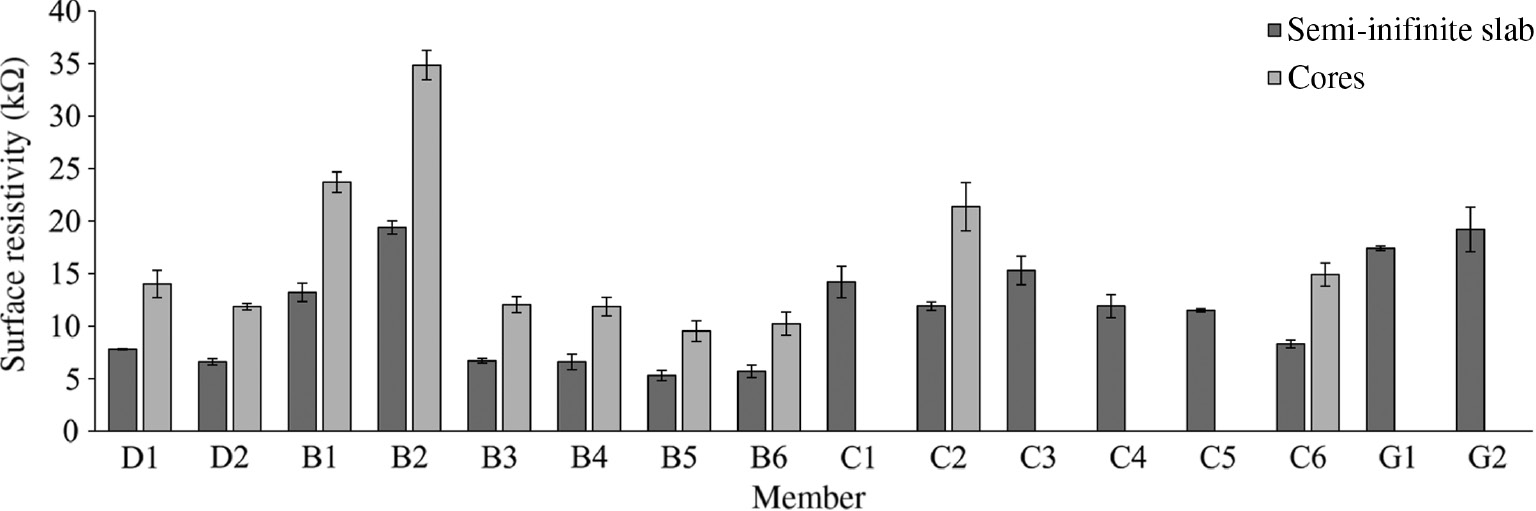
Surface resistivity.
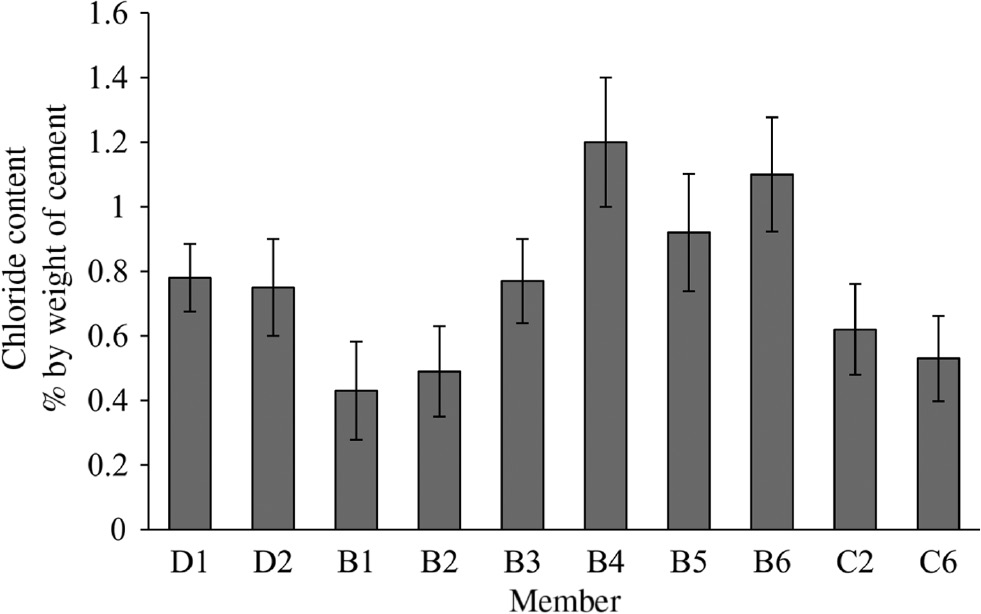
Chloride content.

Half-cell potential.
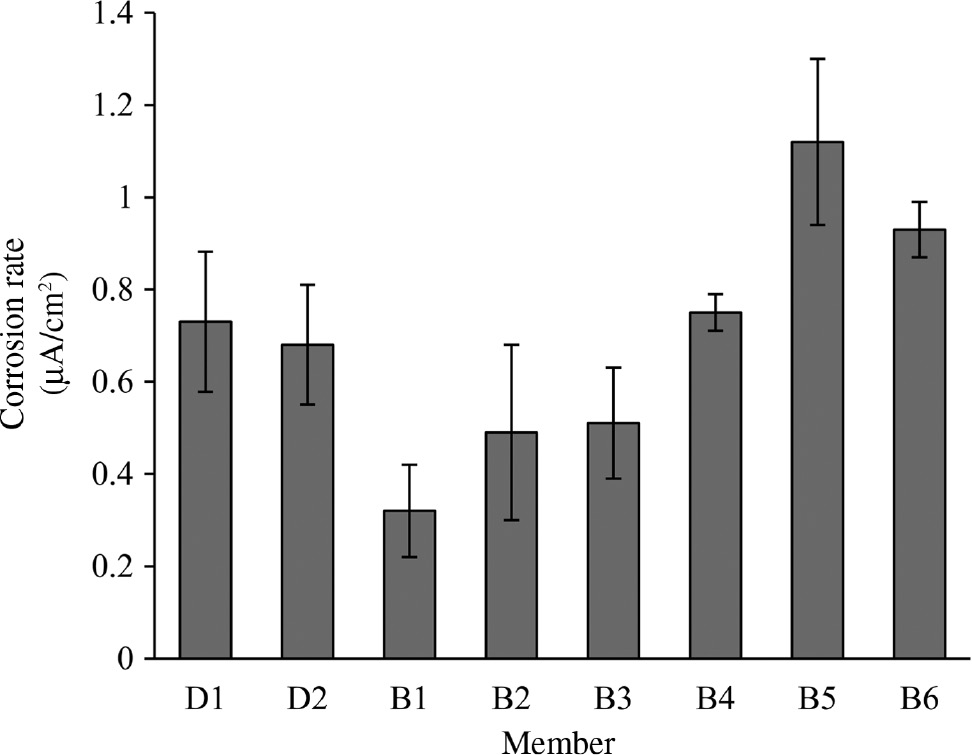
Corrosion rate.
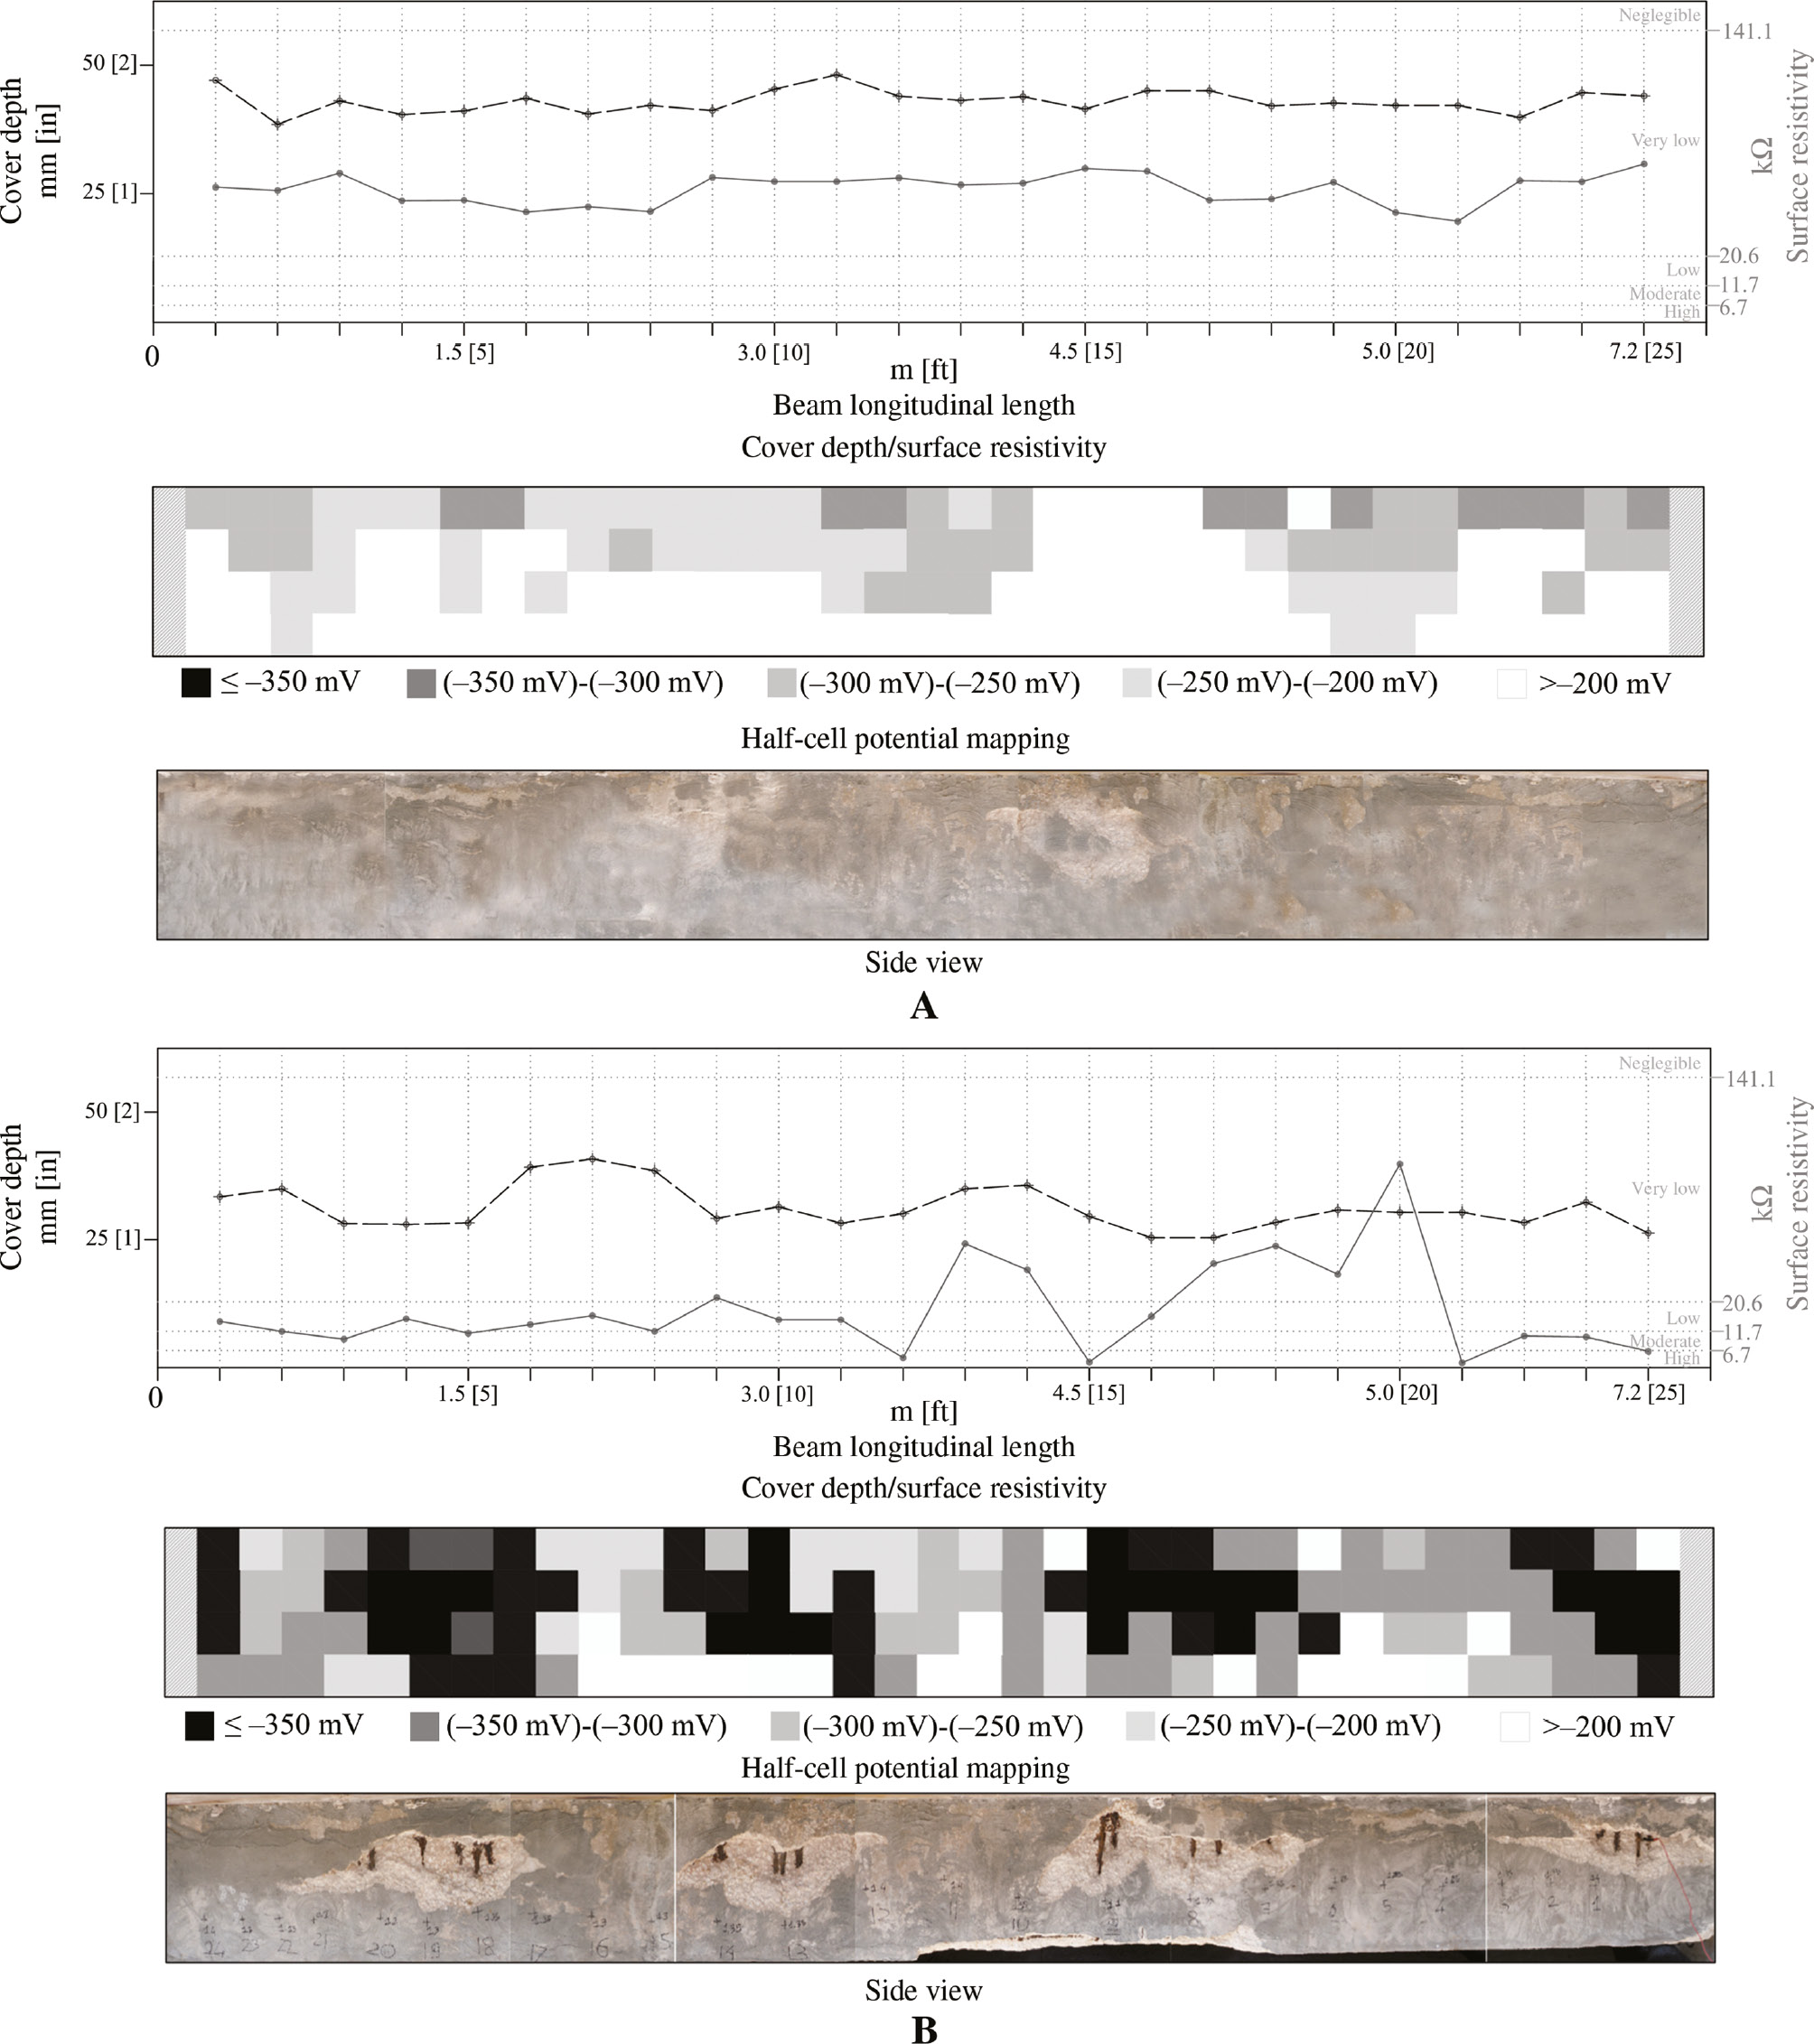
Cover depth, surface resistivity, half-cell potentials, and visual inspection. (A) Beam B2 (north) and (B) Beam B5 (south).
The first consideration is about the concrete cover depth where values ranged between 20 [1 in.] and 50 mm [2 in.] depending on the structural elements with an overall standard deviation of 3.5 mm [0.15 in.] calculated for measurements grouped by member. In addition to the concrete cover, the internal steel reinforcements, both longitudinal and transversal, were characterized in terms of size and location. In particular, for beams and girders measurement points for surface resistivity, half-cell potential and corrosion rate were placed approximately 300 mm [11.8 ft.] apart.
Compression strength results are reported in Figure 4 along with their standard deviations. The average compressive strength was found to be consistently in the range between 35.4 (5130 psi) and 38.2 MPa (5540 psi). Before being tested, concrete cores where used to determine the carbonation depth, which was obtained by spraying phenolphthalein solution. The values were found in a range between 9 (0.35 in.) and 20 (0.79 in.); therefore, it was assumed that carbonation had negligible influence in the corrosion phenomena. In addition, given the almost constant values of the compressive strength, this was not considered to be a variable that could explain the differences in deterioration observed in different parts of the structure. Further analysis focused on environmental factors to justify the different performances of the RC members.
As reported in Figure 5, the surface resistivity measurements varied widely on beams and girders. Some of the values were in the range from 6.7 to 11.7 kΩ cm, which indicate moderate to high chloride ion penetrability, whereas other values ranged between 21.3 and 34.1 kΩ cm, which indicate low penetrability. The advantage of employing surface resistivity tests was that they were easy and fast to run with a relatively low coefficient of variation ranging from 0.8% to 11.2% with an average of 4.2%. According to the AASHTO T 358-17, two beams (B1 and B2) and four columns (C1, C2, C3, and C4) were classified as low penetrability; one deck (D1), two girders (G1 and G2), and two columns (C5 and C6) as moderate penetrability, and the remaining elements as high penetrability. By looking at the data reported in Figure 5, the average values for columns C4 and C5 are similar; however, C4 was classified as low penetrability because of its proximity to columns C1, C2, and C3 and because of the trend of the overall data collected.
The surface resistivity tests were also performed on concrete cores collected from the aforementioned locations. Although the results were slightly larger when compared with the resistivity monitored onsite, the general trends between the two tests were similar (Figure 5). However, no attempt was made in the correlation of the resistivity values obtained from the on-site and core investigations as this was considered outside the scope of the paper.
The results of chloride content (Figure 6) were found in accordance with the data from half-cell corrosion potential and corrosion rate tests (Figures 7 and 8). The numerical criteria recommended in ASTM C876 (ASTM, 2015) reported in Table 3 were used to assess the corrosion risk of steel in concrete. In all the beams, lower values of cover depth and resistivity corresponded to more negative values of the half-cell potential and, thus, to higher values of corrosion rate. From Figure 7, it is clear that B1 and B2 had more positive half-cell corrosion potential (framed as a low corrosion probability) than B3, B4, B5, and B6. Corrosion rate readings available for some of the beams showed a similar trend (Figure 8). Looking at the decks, the orientation did not seem to significantly influence the chloride penetration as both D1 and D2 presented similar chloride contents, as shown in Figure 6.
The data seem to suggest that the orientation of the bridge played a major role in the durability of the different structural elements, to the point that the wet-dry cycles seemed of secondary importance. Figure 9 gives a further analysis of this trend by comparing the results of the two opposite beams B2 and B5. In this figure, the results of half-cell potential mapping are given in the form of grey scale map that indicates the probability of corrosion in the reinforcements. The three colors white, gray, and black correspond to a probability of corrosion lower than 10%, uncertain and higher than 90%, respectively. In addition, cover measurements and resistivity are also plotted for comparison. It appears evident that the measured values of the half-cell potential on the south side were more negative than those on the north side, once again confirming the predominant effect of the bridge orientation over other possible factors.
In asserting such a behavior, it seems important to clarify that these findings are specific for the natural and environmental conditions in which the bridge is located. It is also important to consider that data generated from inspections in real structures are highly affected by limited sampling.
One final consideration can be drawn by looking at the results on the chloride content evaluated in columns and beams (Figure 6). Comparing the results between C6 and B5, the chloride content in the beam was higher than in the column. This behavior could be traced to the actual level of the tidal zone, which is around 1.2 m [4 ft.] from the bottom of the concrete deck, in close proximity to the horizontal structural elements. In this area, water splashing occurs originating from wetting and drying cycles, which, in turn, facilitate the ingress of chloride ions and create a more aggressive microclimate condition from the rest of the structure. The increase of the chloride content from the north side to the south side of the bridge correlated with the hypothesis that the bridge orientation influenced the damage level.
9 Serviceability assessment
A probabilistic analysis was performed to assess the time to corrosion initiation in a typical RC girder of a bridge subjected to the same environmental conditions as the Geiger bridge. The time to corrosion initiation was evaluated using the data collected at the site, the guidance provided by fib Bulletin 34 (fib, 2006), and available literature. All of the parameters included in the theoretical analysis are treated as lognormal stochastic variables. Mean and standard deviation values are assigned to them based on available research. A reliability factor for corrosion initiation is computed as a function of the time. A summary of the analysis is provided as follows.
The limit state equation for the depassivation of the steel reinforcement in a concrete member can be expressed as follows:
In this equation, Cch_active is the active chloride content at the reinforcing bar level and Cch_critical is the critical chloride content at the bar level beyond which corrosion initiates. The active chloride content can be estimated using equation B2.1-1 of fib Bulletin 34 (fib, 2006) as a function of the time t. Chlorides are transported through the concrete thickness by means of a combination of several phenomena, including diffusion, capillarity suction, permeation, and migration. Studies have shown that the chloride transport mechanism can be well approximated by the solution of Fick’s second law of diffusion under the assumption that the concrete does not initially contain chlorides, that the concentration of the diffusing chlorides, as measured at the concrete surface, is constant over time, and that the concrete coefficient of diffusion is constant over time (Zhang, 2010). The fib equation is an improvement of the diffusion model and is reported here:
In the equation, C0 is the initial chloride content at the concrete surface measured in percent weight for cement content (wt.%/c), Cs,Δx is the chloride content at a depth Δx and a certain point of time (measured in wt.%/c), x is the depth with a corresponding content of chlorides (mm), a is the concrete cover (mm), Δx is the depth of the convection zone (mm), and Dapp,C is the apparent coefficient of chloride diffusion through the concrete (mm2/years). The critical chloride content at the bar level is taken from the data collected at the site. All of the parameters and relative mean and standard deviation values are taken from the values recommended by the fib Bulletin 34.
To determine the mean and the standard deviation values of the active critical chloride content at the bar level, a sensitivity study is required. The first-order Taylor expansion of the active chloride content function about the mean values of the five variables in equation (2) above is considered and can be written as follows:
where μ−Cch_active is the mean value of the active chloride content as a function of the time, μ−Xi is the mean value of the ith variable in equation (2), and δCch_active is the partial derivative of Cch_active with respect of the ith variable in equation (2). A sensitivity factor for each variable Xi is defined by the value of the partial derivative of Cch_active with respect to the ith variable obtained when the mean value is assigned to all variables.
The mean value of the active chloride content is equal to Cch_active. The coefficient of variation of the active chloride content can be computed as follows:
where σ−Xi is the standard deviation value of the ith variable.
The failure condition for the limit state of depassivation of the steel reinforcement is achieved when the active chloride content at the bar level reaches the critical value. The time that it takes to reach the theoretical failure is defined as the time to corrosion initiation. A statistical analysis allows to determine the probability of failure over time, Pr[F1(t)=0]. With the probability of failure, a reliability factor, β, at each time step is computed. The reliability factor is defined as the inverse standard normal distribution function of the probability of failure. β can be computed as a function of the time as follows:
where μ−Cch_active(t) and V−Cch_active(t) are mean and coefficient of variation of the average value of the active critical chloride content at the bar level (the load), respectively, while μ−Cch_critical(t) and V−Cch_critical(t) are the mean and coefficient of variation of the critical chloride content (the resistance), respectively.
Figure 10 shows that the average time to corrosion initiation is approximately 35 years. For ultimate limit states, a reliability factor ranging between 3 and 5 is generally required, but for service limit states, lower reliability is acceptable as fib Bulletin 34 (fib, 2006) suggests a reliability factor of 1.3 for corrosion initiation. For this target reliability, the time to corrosion initiation is approximately 17 years. From this point of view, two considerations can be drawn.
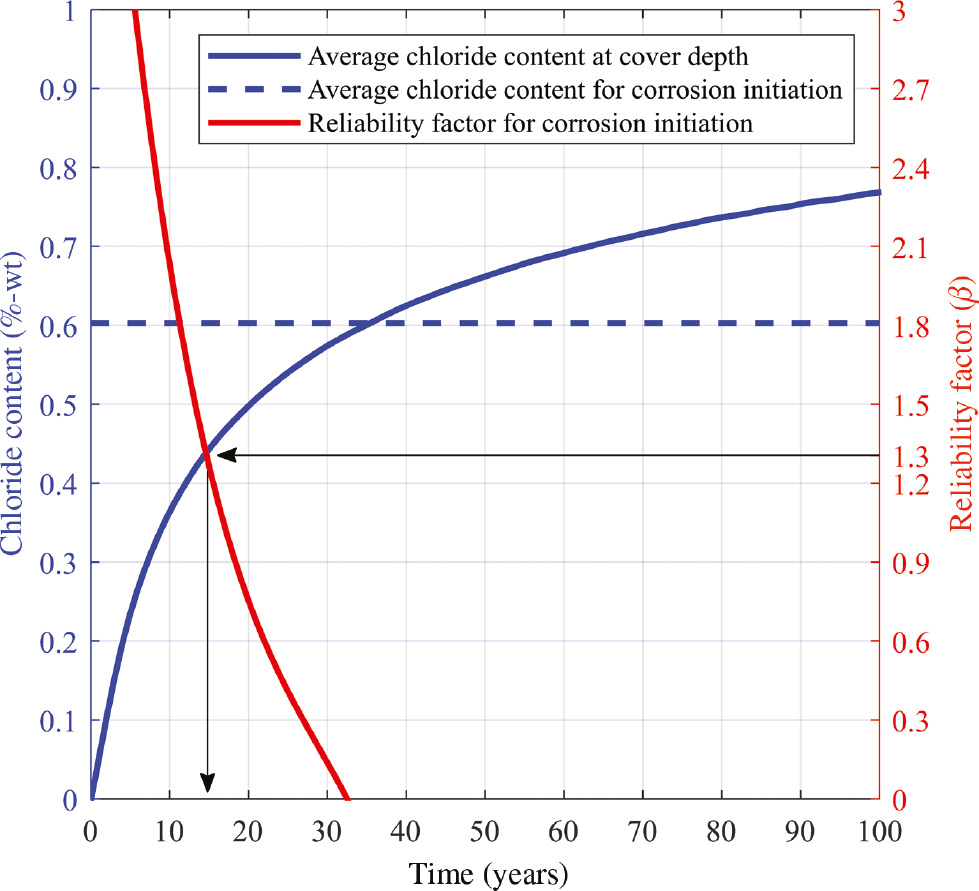
Time to corrosion initiation.
If we look at the physical phenomenon (blue curve), the average time to corrosion initiation is approximately 35 years, but looking at the reliability analysis, the probability (red curve) that the phenomenon would happen (β=1.3) is approximately 17 years. In other words, this means that the conventional RC structures that are exposed to the same chloride-rich environment as the Geiger Bridge are subjected to a high risk of corrosion initiation early on during their service life. The second one is that the reliability factor depends on the chloride content as well as other parameters such as environmental conditions and material properties of the RC member. Looking at the service limit, this becomes important because by changing the type of internal reinforcement materials, a higher reliability factor can be used. For example, by changing regular carbon steel rebars with other types of rebars, such as galvanized, stainless steel, or glass-fiber-reinforced-polymer rebars, it can be possible to increase the time to corrosion initiation and, therefore, improve overall durability.
10 Conclusions
The study conducted on the Geiger Bridge provided interesting information on the mechanism of contamination of RC structures in a marine environment. As expected, the effect of chloride-ion content was relevant in the areas where wet-dry cycles occurred. In these areas, the chloride ions present in the air and deposited on the structural member surface were transported inside the concrete through rainwater. Usually, the rate of contamination depends on concrete properties like capillarity absorption and/or diffusion. In addition, this study seems to suggest that the deterioration of the structural members depended mainly on the exposure conditions, making wet-dry cycles seem secondary in comparison to the bridge orientation. In other words, this study suggests that if parameters like concrete mixture and materials, cover thickness, and chloride content in the environment are constant, the microclimatic conditions seemed to be the predominant factor affecting member durability. It is understood that this finding was specific for the Geiger bridge and that microclimatic data are unlikely available at the moment of design. However, this observation generates questions for consideration in new studies.
In addition, when inspecting structures in situ, data collection is highly affected by limited sampling. Among many tests that were used in this study to assess the structural condition of the bridge, the surface resistivity measurements provided good results in line with other measures obtained with more complex tests. This is pointed out because surface resistivity was a relatively easy and fast test to perform with results affected by relatively low coefficient of variation. Specification is available to perform surface resistivity test in the laboratory, and in this study, measurements between onsite and laboratory show similar trends. However, no attempt was made to correlate the measurements as this was considered outside the scope of the project.
Finally, a serviceability assessment was performed in RC elements subjected to chloride environment. The computation of the time to corrosion initiation was predicted with a semiprobabilistic method using statistical models of the governing parameters obtained from field data. It is recognized that variations in the exposure condition can be the important reason that leads service-life models to unsatisfactory predictions. However, the results show that this approach can be utilized for the assessment of existing and new construction. The idea is that unlike environmental factors that cannot be controlled, variables like material properties can be specified in the design phase. Consequentially, the selection of a specific material can directly impact the corrosion initiation, prolonging the initiation phase and overall the structure service life. This method can be used as an additional tool for designers when informative decisions for time-cost analysis need to be made.
References
Ahmad S. Reinforced corrosion in concrete structures, its monitoring and service life prediction – a review. Cem Concr Compos 2003; 25: 459–471.10.1016/S0958-9465(02)00086-0Search in Google Scholar
American Association of State Highway and Transportation Officials (AASHTO). AASHTO T 358-17. Standard method of test for surface resistivity indication of concrete’s ability to resist chloride ion penetration, Washington, DC: AASHTO, 2017.Search in Google Scholar
American Concrete Institute (ACI). Service-life prediction – state of art report, ACI 365, Farmington Hills, MI: ACI Committee 365, 2000.Search in Google Scholar
American Society of Civil Engineering (ASCE). ASCE’s 2017 infrastructure report card, 2018, Accessed: 13 June 2017. https://www.infrastructurereportcard.org.Search in Google Scholar
American Society of Testing and Materials (ASTM). ASTM standard G46: standard recommended practice for examination and evaluation of pitting corrosion. In: Wear and erosion of annual book of ASTM Standants, vol. 03.02. Conshohocken, PA: ASTM, 2000: 175–181.Search in Google Scholar
American Society for Testing and Materials (ASTM). Standard test method for acid-soluble chloride in mortar and concrete, ASTM C1152/C1152M-04. Conshohocken, PA: ASTM, 2012a.Search in Google Scholar
American Society for Testing and Materials (ASTM). Standard test method for compressive strength of cylindrical concrete specimens, ASTM C39/C39M. Conshohocken, PA: ASTM, 2012b.Search in Google Scholar
American Society for Testing and Materials (ASTM). Standard test method for half-cell potentials for uncoated reinforcing steel in concrete, ASTM C876. Conshohocken, PA: ASTM, 2015.Search in Google Scholar
Andrade C, Alonso C. Test methods for on-site corrosion rate measurement of steel reinforcement in concrete by means of the polarization resistance method. Mater Struct 2004; 37: 623–643.10.1007/BF02483292Search in Google Scholar
Atkinson JTN, Droffelaar H. Corrosion and its control. Houston, TX: NACE, 1982: 121–127; 191–202.Search in Google Scholar
Bardal E, Drugli JM, Gartland PO. The behavior of corrosion resistant steels in seawater: a review. Corros Sci 1993; 35: 257–267.10.1016/0010-938X(93)90157-CSearch in Google Scholar
Bertolini L, Elsener B, Pedeferri P, Polder R. Corrosion of steel in concrete. Weinheim, Germany: WILEY-VHC Verlag, 2000.Search in Google Scholar
Bossio A, Lignola GP, Fabbrocino F, Monetta T, Prota A, Bellucci F, Manfredi G. Nondestructive assessment of corrosion of reinforcing bars through surface concrete cracks. Struct Concr 2017; 18: 104–117.10.1002/suco.201600034Search in Google Scholar
Burke DF. Performance of epoxy-coated rebar, galvanized rebar, and plain rebar with calcium nitrite in a marine environment. In: Proceedings of international conference on corrosion and corrosion protection of steel in concrete, vol. 2. Sheffield, UK: University of Sheffield, 1994: 1254–1266.Search in Google Scholar
Elsener B. Half-cell potential mapping to assess repair work on RC structures. Constr Build Mater 2001; 15: 133–139.10.1016/S0950-0618(00)00062-3Search in Google Scholar
Eurocode. Eurocode 2 design of concrete structures. Part 1: general rules and rules for buildings. Brussels, Belgium: CEN, 2004.Search in Google Scholar
Faroz SA, Pujari NN, Ghosh S. Reliability of a corroded RC beam based on Bayesian updating of the corrosion model. Eng Struct 2016; 126: 457–468.10.1016/j.engstruct.2016.08.003Search in Google Scholar
Federal Highway Administration (FHWA). Status of the nation’s highways, bridges, and transit: conditions and performance. Federal Highway Administration, 2015, Accessed: 13 June 2017. https://www.fhwa.dot.gov/policy/2015cpr/es.cfm.Search in Google Scholar
Fédération internationale du béton (fib). Bulletin 34 model code for service life design, Stuttgart, Germany: fib, 2006.Search in Google Scholar
Fédération internationale du béton (fib). Model code for concrete structures, Stuttgart, Germany: fib, 2010.Search in Google Scholar
Frangopol DM, Kallen MJ, van Noortwijk JM. Probabilistic models for life-cycle performance of deteriorating structures: review and future directions. Struct Eng Mater 2004; 6: 197–212.10.1002/pse.180Search in Google Scholar
Helland S. Design for service life: implementation of fib Model Code 2010 rules in the operational code ISO 16204. Struct Concr 2013; 14: 10–18.10.1002/suco.201200021Search in Google Scholar
International Organization for Standardization (ISO). ISO 16204: service life design of concrete structures. Geneva, Switzerland: ISO, 2012.Search in Google Scholar
Jasniok M, Jasniok T. Evaluation of maximum and minimum corrosion rate of steel rebars in concrete structures, based on laboratory measurements on drilled cores. Procedia Eng 2017; 193: 486–493.10.1016/j.proeng.2017.06.241Search in Google Scholar
Kessler RJ, Powers RG, Paredes MP. Resistivity measurements of water saturated concrete as an indicator of permeability, Corrosion 2005, April 3–7. Houston, TX: NACE, 2005.10.5006/C2005-05261Search in Google Scholar
Krauss PD, Nmai CK. Preliminary investigation of prestressed concrete piles in a marine environment: Deerfield Beach Fishing Pier, ASTM STP 1276. Baltimore, MD: ASTM, 1996: 162–170.10.1520/STP16974SSearch in Google Scholar
March PS, Frangopol DM. Reinforced concrete bridge deck reliability model incorporating temporal and spatial variations of probabilistic corrosion rate sensor data. Reliab Eng Syst Safe 2008; 93: 394–409.10.1016/j.ress.2006.12.011Search in Google Scholar
National Association of Corrosion Engineers (NACE). Highways and bridges. Houston, TX: NACE, 2015, Accessed: 13 June 2017. https://www.nace.org/Corrosion-Central/Industries/Highways-and-Bridges.Search in Google Scholar
Otieno M, Beushausen H, Alexander M. Prediction of corrosion rate in reinforced concrete structures – a critical review and preliminary results. Mater Corros 2012; 9: 777–790.10.1002/maco.201106282Search in Google Scholar
Papakonstantinou KG, Shinozuka M. Probabilistic model for steel corrosion in reinforced concrete structures of large dimensions considering crack effect. Eng Struct 2013; 57: 306–326.10.1016/j.engstruct.2013.06.038Search in Google Scholar
Pedeferri P, Bertolini L. Durability of reinforced concrete. Milan, Italy: McGrawHill, 2000.Search in Google Scholar
RILEM. Measurement of hardened concrete carbonation depth, RILEM CPC 21, 2018: 453–455.10.1007/BF02472327Search in Google Scholar
Sagüés A, Powers R, Zayed A. Marine environment corrosion of epoxy-coated reinforcing steel. In: Page C, Treadaway K, Bamforth P, editors. Corrosion of reinforcement in concrete. London, New York: Elsevier, 1990: 539–549.Search in Google Scholar
Samindi SM, Samarakon MK, Saelensminde J. Condition assessment of reinforced concrete structures subject to chloride ingress: a case study of updating the model prediction considering inspection data. Cem Concr Compos 2015; 60: 92–98.10.1016/j.cemconcomp.2015.03.011Search in Google Scholar
Scannel WT, Sohanghpurwala AA. Rehabilitation of reinforced concrete balconies on a multi-story condominium in South Florida, Corrosion 92. Houston, TX: NACE, 1992: 202, 16.10.5006/C1992-92202Search in Google Scholar
Shi X, Xie N, Fortune K, Gong J. Durability of steel reinforced concrete in chloride environments: an overview. Constr Build Mater 2012; 30: 125–138.10.1016/j.conbuildmat.2011.12.038Search in Google Scholar
Tuutti K. Corrosion of steel in concrete. Stockholm, Sweden: Swedish Foundation for Concrete Research, 1982.Search in Google Scholar
Vu KAT, Stewart MG. Structural reliability of concrete bridges including improved chloride-induced corrosion models. Struct Safe 2000; 22: 313–333.10.1016/S0167-4730(00)00018-7Search in Google Scholar
Winston Revie R. Uhlig’s corrosion handbook, 2nd ed. Pennington, NJ: The Electrochemical Society, 2000.10.1108/acmm.2000.12847dae.001Search in Google Scholar
Yu B, Yang L, Wu M, Li B. Practical model for predicting corrosion rate of steel reinforcement in concrete structures. Constr Build Mater 2014; 54: 385–401.10.1016/j.conbuildmat.2013.12.046Search in Google Scholar
Zhang J, Wang J, Kong DJ. Chloride diffusivity analysis of existing concrete based on Fick’s second law. J Wuhan Univ Technol Mater Sci Ed 2010; 25: 142.10.1007/s11595-010-1142-4Search in Google Scholar
©2019 Walter de Gruyter GmbH, Berlin/Boston
Articles in the same Issue
- Frontmatter
- Editorial
- Environmental degradation of reinforced concrete structures
- Review
- Corrosion behaviour of stainless steel reinforcement in concrete
- Original articles
- New service limit state criteria for reinforced concrete in chloride environments
- The performance of corroded lap splices in reinforced concrete beams
- Corrosion effects on seismic capacity of reinforced concrete structures
- Assessment of reinforced concrete structures in marine environment: a case study