The performance of corroded lap splices in reinforced concrete beams
-
Stavroula J. Pantazopoulou
 ,
Michael F. Petrou
,
Michael F. Petrou

Abstract
This article presents the results of an extensive experimental program containing 22 beams with tension lap splices in the central region. The beams were preconditioned under simulated corrosion up to specific levels of bar section steel loss and cover cracking in the lap region. They were subsequently tested under four-point loading so as to place the corroded lap splice zones in tension. To prevent corrosion outside the study region, the beams were wrapped with fiber-reinforced polymers outside the laps – this also served to protect them from premature shear failure as the objective was to study failure in the lap zone. The objective of the experiment was to assess the residual anchorage capacity of such zones. The parameters of the experimental study were the extent of corrosion and the available length of lap splicing of longitudinal tension reinforcement. Corroded bond strength was determined from the short-length lap splices, where it may be assumed that stresses are uniformly distributed over the lapped zone; longer specimens were considered in order to examine how the redundancy provided by the longer contact length may improve the resilience and deformation capacity of the corrosion-damaged component prior to bond failure.
1 Introduction
The proliferation of reinforced concrete construction in the second half of the 20th century is echoed today in the abundance of older structures, which, apart from being substandard in terms of their original reinforcement detailing, have suffered from the compounded effects of corrosion that occurred mostly due to exposure to chloride attack and carbonation over their lifetime. From a life cycle assessment, these structures have well exceeded their intended service life; however, their mere number is staggering, and their use and resale continued. No other alternative but assessment and retrofit may be considered a negotiable venue for society.
An important concern in this context is what strength may be depended upon after all these years of corrosion progression. Indeed, concrete materials used in the era of construction were low strength and therefore rather porous; urban pollution was a frequent cause of widespread general corrosion. Previous studies have illustrated that corrosion causes an array of problems, as depicted in Figure 1, including steel bar area loss, reduction of rib heights, and cover cracking both manifested by severe degradation of bond and development capacity, and steel material embrittlement. Active corrosion in concrete is initiated after the breakdown of the protective passive film formed around steel due to its high pH (13.0–13.5). This is caused by attack by aggressive ions such as chlorides and/or by decrease in pH due to carbonation (reaction of cement paste and carbon dioxide). Oxygen comes in contact with reinforcement after reaching its surface by being diffused with the help of water through the pore structure of concrete, or it otherwise has direct contact with steel at crack locations, causing local pitting. The result of oxidation of iron is the formation of ferrous and ferric oxides. The deposited rust products occupy, in general, more space than the volume of the original iron that was oxidized (Figure 1). This has mechanistic implications on the cover, as follows:
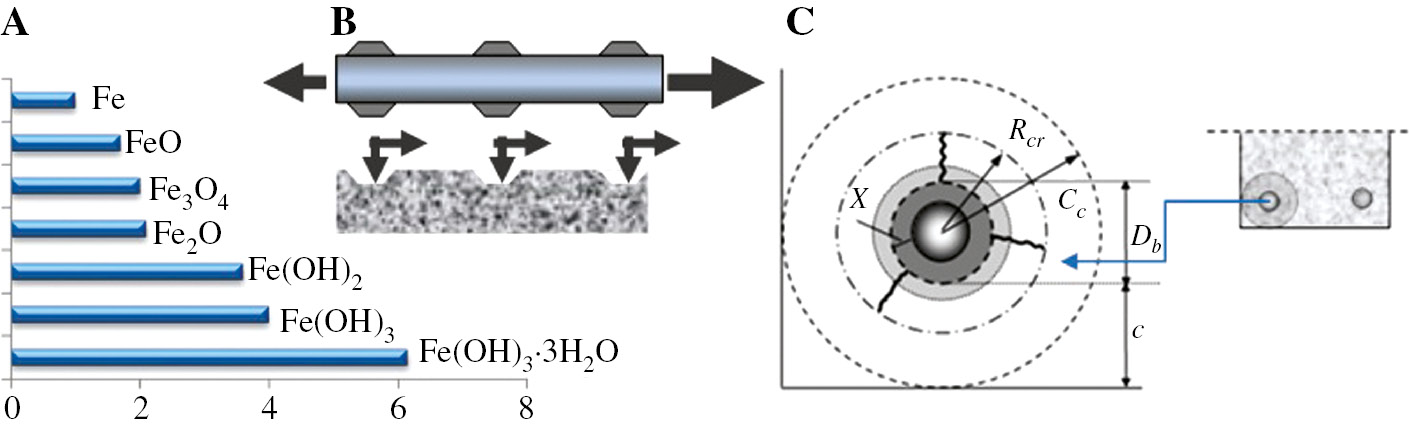
Outline of the mechanism of corrosion: (A) relative volume ratio of iron oxides as compared with the parent metal volume involved in oxidation; (B) pressures exerted by the pulled bar on the cover as a result of bond stresses; (C) propagation of rust and penetration of the crack front in the cover.
Increasing the diameter of the affected bar by the derivatives of corrosion (rust) initially causes increasing radial pressures, thereby enhancing friction between the rod and the surrounding concrete. However, upon further progression of rust accumulation, the hoop stresses generated exceed the tensile strength of concrete, leading to cover splitting; splitting propagates from the reinforcement boundary toward the free surface of the cover. When the entire cover is split, then there is no hoop resistance leading to elimination of pressures normal to the bar surface and eventually demise of bond (bond stress is modeled as a friction coefficient times the normal pressure on the cylindrical surface of the bar).
The layer of flaky corrosion products that accumulate over the bar has negligible shear resistance, resulting in a decrease in the coefficient of friction between concrete and reinforcement. Ribs are smoothened out, leading to reduced interlocking with concrete. Loss of friction and loss of rib interlocking have multiplicative effects on bond degradation (Okada et al., 1988; Al-Suleimani et al., 1990; Tachibana et al., 1990; Andrade et al., 1993; Almusallam et al., 1996; Cabrera, 1996; Amleh & Mirza, 1999; Auyeung et al., 2000; Cairns & Du, 2002; Hussein et al., 2002; Tastani & Pantazopoulou, 2007).
Corrosion also causes the steel surface to become porous, as it loses iron atoms to oxidation. The result is that the lattice structure of the material becomes less stable and amorphous, causing brittleness in the observed response to deformation.
Corrosion is reportedly accelerated after through cracking of the cover because of deeper and faster penetration of carbonation and the uninhibited supply of chloride ions, moisture, and atmospheric oxygen. Loss of bond begins once the cover is fully cracked; however, it is entirely annihilated upon delamination of the cover (Pantazopoulou & Papoulia, 2001). Such damage is catastrophic as to the proper functioning of structural members by eliminating any form of support of the so-called flexural action (Wight & McGregor, 2012). Deterioration of any strength mechanism that depends on the development capacity of anchorages and lap splices is a natural consequence; however, the exact magnitude of the loss is not easily quantifiable. This is studied experimentally in the present article, aiming to establish the effect of corrosion of lap splices in the case of simply supported beams, such as would occur in a real exposed structure. A total of 24 beams were tested for the needs of the investigation. The beams, with the exception of control specimens, were preconditioned under simulated accelerated corrosion up to specific levels of bar section steel loss and cover cracking in the lap region. They were subsequently tested under four-point loading so as to place the corroded lap splice zones in tension with no simultaneous shear action. To prevent corrosion outside the study region, the beams were wrapped with fiber-reinforced polymers (FRPs) outside the laps – this also served to protect them from premature shear failure as the objective was to study failure in the lap zone (Tastani & Pantazopoulou, 2004). The objective of the experiment was to assess the residual anchorage capacity of such zones. The parameters of the experimental study were the extent of corrosion and the available length of lap splicing of longitudinal tension reinforcement.
2 Experimental program
A total of 24 beam specimens were constructed and 22 were tested; the beams had a rectangular cross section (b=200 mm, h=300 mm), with cnom=25 mm cover and length L=2440 mm. The concrete was class C25/30 (EN 1992-1-1, 2004). The concrete mix details were as follows: cement 380 kg/m3, W/C: 0.550, max. aggregate: 20 mm, design slump 100 mm (observed slump: 140–170 mm), specific weight: 2288 kg/m3, type of admixture: superplasticizer HGP3C; 150 mm×300 mm cylinders wet cured and tested on 28 days and at the day of the mechanical load tests. Only S500B longitudinal tension reinforcement was provided, comprising two 14-mm-diameter bars, joined by splicing in the central third of the specimens (Figure 2). By testing the beams under four-point loading, the spliced zone was placed in the constant moment region (no shear effects on the splice). Four different spliced lengths, Lb, were considered, given in multiples of bar diameter as 5Db (=70 mm), 15Db (=210 mm), 30Db (=420 mm) and 45Db (=630 mm). The respective classification of the specimens in Table 1 refers to these lengths as very short (VS), short (S), medium (M), and long (L). The lowest lap length of 5Db was selected because based on the analytical solution of the field equation of bond, it produces nearly constant distribution of bond stresses; therefore, it may be used to determine the actual bond strength. The 45Db length is the nominal length required to develop the yield strength of the bar using nominal bond strength values according to the design code. This is a long anchorage that enables redistribution of bond stress with advancing failure due to redundancy. The other two lengths of 15Db and 30Db were selected to subdivide the domain 5Db–45Db so that the behavior of short- and medium-length elastic anchorages may also be studied. Six identical specimens were constructed for each subgroup (the digit from 1 to 6 after the classification above refers to the specimen identification number). Two different casts were made for each specimen group (eight in total, identified as A and B in the specimen name tags). The total length of Db=14 mm bars was 6284 mm in each VS-specimen, 6564 mm for the S-specimen, 6984 mm for the M-specimen, and 7404 mm for the typical L-specimen (this information is useful in converting the total mass loss to an average diameter loss).
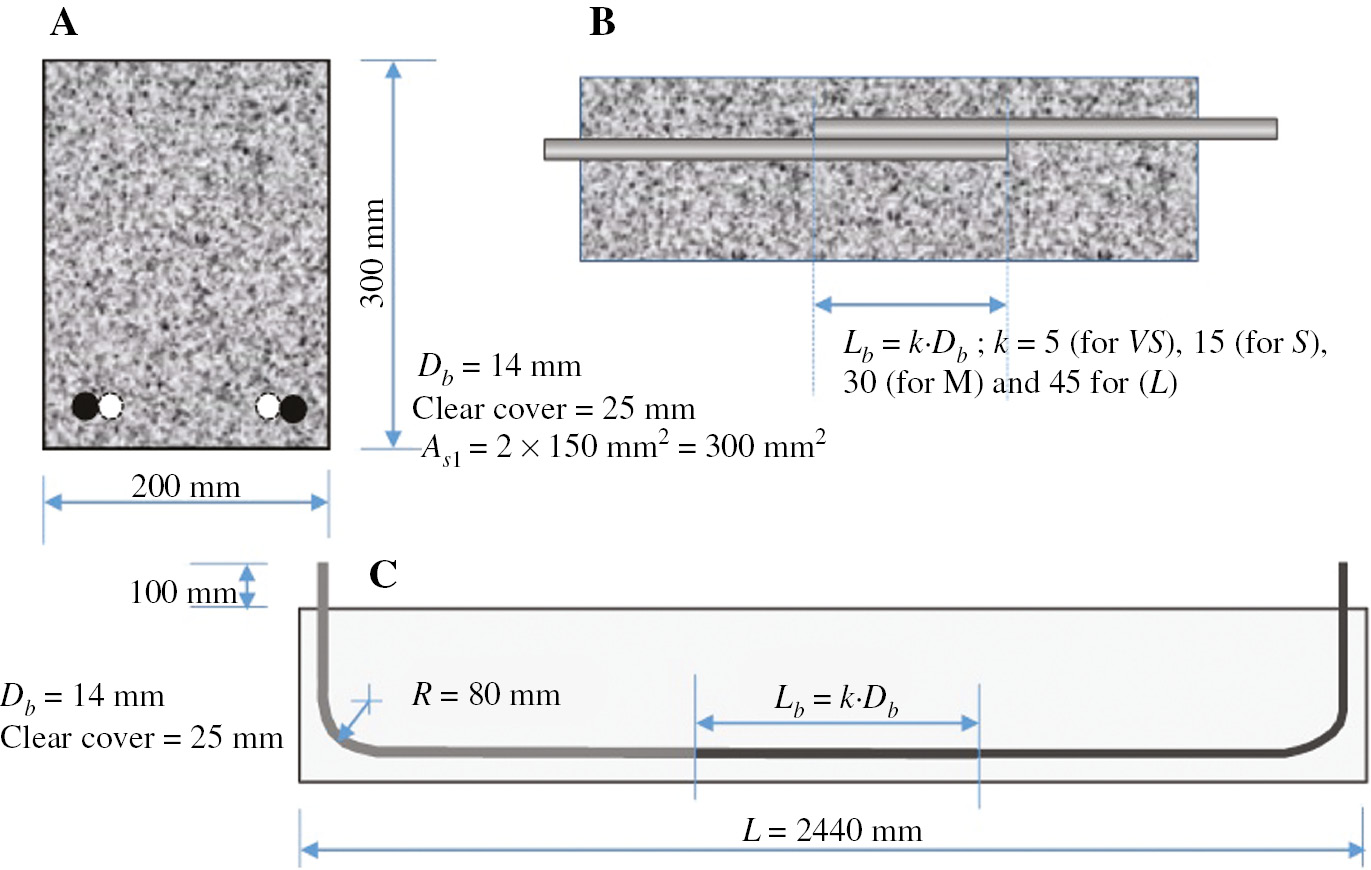
Specimen geometry and reinforcing details: (A) cross section, (B) lap splice region, and (C) overall layout.
Summary of experimental results for all specimens of the experimental program (shaded cells refer to uncorroded specimens).
| Specimen ID | fc′@@@28 days (MPa) | f c ′@@@380 days or 400 days | Percent loss over the entire length of bar and days of exposure | Mass loss due to corrosion in the central region (%) | Maximum sustained beam load (kN) | Max fb (MPa) |
|---|---|---|---|---|---|---|
| A-L1Control | 30 | 42 | – | – | 146.06 | 3.9 |
| A-L2Cor. | 30 | 42 | 2% 259 days | 9.77 | 114.30 | 3.0 |
| A-L3Cor. | 30 | 42 | 2% 259 days | 6.45 | 120.6 | 3.2 |
| B-L4Cor. | 35 | 45 | 1% 71 days | 4.45 | 35.48 | 0.95 |
| B-L5Control | 35 | 45 | – | – | 146.44 | 3.9 |
| B-L6Cor | 35 | 45 | 1% 71 days | 3.67 | 42.81 | 1.15 |
| A-M1Cor. | 30 | 42 | <1% 259 days | 8.04 | 107.68 | 4.3 |
| A-M2Cor. | 30 | 42 | <1% 259 days | 10.94 | 108.1 | 4.32 |
| A-M3Control | 30 | 42 | – | – | 110.81 | 4.45 |
| B-M4Control | 35 | 45 | – | – | 66.39 | 2.65 |
| B-M5Cor. | 35 | 45 | <0.5% 67 days | 4.74 | 30.02 | 1.2 |
| B-M6Cor. | 35 | 45 | <0.5% 67 days | 5.33 | 31.9 | 1.3 |
| A-S1Cor. | 30 | 42 | 2% 283 days | 7.73 | 81.69 | 6.55 |
| A-S2Cor. | 30 | 42 | 2% 283 days | 16.62 | 69.9 | 5.59 |
| A-S3Control | 30 | 42 | – | – | 75.48 | 6.0 |
| B-S4Cor. | 35 | 45 | 1% 71 days | 4.12 | – | |
| B-S5Cor. | 35 | 45 | 1% 71 days | 3.4 | – | |
| B-S6Control | 35 | 45 | – | – | 78.43 | 6.3 |
| A-VS1Control | 30 | 42 | – | – | 35.94 | 8.6 |
| A-VS2Control | 30 | 42 | – | – | 40.43 | 9.7 |
| A-VS3Cor. | 30 | 42 | <0.65% 115 days | 2.07 | 29.47 | 7.0 |
| B-VS4Control | 35 | 45 | – | – | 42.16 | 10.1 |
| B-VS5Cor. | 35 | 45 | <0.6% 104 days | 1.76 | 24.03 | 5.8 |
| B-VS6Cor. | 35 | 45 | <0.4% 104 days | 1.29 | 30.67 | 7.35 |
The reason why different lengths were tested was to be able to measure the bond strength as an intrinsic property of the interface from the shorter specimens, and to assess the development capacity of the bars from the longer, more realistic bonded lengths (FIB Bulletin 10, 2000a,b; Hosny et al., 2012; FIB Bulletin 72, 2014; Tastani et al., 2014). Note here that in the specimens with 5Db lap lengths, the bond distribution is practically uniform; therefore, measured values correspond to the actual bond strength. In specimens with longer lap lengths, the distribution of bond is highly non-linear (Tastani & Pantazopoulou, 2012); therefore, the bond may only be assessed as an average value from the ratio of the force developed divided by the lateral contact surface of the bar as
Two of each group of six served as controls (no corrosion). The remaining specimens were subjected to accelerated corrosion by impressed current in an electrochemical corrosion cell, up to the attainment of desirable levels of steel loss. To ensure that only the lapped region would undergo corrosion (required in order to control the amount of section loss effected in the lap splice zone), the following measures were taken:
Transverse FRP jacketing was applied in the beam in the zones outside the constant moment region, either continuous or in strips, so as to eliminate shear failure (except the central 800 mm of each specimen). Silicone profiles with a radius of 8 mm were used in the beam molds to round the lower and upper corners of the specimen during casting, so as to prepare for the FRP jacket placement as specified by relevant recommendations (Pantazopoulou et al., 2016).
The epoxy used as adhesive of the FRP jackets was used over the entire submerged depth of the beams outside the central 800 mm of each beam. This was done because according to past research, FRP jackets are particularly effective for protection against corrosion because they are chemically inert and impermeable after curing of the epoxy resin, thereby inhibiting penetration and ingress of the necessary elements that feed the iron oxidation (Cl−, H2O, O2, CO2) (Lee et al., 2000; Pantazopoulou et al., 2001; Tastani & Pantazopoulou, 2004). It was believed that the epoxy prevents access of the corrosion mechanism to the essential ingredients for sustained corrosion (note that the epoxy was bonded effectively – there were no signs of detachment or debonding throughout the corrosion conditioning).
Beams and cylinder samples were wet cured for 4 days under burlap and then under plastic sheets for 4 weeks. The cylinder compressive strength ranged from 30 MPa at 28 days, up to 42 MPa (A-series) and 45 MPa (B-series) at the time of testing (about a year after casting, average values of several samples). Steel reinforcement yielded at 560 MPa and attained a peak stress of 660 MPa (average value of three samples). The FRP materials used comprised single continuous glass FRP (GFRP) jackets (TYFO/FYFE, tf=0.359 mm, Ef=72.4 GPa) for specimens L2, L3, S1 and S2. All other specimens (except VS5 and VS6) were reinforced with 100-mm-wide carbon FRP (CFRP) strips (SIKA, tf=0.131 mm, Ef=234 GPa) spaced at 200 mm on centers (i.e. 100 mm clear spacing), as shown in Figure 3; each strip was anchored by overlapping one full side of the beam cross section (on the top side).
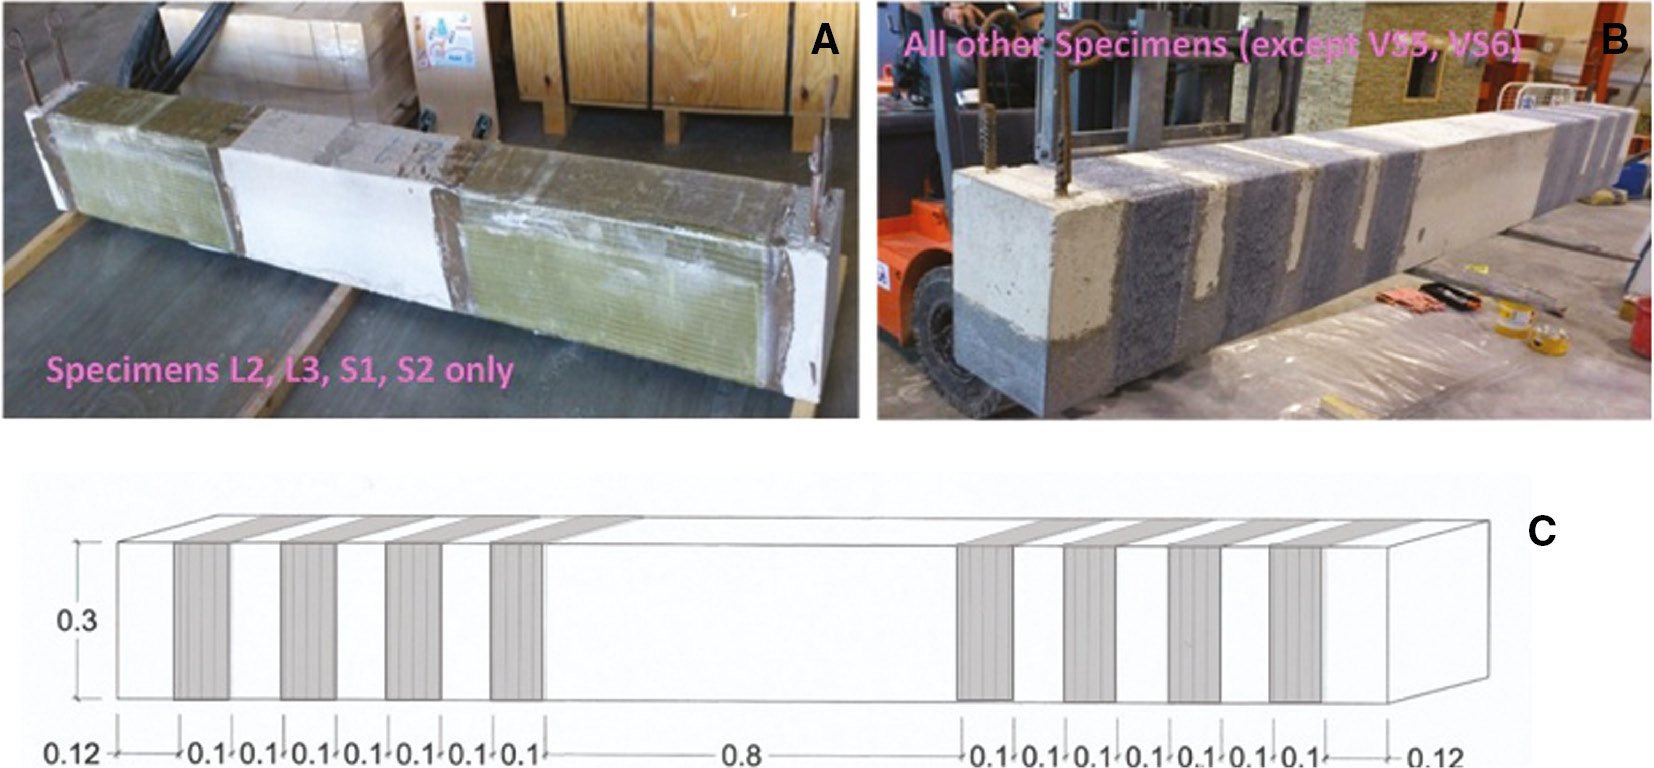
Arrangement of FRP jacket or strips and epoxy coating in the shear spans (dimensions in meters). Specimens VS5 and VS6 were only coated with epoxy but were not FRP reinforced in shear, as it was deemed unnecessary for the loads required in order to fail these specimens: (A) example of glass FRP arrangement; (B) example of carbon FRP arrangement; (C) schematic of strip arrangement.
The estimated nominal force Ffrp, at a conservative transverse strain of 0.004, is 20.9 and 24.5 kN for each two-legged GFRP and CFRP strip, respectively. Here tf is the FRP sheet thickness, bf the strip width, and Ef the modulus of FRP, whereas Ffrp=2tfbfEf·0.004. Considering the four-point setup where the shear span Ls (distance from the end support to the position of maximum flexural moment) would be 0.7 m, the design shear was estimated from peak moment nominal strength (Vd=MR/Ls=0.9d·2·154 mm2·500 MPa/ 700 mm=53 kN, where the effective depth d=h−c−0.5Φ= 300−25−7=268 mm). A 45° diagonal crack for the assumed shear failure plane generally intersects two 100-mm-wide strips anywhere in the shear span, and therefore the strength provided by the FRP strips was 2×20.9=41.8 kN and 2×24.5=49 kN for GFRP and CFRP, respectively, for the nominal transverse strain of 0.004 (Pantazopoulou et al., 2016). Where GFRP was used as a continuous fabric (not in strips), the corresponding shear strength is increased by 50% on account of the fact that a 45° diagonal crack in that case intersects the equivalent of three 100-mm-wide strips (i.e. Vf=1.5×41.8=62.7 kN). A minimum concrete contribution amounting to 0.4√fc′·b·xc=0.4√30·200·0.2·268 mm=23.5 kN was also considered (Tureyen & Frosch, 2003; Tureyen et al., 2006); here, xc is the depth of compression zone, estimated here for the amount of flexural reinforcement provided to be equal to 0.2d. This leads to a total shear strength of 23.5+41.8=65.3 kN and 23.5+49=72.5 kN, respectively, in all cases exceeding the estimated maximum shear strength demand. It is worth noting that no shear failure was reported in the tests that followed. (For cases that were fully wrapped with GFRP, the contribution of the jacket should be doubled, i.e. 23.5+2·41.8=107.1 kN, i.e. significantly over-reinforced in shear).
For the needs of data reduction, the nominal internal lever arm between tension and compression resultants is required. With reference to Figure 2A, the following calculations are made of the normalized depth of the compression zone at yielding and ultimate of the tension reinforcement:
At ultimate, from measured material properties at the time of testing:
The depth of compression zone is xc,u=0.109· 268(=d)=29 mm, and therefore the internal lever arm, jd=268−0.4×29=256 mm.
At yielding, using actual material properties at the time of testing:
The depth of compression zone is xc,y=0.1488·268 (=d)=40 mm, and therefore the internal lever arm, jd=268−(1/3)·40=254 mm. Therefore, the nominal yield and ultimate moments of the specimen with the longer lap splice (i.e. highest bar development capacity) was estimated as
3 Electrochemically accelerated corrosion conditioning of specimens
After the 28th day of curing and before being subjected to mechanical load, the specimens were placed in an electrochemical corrosion cell, in a properly designed pool (Figures 4 and 5).
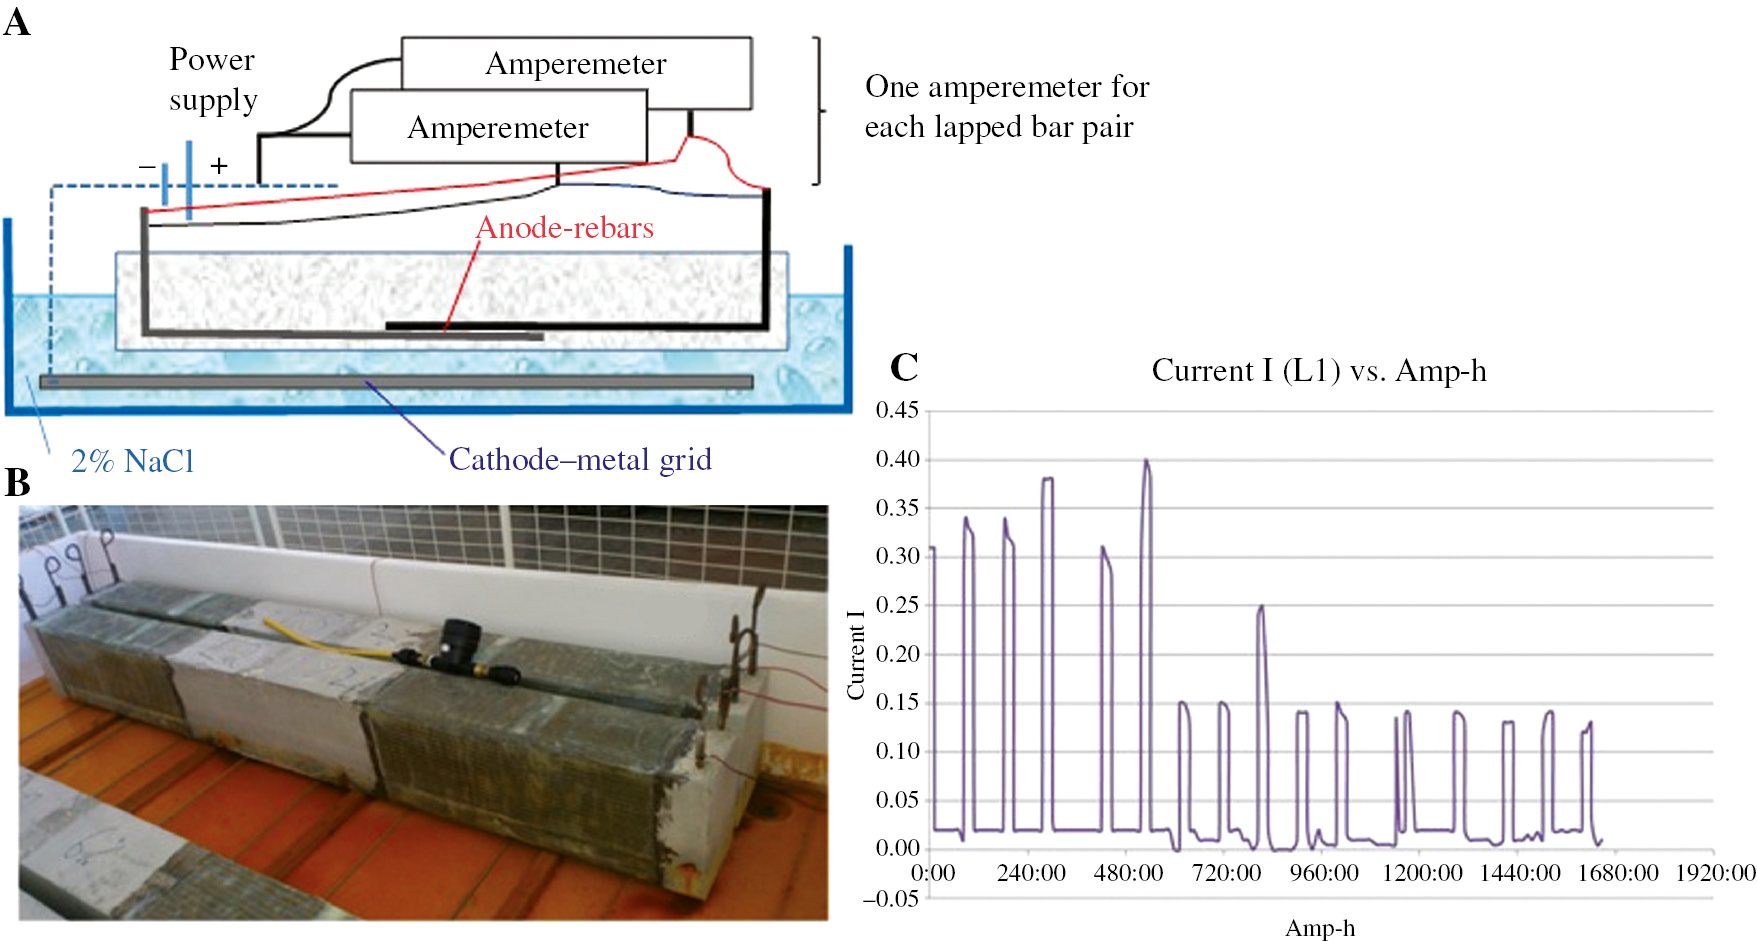
Circuits of the electrochemical corrosion process sequence: (A) schematic for every single part of the bar pair; (B) view of specimens and metal grid in the bath; (C) typical log of current vs. time (h).
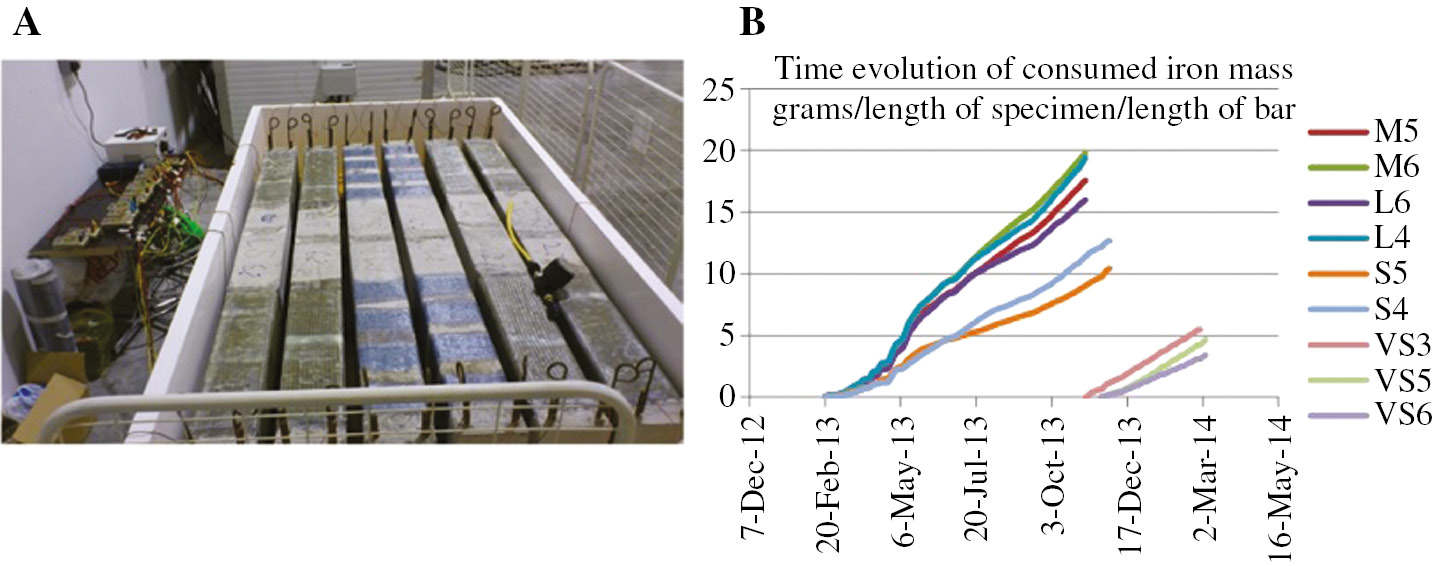
(A) General view of the corrosion bath; (B) accumulation of iron mass loss with time (to convert to total grams lost multiplied by length of beam×total length of steel bars).
Reinforcement served as the anode in the corrosion cell, whereas a metal rack placed at the bottom of the pool was the cathode. The circuit was completed by an aqueous solution of sodium chloride (2% content approaching the value in seawater) and was subjected to enforced current by applying an electric potential of 6 V at the ends of the reinforcement, as depicted in Figures 4 and 5; to achieve this, the bar ends were protruding at the ends of anchorages, as shown in Figure 5. The corrosion process comprised consecutive 4-day cycles of exposure. Each cycle comprised 1 day of wetting of the specimens by submersing them in NaCl solution up to a level of 65 mm measured from the soffit (up to one cover depth above the reinforcement), followed by 3 days of drying (by emptying the pool). This was meant to encourage formation of complete oxidation products (red rust, which is the most expansive of all oxides listed in Figure 1A) by securing ample oxygen supply to the corrosion cell so that the damage potential would be maximized. To kick-start the corrosion, specimens were immersed up to the 65-mm mark for the first 5 days in the NaCl solution before starting the corrosion cycles. As was stated before, specimens that were not protected with a continuous (GFRP) jacket were coated with epoxy resin over lengths of 820 mm starting from the ends, so as to limit the corrosion activity in the central region of each specimen. Although the FRP materials used were immersed in the corrosive water tank during the electrochemically accelerated corrosion conditioning, no effect was observed in the form of chemical attack or water absorption on the jackets or on the epoxy.
Separate wires connected to each bar originally arrived in two different nodes per specimen and then to a common node per specimen in order to secure uniform distribution of the corrosion process along the bars (Stanish et al., 1999). The current intensity was recorded through ampere meters. To prevent electrolysis, the current was kept below 150 mA per reinforcing bar (0.4 A per specimen was the maximum allowable limit).
Specimens were corroded to a target level of iron loss of 2% and 6% by volume. The mass of steel consumed by oxidation, ΔMs (in grams), was estimated from the total current density, I, passed through the bars, using Faraday’s law (about 1 A h required to corrode 1.04 g of iron; Manning, 1992; Phillips, 1992), where the underlying assumption made is that mass loss occurs evenly along the exposed part of the reinforcement [Am is the atomic mass of iron=55.85 g; Faraday’s constant, F=96,486.7 C/mol; and z is the valence of the reaction which for Fe(OH)2 product is taken as 2]:
where ms is mass (in grams) and t is the corrosion time (in seconds). The total mass is calculated by integration over time; that is, by calculation of the area enclosed by the current intensity vs. time diagram:
The corresponding bar radius change, ΔRs, is obtained from the corresponding volume change of steel, ΔVs=ΔMs/ρs ; half of that amount occurs in each lapped-bar pair of the specimen (density of iron, ρs=79 kN/m3=7.9×10−3 g/mm3). Thus, ΔRs=(1/2)·ΔVs/(2πRLe), where Le is the exposed length of reinforcement (here, if it is assumed that only the central segment is affected, then for each lapped bar, the value used is Le=0.8 m+Lb, where Lb is the length of the splice); based on the post-test evaluation, however, it appears that corrosion penetrated in all regions that were not confined by FRP. Table 1 reports mass loss normalized with respect the actual length of reinforcement and the nominal exposed length in columns 4 and 5, respectively. The depth of corrosion penetration, X, into the bar core is defined as X=ΔRs/Rs. For the specimens of the experimental program, the minimum bar diameter change was estimated at 0.52%, whereas the maximum value reached 6.2%.
Table 1 lists for every specimen the total duration (in days) of exposure to the corrosion cell and the resulting mass loss as a percentage of the reinforcement mass available in the central 800 mm of uncoated region of the beams. Mass loss ranges from 1.29% to 16.62%. The table also lists the results of the next phase of the experimental program, which is presented in detail in the following sections. The superscript “Control” on the specimen identification code refers to uncorroded specimens, which are used for reference; all specimens subjected to accelerated corrosion are marked with superscript “Cor.”
4 Condition of specimens after simulated corrosion
After the conclusion of the accelerated corrosion conditioning phase, the specimens – particularly those that experienced significant bar diameter loss – were extensively cracked along the central region where corrosion had been enforced including the lap splice length. Splitting cracks were visible on the underside of the beams exactly at the bar locations. The end portions of the uncoated 800-mm central region remained uncracked, indicating that the procedure used to prevent penetration of corrosion in the shear spans of the specimen was successful, although externally the specimens were stained over their entire length. Also, after the end of tests and cover removal, it was found that bars had black staining (i.e. signs of anaerobic corrosion) in the parts that were only coated externally with epoxy but did not have jackets; however, this was due to immersion in the bath, while the corrosion products had not penetrated from outside through the epoxy inside the cover. The coated areas that did not develop corrosion were effectively clamping the boundary limits of the exposed area, and effectively prevented splitting expansion of the cracks into the unaffected region (Figures 6–8).
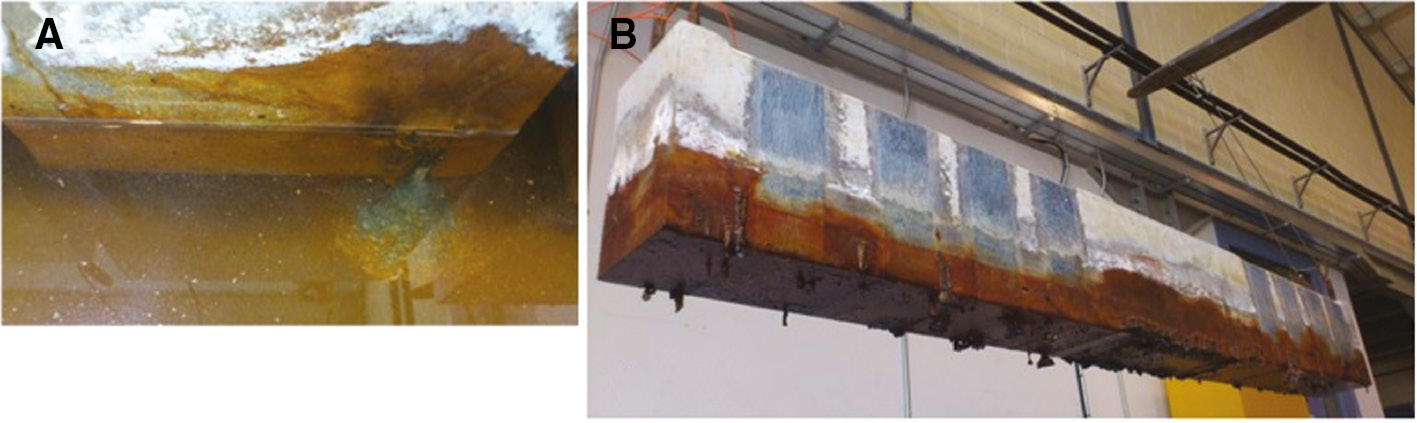
Condition of specimens after removal from the corrosion bath: (A) corrosion products leaching out in the corrosion bath; (B) staining of the exposed region with corrosion products.
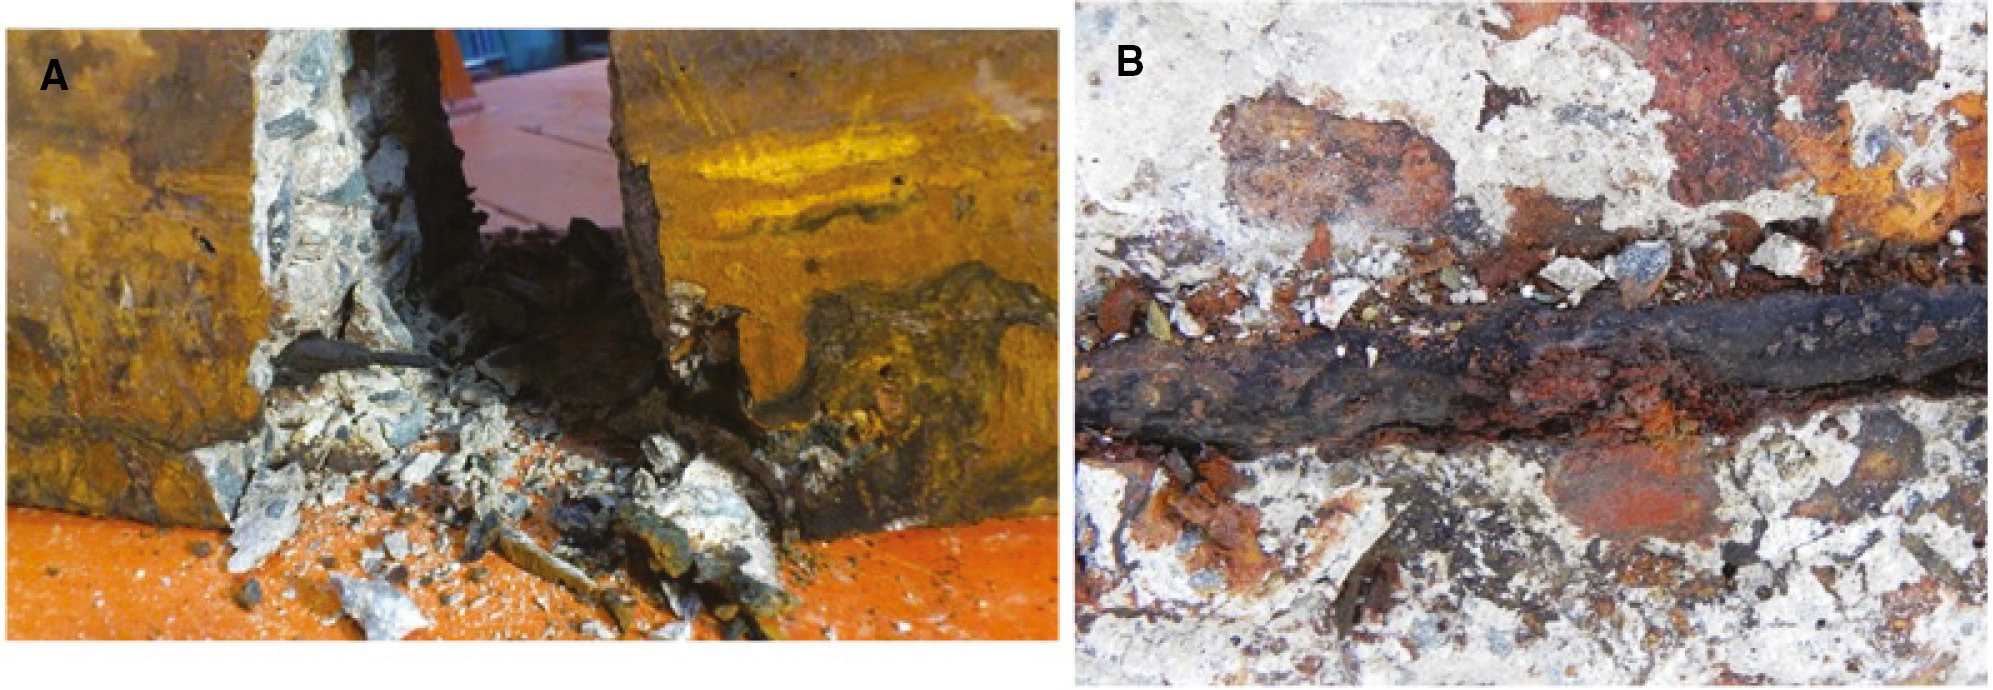
Condition of reinforcement (after the mechanical tests were completed): (A) rupture of bar at corrosion pit; (B) reduction of bar section due to corrosion.
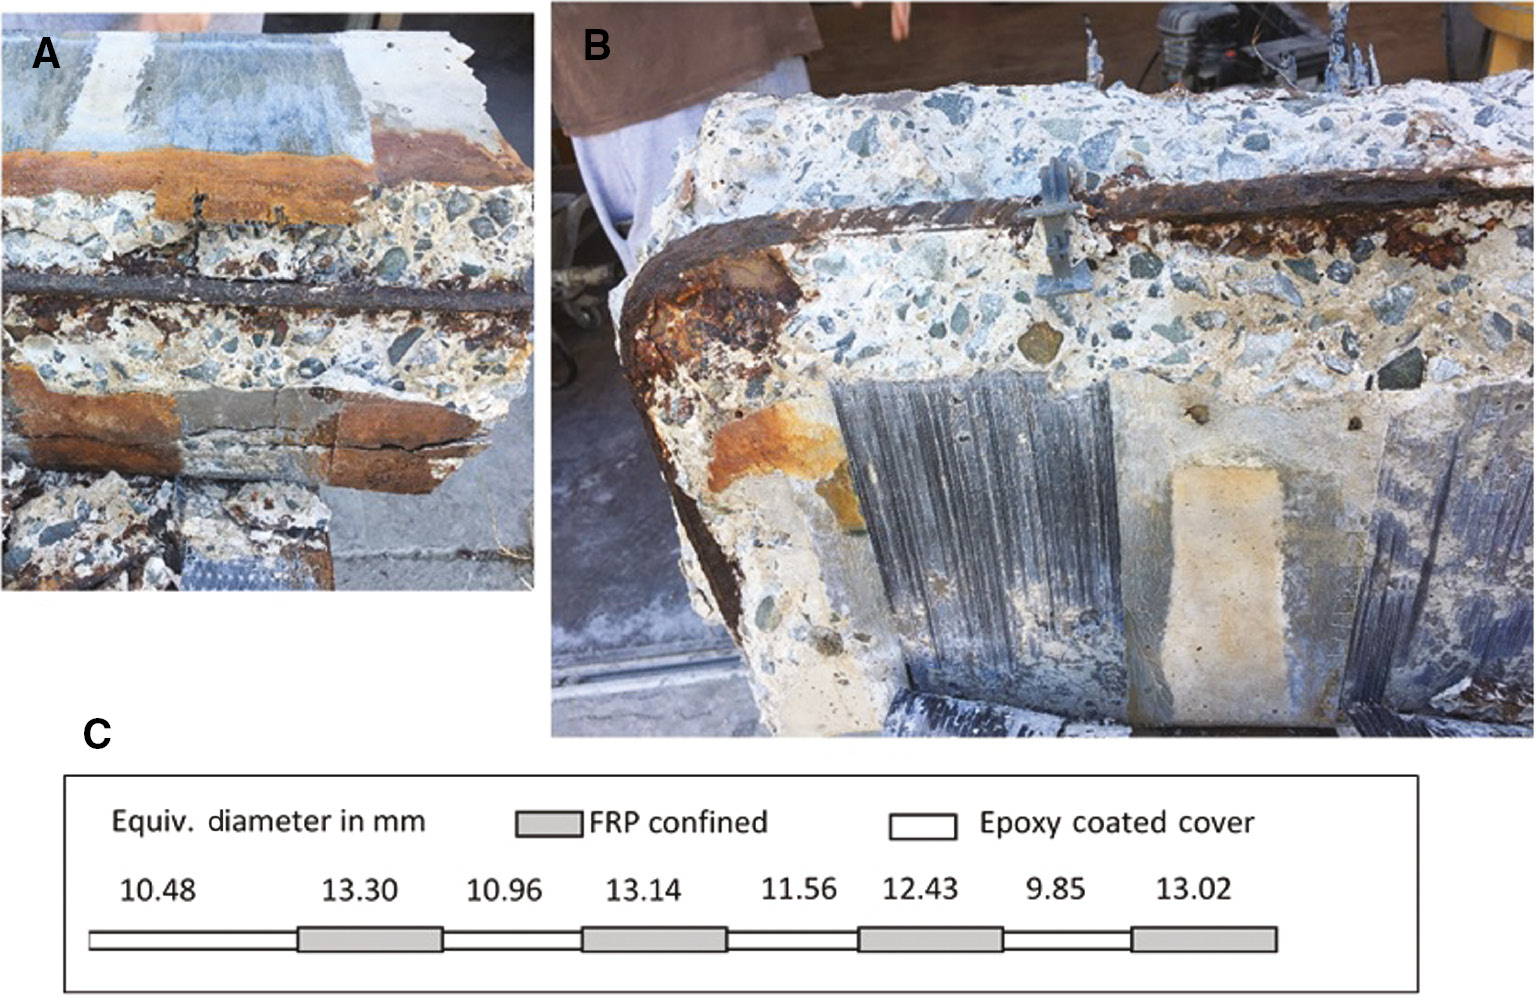
Post-testing investigation of specimen L4: (A) concrete in the areas with the CFRP strips was much less stained by corrosion than the epoxy-coated region; (B) the bar segment under the confining FRP strip had maintained the ribs – the bar segments outside the confined strips were much more heavily affected; (C) reduction of bar diameter from the original 14-mm dimension. Hatched areas were under the strips.
After the mechanical tests, fragments of the concrete around the corroded bars were examined in detail; it was found that they were fully saturated with orange-red rust uniformly distributed along the exposed length of the bar. In lightly corroded cases, the ribs were still intact apart from a surface layer of deposited rust; on the other hand, in severely corroded examples, the steel had been entirely compromised, resembling oxide mud rather than a solid bar (Figure 7).
5 Mechanical loading of the beam specimens
Next, the specimens were mechanically tested under four-point loading under displacement control. The objective of this test phase was to determine to what degree had the corrosion of the splice compromised its development capacity. The experimental setup for this phase of the test is depicted in Figure 9. Also shown is the location of the instrumentation used to measure the deflections of the longitudinal centroidal axis of the specimens during the test.
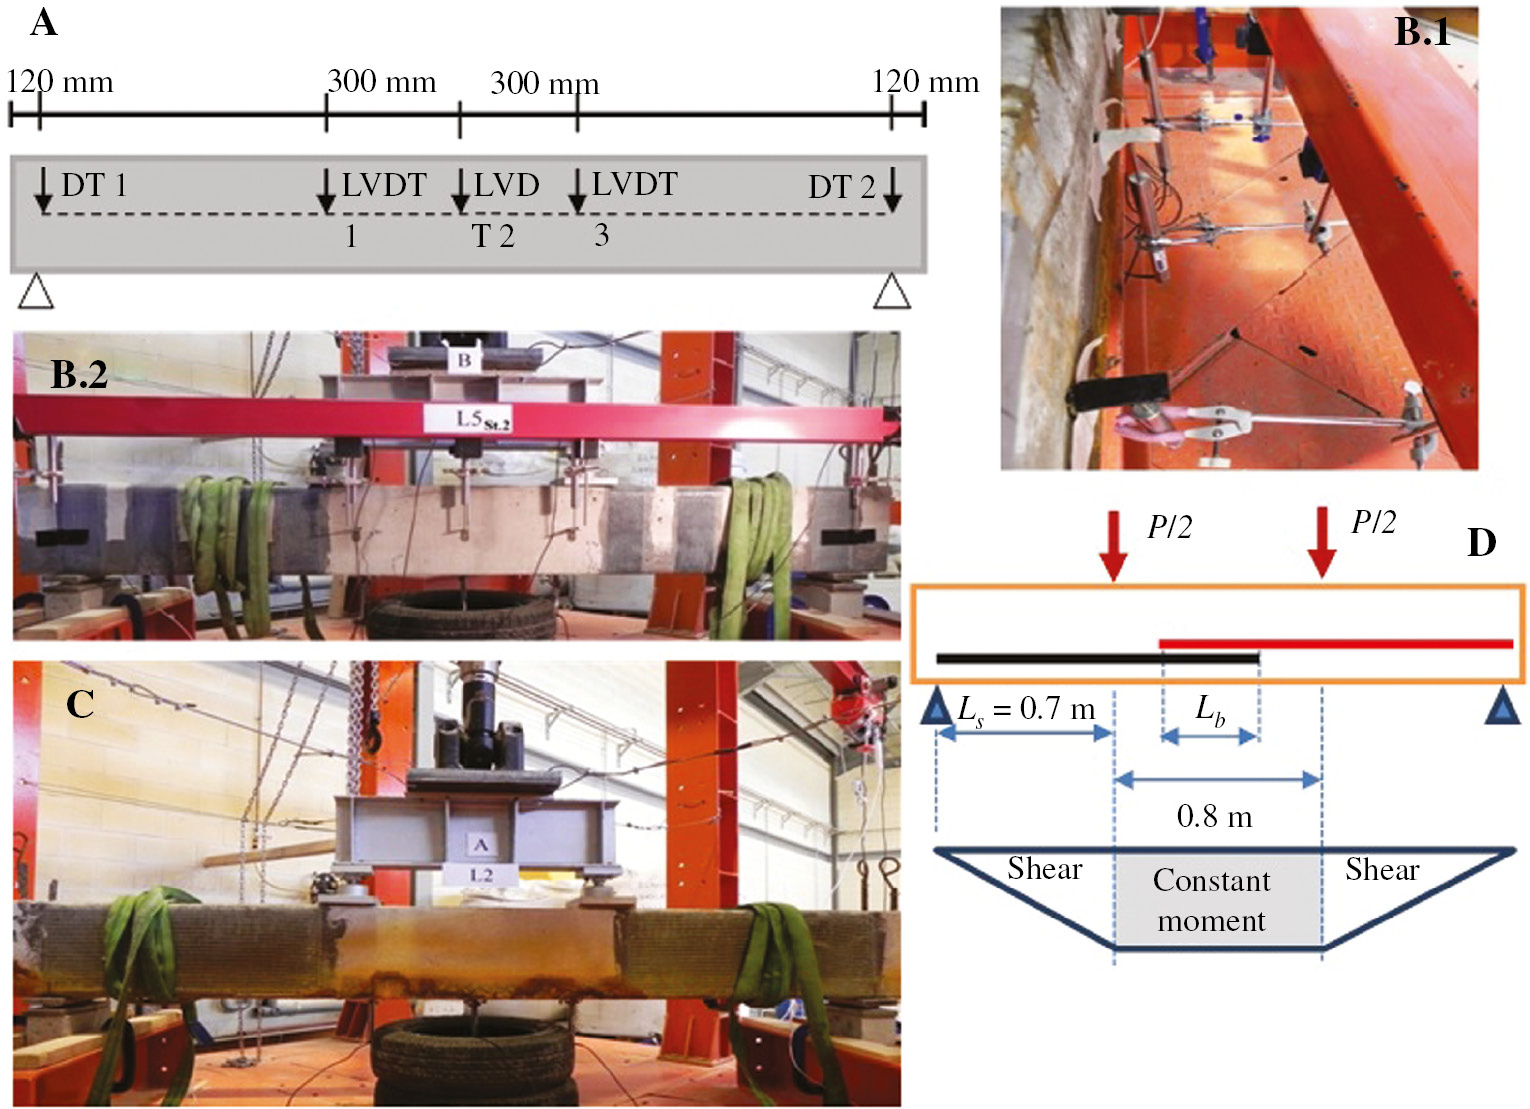
Experimental setup for the load tests: (A) instrumentation; (B.1 and B.2) LVDT placement; (C) test arrangement; (D) schematic of load application.
The convenience of the test arrangement is in the relatively straightforward reduction of the internal forces of the statically determinate system. However, this modeling does not represent faithfully the actual conditions of the structure in the field where some degree of restraint exists from adjacent members. To be able to assess the strain profiles over the central span, displacements were recorded at three positions, one at midspan (LVDT 2 in Figure 9A) and one at 300 mm from that point, symmetrically about the midspan (LVDT 1 and 3, and DT 1 and 2 in Figure 9A). This enables calculation of curvature and therefore the intensity of bar strain in the ends of the lapped zone on each bar pair (see, e.g. Figure 10, which plots the total load vs. the three LVDT recordings for specimen B-S6: the peak displacement difference between the central and the two end LVDTs is 0.3 mm). With constant moment and therefore uniform curvature along the instrumented length, the curvature at the peak point is estimated at 0.3 mm/ 300 mm/150 mm=6.66×10⁻⁶/mm (second moment-area theorem); with an effective depth of tension zone equal to 255 mm [as shown in the text following Eq. (1)], the corresponding bar strain is 0.00168 and the developed stress is 340 MPa. Of the 24 specimens, 22 were tested under mechanical load; the others were left for repair prior to load application (not presented).
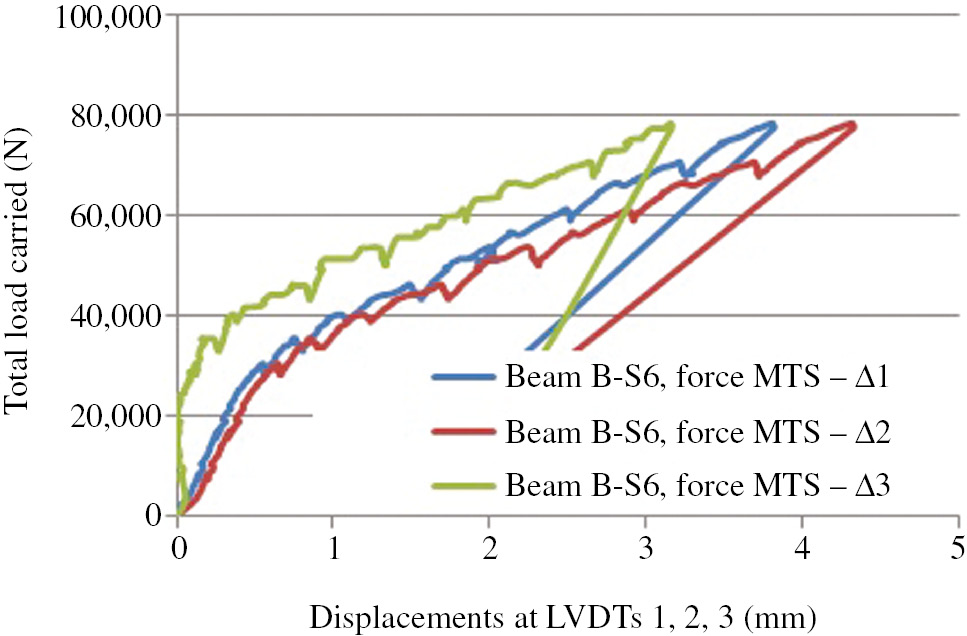
Deflections recorded at LVDTs 1, 2 and 3 in beam specimen B-S6 (after correction for the support movements).
The quasi-static load was applied under displacement control, in monotonically increasing steps till failure (Figure 10); displacement was controlled at midspan, and each increment or stage corresponded to multiples of the estimated nominal yield displacement [i.e. stage 0: Δ=Δcr=1.6 mm, where the cracking curvature ϕcr=0.00015/(300/2)=0.000001/mm and Δcr=ϕcr·(Ls)2/3; stage 0.75: Δ=0.75Δy, where Δy=20 mm; stage 1: Δ=Δy; stage 1.5: Δ=1.5Δy; stage 2: Δ=2Δy, and so on]. Load displacement curves are plotted for all the specimens tested in Figures 11 and 12. The specimens are grouped in the respective figures according with the spliced length, L, M, S and VS, respectively.
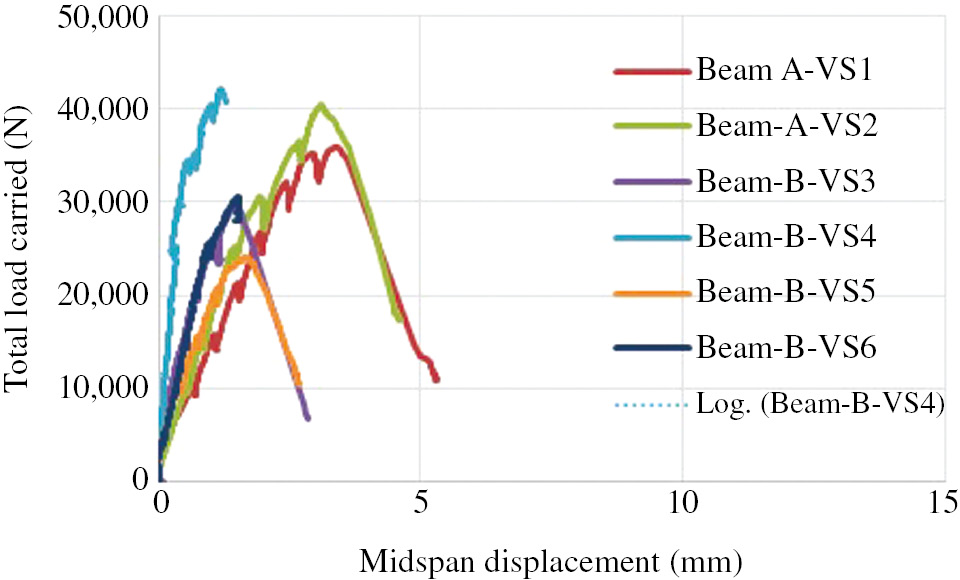
Load-displacement relationship for all specimens with a 5Db lap splice length (VS) (control specimens are A-V1, A-VS2, B-VS4).
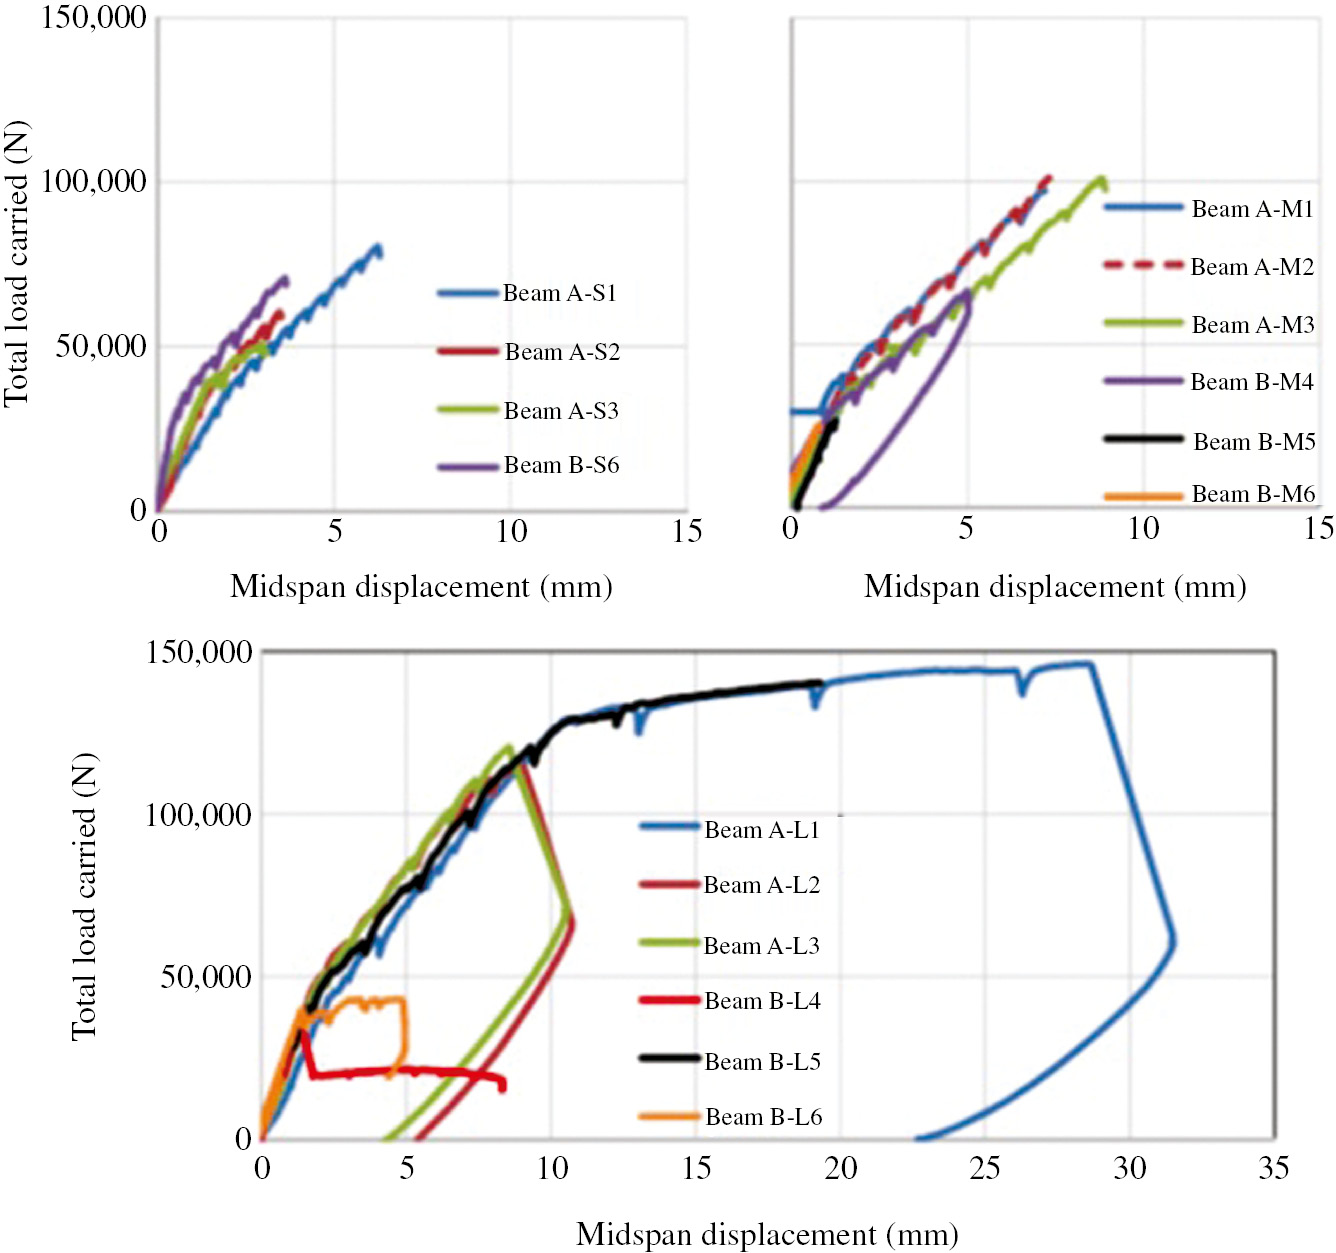
Load-displacement curves for all specimens in the S, M and L series (control specimens are A-S3, B-S6, AM-3, BM-4, A-L1, and BL-5). Nominal yield load was Py=122 kN.
The development capacity of the reinforcement was evaluated through statics as follows: from the total load P, the support reaction V was computed (V=P/2). The flexural moment in the central zone was obtained from M=V×Ls=(P/2)×0.7 m; the depth of tension zone was calculated from the analysis of the cross section at the onset of yielding and at the ultimate [see Eq. (1)] as d·(1−ξ), and the internal lever arm jd was found equal to 0.254 and 0.256 m, respectively. The total force in the two lapped pairs together is obtained from T=M/jd, and each lapped pair resists F=T/2. Therefore, from the applied load, the bar force is calculated directly:
According to the preceding discussion, the above expression approximates the bond strength only in the case of the very short bonded lengths (VS-specimens in Table 1). Note that in both concrete batches, the undamaged bond strength is 9.5 MPa with ±0.5 MPa deviation; this corresponds to 1.5√fc′ when using the true concrete strength at the time of testing. After <2% mass loss in the central region, this value deteriorated to 6.7 MPa, with ±0.6 MPa deviation, i.e. a 30% loss of bond strength. However, the development capacity of the reinforcement in the longer anchorages was seriously compromised, as depicted in Figure 12C and Table 1, particularly in cases of severe corrosion (e.g. BL4 and BL6). This finding is in agreement with previous results on specimens conducted on cantilevers under lateral load (Tastani & Pantazopoulou, 2007).
Upon failure of the specimens, longitudinal cracks were visible in the cover along the anchorage, while the network of cracks spread perpendicularly to the longitudinal axis of the specimen into the span’s constant moment region (Figure 13). In cases of severe corrosion, the cracks were developed parallel to the reinforcement early on, and upon further loading, led to sudden failure with spalling of the cover – note that the peak loads attained by the corroded specimens of group L (which could potentially develop yielding of the reinforcement) were much smaller than the nominal strengths (see Figure 12). However, uncorroded specimens with adequate lap splice length (Lb=45Db) attained yielding and extensive post-yielding strains and hardening (Figure 13C).
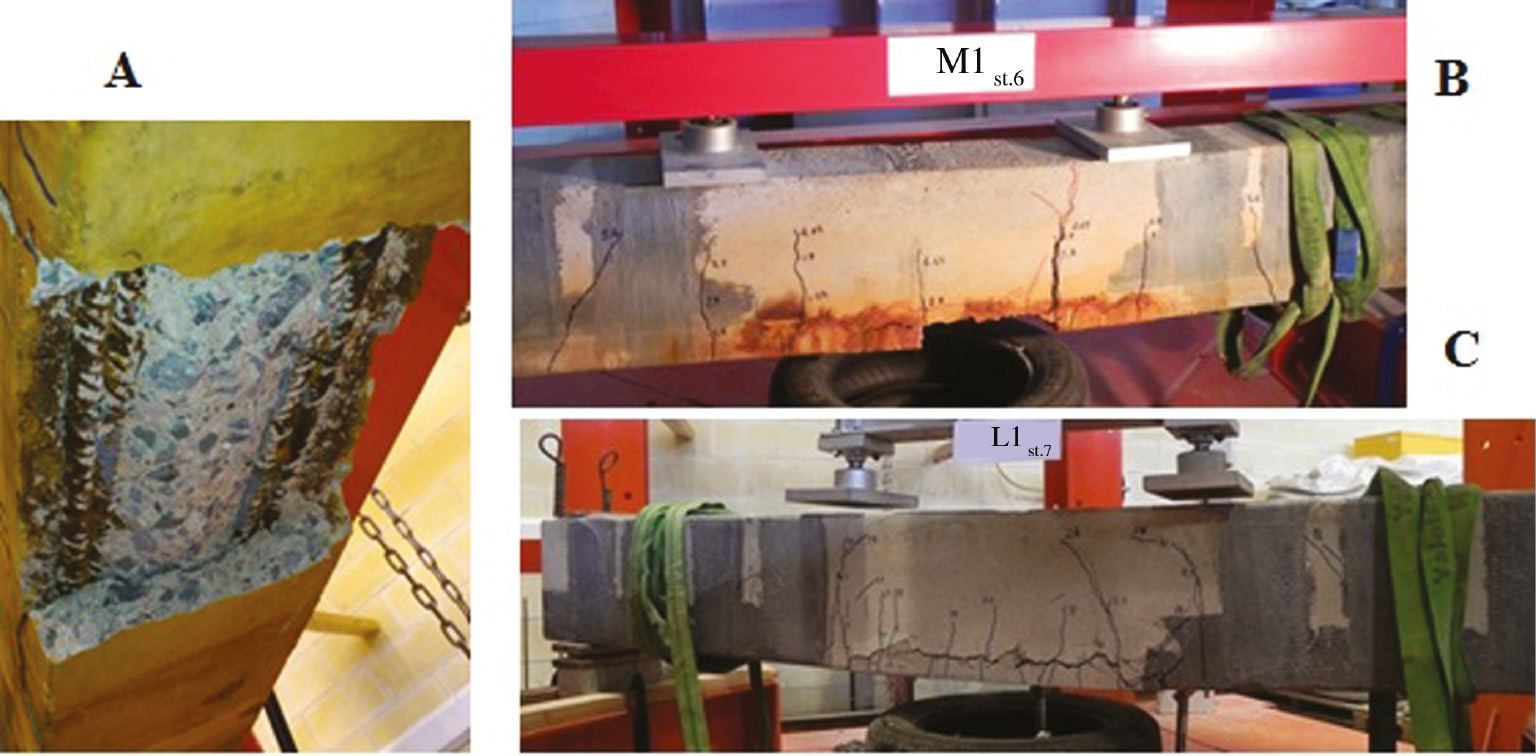
(A, B) Brittle failure of lightly corroded specimen A-M1; (C) ductile failure of uncorroded specimen A-L1.
Figure 14 summarizes the experimental findings, namely the mass loss of reinforcement, the peak load carried, and the corresponding maximum average bond stress (also listed in Table 1). To draw meaningful conclusions, values that concern corroded specimens should be compared within each one of the four groups with their counterpart control specimens with the same lap length (i.e. within the VS, S, M and L groups). At the same time, comparing the control specimens across the four groups illustrates that the full development capacity of the bar (beyond yielding) may only be attained with the longer laps in specimens (type L). The implications of corrosion on the VS-specimens are much lower than those on the average attained values on the longer specimens (only 30% reduction in the VS group, from the uncorroded to corroded bond strengths in the case of the VS-specimens). This is owing to the low level or exposure used in the case of VS-specimens (corrosion was terminated because the short lap splice cracked and would therefore not be able to hold the integrity of the specimen much longer); however, the low apparent bond strength reduction is also owing to the fact that the short lap splices effectively limited the strain magnitudes that were demanded of the reinforcement as the load that could be supported even by the uncorroded specimens was rather low to begin with. The corresponding reduction from the uncorroded average value goes up to 60% or more in the long specimens (e.g. see L4), not only in cases of increased exposure but also because the shear strain demand from the lap splice was much higher, leading to fracture of the bar at a pitted point (the weakest spot in the constant moment region controlled the entire specimen). Therefore, the probability of localized pitting that would act as a potential bar rupture point increases in longer anchorages.
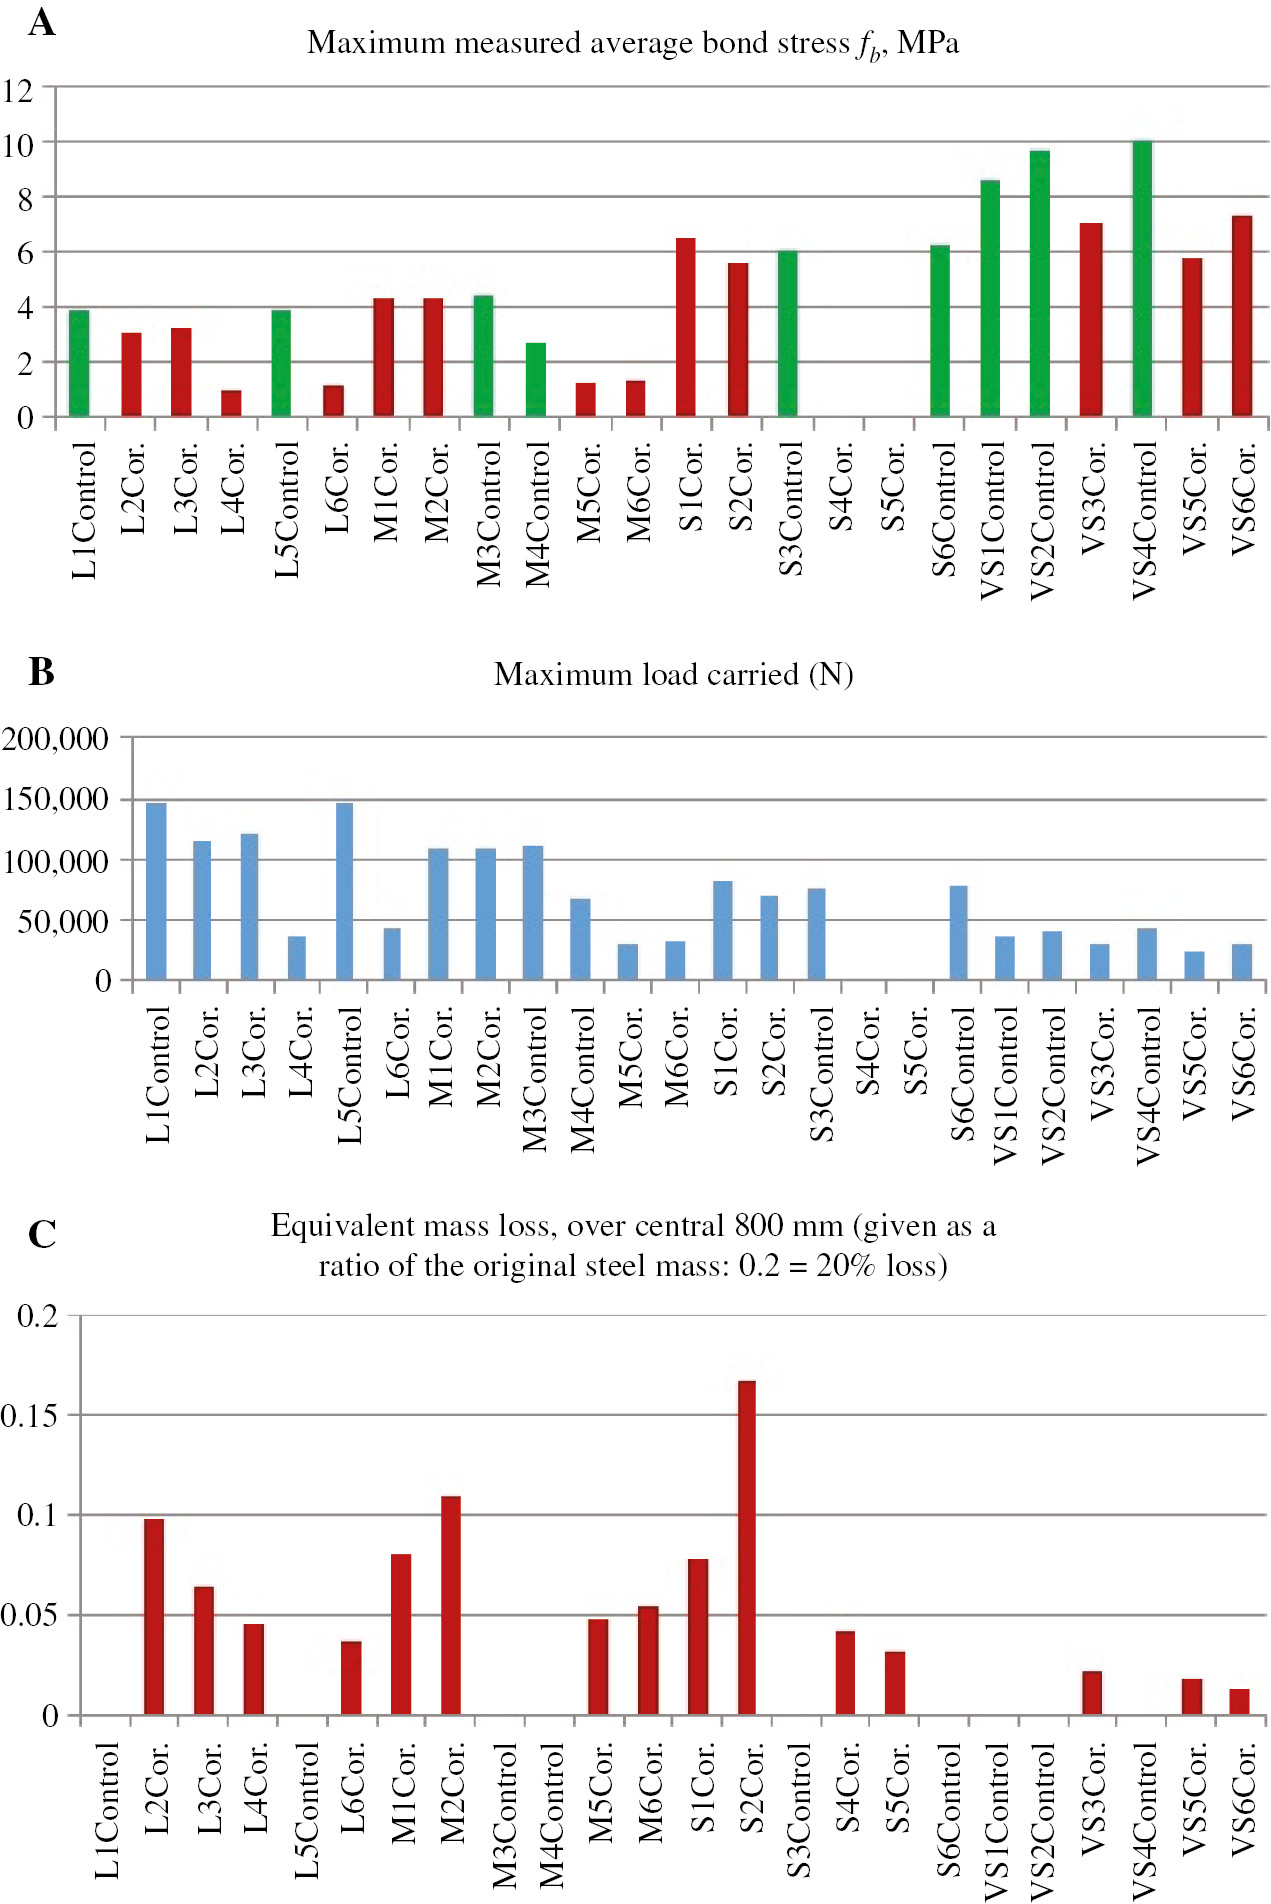
Summary of experimental results: (A) maximum average bond stress (green=uncorroded, red=corroded specimens); (B) maximum load carried by the beams; (C) total mass loss of steel based on the measured current (the ratio was calculated assuming the loss occurred over the central 800 mm of the bars). To obtain the ratio over the entire length of the specimen, assuming uniform corrosion would require to multiply the above values (also values in Table 1) with the ratio 2 * 800/Ltot, where Ltot is the available length of corrosion-active steel.
6 Conclusions
Twenty-two beam specimens containing only tensile reinforcement were tested under four-point static loading in order to study the bond strength that could be supported in the central constant moment region where tension reinforcement was lap spliced. Fifteen specimens had been conditioned to various degrees of corrosion, leading to cracking and bar section loss in the central, lapped zone. Shear failure was precluded in the shear spans (adjacent to the constant moment zone) with the addition of FRP jackets, either continuous or in strips. With the intent to control the region that would undergo corrosion, the exposed segments outside the constant moment region were coated externally with the same epoxy as that used to mount the FRP strips. The parameters of the study were (a) the length of lap splice and (b) the extent of corrosion to which the specimens had been subjected prior to load testing. Bond strength was estimated from the shorter lap lengths, both in the pristine condition as well as in the corroded state. It was found that the longer specimens experienced a more dramatic loss of strength because of the increased probability of pitting and therefore localized rupture of the reinforcement than the shorter examples. In the majority of cases (with the exception of a few bar ruptures at pitted locations), all specimens failed in the lap splice zone after extensive cracking and spalling of cover. The longest lap length in pristine condition was overly sufficient to support extensive post-yielding deformation capacity in the lap (a lap length of 45Db) and developed the reinforcement ultimate strength well beyond yielding. Medium and shorter specimens developed no ductility.
Regular flexural cracks at a spacing of 150 mm were recorded in most cases at the onset of crack stabilization. Specimens that were in pristine condition maintained their stiffness up to yielding or cracking of the splice, and therefore the splice region did not present a spurious increase of flexural stiffness and strength on account of the lap. Corroded specimens underwent slip along the lap early on, after the development of a longitudinal splitting crack parallel to the reinforcement. Bond strength was seriously compromised by corrosion, converting the mechanism of failure from ductile to brittle in the case of the L-series of specimens.
References
Almusallam AA, Al-Gahtani AS, Aziz AR, Rasheeduzzafar. Effect of reinforcement corrosion on bond strength. Construct Build Mater 1996; 10: 123–129.10.1016/0950-0618(95)00077-1Search in Google Scholar
Al-Suleimani GJ, Kaleemullah M, Basunbul IA, Rasheeduzzafar. Influence of corrosion and cracking on bond behavior and strength of reinforced concrete members. ACI Struct J 1990; 87: 220–231.10.14359/2732Search in Google Scholar
Amleh L, Mirza S. Corrosion influence on bond between steel and concrete. ACI Struct J 1999; 96: 415–423.10.14359/676Search in Google Scholar
Andrade C, Alonso C, Molina F. Cover cracking as a function of bar corrosion: part 1 – experimental test. ACI Mater Struct 1993; 26: 453–464.10.1007/BF02472805Search in Google Scholar
Auyeung Y, Balaguru P, Chung L. Bond behavior of corroded reinforcement bars. ACI Mater J 2000; 97: 214–220.10.14359/826Search in Google Scholar
Cabrera JG. Deterioration of concrete due to reinforcement steel corrosion. Cement Concrete Compos 1996; 8: 47–59.10.1016/0958-9465(95)00043-7Search in Google Scholar
Cairns J, Du Y. Residual bond capacity of corroded plain surface reinforcement. In: Proceedings, bond in concrete – from research to standards, Budapest, 2002: 129–136.Search in Google Scholar
EN 1992-1-1 (Eurocode 2). Design of concrete structures. Brussels: European Committee for Standardization, 2004.Search in Google Scholar
FIB Bulletin 10. Bond of reinforcement in concrete. State-of-art report prepared by former CEB Task Group 2.5, Ch.7/TG 4.2/WP 7. Lausanne, Switzerland: International Federation for Concrete (FIB), 2000a: 427.Search in Google Scholar
FIB Bulletin 10. Interface characteristics, degradation – corrosion, Ch.6/TG 6.1.7/WP 1. Lausanne, Switzerland: International Federation for Concrete (FIB), 2000b: 18.Search in Google Scholar
FIB Bulletin 72. Bond and anchorage of reinforcement – background to the FIB Model Code 2010. Lausanne, Switzerland: International Federation for Concrete (FIB), 2014: 170 pp. ISBN: 978-2-88394-112-0.Search in Google Scholar
Hosny A, Seliem HM, Rizkalla SH, Zia P. Development length of unconfined conventional and high-strength steel reinforcing bars. ACI Struct J 2012; 109: 655–664.10.14359/51684043Search in Google Scholar
Hussein N, Yang Y, Kawai K, Sato R. Time dependent bond behavior of corroded bars. In: Proceedings, bond in concrete – from research to standards, Budapest, 2002: 166–173.Search in Google Scholar
Lee C, Bonacci J, Thomas M, Maalej M, Khajenpour S, Hearn N, Pantazopoulou S, Sheikh S. Accelerated corrosion and repair of reinforced concrete columns using CFRP sheets. Can J Civil Eng 2000; 27: 949–959.10.1139/l00-030Search in Google Scholar
Manning, DG. The design life of structures. In: Design life of concrete highway structures – the North American scene. London: Blackie and Son, Ltd., 1992: 144–153.Search in Google Scholar
Okada K, Kobayashi K, Miyagawa T. Influence of longitudinal cracking due to reinforcement corrosion on characteristics of reinforcement concrete members. ACI Struct J 1988; 85: 134–140.10.14359/2687Search in Google Scholar
Pantazopoulou S, Papoulia K. Modelling of cover-cracking due to reinforcement corrosion in R.C. structures. ASCE J Eng Mech 2001; 127: 342–351.10.1061/(ASCE)0733-9399(2001)127:4(342)Search in Google Scholar
Pantazopoulou SJ, Bonacci JF, Sheikh SA, Thomas MDA, Hearn N. Repair of corrosion-damaged columns with FRP wraps. ASCE J Compos Construct 2001; 5: 3–15.10.1061/(ASCE)1090-0268(2001)5:1(3)Search in Google Scholar
Pantazopoulou, SJ, Tastani S, Thermou G, Triantafyllou T. Background to European seismic design provisions for the retrofit of R.C. elements using FRP materials. FIB Struct Concrete 2016; 17: 194–219.10.1002/suco.201500102Search in Google Scholar
Phillips J. The effect of corrosion on the structural performance of new and repaired one-way slabs, PhD Thesis, Department of Civil Engineering, University of Toronto, 1992.Search in Google Scholar
Stanish K, Hooton RD, Pantazopoulou SJ. Corrosion effect on bond strength in reinforced concrete. ACI Struct J 1999; 96: 915–921.10.14359/765Search in Google Scholar
Tachibana Y, Maeda K-I, Kajikawa Y, Kawamura M. Mechanical behavior of RC beams damaged by corrosion of reinforcement. In: Page CL, Treadaway KWJ, Bamforth PB, editors. Corrosion of Reinforcement in Concrete. London: Elsevier, 1990.Search in Google Scholar
Tastani SP, Pantazopoulou SJ. Experimental evaluation of FRP jackets in upgrading RC corroded columns with substandard detailing. Eng Struct 2004; 26: 817–829.10.1016/j.engstruct.2004.02.003Search in Google Scholar
Tastani SP, Pantazopoulou SJ. Behavior of corroded bar anchorages. ACI Struct J 2007; 104: 756–766.10.14359/18958Search in Google Scholar
Tastani SP, Pantazopoulou SJ. Reinforcement-concrete bond: state determination along the development length. ASCE J Struct Eng 2012; 139: 1567–1581.10.1061/(ASCE)ST.1943-541X.0000725Search in Google Scholar
Tastani SP, Brokalaki E, Pantazopoulou SJ. State of bond along lap-splices. ASCE J Struct Eng 2014; 141: 1–14.10.1061/(ASCE)ST.1943-541X.0001243Search in Google Scholar
Tureyen AK, Frosch RJ. Concrete shear strength: another perspective. ACI Struct J 2003; 100: 609–615.10.14359/12802Search in Google Scholar
Tureyen AK, Wolf TS, Frosch RJ. Strength in shear of reinforced concrete T-beams without transverse reinforcement. ACI Struct J 2006; 103: 656–663.10.14359/15181Search in Google Scholar
Wight JK, MacGregor JG. Reinforced concrete, mechanics and design, 6th ed., New Jersey: Pearson Education Inc., 2012: 1157 pp.Search in Google Scholar
©2019 Walter de Gruyter GmbH, Berlin/Boston
Articles in the same Issue
- Frontmatter
- Editorial
- Environmental degradation of reinforced concrete structures
- Review
- Corrosion behaviour of stainless steel reinforcement in concrete
- Original articles
- New service limit state criteria for reinforced concrete in chloride environments
- The performance of corroded lap splices in reinforced concrete beams
- Corrosion effects on seismic capacity of reinforced concrete structures
- Assessment of reinforced concrete structures in marine environment: a case study