Corrosion effects on seismic capacity of reinforced concrete structures
-
Antonio Bossio

 ,
Francesco Fabbrocino
,
Francesco Fabbrocino

Abstract
Recently, corrosion prevention and monitoring of reinforced concrete (RC) structures became an important issue for seismic assessment of such kind of structures. Therefore, it is important to develop adequate models to represent material degradation into seismic behavior simulation of RC structures. Because of its effects, corrosion represents the most important form of degradation for materials and structures, both for wide diffusion and the amount of danger it presents. To understand the corrosion process is critical in order to design RC structures that are able to guarantee the required service life and in order to understand the residual service life and strength of an existing structure. The seismic behavior of a corroded framed RC structure is analyzed by means of push-over analyses, which allow understanding the development of the global behavior of the structure. Three different degrees of corrosion penetration were simulated, by means of the reduction of bars and stirrups’ diameters and concrete cover cracking and spalling, and three different configurations of corrosion, depending on the number of corroded frames and sides of the structural elements.
1 Introduction
It is well known that corrosion of steel in concrete represents an important problem (Broomfield, 2007). In fact, as a consequence of corrosion, the structural capacity of reinforced concrete (RC) structures decreases because of the reduction of steel (longitudinal bars and stirrups) diameter (Rodriguez et al., 1997; El Maaddawy et al., 2005; Bossio et al., 2015a; Fernandez et al., 2016), the concrete cover cracking and spalling (Li et al., 2008; Su & Zhang, 2015; Fahy et al., 2017), and the reduction of bond between steel and concrete (Cairns et al., 2007; Berto et al., 2008; Desnerck et al., 2015; Coccia et al., 2016; Çaliskan & Aras, 2017). In order to assess existing structures, affected by corrosion, non-destructive tests and analytical models can represent good tools for practitioners (Elsener, 2003; Law et al., 2004; Imperatore et al., 2016; Bossio et al., 2017b). In particular, when a seismic assessment is required, it could be interesting to know the seismic behavior of corroded structures to identify the critical points in need of an improvement in load carrying features (Capozucca, 1995; Biondini et al., 2011; Imperatore et al., 2012, 2017; Zhu et al., 2013; Caprili et al., 2015; Bossio et al., 2015b, 2017a; Zanini et al., 2017). The push-over analyses allow to individuate the formation of plastic hinges and to understand the global behavior of the structure (Celarec et al., 2011; Bossio et al., 2017c).
2 Research significance
The aim of the present paper is to investigate about the seismic behavior of corroded RC structures, by performing push-over analyses, focusing on crucial issues to include the effects of corrosion. Push-over analyses are good tools to design a retrofit project for existing corroded RC structures, especially to define the priority of interventions and the kind of structural capacity needing to be restored.
3 Materials and geometry of the structure
In order to perform the push-over analyses, the geometry of the representative structure and the main features of materials were defined. The structure has a rectangular plant with dimensions (10.00×5.00) m2 and two interstoreys of 3.20 m, for a total height of 6.40 m. Two frames along the X direction and three frames in the Y direction, all of them characterized by a slab of clear span equal to 5.00 m, characterize the structure. All the reinforced concrete slabs are oriented with their ribs in Y direction. Both beams and columns are (30×30) cm2 with 3 cm of concrete cover, reinforced by eight longitudinal ribbed bars of diameter 14 mm and ribbed stirrups of diameter 10 mm spaced at 20 cm. Figure 1 shows the three-dimensional (3D) model of the structure. Figure 2 shows the plants of the structure, where the label T indicates the beams; the first subscript number represents the floor, while the other two subscript numbers represent the identification number of the columns that support it (e.g. T2,34, means that the beam is at the second floor and that it is supported by column number 3 and column number 4). The label P indicates the columns; the first subscript number indicates the floor, while, the second subscript number is the identification number of the column itself (e.g. P1,2 means that the column is positioned at the first floor and is identified with the number 2). The average compressive strength of concrete, fcm, is equal to 22.7 MPa with a unit weight equal to 25 kN/m3, an elastic modulus, Ec, equal to 31,000 MPa and a Poisson ratio, ν, equal to 0.2, while the average yielding strength of steel, fym, is 407 MPa. It is worth noting that all the following calculations have been performed adopting the average material properties of really tested RC members.
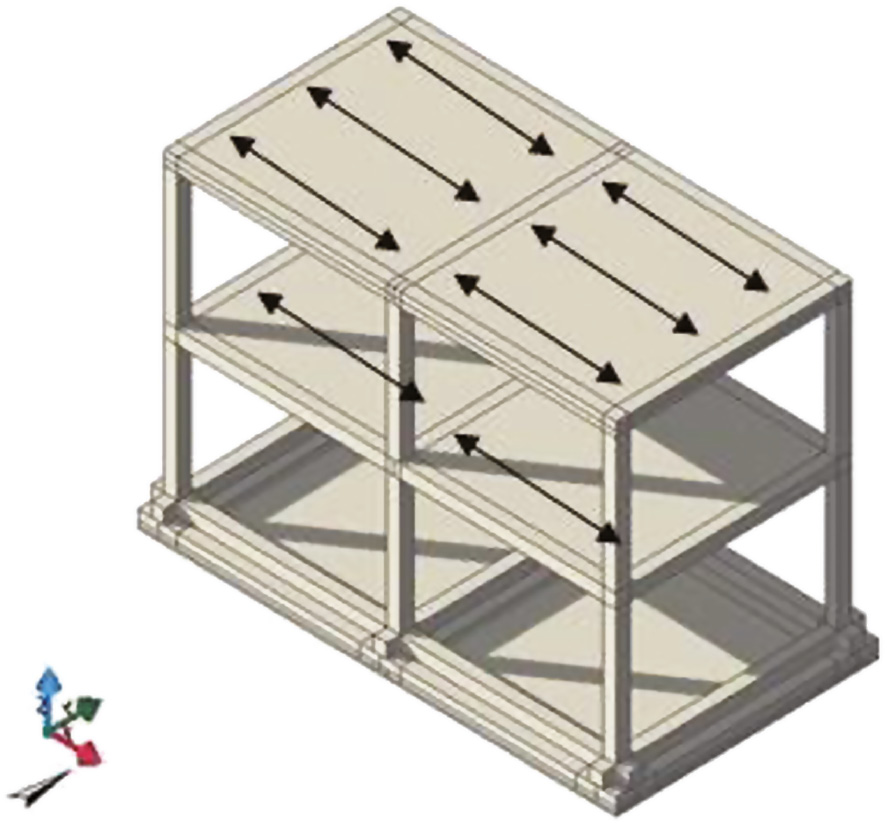
3D model of analyzed structure.

Map of first and second floor of the structure.
4 Model definition
Before performing push-over analyses, a model of a structure was defined by using dimensions of structural elements equal to some specimens tested after a 2-year long aging process (Bossio et al. (2014) and considering a simple building.
4.1 Assumptions for push-over analyses
In order to perform push-over analyses, the software SAP2000® (Computers and Structures, Inc., Walnut Creek, CA, USA) was used. The soil-structure interaction was simulated by a fixed constraint at the bottom of the column at the ground floor. According to §7.2.6 of Italian building code N.T.C. 2008 the floors were considered to be rigid, because a solid RC plate with thickness of 4 cm was considered, simulated by imposing a “diaphragm” restraint. A “Master node”, placed at the geometrical centroid of each floor was defined and coincident with the centroid of the masses. The 3D model is characterized, from a dynamic point of view, by three degrees of freedom at each level: two translations of the centroid, in two orthogonal directions, and the rotation around the vertical axis passing through the centroid of the floor.
4.2 Seismic forces
The Italian building code NTC2008 adopts a performance-based approach at limit states for the design of new structures and the verification of existing ones. The seismic action on buildings is evaluated from a “basic seismic risk”, which is the basic element to know in order to estimate the seismic actions. Seismic actions are evaluated according to the reference period (RP), which is obtained by multiplying the nominal life (NL), for a coefficient of use (CU), which is a function of the class of use [NTC2008 – §2.4.3]. Once the RP is known, the seismic design actions are defined starting from “basic seismic hazard” in terms of ordinates of the elastic spectrum, in terms of acceleration, Sa(T), and the probability of exceedance in the reference period, PVR. The Italian building code, NTC2008, provides four limit states: (i) operational limit state (LSO), (ii) limit state of damage (LSD), (iii) limit state of life safeguarding (LSV) and limit state of collapse (LSC). The first and the second are serviceability limit states (SLS), while the third and the fourth are ultimate limit states (ULS). Once the reference period of the seismic actions is known, the spectral shapes, for each place, are defined in relation to the maximum ground acceleration, ag, maximum value of the amplification factor of the acceleration spectrum, F0 and the initial period of horizontal acceleration of the spectrum, where velocity is constant, T*C. Starting from parameters ag, F0, T*C seismic action is defined according to the return period, T, of seismic action and to latitude and longitude. However, the spectrum of elastic response (of the horizontal component of the seismic forces) is defined by equations (1)–(4):
where TB, TC and TD are threshold periods of the spectrum of acceleration, defined by Italian code NTC2008, Sa(T) is the elastic spectrum of acceleration, S is a coefficient related to the subsoil condition and to topography of the site, η is a coefficient that considers the viscous damping.
Table 1 shows the main seismic parameters used to perform finite element method (FEM) simulations. Figure 3 shows the elastic spectrum of LSD and LSV, evaluated by considering a conventional damping of 5%, by using equations (1)–(4) and the values reported in Table 1. Seismic masses of the structure need to be defined in order to perform FEM analyses. Seismic masses have been evaluated according to NTC2008.
Main seismic parameters related to the geographic site.
|
S
– |
η – |
PGA (m/s2) |
ηF0Sag
(m/s2) |
TB
(s) |
TC
(s) |
TD
(s9) |
|
|---|---|---|---|---|---|---|---|
| LSD | 1.500 | 1.000 | 1.170 | 2.800 | 0.155 | 0.466 | 1.913 |
| LSV | 1.362 | 1.000 | 2.450 | 7.670 | 0.180 | 0.539 | 2.578 |
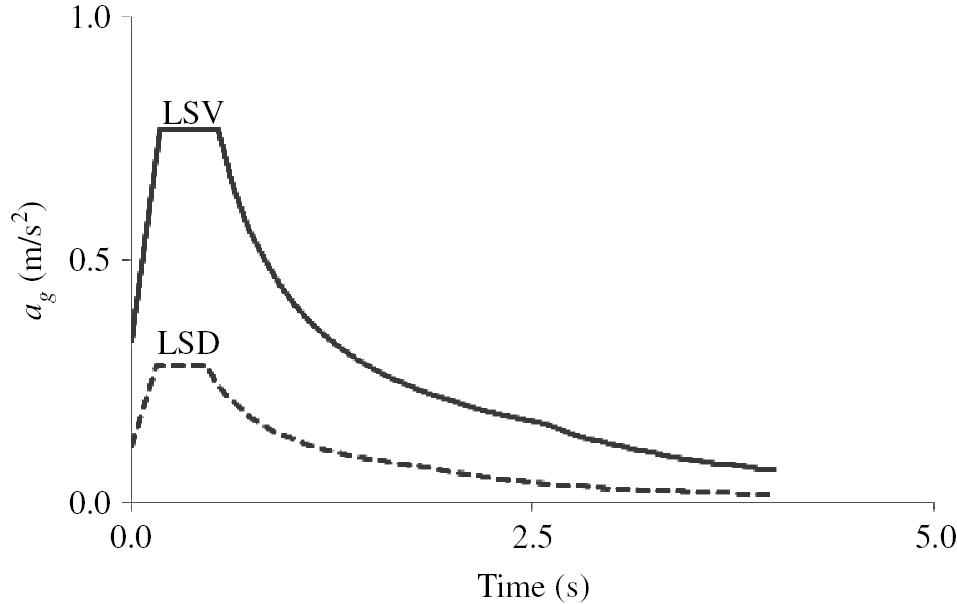
Elastic spectrum of limit state of damage (LSD) and limit state of life safeguarding (LSV).
4.3 Assumptions for FEM simulations and definition of plastic hinges
The model of the plastic hinges is based on the model proposed by NTC2008. Figure 4 shows the nonlinear relationship between the bending moment and rotations characterizing the plastic hinges, where the value of the ultimate moment, Mu, is related to the definition of the ultimate curvature, ϕu, usually considered at 20% load drop after the maximum bending moment, MMAX. Generally, it is possible to consider four phases: (i) elastic phase with no cracks [(0,0); (ϕcr, Mcr)], (ii) elastic phase with presence of cracks [(ϕcr, Mcr); (ϕy, My)], (iii) inelastic phase post-yielding [(ϕy, My); (ϕMAX, MMAX)], and inelastic phase post-peak [(ϕMAX, MMAX); (ϕu, Mu)], where ϕcr and Mcr are, respectively, curvature and bending moment at cracking, ϕy and My are yielding curvature and yielding moment, ϕMAX and MMAX are curvature and bending moment at peak and ϕu and Mu represent the ultimate values of curvature and bending moment.
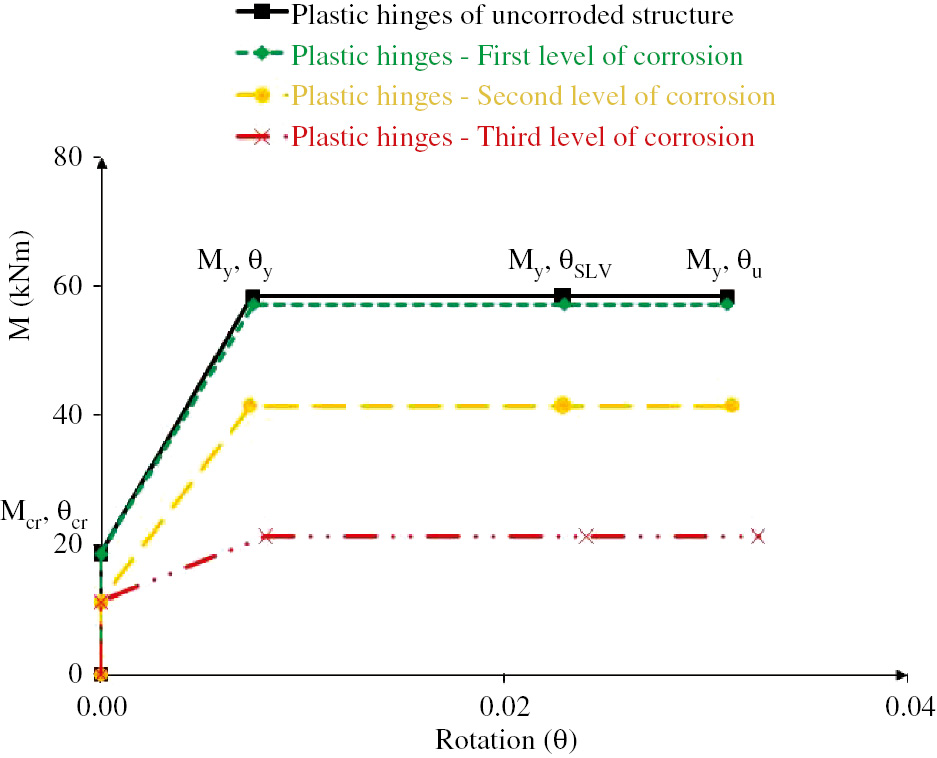
Plastic hinges used for simulations.
According to NTC2008, the regression formulations to calculate the value of the maximum yielding rotation and the value of the ultimate yielding rotation (related to their bending moment) were used to define the link between the bending moment and the rotation for plastic hinges. A simplified model to define the link between the bending moment and the rotation was used; particularly it does not take in account the softening branch after the maximum value of the bending moment, while the crack rotation, θcr, and the yielding rotation, θy, were evaluated according to equations (5) and (6), respectively.
where θcr is the rotation at cracking, ϕcr is the curvature at cracking, Lv is the shear length, θy is rotation at yielding, ϕy is curvature at yielding, h is the height of the cross section of the element, db is the diameter of the longitudinal bar, fy is the yielding stress of steel, and fc is the compressive strength of concrete.
Assuming that the elements between the two hinges are rigid with concentrated plasticity, the nonlinear relationship has been defined with reference to the chord rotation, considering the software calculation model, the value of elastic rotation due to flexural deformation needs to be subtracted from the value of the calculated elastic rotation. Thus, four plastic hinges (two of them at the top and two of them at the bottom) were associated with each column, while one plastic hinge was associated with each side of the beam. The yield rotation was calculated according to Panagiotakos and Fardis (2001).
Reduction of steel bar cross sections and cracking and spalling of concrete cover were considered, while parameters such as the loss of bond between steel and concrete and the loss of ductility of corroded steel have been neglected because these issues are still under debate.
4.4 Corrosion levels and configurations
Three different corrosion levels and configurations have been considered in order to perform FEM simulations of the structure. Particularly, levels refer to damage which occurred to structural elements, while configurations refer to their position in the structure. Corrosion levels were evaluated according to Bossio et al. (2012), in terms of reduction of the bar radius, x, considering the relationship between the concrete cover cracking and the volume of oxide inducing cracks. The concrete cover spalling was considered to occur when a 0.5 mm crack appears on a concrete surface. The first level of a generalized corrosion due to carbonatation provides a reduction of bar radius such as to induce the concrete cover cracking, but it continues to be considered part of the concrete section (reduction of radius of stirrups equal to 1 mm and a lower level of corrosion of longitudinal bars). The second level provides the spalling of the concrete cover and the reduction of the radius of the stirrups is assumed to be equal to 4 mm while the reduction of the diameter of the longitudinal bars is equal to 2 mm; furthermore, it is considered that the corner-positioned columns corrode on two sides, while central-positioned columns corrode on one side, as well as the beams. The third level of corrosion considers a reduction of the bar equal to 50% of the diameter, the spalling of the concrete cover and a residual diameter of stirrups equal to 1 mm. Corrosion levels lead to us to consider different geometry for beams and columns sections, both in terms of cross section of reinforcements and concrete; in particular, considering the second level of corrosion, the eccentricity of the vertical load on the columns should be considered, due to the unsymmetrical spalling of the concrete cover. Moreover, the concrete geometry is different. The concrete cross section, at the first level of corrosion, is (30×30) cm2; considering the second level of corrosion, concrete cross section reduces to (27×30) cm2 for central-positioned columns and (27×27) cm2 for corner-positioned columns; when corrosion occurs on all sides, the concrete cross section is equal to (24×24) cm2. Table 2 shows the values of the diameter of the bars, db, and stirrups, dst, considered, for uncorroded structures and for the three levels of corrosion, the degradation level of the concrete cover, cc, and a list of corroded/uncorroded elements referring to different configurations of corrosion. Approximately, by considering an exposure class defined as “XC4” according to the UNI EN 206:2006 with a carbon dioxide diffusion coefficient k equal to 6 mm/year0.5 and an average corrosion rate of 70 μm/year, it needs about 26, 40 and 75 years to reach the first, the second and the third levels of corrosion, respectively.
Diameters of bars and stirrups related to corrosion level and list of corroded structural elements.
| Level of corrosion | db (mm) | dst (mm) | xbar (μm) | xst (μm) | dbcor (mm) | dstcor (mm) | cc (–) |
|---|---|---|---|---|---|---|---|
| First | 14 | 10 | 100 | 1072 | 13.7 | 8 | cracked |
| Second | 14 | 10 | 1000 | 1972 | 12.0 | 6 | spalled |
| Third | 14 | 10 | 3500 | 4472 | 7.0 | 1 | spalled |
| Structural element | 1st configuration of corrosion (along one façade) | 2nd configuration of corrosion (along four façades) | 3rd configuration of corrosion (all structural elements) | ||||
|
|
|||||||
| P1,1 | Corroded on one side | Corroded on two sides | |||||
| P1,2 | Corroded on one side | ||||||
| P1,3 | Corroded on two sides | ||||||
| P1,4 | Uncorroded | Corroded on two sides | |||||
| P1,5 | Corroded on one side | ||||||
| P1,6 | Corroded on two sides | ||||||
| P2,1 | Corroded on one side | Corroded on two sides | |||||
| P2,2 | Corroded on one side | ||||||
| P2,3 | Corroded on two sides | ||||||
| P2,4 | Uncorroded | Corroded on two sides | |||||
| P2,5 | Corroded on one side | ||||||
| P2,6 | Corroded on two sides | ||||||
| T1-1-2 | Corroded on one side | ||||||
| T1-2-3 | |||||||
| T1-3-4 | Uncorroded | Corroded on one side | Corroded on four sides | ||||
| T1-4-5 | |||||||
| T1-5-6 | |||||||
| T1-2-5 | |||||||
| T1-1-6 | Uncorroded | ||||||
| T1-2-5 | |||||||
| T1-3-4 | |||||||
| T2-1-2 | Corroded on one side | Corroded on one side | |||||
| T2-2-3 | |||||||
| T2-3-4 | Uncorroded | ||||||
| T2-4-5 | |||||||
| T2-5-6 | |||||||
| T2-2-5 | |||||||
| T2-1-6 | Uncorroded | ||||||
| T2-2-5 | |||||||
| T2-3-4 | |||||||
For each corrosion level, three different configurations of corrosion were also considered. Particularly, the first configuration considers that the corrosion of one façade of the building and its structural elements are corroded along the external side only both for longitudinal bars and external legs of the stirrups, (orange colored in Figure 5), the second configuration considers the corrosion acting on all façades of the building and all external sides of structural elements are corroded both for longitudinal bars and external legs of the stirrups, while the third configuration considers the corrosion acting on all structural elements of the building along all the sides both for longitudinal bars and all legs of the stirrups. Figure 5 show the corrosion configurations.
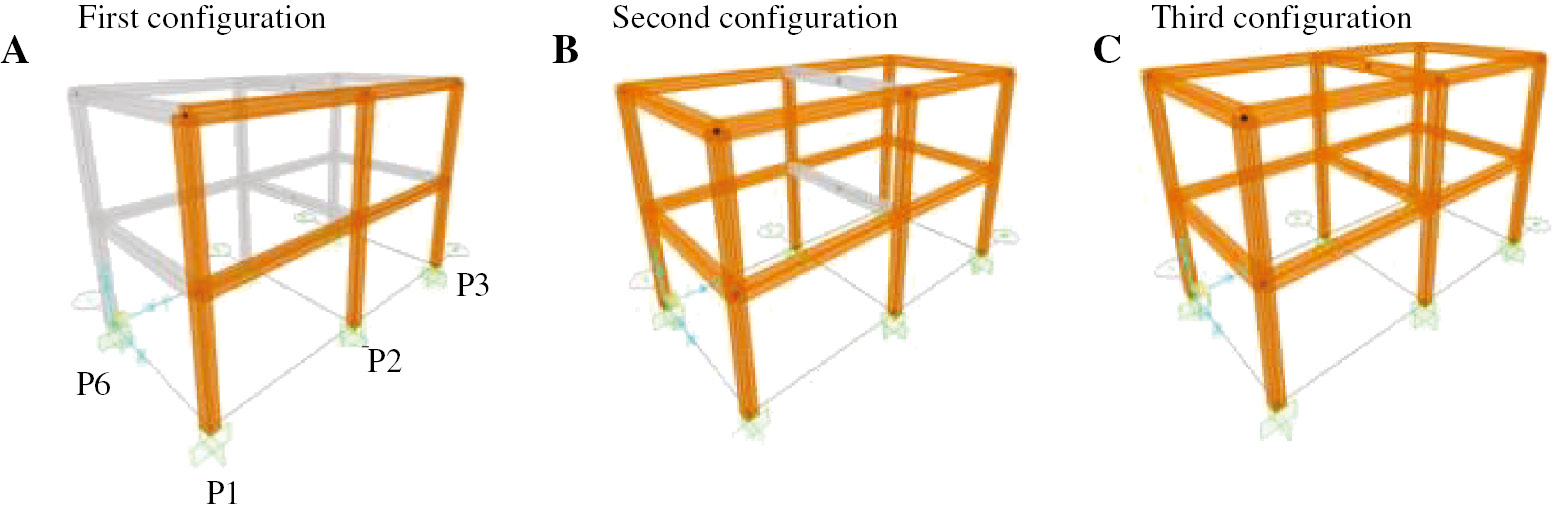
Corrosion configurations.
The behavior of the corroded columns of first corrosion configuration (Figure 5A) is not axi-symmetric, particularly referring to the plastic hinges’ formation. Considering the second configuration (Figure 5B), corner-positioned columns named “P1”, “P3”, “P4” and “P6”, are corroded along two sides, while columns named “P2” and “P5” are corroded along the external side. The behavior of the plastic hinges of the third configuration (Figure 5C) is axi-symmetric along the two main directions such that the columns and beams corroded uniformly along all sides. The push-over analyses were performed in both the X-direction and Y-direction (both positive and negative versus). Shear capacity was preliminary evaluated and related to bar reduction, x. Figure 6, shows the shear capacity related to the bar reduction for each cross-section condition.
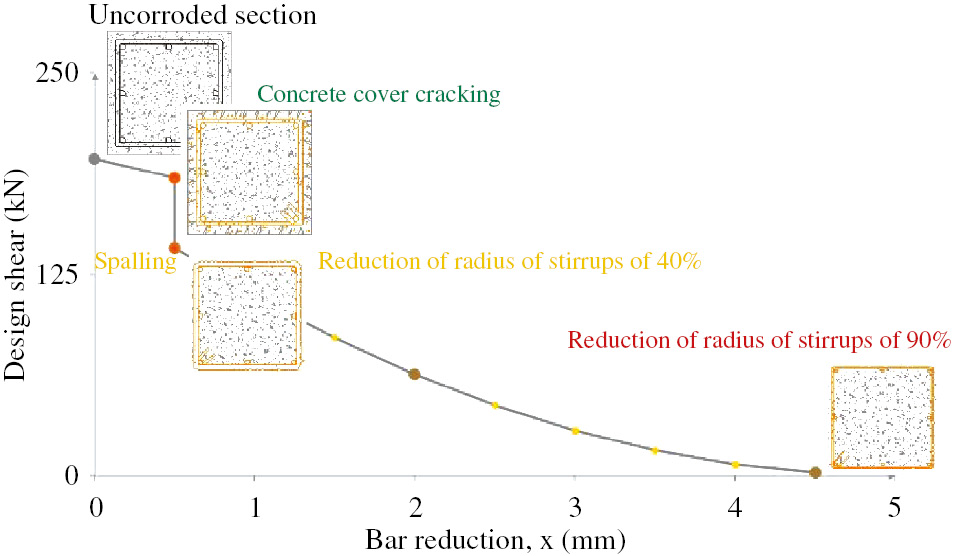
Corrosion levels and correlation between shear capacity and bar reduction.
5 Push-over analyses results and evaluation of seismic behavior of the structure
Push-over analyses were performed for the uncorroded structure and considering the corrosion levels and corrosion configurations, both considering the earthquake in X and Y directions. All results are summarized in a table reporting three parameters: available ductility index μc, peak ground acceleration (PGA) and the return period. The results obtained by performing a push-over for the uncorroded structure are compared to corroded ones. The shear failure was evaluated both according to Biskinis et al. (2004) and the Italian code NTC2008 and results have been compared to each other.
5.1 Push-over analyses: uncorroded and corroded structures
The uncorroded structure does not show any structural problem and as a result, the structure has a capacity in terms of PGA of 4.015 m/s2 with a return period of 968 years considering the X-direction, while, considering the Y-direction, it is able to resist a PGA of 3.760 m/s2 with a return period of 759 years. Figure 7 shows the bilinear curve and the capacity in the acceleration-displacement response spectrum (ADRS) space (X-direction).
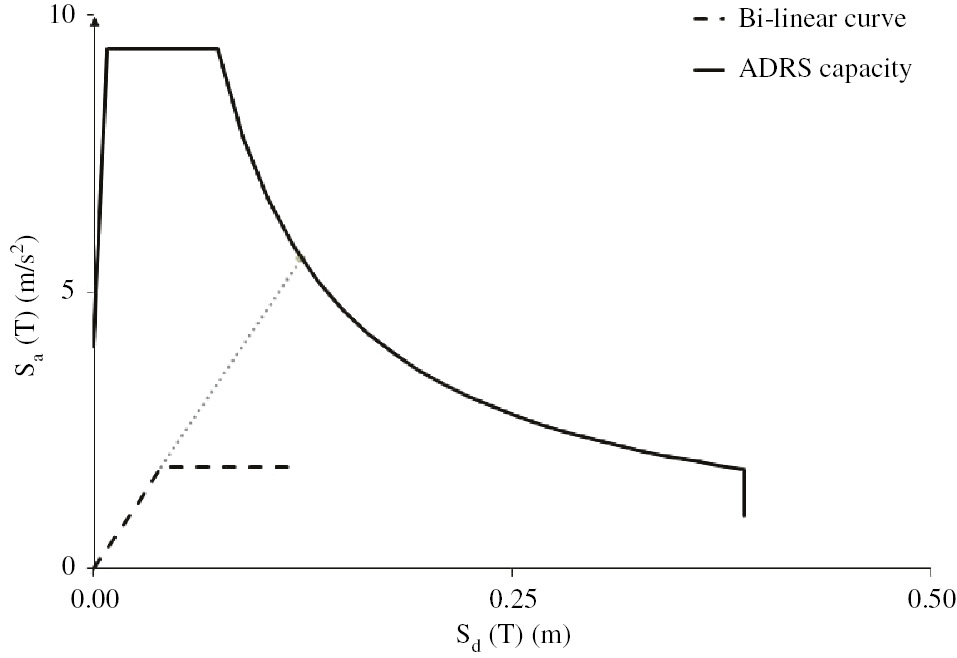
Bi-linear curve and ADRS capacity of an uncorroded structure.
Table 3 reports the value of ductility, μc, the value of capacity in terms of PGA and the return period both in absolute terms and percentage variation with respect to the uncorroded structure, according to considered levels and configurations of corrosion referring to the X-direction and Y-direction both in case of positive or negative versus. Moving between corrosion levels (first, second and third levels) values of ductility, PGA and the return period decrease as the corrosion level increases. Considering the first configuration it is interesting to notice that the values of available ductility are different if considering the X++ direction or X− direction depending on compression or traction acting on the corroded sides of the member.
Values of available ductility μc, capacity in terms of PGA, return period Tr and their percentage change related to corrosion levels and configurations.
| Levels and configurations of corrosion | Direction | μc | (%) | PGA capacity (m/s2) | (%) | T r (years) | (%) | |
|---|---|---|---|---|---|---|---|---|
| Uncorroded structure (X) | – | X++=X− | 3.061 | 0.00% | 4.015 | 0.00% | 968 | 0.00% |
| 1st level (X) | 1st config. | X++ | 3.045 | −0.53% | 4.015 | 0.00% | 968 | 0.00% |
| X− | 3.031 | −0.99% | 3.963 | −1.31% | 921 | −5.10% | ||
| 2nd config. | X++ | 3.015 | −1.53% | 3.952 | −1.59% | 911 | −6.26% | |
| X− | 3.015 | −1.53% | 3.952 | −1.59% | 911 | −6.26% | ||
| 3rd config. | X++ | 3.142 | 2.58% | 3.491 | −15.01% | 588 | −64.63% | |
| X− | 3.142 | 2.58% | 3.491 | −15.01% | 588 | −64.63% | ||
| 2nd level (X) | 1st config. | X++ | 2.952 | −3.69% | 3.824 | −4.99% | 807 | −19.95% |
| X− | 2.918 | −4.90% | 3.720 | −7.93% | 731 | −32.42% | ||
| 2nd config. | X++ | 2.982 | −2.65% | 3.573 | −12.37% | 636 | −52.20% | |
| X− | 2.982 | −2.65% | 3.573 | −12.37% | 636 | −52.20% | ||
| 3rd config. | X++ | Premature brittle failure under gravity loads | ||||||
| X− | ||||||||
| 3rd level (X) | 1st config. | X++ | 3.020 | −1.36% | 3.541 | −13.39% | 617 | −56.89% |
| X− | 2.866 | −6.80% | 3.491 | −15.01% | 588 | −64.63% | ||
| 2nd config. | X++ | 2.262 | −35.32% | 2.077 | −93.31% | 232 | −316.52% | |
| X− | 2.262 | −35.32% | 2.077 | −93.31% | 232 | −316.52% | ||
| 3rd config. | X++ | Premature brittle failure under gravity loads | ||||||
| X− | ||||||||
| Uncorroded structure (Y) | – | Y+=Y− | 2.402 | 0.00% | 3.760 | 0.00 | 759 | 0.00 |
| 1st level (Y) | 1st config. | Y++ | 2.392 | −0.42% | 3.760 | 0.00% | 759 | 0.00% |
| Y− | 2.392 | −0.42% | 3.760 | 0.00% | 759 | 0.00% | ||
| 2nd config. | Y++ | 2.347 | −2.34% | 3.692 | −1.84% | 712 | −6.60% | |
| Y− | 2.347 | −2.34% | 3.692 | −1.84% | 712 | −6.60% | ||
| 3rd config. | Y++ | 2.424 | 0.91% | 3.652 | −2.96% | 685 | −10.80% | |
| Y− | 2.424 | 0.91% | 3.652 | −2.96% | 685 | −10.80% | ||
| 2nd level (Y) | 1st config. | Y++ | 2.336 | −2.83% | 3.649 | −3.04% | 683 | −11.13% |
| Y− | 2.336 | −2.83% | 3.649 | −3.04% | 683 | −11.13% | ||
| 2nd config. | Y++ | 2.376 | −1.09% | 3.491 | −7.71% | 588 | −29.08% | |
| Y− | 2.376 | −1.09% | 3.491 | −7.71% | 588 | −29.08% | ||
| 3rd config. | Y++ | Premature brittle failure under gravity loads | ||||||
| Y− | ||||||||
| 3rd level (Y) | 1st config. | Y++ | 2.487 | 3.42% | 3.604 | −4.33% | 674 | −12.61% |
| Y− | 2.487 | 3.42% | 3.604 | −4.33% | 674 | −12.61% | ||
| 2nd config. | Y++ | 2.588 | 7.19% | 3.028 | −24.17% | 389 | −95.12% | |
| Y− | 2.588 | 7.19% | 3.028 | −24.17% | 389 | −95.12% | ||
| 3rd config. | Y++ | Premature brittle failure under gravity loads | ||||||
| Y− | ||||||||
Similarly, PGA values or the return period are different because of the asymmetry of concrete and steel cross sections due to corrosion that, in this configuration, is considered as acting on one side/facade of the structure. The maximum loss of ductility in the X-direction (~ −35%) is obtained considering the third level of corrosion and the second configuration, while considering Y-direction ductility is in a range of −2.83% (second level and first configuration of corrosion) to +7.19% (third level and second configuration of corrosion).
Referring to the PGA, as expected, values decrease as corrosion increases and so does the return period. Also, in these cases there are some differences. In terms of PGA, considering the X-direction, the values are in the range of −1.59% to −93.31%, while referring to Y-direction the range is −0.72% to −24.17%. In terms of the return period, the range is 968–232 years as maximum and minimum values in the X-direction and 759–389 as extreme values in the Y-direction.
The third considered configuration of corrosion is a very severe condition. In fact, except for first level of corrosion, it is not possible to reach a ductile failure because of the occurrence of the brittle shear failure of beams.
In general, the corrosion reduces the steel reinforcement cross section, hence the strength of the plastic hinges reduces, but the ductility increases; however, in the global response, this effect could be modified by the layout of the formation of plastic hinges, involving at different degrees the plastic hinges of the corroded elements. Furthermore, the plastic hinges represent the more desired flexural failure mode, however, the corrosion impacts first on the external stirrups, hence the shear capacity reduces earlier, and the premature combined shear failure could limit the global ductility of the structural response.
5.2 Push-over analyses performed considering the first level of corrosion
Considering the first corrosion configuration, the global behavior of the structure is not symmetric considering the seismic forces acting both along the “+” direction or “−” direction and the X and Y directions. Anyway, the global behavior of the structure is very similar to the previous case; in fact, the seismic capacity and failure mode are comparable, as shown in Figure 8.
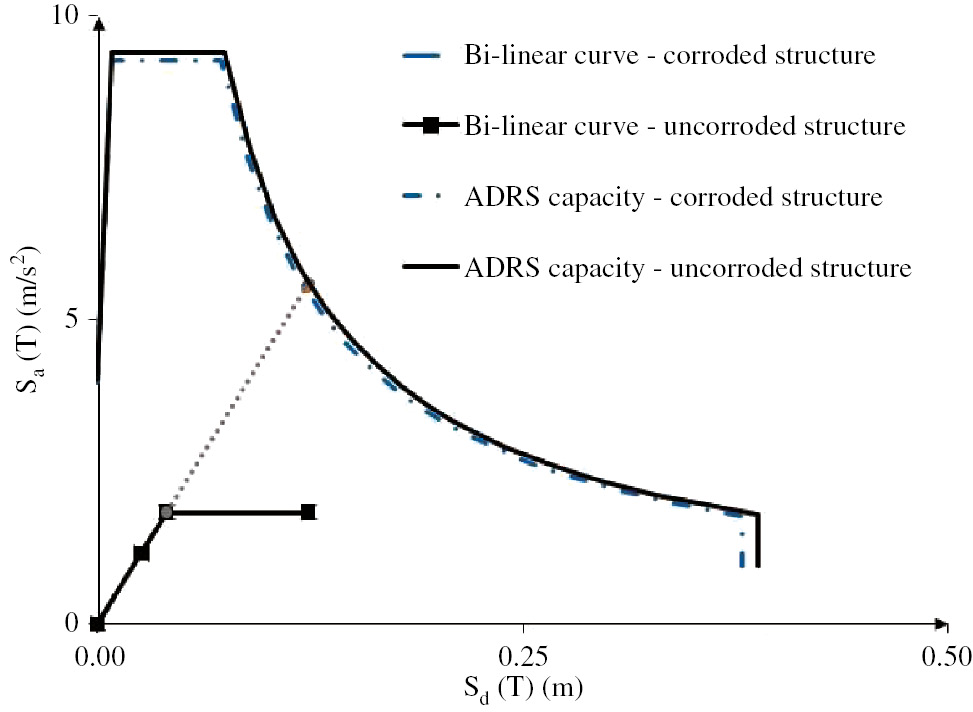
Comparison of bi-linear curves and ADRS capacity of an uncorroded structure and a structure corroded at the first level of corrosion and the first configuration.
Considering the second corrosion configuration, even if the structure is considered corroded along all sides, its global behavior is comparable to the previous cases. Both bi-linear curve and ADRS capacity are almost overlapping with respect to the previous cases. Considering both the first and the second corrosion configurations, the failure mode is a ductile failure occurring at the bottom of columns P2 and P4 (exhaustion of ductility – SLV). Considering the third configuration, it is not possible to obtain a ductile failure, but a brittle shear failure (Vr/Vs<1, where Vr is the shear capacity and Vs is the shear force, bold values in Tables 4–6) occurs at T1-4-5 and T2-4-5 beams according to Biskinis et al. (2004), while they are safe when considering Italian building code NTC2008.
Shear failure according to NTC2008 and Biskinis et al. (2004) – first level of corrosion third configuration.
| Frame | Shear failure according to NTC2008 and Biskinis et al. (2004) |
|
|---|---|---|
| NTC2008 (Vr/Vs) | Biskinis et al. (2004) (Vr/Vs) | |
| T1-1-2 | 8.57 | 4.27 |
| T1-1-2 | 8.07 | 4.02 |
| T1-1-7 | 8.57 | 4.27 |
| T1-1-7 | 8.07 | 4.02 |
| T1-2-3 | 8.07 | 4.02 |
| T1-2-3 | 8.57 | 4.27 |
| T1-3-4 | 2.77 | 1.38 |
| T1-3-4 | 2.77 | 1.38 |
| T1-4-5 | 1.48 | 0.74 |
| T1-4-5 | 1.48 | 0.74 |
| T1-5-6 | 2.77 | 1.38 |
| T1-5-6 | 2.77 | 1.38 |
| T1-7-8 | 8.07 | 4.02 |
| T1-7-8 | 8.57 | 4.27 |
| T2-1-2 | 8.86 | 4.41 |
| T2-1-2 | 7.83 | 3.90 |
| T2-1-7 | 8.86 | 4.41 |
| T2-1-7 | 7.83 | 3.90 |
| T2-2-3 | 7.83 | 3.90 |
| T2-2-3 | 8.86 | 4.41 |
| T2-3-4 | 2.77 | 1.38 |
| T2-3-4 | 2.77 | 1.38 |
| T2-4-5 | 1.48 | 0.74 |
| T2-4-5 | 1.48 | 0.74 |
| T2-5-6 | 2.77 | 1.38 |
| T2-5-6 | 2.77 | 1.38 |
| T2-7-8 | 7.83 | 3.90 |
| T2-7-8 | 8.86 | 4.41 |
Shear failure according to NTC2008 and Biskinis et al. (2004) – second level of corrosion third configuration.
| Frame | Shear failure according to NTC2008 and Biskinis et al. (2004) |
|
|---|---|---|
| NTC2008 (Vr/Vs) | Biskinis et al. (2004) (Vr/Vs) | |
| T1-1-2 | 9.10 | 4.89 |
| T1-1-2 | 9.00 | 4.83 |
| T1-1-7 | 9.10 | 4.89 |
| T1-1-7 | 9.00 | 4.83 |
| T1-2-3 | 9.00 | 4.83 |
| T1-2-3 | 9.10 | 4.89 |
| T1-3-4 | 2.72 | 1.46 |
| T1-3-4 | 2.72 | 1.46 |
| T1-4-5 | 1.42 | 0.76 |
| T1-4-5 | 1.42 | 0.76 |
| T1-5-6 | 2.72 | 1.46 |
| T1-5-6 | 2.72 | 1.46 |
| T1-7-8 | 9.00 | 4.83 |
| T1-7-8 | 9.10 | 4.89 |
| T2-1-2 | 9.20 | 4.94 |
| T2-1-2 | 8.91 | 4.78 |
| T2-1-7 | 9.20 | 4.94 |
| T2-1-7 | 8.91 | 4.78 |
| T2-2-3 | 8.91 | 4.78 |
| T2-2-3 | 9.20 | 4.94 |
| T2-3-4 | 2.72 | 1.46 |
| T2-3-4 | 2.72 | 1.46 |
| T2-4-5 | 1.42 | 0.76 |
| T2-4-5 | 1.42 | 0.76 |
| T2-5-6 | 2.72 | 1.46 |
| T2-5-6 | 2.72 | 1.46 |
| T2-7-8 | 8.91 | 4.78 |
| T2-7-8 | 9.20 | 4.94 |
5.3 Push-over analyses performed considering the second level of corrosion
Considering the second level of corrosion (in first configuration), corrosion effects start to be more visible in terms of the global seismic behavior of the structure. The ADRS curve is not overlapping to the ADSR curve of the uncorroded structure, but they are almost similar to each other as shown in Figure 9. Another important aspect is the not symmetric response considering the X+ or X− direction of seismic forces (Table 3). Considering the second configuration, the loss of global capacity of the structure is very different with respect to the uncorroded structure (Figure 10). The third configuration presents brittle failures occurring to beams named T1-3-4, T1-4-5 and T1-5-6 due to shear according to Biskinis et al. (2004) while occurring to the beam named T1-4-5 only, according to Italian building code NTC2008 (Table 5).
Comparison of bi-linear curves and ADRS capacity of an uncorroded structure and a structure corroded at the second level of corrosion and the first configuration.
Comparison of bi-linear curves and ADRS capacity of an uncorroded structure and a structure corroded at the second level of corrosion and the second configuration.
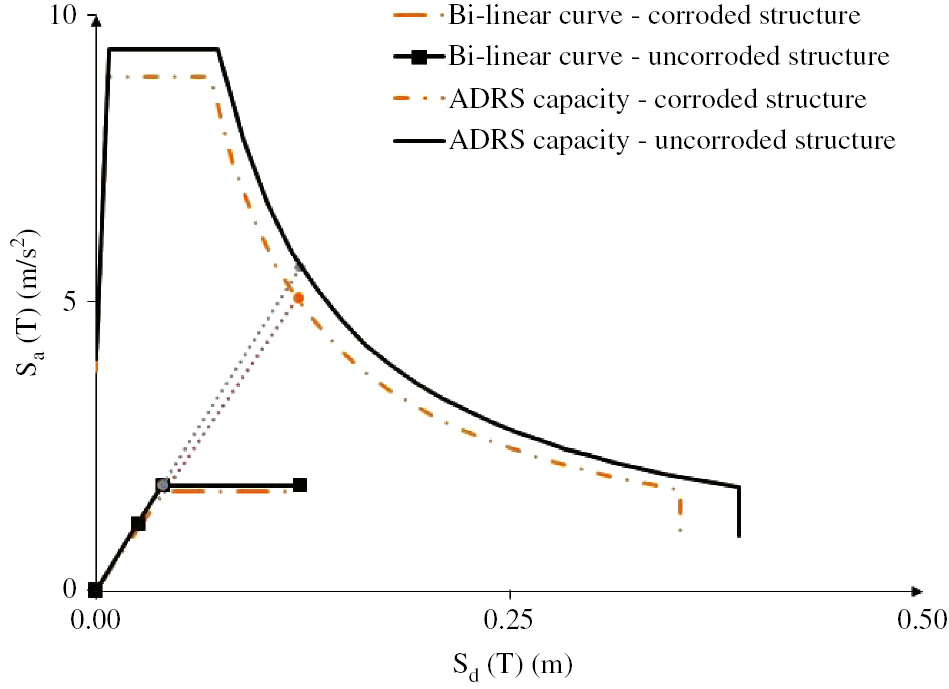
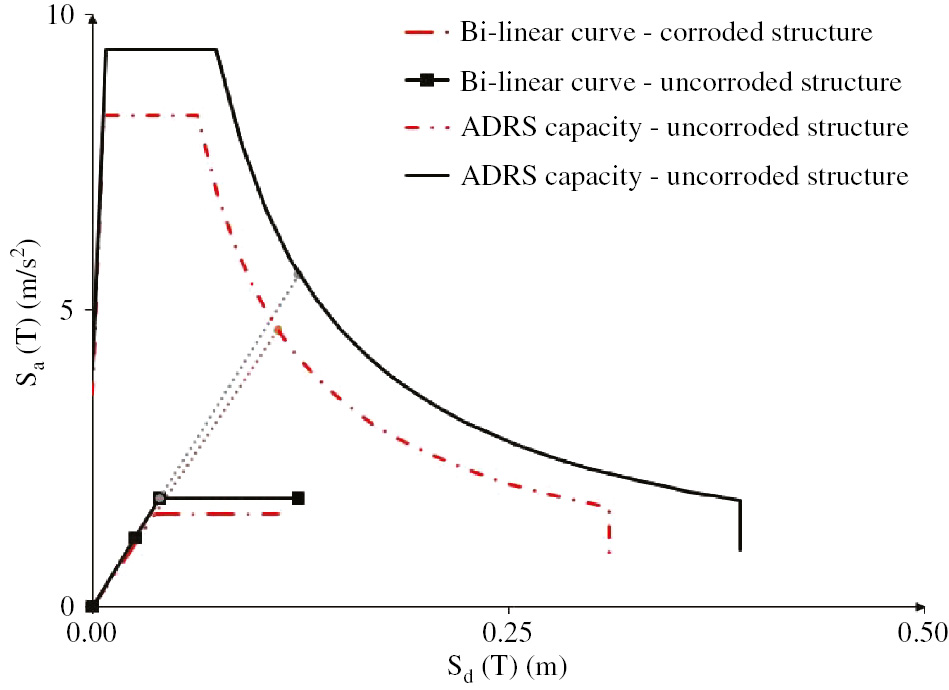
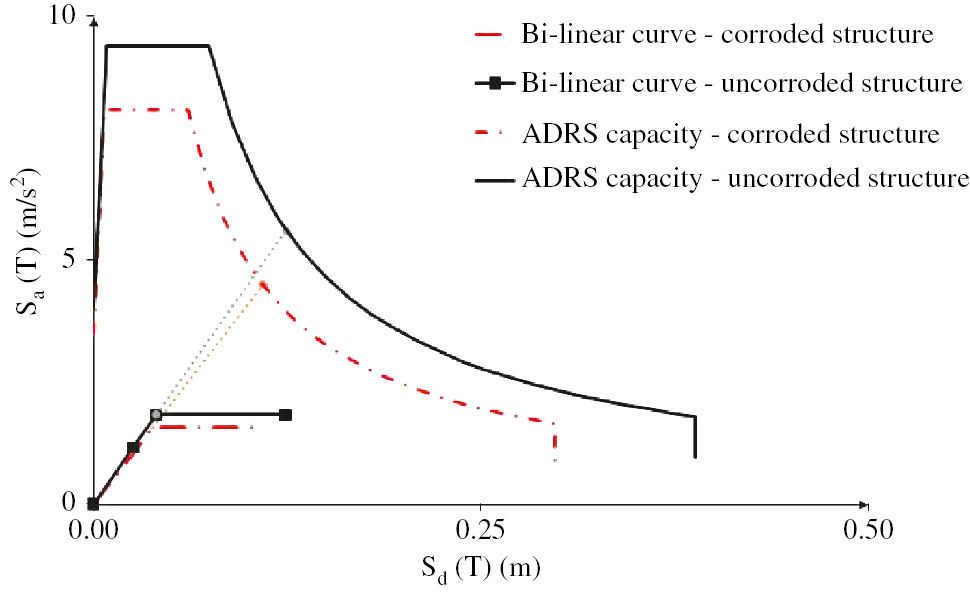
5.4 Push-over analyses performed considering the third level of corrosion
The third level of corrosion is a severe condition for the structure as the first configuration; in fact, the ADRS curve is very different with respect to the previous cases (Figure 11). Considering the second configuration, brittle shear failure occurs for the beams named T1-3-4 and T1-5-6 (Figure 12). The third configuration presents brittle failure considering both NTC2008 and Biskinis et al. (2004). Particularly, considering Biskinis et al. (2004), no structural element is safe (i.e. Vr/Vs<1) as shown in Table 6.
Comparison of bi-linear curves and ADRS capacity of an uncorroded structure and a structure corroded at the third level of corrosion and the first configuration.

Comparison of bi-linear curves and ADRS capacity of an uncorroded structure and a structure corroded at the third level of corrosion and the second configuration.
Shear failure according to NTC2008 and Biskinis et al. (2004) – third level of corrosion third configuration.
| Frame | Shear failure according to NTC2008 and Biskinis et al. (2004) |
|
|---|---|---|
| NTC2008 (Vr/Vs) | Biskinis et al. (2004) (Vr/Vs) | |
| T1-1-2 | 1.27 | 0.92 |
| T1-1-2 | 1.27 | 0.92 |
| T1-1-7 | 1.27 | 0.92 |
| T1-1-7 | 1.27 | 0.92 |
| T1-2-3 | 1.27 | 0.92 |
| T1-2-3 | 1.27 | 0.92 |
| T1-3-4 | 0.38 | 0.28 |
| T1-3-4 | 0.38 | 0.28 |
| T1-4-5 | 0.20 | 0.14 |
| T1-4-5 | 0.20 | 0.14 |
| T1-5-6 | 0.38 | 0.28 |
| T1-5-6 | 0.38 | 0.28 |
| T1-7-8 | 1.27 | 0.92 |
| T1-7-8 | 1.27 | 0.92 |
| T2-1-2 | 1.28 | 0.92 |
| T2-1-2 | 1.27 | 0.92 |
| T2-1-7 | 1.28 | 0.92 |
| T2-1-7 | 1.27 | 0.92 |
| T2-2-3 | 1.27 | 0.92 |
| T2-2-3 | 1.28 | 0.92 |
| T2-3-4 | 0.38 | 0.28 |
| T2-3-4 | 0.38 | 0.28 |
| T2-4-5 | 0.20 | 0.14 |
| T2-4-5 | 0.20 | 0.14 |
| T2-5-6 | 0.38 | 0.28 |
| T2-5-6 | 0.38 | 0.28 |
| T2-7-8 | 1.27 | 0.92 |
| T2-7-8 | 1.28 | 0.92 |
5.5 Comparison of results
Push-over analyses showed the seismic behavior of corroded reinforced concrete structures. Even if some aspects can be improved, the results obtained can represent a good starting point and a good methodology to model corroded structures. Figure 13 shows the results in terms of the return period, Tr, considering both the X-direction and Y-direction (positive verse) related to levels of corrosion.
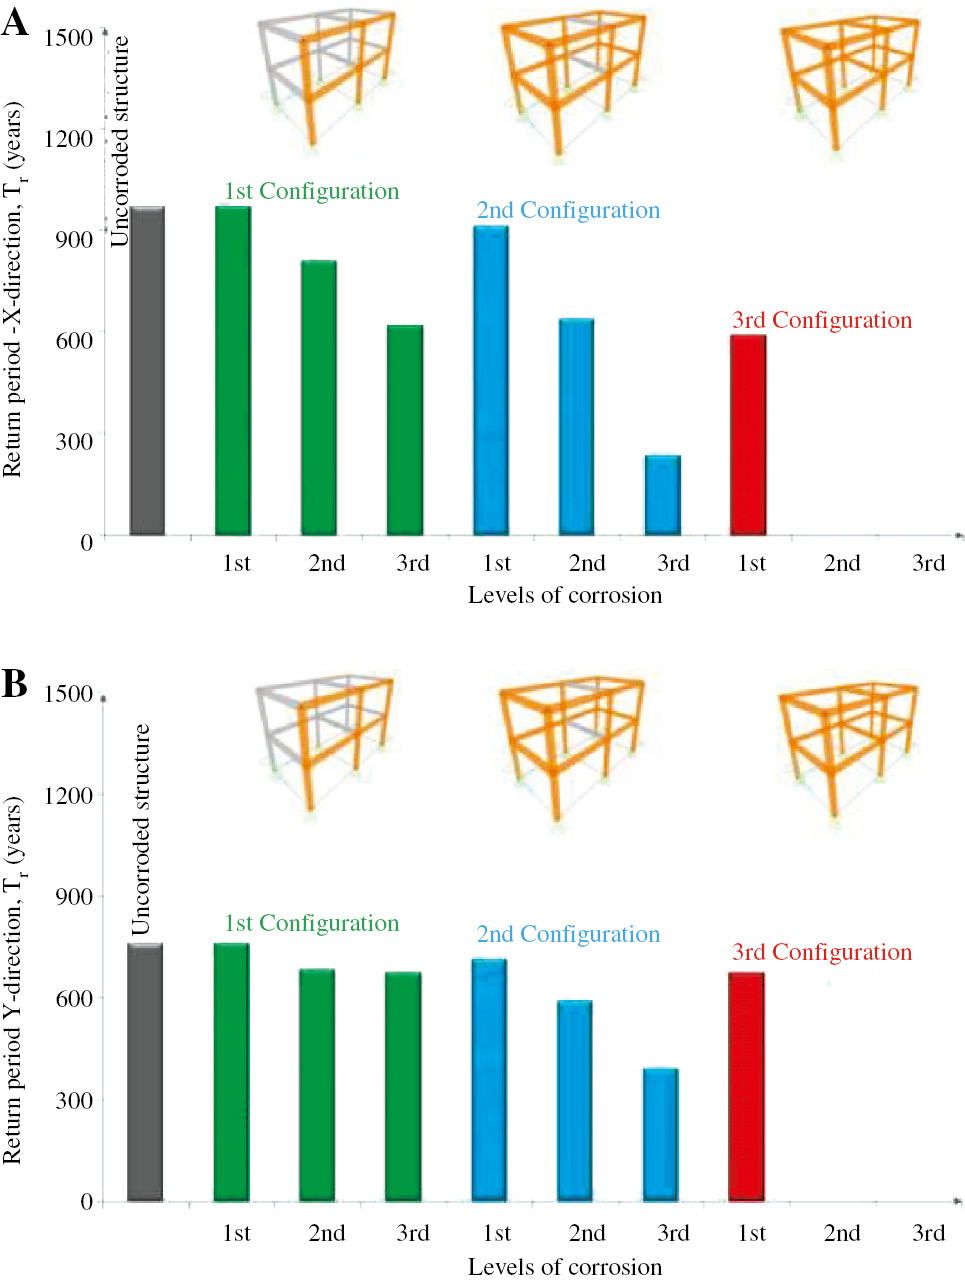
The return period, Tr, according to levels and configurations of corrosion in the case of a seismic force acting along: (A) X-direction (positive verse) and (B) Y-direction (positive verse).
The values of the return period, Tr, in the X-direction are higher than the values in Y-direction, even if they decrease rapidly as corrosion levels increase; on the other hand, the values in the Y-direction show a lower decrease rate and present less variation than the X-direction in the same configuration.
6 Conclusions
Corrosion of steel in concrete is a real issue for structural engineering. In fact, it is nearly possible to say that all existing structures older than 25 years suffer (or are starting to suffer) from problems related to corrosion. In this paper some push-over analyses have been performed on a simple uncorroded structure and results have been compared to the results obtained for corroded structures considering three different levels and three different configurations of corrosion. The main results show that corrosion influences the ductility of the structure and, as a consequence, its seismic global behavior. In some cases, corrosion changes the failure mode, triggering a brittle failure, which is surely less desirable and premature than a ductile failure. As a consequence of the variation of ductility and loss of shear capacity for the structure, there is a significant loss of capacity in terms of PGA and decrease of the return period.
The results obtained by the performed simulations describe bad seismic behavior of corroded reinforced concrete structures and real cases could have an even worse behavior because of loss of ductility of corroded steel and loss of bonds between steel and concrete, even if, referring to the latter, effects could be limited in cases of mechanical anchorage of longitudinal bars.
The presented model is simplified in order to evaluate a very innovative methodology to assess the seismic behavior of corroded structures.
Abbreviations
- ADRS
-
acceleration-displacement response spectrum
- ag
-
ground acceleration
- cc
-
concrete cover
- CU
-
coefficient of use
- db
-
diameter of the longitudinal bar – uncorroded structure
- dbcorr
-
diameter of the longitudinal bar – corroded structure
- dst
-
diameter of stirrups – uncorroded structure
- dstcorr
-
diameter of stirrups – corroded structure
- Ec
-
elastic modulus
- F0
-
amplification factor of the acceleration spectrum
- fc
-
compressive strength of the concrete
- fcm
-
average compressive strength of concrete
- fy
-
yielding stress of steel
- fym
-
average yielding stress of steel
- h
-
height of the section of the element
- LSC
-
limit state of collapse
- LSD
-
limit state of damage
- LSO
-
operational limit state
- LSV
-
limit state of life safeguarding
- Lv
-
shear length
- Mcr
-
bending moment of cracking
- MMAX
-
maximum bending moment
- Mu
-
ultimate moment
- My
-
yielding moment
- NL
-
nominal life
- PGA
-
peak ground acceleration
- PVR
-
probability of exceedance in the reference period
- RP
-
reference period
- S
-
coefficient related to subsoil condition and topography
- Sa (T)
-
spectrum of elastic response of acceleration
- Sd (T)
-
design spectrum of elastic response of acceleration
- SLS
-
serviceability limit states
- T*C
-
initial period of horizontal acceleration of the spectrum
- Tr
-
return period
- TB
-
sharp corner of the spectrum of acceleration
- TC
-
sharp corner of the spectrum of acceleration
- TD
-
sharp corner of the spectrum of acceleration
- ULS
-
ultimate limit states
- Vr
-
resistant shear
- Vs
-
acting shear
- x
-
reduction of bar radius
- ϕcr
-
curvature of cracking
- ϕMAX
-
maximum curvature
- ϕu
-
ultimate curvature
- ϕy
-
yielding curvature
- η
-
coefficient of viscous damping
- θcr
-
crack rotation
- θy
-
yielding rotation
- μc
-
ductility
- ν
-
Poisson ratio
References
Berto L, Simioni P, Saetta A. Numerical modelling of bond behaviour in RC structures affected by reinforcement corrosion. Eng Struct 2008; 30: 1375–1385.10.1016/j.engstruct.2007.08.003Search in Google Scholar
Biondini F, Palermo A, Toniolo G. Seismic performance of concrete structures exposed to corrosion: case studies of low-rise precast buildings. Struct Infrastruct Eng 2011; 7: 109–119.10.1080/15732471003588437Search in Google Scholar
Biskinis DE, Roupakias GK, Fardis MN. Degradation of shear strength of reinforced concrete members with inelastic cyclic displacement. ACI Struct J 2004; 101: 773–783.10.14359/13452Search in Google Scholar
Bossio A, Montuori M, Bellucci F, Lignola GP, Prota A, Cosenza E, Manfredi G. Indirect measure of corrosion level based on crack opening. In: Jasienko J, editor. Proceeding of 8th International Conference on Structural Analysis of Historical Constructions, Wraclaw, Poland, 15–17 October, 2012: 2305–2313.Search in Google Scholar
Bossio A, Lignola GP, Prota A, Bellucci F, Cosenza E, Manfredi G. Non invasive assessment of corrosion level in historical RC constructions. In Proceeding of 2nd International Conference on Protection of Historical Constructions. PROHITECH 2014 Boğaziçi University Publishing; Mazzolani FM, Altay G, editors. Antalya, Turkey, 7–9 May, 2014: 515–522.Search in Google Scholar
Bossio A, Monetta T, Bellucci F, Lignola GP, Prota A. Modeling of concrete cracking due to corrosion process of reinforcement bars. Cem Concr Res 2015a; 71: 78–92.10.1016/j.cemconres.2015.01.010Search in Google Scholar
Bossio A, Fabbrocino F, Lignola GP, Prota A, Manfredi G. Simplified model for strengthening design of beam-column internal joints in reinforced concrete frames. Polymers 2015b; 7: 1732–1754.10.3390/polym7091479Search in Google Scholar
Bossio A, Fabbrocino F, Lignola GP, Prota A, Manfredi G. Design oriented model for the assessment of T-shaped beam-column joints in reinforced concrete frames. Buildings 2017a; 7: 118–140.10.3390/buildings7040118Search in Google Scholar
Bossio A, Lignola GP, Fabbrocino F, Monetta T, Prota A, Bellucci F, Manfredi G. Nondestructive assessment of corrosion of reinforcing bars through surface concrete cracks. Struct Concr 2017b; 18: 104–117.10.1002/suco.201600034Search in Google Scholar
Bossio A, Lignola GP, Fabbrocino F, Prota A, Manfredi G. Evaluation of seismic behavior of corroded reinforced concrete structures, XV International Forum World Heritage and Disaster, 2017c; Naples – Capri, 15–17 June.Search in Google Scholar
Broomfield JP. Corrosion of steel in concrete: understanding, investigation and repair, 2nd ed., Oxford, UK: Taylor & Francis, 2007, First published 1997 by E & FN Spon.10.4324/9780203414606Search in Google Scholar
Cairns J, Du Y, Law D. Influence of corrosion on the friction characteristics of the steel/concrete interface. Constr Build Mater 2007; 21: 190–197.10.1016/j.conbuildmat.2005.06.054Search in Google Scholar
Çaliskan Ö, Aras M. Experimental investigation of behaviour and failure modes of chemical anchorages bonded to concrete. Constr Build Mater 2017; 156: 362–375.10.1016/j.conbuildmat.2017.08.179Search in Google Scholar
Capozucca R. Damage to reinforced concrete due to reinforcement corrosion. Constr Build Mater 1995; 9, 5: 295–303.10.1016/0950-0618(95)00033-CSearch in Google Scholar
Caprili S, Moersch J, Salvatore W. Mechanical performance versus corrosion damage indicators for corroded steel reinforcing bars. Adv Mater Sci Eng 2015; 2015: 19. Article ID 739625, doi: https://doi.org/10.1155/2015/739625.10.1155/2015/739625Search in Google Scholar
Celarec D, Vamvatsikos D, Dolšek M. Simplified estimation of seismic risk for reinforced concrete buildings with consideration of corrosion over time. Bull Earthquake Eng 2011; 9: 1137–1155.10.1007/s10518-010-9241-3Search in Google Scholar
Coccia S, Imperatore S, Rinaldi Z. Influence of corrosion on the bond strength of steel rebars in concrete. Mater Struct 2016; 49: 537–551.10.1617/s11527-014-0518-xSearch in Google Scholar
Desnerck P, Lees JM, Morley CT. Bond behaviour of reinforcing bars in cracked concrete. Constr Build Mater 2015; 94: 126–136.10.1016/j.conbuildmat.2015.06.043Search in Google Scholar
El Maaddawy T, Soudki K, Topper T. Analytical model to predict nonlinear flexural Behavior of corroded reinforced concrete beams. ACI Struct J 2005; 102: 550–559.10.14359/14559Search in Google Scholar
Elsener B. RILEM TC 154-EMC: electrochemical techniques for measuring metallic corrosion. Mater Struct 2003; 36: 461–471.10.1617/13718Search in Google Scholar
Fahy C, Wheelera SJ, Gallipoli D, Grassla P. Corrosion induced cracking modelled by a coupled transport-structural approach. Cem Concr Res 2017; 94: 24–35.10.1016/j.cemconres.2017.01.007Search in Google Scholar
Fernandez I, Herrador MF, Marí AR, Bairàn JM. Structural effects of steel reinforcement corrosion on statically indeterminate reinforced concrete members. Mater Struct 2016; 49: 4959–4973.10.1617/s11527-016-0836-2Search in Google Scholar
Imperatore S, Leonardi A, Rinaldi Z. Mechanical behaviour of corroded rebars in reinforced concrete elements. In: Frémond M, Maceri F, editors. Mechanics, models and methods in civil engineering. Lecture Notes in Applied and Computational Mechanics, 2012; vol 61. Springer, Berlin, Heidelberg.10.1007/978-3-642-24638-8_13Search in Google Scholar
Imperatore S, Leonardi A, Rinaldi Z. Strength decay of RC sections for chloride attack. Int J Struct Integrity 2016; 7: 194–212.10.1108/IJSI-09-2014-0043Search in Google Scholar
Imperatore S, Rinaldi Z, Drago C. Degradation relationships for the mechanical properties of corroded steel rebars. Constr Build Mater 2017; 148: 219–230.10.1016/j.conbuildmat.2017.04.209Search in Google Scholar
Law DW, Cairns J, Millard SG, Bungey JH. Measurement of loss of steel from reinforcing bars in concrete using linear polarisation resistance measurements. NDT&E Int 2004; 37: 381–388.10.1016/j.ndteint.2003.11.003Search in Google Scholar
Li S, Wang M, Li S. Model for cover cracking due to corrosion expansion and uniform stresses at infinity. Appl Math Model 2008; 32: 1436–1444.10.1016/j.apm.2007.06.003Search in Google Scholar
Ministero delle Infrastrutture, Decreto Ministeriale del 14/01/2008 – Norme Tecniche per le Costruzioni, 2008 [Ministry of Infrastructures, Ministerial Decree of 14/01/2008 – Technical Standards for Construction, 2008].Search in Google Scholar
Panagiotakos TB, Fardis MN. Deformations of reinforced concrete members at yielding and ultimate. ACI Struct J 2001; 98: 135–148.10.14359/10181Search in Google Scholar
Rodriguez J, Ortega LM, Casal J. Load carrying capacity of concrete structures with corroded reinforcement. Constr Build Mater 1997; 11: 239–248.10.1016/S0950-0618(97)00043-3Search in Google Scholar
Su RKL, Zhang Y. A double-cylinder model incorporating confinement effects for the analysis of corrosion-caused cover cracking in reinforced concrete structures. Corros Sci 2015; 99: 205–218.10.1016/j.corsci.2015.07.009Search in Google Scholar
Zanini MA, Faleschini F, Pellegrino C. Probabilistic seismic risk forecasting of aging bridge networks. Eng Struct 2017; 136: 219–232.10.1016/j.engstruct.2017.01.029Search in Google Scholar
Zhu W, François R, Coronelli D, Cleland D. Effect of corrosion of reinforcement on the mechanical behaviour of highly corroded RC beams. Eng Struct 2013; 56: 544–554.10.1016/j.engstruct.2013.04.017Search in Google Scholar
©2019 Walter de Gruyter GmbH, Berlin/Boston
Articles in the same Issue
- Frontmatter
- Editorial
- Environmental degradation of reinforced concrete structures
- Review
- Corrosion behaviour of stainless steel reinforcement in concrete
- Original articles
- New service limit state criteria for reinforced concrete in chloride environments
- The performance of corroded lap splices in reinforced concrete beams
- Corrosion effects on seismic capacity of reinforced concrete structures
- Assessment of reinforced concrete structures in marine environment: a case study