Influence of metal cations on inhibitor performance of gluconates in the corrosion of mild steel in fresh water
-
Kyohei Otani
 and
Md. Saiful Islam
and
Md. Saiful Islam

Abstract
The influence of metal cations on the ability of gluconates to inhibit corrosion of mild steel in a model fresh water was investigated by electrochemical impedance spectroscopy (EIS) and immersion tests. The EIS and immersion test results showed that the corrosion inhibition of mild steel in model fresh water by gluconates was improved by metal cations that have a large value of corrosion inhibitory effect of cation, Y. The X-ray photoelectron spectroscopy (XPS) analysis showed that metal cations that have larger Y values are bonded on mild steel. It was thought that metal cations with large Y values and gluconates confer a synergistic inhibition effect on the corrosion of mild steel in model fresh water.
1 Introduction
Corrosion of steels in fresh water is a serious problem in circulating cooling systems (Corrosion Division, 1987; Kimura et al., 1992) and water supply systems (Matsushima, 1980; Meroufel et al., 2017; Winston, 2011), and this kind of corrosion has been investigated extensively (Melchers, 2006; Itagaki et al, 2004; Vasyliev, 2015). Important factors in this kind of corrosion are the corrosive nature of dissolved oxygen and the concentrations of chloride and sulfate in fresh water, and the protective films (passive films) of the steels are generally destroyed by chloride ions (Engell & Stolica, 1959; Weil & Menzel, 1959; Foley, 1970; Engell, 1977). After the protective films have been destroyed, the corrosion process of mild steel changes to a coupled electrochemical reaction consisting of metal oxidation (anodic) and oxygen reduction (cathodic) reactions. The use of inhibitors has been reported to decrease the corrosion of steel in fresh water (Jones, 1996; Sastri, 1998), and gluconates are known to be effective inhibitors for the corrosion of mild steel in fresh water (Lahodny-Sarc et al., 2000; Mahdavian & Naderi, 2011). The main process by which gluconates inhibit the corrosion is adsorption of gluconate ligands on the steel surface forming a protective layer (Touir et al., 2008). Gluconate is an effective inhibitor; however, for cost and environmental reasons, it is desirable to reduce the concentration of the gluconate used.
Some reports have found that the corrosion rate of mild steel decreases with an increase in the Y value of metal cations. Here, the corrosion inhibitory effect of a cation, Y, is calculated by X×ΔV−1 (Otani & Sakairi, 2016), where X is the hardness of metal cations (Misono et al., 1967), and ΔV is the molar volume ratio that is calculated by the molar volume of a metal cation compound and the molar volume of a passive film of mild steel. The X is an indicator based on the HSAB (hard and soft acids and bases) concept (Lewis, 1923), and the HSAB concept is useful for an understanding of the bonding of metal cations to the oxide film of mild steel (Pearson, 1963). In the HSAB concept, Lewis acids and bases are divided into those comprised of “hard” and “soft” ions, and hard acids and hard bases can form stable ionic bonds. A large value of X means that the metal cation is a hard acid, and the hydroxyl groups on the outermost layer of mild steel in neutral media are categorized as hard bases. For this reason, the X value of a metal cation indicates the affinity for bonding between metal cations in solution and hydroxyl groups on the mild steel (Figure 1A).
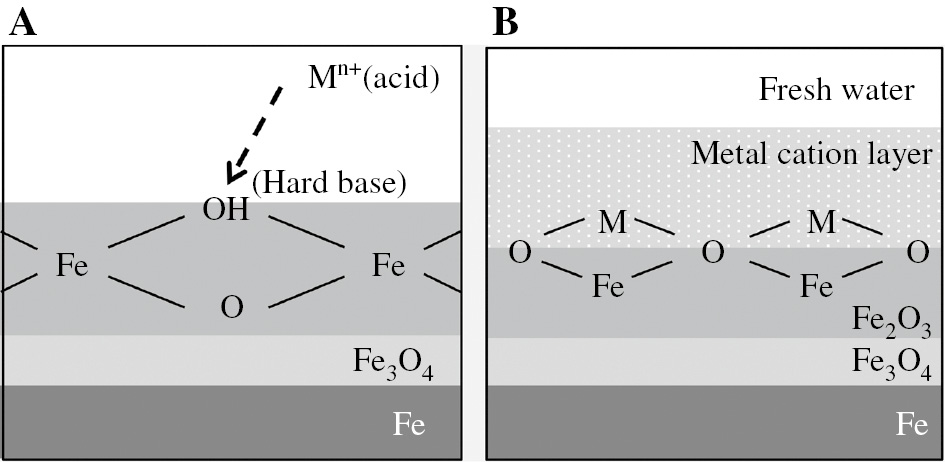
Schematic representation of (A) bonding between metal cations (acid) in solutions and OH− (hard base) on oxide film on mild steel and (B) structure of the interface between the bonded metal cation layer and the oxide layer on mild steel in the model fresh water.
It has been reported that γ-Fe2O3 is formed on the outermost layer of mild steel in neutral solutions (Iitaka et al., 1937; Mayne & Pryor, 1949; Cohen, 1952; Mayne & Menter, 1954), and metal cations in the model fresh water bonded on the mild steel here were detected by X-ray photoelectron spectroscopy (XPS) (JPS-9200, JEOL Ltd., Japan) (Otani & Sakairi, 2016). A schematic representation of the oxide layer of mild steel and the bonded metal cation layer is shown in Figure 1B. Using the molar volume of the metal cation layer, Vcat, and the molar volume of γ-Fe2O3,
A large ∆V means that differences in interatomic distance between the metal cation layer and γ-Fe2O3 is large. This suggests that internal stress may be generated at the metal cation layer and the γ-Fe2O3 interface, and such stress could be a cause of defects at the interface. For this reason, the ∆V value of the metal cation indicates the quality of the protective ability against corrosion of a metal cation layer formed on mild steel. Based on previously published results (Otani & Sakairi, 2016), it may be estimated that the corrosion inhibition of mild steel in a model fresh water by gluconates would be influenced by metal cations that have large Y values. However, the effect of metal cations on corrosion inhibition by gluconates for mild steel in fresh water has not been reported.
In the present study, the difference in the corrosion inhibition of sodium, calcium, and zinc salts of gluconate in the corrosion of steel in model fresh water was investigated by electrochemical impedance spectroscopy (EIS) and immersion corrosion tests with mass-loss measurement.
2 Materials and methods
2.1 Specimens
Mild steel sheets (composition (at%): C, 0.02; Mn, 0.18; P, 0.015; S, <0.01; and Fe) were used as specimens, and 7×7-mm specimens were used, provided with a metal wire for the electrochemical measurements. All specimens were set in epoxy resin (Struers Ltd., EpoFix Resin), and the exposed surface of the molded specimens was ground with silicon carbide abrasive paper from #400 to #4000, and finally polished by colloidal silica. Before the tests, the specimen was cleaned for 300 s, in a highly purified water and ethanol ultrasonic bath.
2.2 Solutions
Three different solutions – 1 mm NaCl with 1 mm sodium gluconate (NaG), 1 mm NaCl with 0.5 mm calcium gluconate (CaG), and 1 mm NaCl with 0.5 mm zinc gluconate (ZnG) – were used as the model fresh water. The chemical structures of the gluconates are shown in Figure 2 (Touir et al., 2008; Saremi et al., 2009; Mahdavian & Naderi, 2011), and 0.5 m H3BO3-0.05 m Na2B4O7 (borate) was added to each solution as a supporting electrolyte, and the pH of the model fresh water was maintained at around 7.3. The main metal cation in the model fresh water was Na+. All chemicals were of commercially available special grade and were obtained from Kanto Chemical Co. Ltd., Japan. The Y values of Na+, Ca2+, and Zn2+ were calculated by the molar volumes of γ-Fe2O3, NaOH, CaCO3, and Zn(OH)2 (The Chemical Society of Japan, 1st ed., 2004), and the value of the used metal cations increases in the order of Na+, Ca2+, and Zn2+ (Table 1).
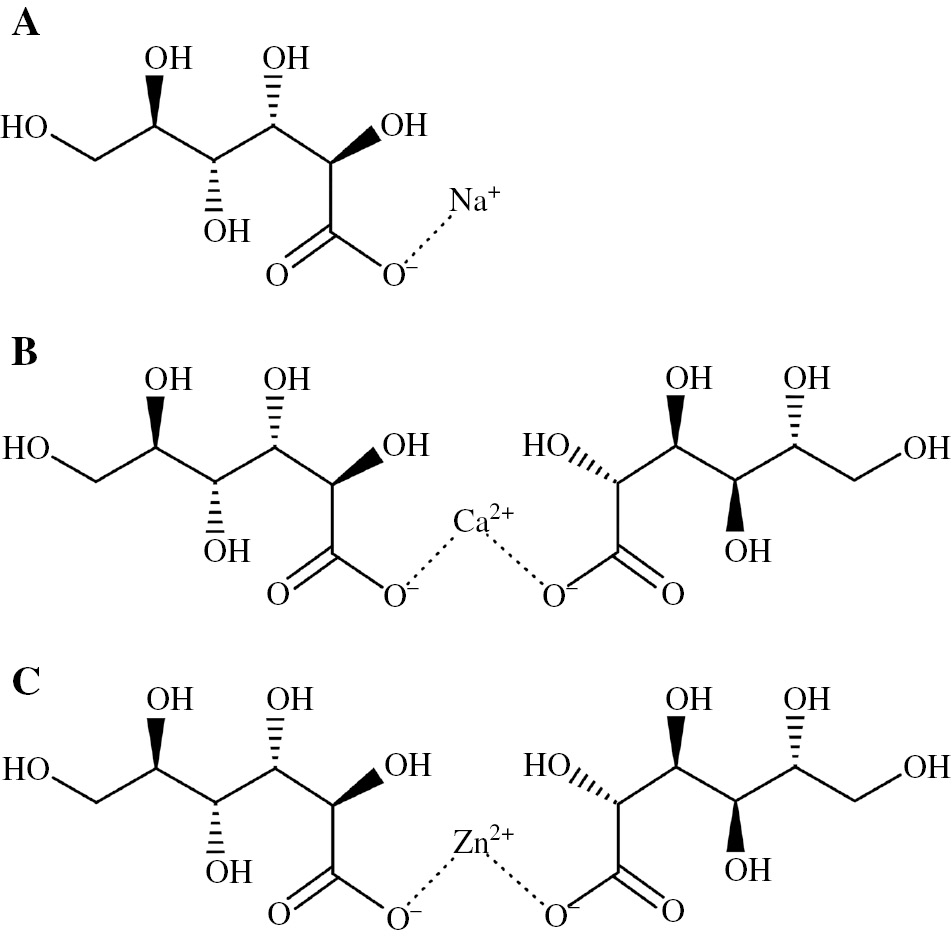
Chemical structures of (A) sodium gluconate, (B) calcium gluconate and (C) zinc gluconate.
Corrosion inhibitory effect of cation, Y, hardness of metal cations, X, and molar volume ratios, ΔV of used metal cations.
| Metal cation | Na+ | Ca2+ | Zn2+ |
|---|---|---|---|
| Corrosion inhibitory effect of cation, Y | 0.26 | 2.59 | 6.65 |
| Hardness of metal cation, X | 1.01 | 2.59 | 4.64 |
| Molar volume ratio, ΔV | 0.26 | 1.00 | 1.43 |
2.3 Corrosion tests
2.3.1 Electrochemical impedance measurements
Electrochemical impedance measurements were carried out in a three-electrode cell using a potentiostat (CompactStat, Ivium Technologies, Netherlands). Before the measurements, the specimens were immersed in the model fresh water for 3.6 ks (1 h) or 86.4 ks (24 h) at 25°C. An 18-cm2 Pt plate and an Ag/AgCl-saturated KCl electrode were used as counter and reference electrodes. Electrochemical impedance measurements were carried out in the frequency range from 1 mHz to 10 kHz, and the modulation amplitude of the applied sinusoidal wave was 10 mV. Reproducible data were obtained in all electrochemical tests.
2.3.2 Immersion corrosion tests
Specimens were immersed in the model fresh water for 86.4 ks (24 h) at 25°C. The mass of a specimen was measured before and after the test. Before and after the immersion corrosion tests, the surfaces of the specimens were observed by a scanning electron microscope (SEM) (JSL6510-LA, JEOL Ltd., Japan). The surface of the immersed specimens were analyzed by an XPS using a monochrome Al Kα X-ray source (1486.6 eV). The area analyzed by the XPS in the experiments was 1×1 mm. All XPS spectra were calibrated using the C 1s peak (C–C, C=C) with a fixed value of 285.0 eV. The pH values of the test solutions before and after the immersion tests were measured by a pH meter (CyberScan 6000, Eutech Instruments Pte. Ltd., Singapore).
3 Results and discussion
3.1 The electrochemical impedance spectroscopy analysis
EIS was carried out to determine the differences in inhibition of the gluconates in the model fresh water. Figure 3 shows (A) impedance plots of a Bode diagram and (B) phase shift plots of a Bode diagram of the EIS of the mild steel after immersion for 24 h in the model fresh water. The magnitude of the impedance at low frequencies in the Bode plots indicates the corrosion resistance of the mild steel in the model fresh water, and the magnitude represents the inhibition by the inhibitors. From the magnitudes shown in Figure 3, zinc gluconate is the more effective inhibitor than the other gluconates for corrosion inhibition of mild steel in the model fresh water. The fitted lines calculated by an equivalent circuit are also shown in Figure 3A and B, and Figure 3C shows the used equivalent circuit. This equivalent circuit models an electrode with protective films having defects. In Figure 3C, Rsol represents the solution resistance, CPEf represents the constant phase element of the protective film, Rd is the resistance of defects in the protective film, Rct is the charge transfer resistance at the defect sites, and CPEdl is the constant phase element of the double layer at the defect sites in the protective film. Figure 3 shows that the fitted lines correspond to the plots of the experimental data. This suggests that the equivalent circuit is acceptable for the surface situation of the mild steel in the model fresh water and that the protective films of the mild steel have defects in the model fresh water.
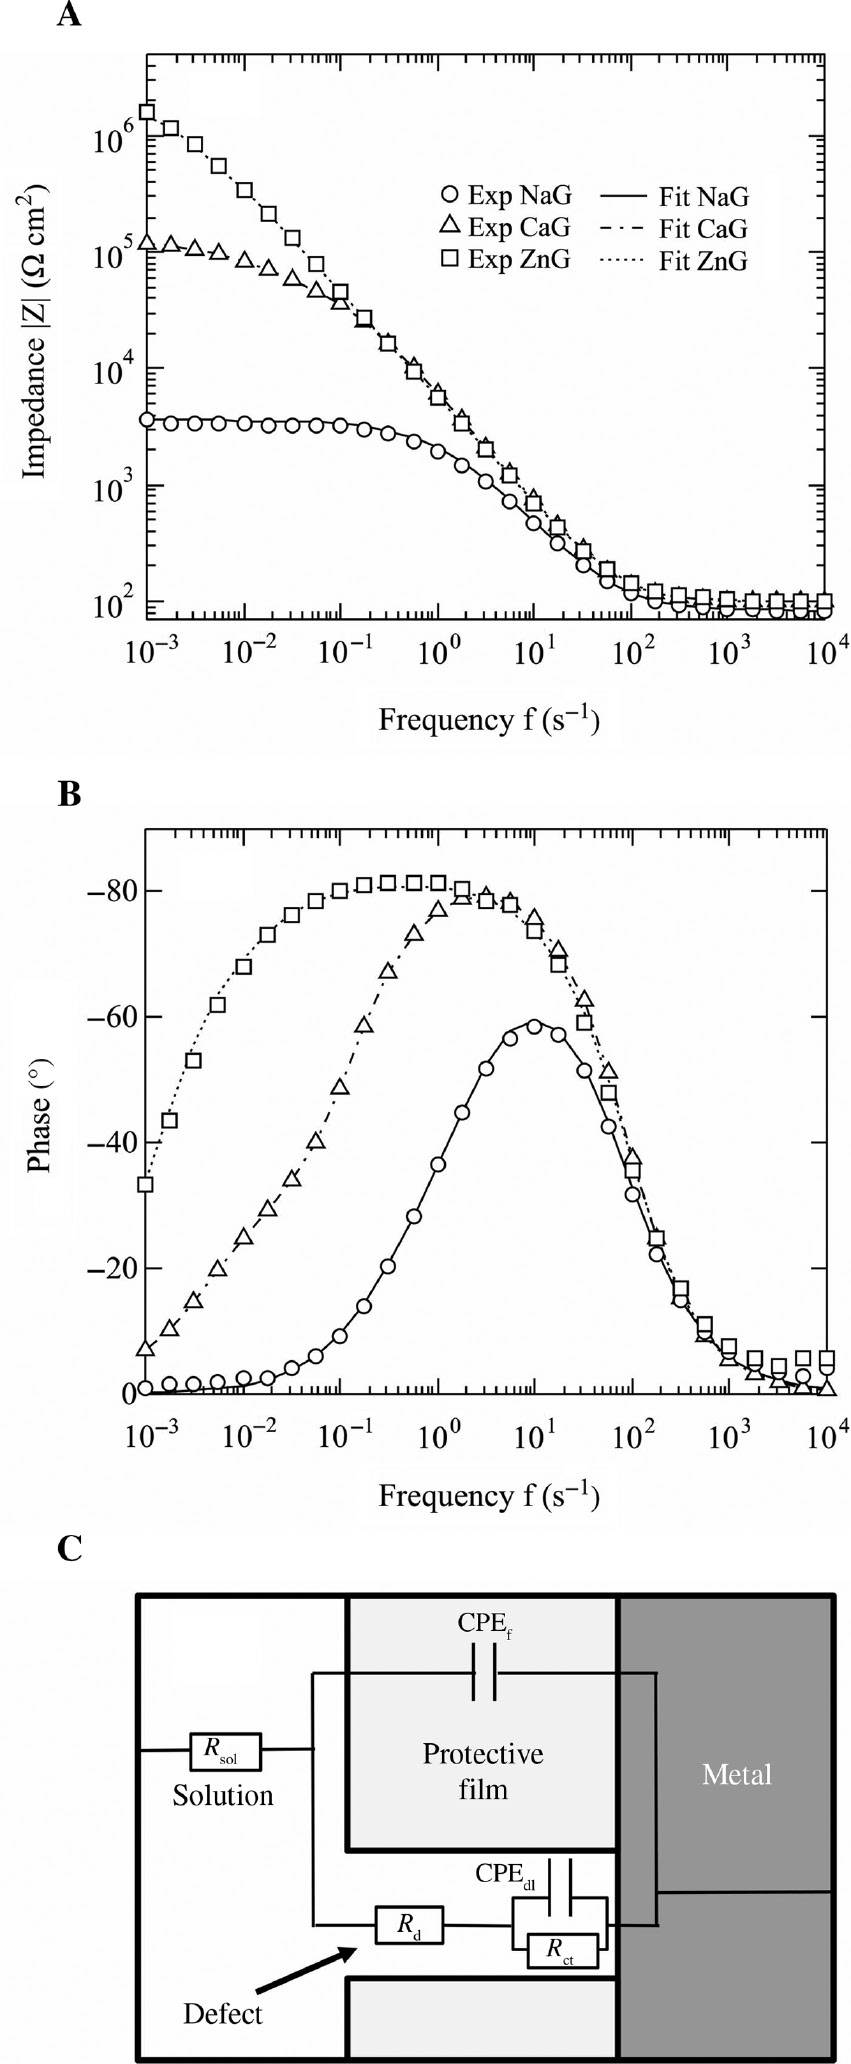
(A) Impedance and (B) phase shift Bode diagrams of the electrochemical impedance spectroscopy of the specimens after immersion for 24 h in the model fresh water; fitted lines calculated by the equivalent circuit. (C) Equivalent circuit superimposed on a schematic diagram of a mild steel electrode with a protective film having a defect.
The fitted parameters of the equivalent circuit are shown in Table 2. The values of ndl and nf indicate the capacitance ratios of CPEdl and CPEf. The corrosion resistance, Rc (=Rct+Rd), was calculated, and the results are shown in Table 2. The Rc shown in Table 2 indicates that the corrosion resistance of the specimens after immersion for 24 h in the model fresh water decreases in the order ZnG>CaG>NaG. It suggests that metal cations with large Y values and gluconates confer a synergistic inhibition effect on the corrosion of mild steel in a model fresh water. The CPEdl value in NaG after immersion for 24 h is 35 μsn Ω−1 cm−2, and 6.0 and 3.6 μsn Ω−1 cm−2 with CaG and ZnG. This decrease in the CPE values of the double layer may be attributed to a decrease in the defect area of the protective film due to the bonding of metal cations.
Calculated values of electrochemical impedance parameters of mild steel in the model fresh water.
| Solution | Immersion time (h) | Rct (kΩ cm2) | Cdl (μF cm−2) | ndl | Rd (kΩ cm2) | Cf (μF cm−2) | nf | Rc (kΩ cm2) |
|---|---|---|---|---|---|---|---|---|
| NaG | 1 | 105 | 36.7 | 0.78 | 120 | 13.3 | 0.89 | 225 |
| CaG | 1560 | 0.8 | 0.78 | 2100 | 6.8 | 0.91 | 3660 | |
| ZnG | 1100 | 3.3 | 0.74 | 2375 | 6.7 | 0.89 | 3475 | |
| NaG | 24 | 5 | 24500 | 0.77 | 3 | 11 | 0.83 | 9 |
| CaG | 85 | 6.0 | 0.77 | 62 | 17 | 0.94 | 147 | |
| ZnG | 433 | 3.6 | 0.78 | 760 | 13.5 | 0.91 | 1193 |
The values of Rc as a function of Y after different immersion times are shown in Figure 4. The results show that the value of Rc increases with increases in Y at both immersion times. The difference of the corrosion resistance in ZnG between immersions for 24 h and for 1 h is smaller than that of the other model fresh water. These results suggest that the metal cations that have large Y values in the model fresh water increases the corrosion inhibition ability of gluconates and that the improved corrosion inhibition ability of gluconates may be maintained after immersion for 24 h.
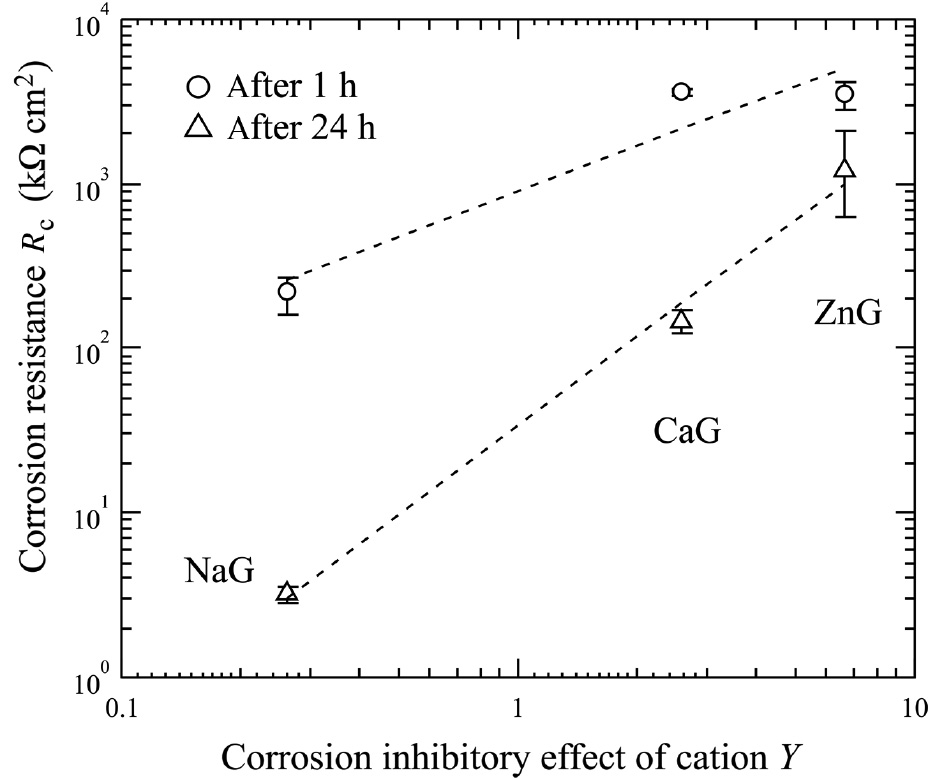
Values of Rct plotted with Y at the different immersion times.
3.2 Immersion corrosion tests
The results of the EIS showed that the corrosion resistance of the specimens after immersion for 24 h was changed with contained metal cations in the model fresh water; however, changes in the appearance of the specimen surfaces were not observed by the naked eye. High-resolution SEM observations of the specimen surfaces after immersion were carried out. Figure 5 shows the SEM images of specimen surfaces (A) before immersion, and after immersion for 24 h in (B) NaG, (C) CaG, and (D) ZnG. The specimen before immersion has a smooth surface (Figure 5A). There are many pits and corrosion products on the specimen after immersion in NaG (Figure 5B). The pits and corrosion products on the specimen after immersion in CaG are decreased compared with those on the specimen after immersion in NaG (Figure 5C). A few pits and a smooth surface are observed on the specimen after immersion in ZnG (Figure 5D). Almost no clear change in surface morphology was found in the immersed specimen in ZnG as shown in Figure 5D; however, the Rc value obtained from the EIS measurements in ZnG decreased with time as shown in Figure 4. This suggests that the EIS is a highly sensitive technique to analyze the corrosion resistance of mild steel in model fresh water. The results of the SEM observation suggest that localized corrosion of the mild steel decreases with increase in Y value.
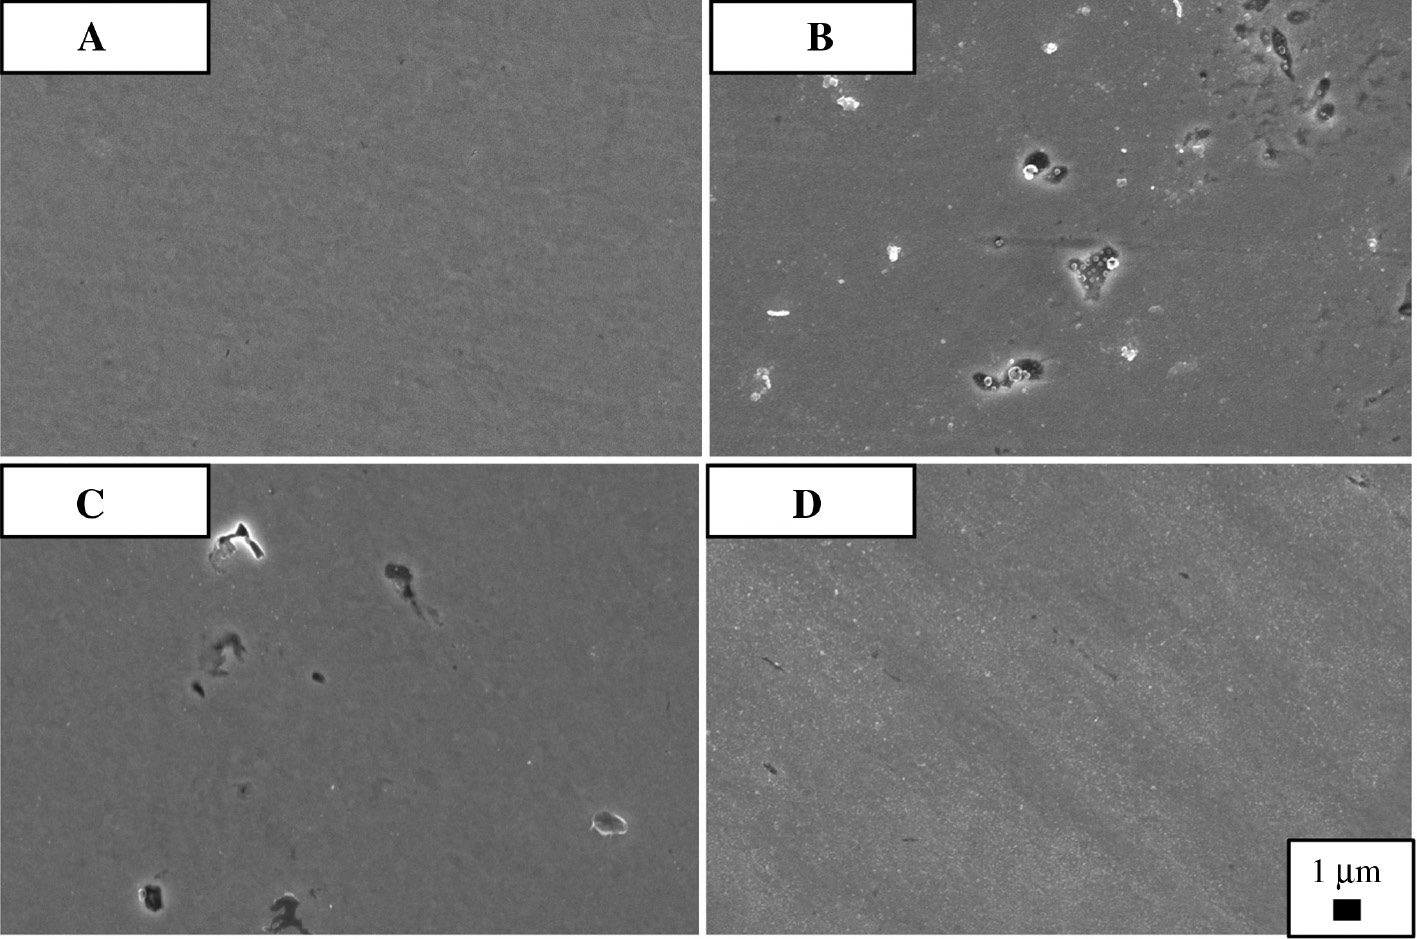
SEM images of the specimen surface (A) before immersion and after immersion for 24 h in (B) NaG, (C) CaG and (D) ZnG.
The corrosion rates calculated from mass loss after immersion for 24 h in model fresh water as a function of Y are shown in Figure 6. The density of iron, 7.874 g/cm3, was used to calculate the corrosion rates (The Chemical Society of Japan, 2nd ed., 2004). The corrosion rate of the mild steel decreases with an increase in the Y value.
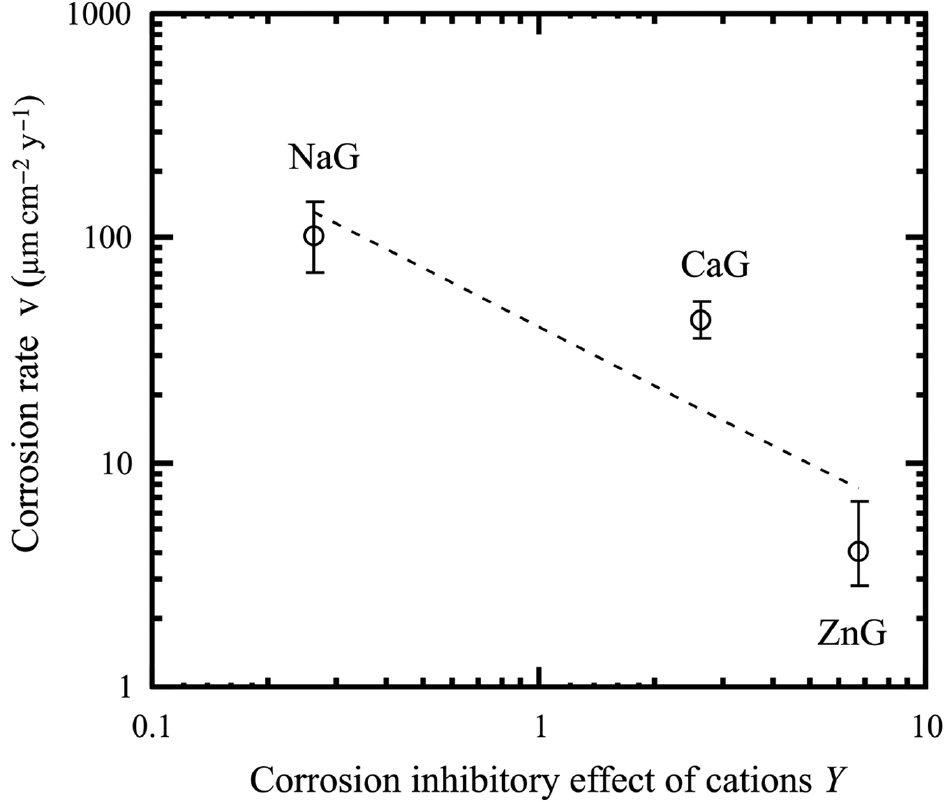
Corrosion rates as a function of Y.
The XPS surface analyses of the immersed specimens were carried out to determine the adsorption of gluconates and the bonding of metal cations on the specimens. Figure 7 shows the XPS narrow spectra of C 1s on specimens after immersion for 24 h in (A) NaG, (B) CaG, and (C) ZnG. The C 1s spectra could be deconvoluted into three peaks indicating three chemical forms of C present on the mild steel surface (Figure 7A–C). The peaks at 285.0 eV can be attributed to the C–C, C=C bonds, and the peaks at 287.0 eV can be attributed to the carbon atom of the C–O bond (Subhadra et al., 2012). An XPS narrow spectrum of C 1s on sodium gluconate powder is shown in Figure 7D, with a peak at 288.5 eV. From Figure 7D, the peaks at 288.5 eV in Figure 7A–C may be attributed to the adsorbed gluconates. These results suggest that gluconates are adsorbed on the mild steel and form a protective layer of gluconates after the immersion in the model fresh water.
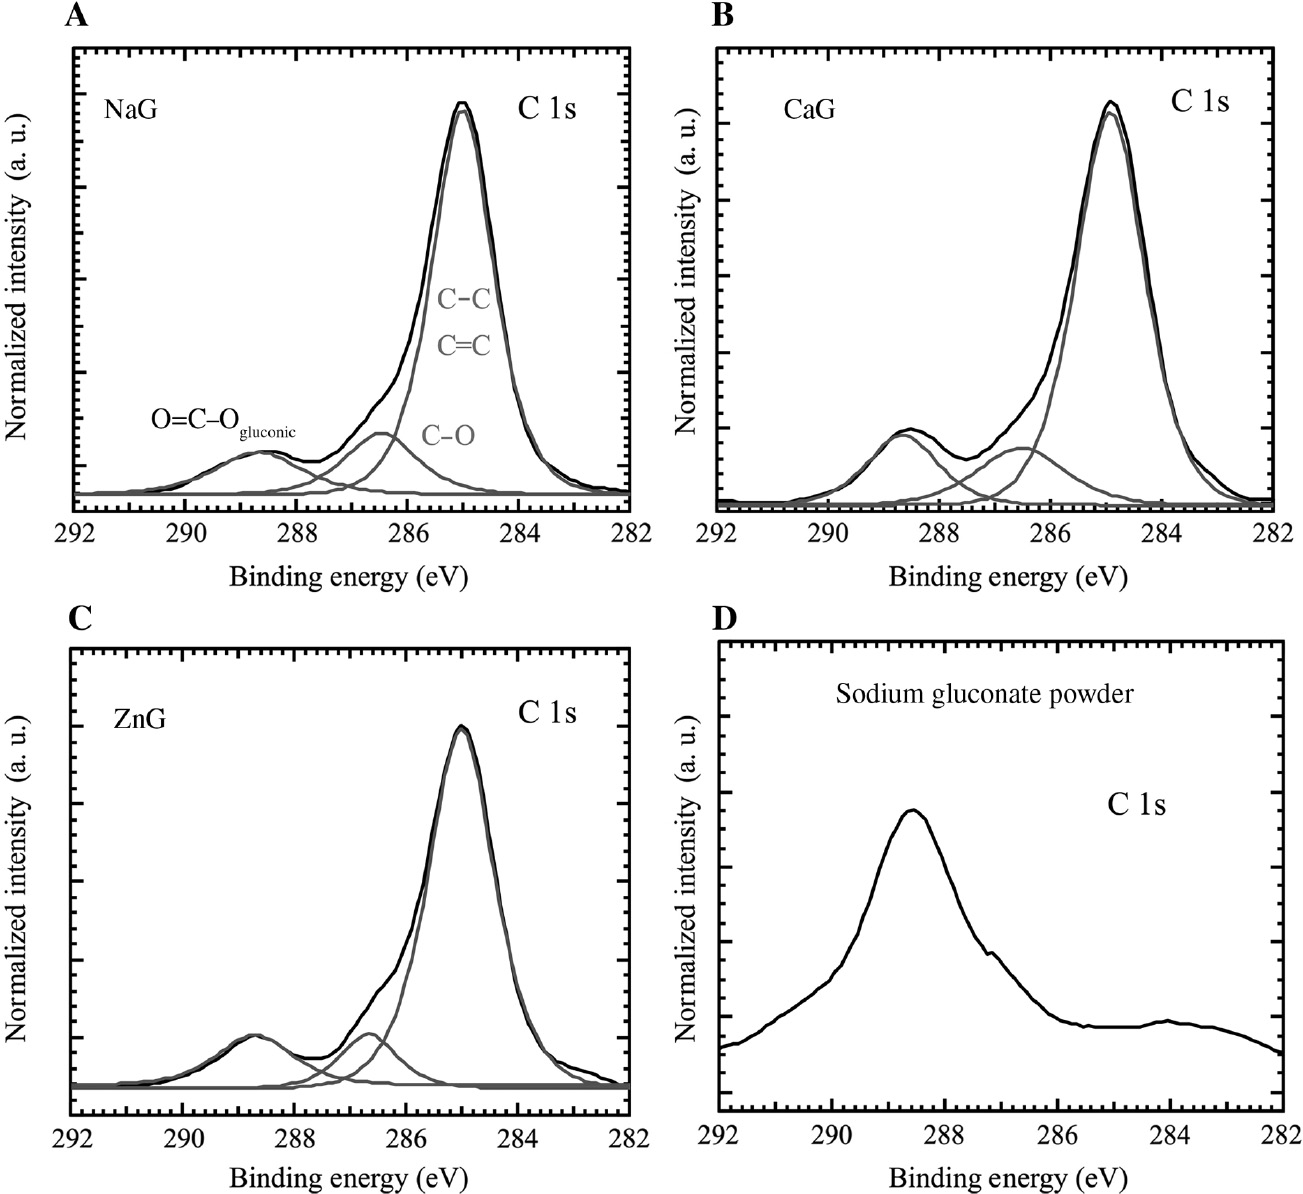
XPS narrow spectra of carbon 1 s on specimens after immersion for 24 h in (A) NaG, (B) CaG, (C) ZnG and (D) XPS narrow spectrum of carbon 1 s on sodium gluconate.
Figure 8 shows the XPS narrow spectra of the metal cations of the specimens after immersion for 24 h in (A) NaG, (B) CaG, and (C) ZnG. There is no peak of Na+ on the specimen after immersion in NaG (Figure 8A), suggesting that in the model fresh water, Na+ does not form chemical bonds with the mild steel. There are peaks of Ca2+ and Zn2+ on the specimens after immersion in CaG and ZnG (Figure 8B and C). The peaks of Ca 2p1/2 (351.2 eV) (Stipp & Hochella, 1991), Ca 2p3/2 (347.7 eV) (Stipp & Hochella, 1991), and Zn 2p3/2 (1021.8 eV) (Deroubaix & Marcu, 1992) suggest that CaCO3 and Zn(OH)2 formed on the mild steel during the immersion tests, suggesting that Ca2+ and Zn2+ in the model fresh water bonds to the mild steel.
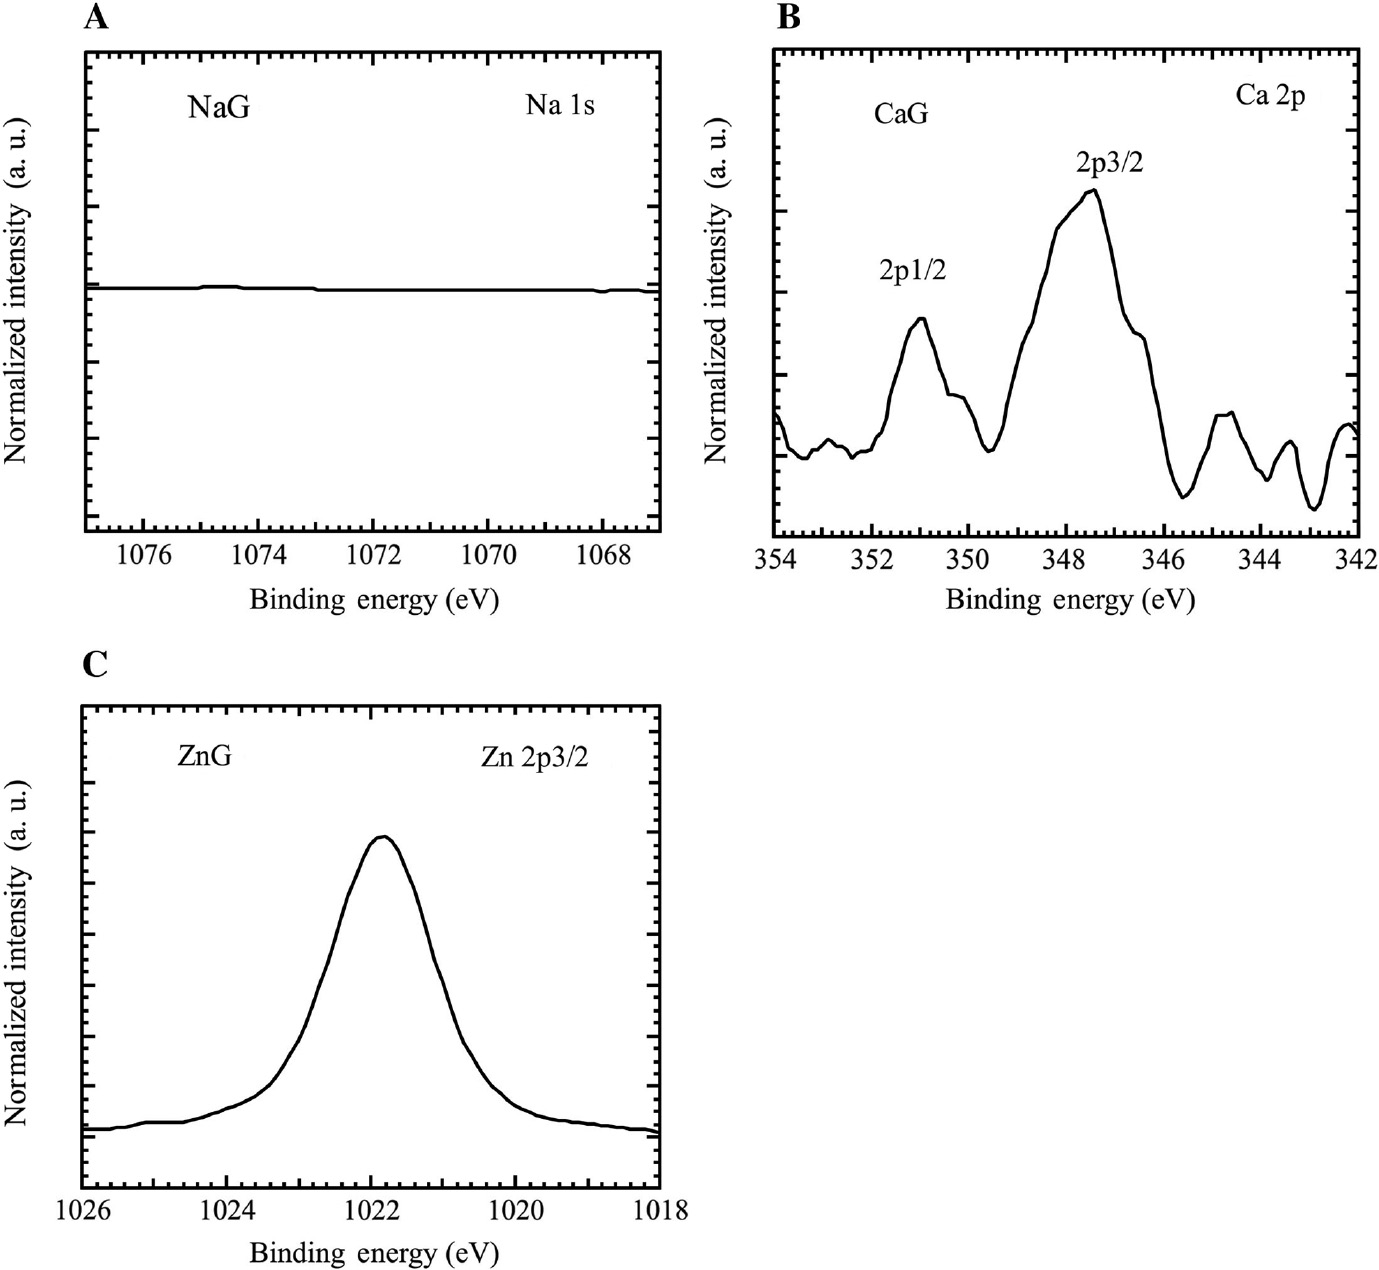
XPS narrow spectra of metal cations on specimens after immersion for 24 h in (A) NaG, (B) CaG and (C) ZnG.
Figure 9 shows the XPS narrow spectra of Fe 2p3/2 of specimens after immersion for 24 h in NaG, CaG, and ZnG, all with two peaks around 710.9 eV and 707.0 eV, which can be attributed to Fe2O3 (Brainard & Wheeler, 1978) and Fe (Andersson & Howe, 1989). The peak between 707.0 eV and 710.9 eV in all spectra suggests the presence of Fe3O4 (Brainard & Wheeler, 1978; Marcus & Grimal, 1992). These results suggest that the outermost layer of the oxide film on mild steel is Fe2O3, and the inner layer of the film is Fe3O4, corresponding to previous reports (Iitaka et al., 1937; Mayne & Pryor, 1949; Cohen, 1952; Mayne & Menter, 1954). The presence of the Fe peak indicates that the thickness of the oxide films formed on the immersed specimens is thinner than the detection depth of the XPS used in this study.
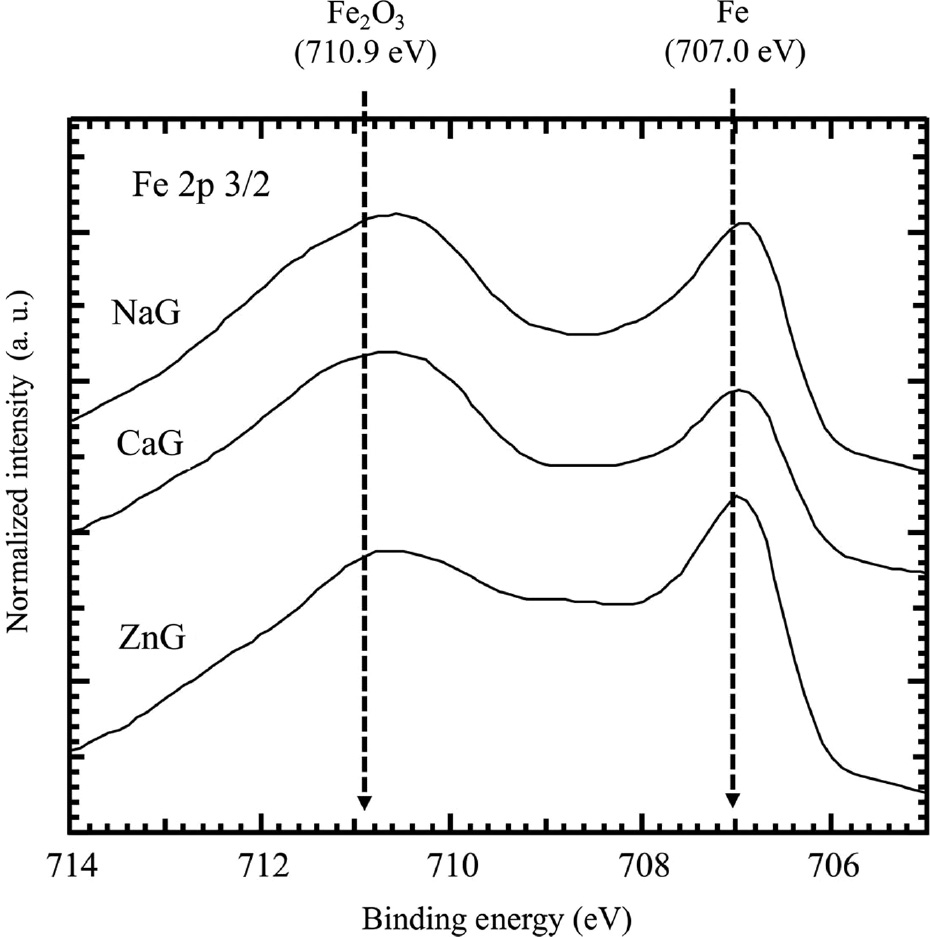
XPS narrow spectra of Fe 2p3/2 of specimens after immersion for 24 h in NaG, CaG and ZnG.
Figure 10 shows the schematic representations of the synergistic inhibition mechanism of gluconates and Zn2+ that has large Y values for mild steel corrosion in the model fresh water. The results of the XPS analysis in this study and other reports (Touir et al., 2008; Li et al., 2015) showed that gluconate ligands in solutions would adsorb on the mild steel and form the protective film of gluconates (Figure 10A), and the film would have defects in the model fresh water (Figure 10B). This means that the Fe2O3 layer on the mild steel would be exposed to the solution at the defect sites in the protective film of gluconates. The values of Y of Zn2+ is larger than those of other metal cations as shown in Table 1. The metal cations that have a large Y means that the metal cations also have a large X and small ∆V. It has been reported that metal cations that have a large X easily bond with OH− on the oxide films of mild steel and in the gluconate ligands of the protective film (Misono et al., 1967; Otani & Sakairi, 2016). This suggests that Zn2+ would bond to the oxide film at the defect sites and to the adsorbed gluconate ligands (Figure 10B). Then, the metal cation layer of Zn would form on the oxide film at the defect sites and on the protective films of gluconates (Figure 10C). It has been also reported that metal cations that have a small ∆V would form a protective layer on mild steel (Otani & Sakairi, 2016); therefore, the metal cation layer of zinc would have a good protective ability against Cl− attack. For these reasons, Zn2+ that has large Y values and gluconates confer a synergistic inhibition effect on the corrosion of mild steel in the model fresh water.
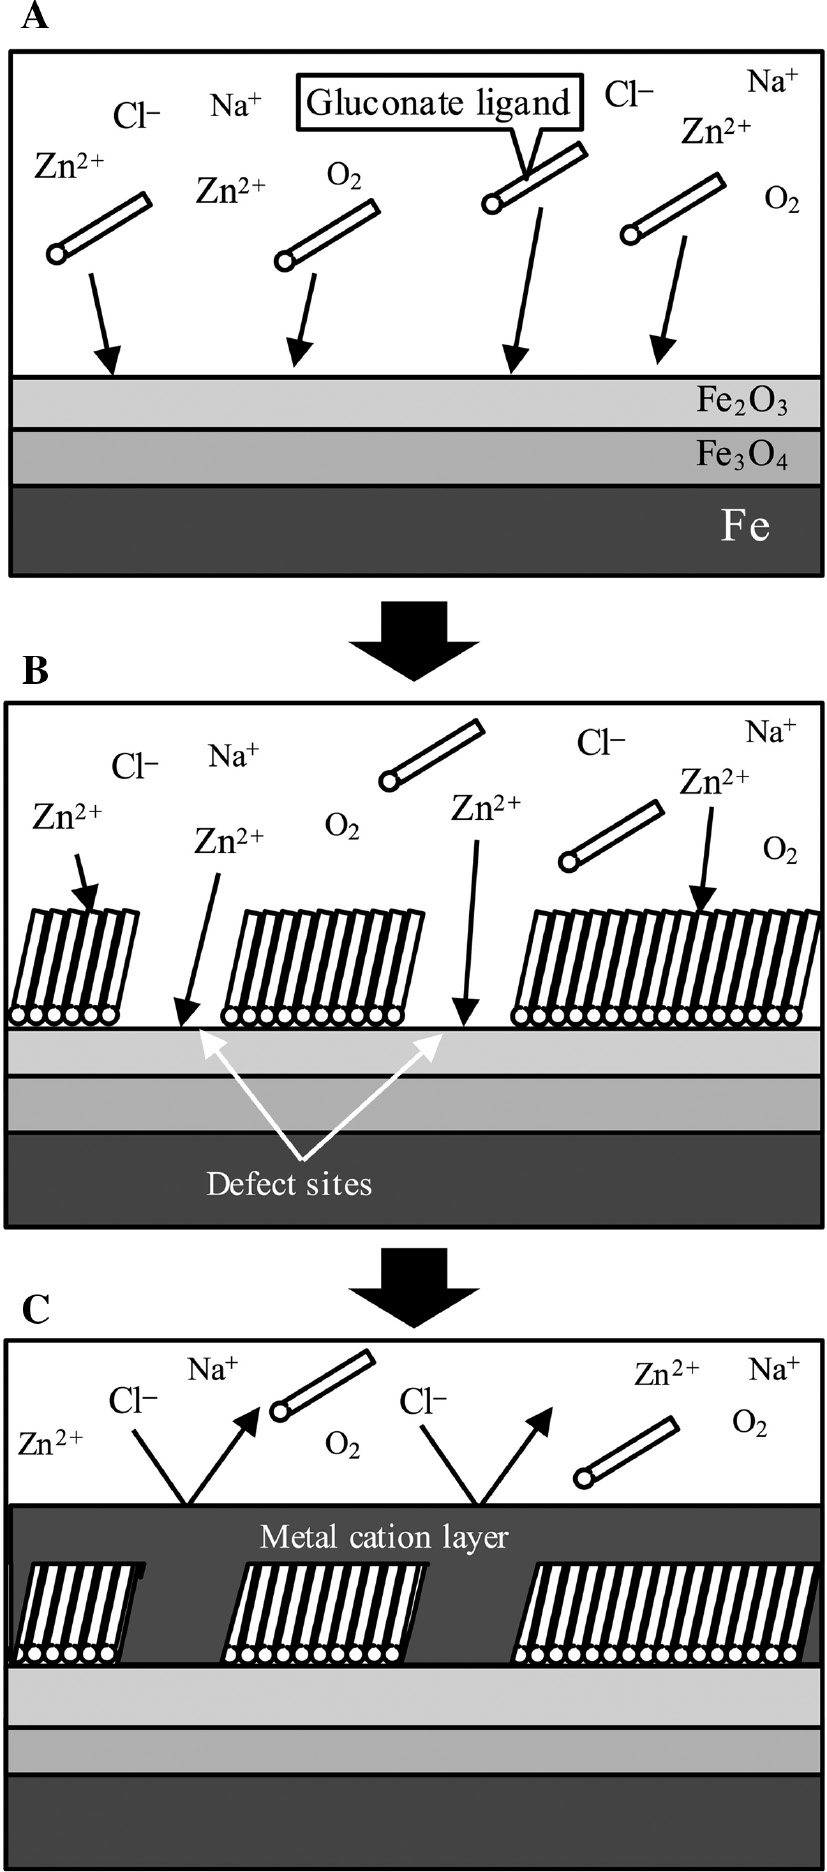
Schematic images of the synergistic inhibition mechanism of gluconates and Zn2+ with large Y for mild steel corrosion in the model fresh water.
4 Conclusions
The effects of metal cations on corrosion inhibition of gluconates with mild steel in a model fresh water were investigated by EIS and immersion corrosion tests with mass-loss measurements, surface observations, and surface analysis.
The corrosion inhibition of gluconates with mild steel is improved by metal cations that have large Y values in the model fresh water.
Gluconate ligands can adsorb on mild steel, and metal cations that have a large Y can bond to mild steel in the model fresh water.
Metal cations that have large Y values may decrease the defect incidence in the protective film of gluconates on mild steel in the model fresh water.
Acknowledgments
This study was supported by the Salt Science Research Foundation (grant no. 1609) and was conducted at the Laboratory of XPS Analysis, Hokkaido University, supported by the “Nanotechnology Platform” Program of the Ministry of Education, Culture, Sports, Science and Technology (MEXT), Japan. This research was also supported by the Japan Society for the Promotion of Science (JSPS) KAKENHI grant no. 17J00602.
References
Andersson SLT, Howe RF. An x-ray photoelectron study of metal clusters in zeolites. J Phys Chem 1989; 93: 4913−4920.10.1021/j100349a047Search in Google Scholar
Brainard WA, Wheeler DR. An XPS study of the adherence of refractory carbide silicide and boride rf-sputtered wear-resistant coatings. J Vac Sci Technol 1978; 15: 1800−1805.10.1116/1.569845Search in Google Scholar
Cohen M. An electron diffraction study of films formed by sodium nitrite solution on iron. J Phys Chem 1952; 56: 451–453.10.1021/j150496a009Search in Google Scholar
Corrosion Division. Example of corrosion and analytical methods. Kyoto, Japan: The Society of Material Science, 1987 (Japanese).Search in Google Scholar
Deroubaix G, Marcus P. X-ray photoelectron spectroscopy analysis of copper and zinc oxides and sulphides. Surf Interface Anal 1992; 18: 39−46.10.1002/sia.740180107Search in Google Scholar
Engell HJ, Stolica ND. Untersuchungen über Lochfraß an passiven Elektroden aus unlegiertem Stahl in chlorionenhaltiger Schwefelsäure. Arch Eisenhuttenw 1959; 30: 239−248.10.1002/srin.195902838Search in Google Scholar
Engell HJ. Stability and breakdown phenomena of passivating films. Eletrochim Acta 1977; 22: 987−993.10.1016/0013-4686(77)85010-XSearch in Google Scholar
Foley RT. Role of the chloride ion in iron corrosion. Corrosion 1970; 26: 58−70.10.5006/0010-9312-26.2.58Search in Google Scholar
Itagaki M, Yamada Y, Watanabe K, Nukaga T, Umemura F. Measurement of I-E curve of carbon steel in fresh water. Zairyo-to-Kankyo 2004; 53: 88−94.10.3323/jcorr1991.53.88Search in Google Scholar
Iitaka I, Miyake S, Iimori T. Examination of passive iron by electron diffraction. Nature 1937; 129: 156.10.1038/139156a0Search in Google Scholar
Jones DA. Principles and prevention of corrosion. Michigan: Prentice Hall, 1996.Search in Google Scholar
Kimura Y, Nakahara M, Uchida T. Statistical characteristics of corrosion damages generated in heat exchangers with mild steel tubes and effects of operating conditions. Trans JSME 1992; 58: 922−928.10.1299/kikaia.58.922Search in Google Scholar
Lahodny-Sarc O, Kapor F, Halle R. Corrosion inhibition of carbon steel in chloride solutions by blends of calcium gluconate and sodium benzoate. Mater Corros 2000; 51: 147−151.10.1002/(SICI)1521-4176(200003)51:3<147::AID-MACO147>3.0.CO;2-#Search in Google Scholar
Lewis GN. Valence and the structure of atoms and molecules. New York: The Chemical Catalog Co., 1923.Search in Google Scholar
Li J, Zhao B, Hu J, Zhang H, Dong S, Du R, Lin C. Corrosion inhibition effect of D-sodium gluconate on reinforcing steel in chloride-contaminated simulated concrete pore solution. Int J Electrochem Sci 2015; 10: 956−968.10.1016/S1452-3981(23)05048-4Search in Google Scholar
Mahdavian M, Naderi R. Corrosion inhibition of mild steel in sodium chloride solution by some zinc complexes. Corros Sci 2011; 53: 1194−1200.10.1016/j.corsci.2010.12.013Search in Google Scholar
Marcus P, Grimal JM. The anodic dissolution and passivation of Ni-Cr-Fe alloys studied by ESCA. Corros Sci 1992; 33: 805−814.10.1016/0010-938X(92)90113-HSearch in Google Scholar
Matsushima I. Corrosion in natural environments. Journal of the Metal Finishing Society of Japan 1980; 31: 383−392.10.4139/sfj1950.31.383Search in Google Scholar
Mayne JEO, Pryor MJ. The mechanism of inhibition of corrosion of iron by chromic acid and potassium chromate. J Chem Soc 1949: 1831–1835.10.1039/jr9490001831Search in Google Scholar
Mayne JEO, Menter JW. The mechanism of inhibition of the corrosion of iron by solutions of sodium phosphate, borate, and carbon. J Chem Soc 1954; 98: 103–107.10.1039/jr9540000103Search in Google Scholar
Melchers RE. Modelling immersion corrosion of structural steels in natural fresh and brackish waters. Corros Sci 2006; 48: 4174−4201.10.1016/j.corsci.2006.04.012Search in Google Scholar
Meroufel A, Al-Sahari A, Dewan M, Al-Hajiri M. Severe under- deposit corrosion inducing hydrogen embrittlement in water wall tubes. In: NACE Corrosion Conference, New Orleans, LA, USA, 2017.10.5006/C2017-08889Search in Google Scholar
Misono M, Ochiai E, Saito Y, Yoneda Y. A new dual parameter scale for the strength of Lewis acids and bases with the evaluation of their softness. J Inorg Nucl Chem 1967; 29: 2658−2691.10.1016/0022-1902(67)80006-XSearch in Google Scholar
Otani K, Sakairi M. Effects of metal cations on corrosion of mild steel in fresh water. Corros Sci 2016; 111: 302−312.10.1016/j.corsci.2016.05.020Search in Google Scholar
Pearson RG. Hard and soft acids and bases. J Am Chem Soc 1963; 85: 3533−3539.10.1021/ja00905a001Search in Google Scholar
Saremi M, Benehkohal NP, Dehghanian C, Zebardast HR. Effect of calcium gluconate concentration and hydrodynamic effect on mild steel corrosion inhibition in simulated cooling water. Corrosion 2009; 65: 778−784.10.5006/1.3319104Search in Google Scholar
Sastri VV. Corrosion inhibitors: principles and applications. Chichester: John Wily &Sons, 1998.Search in Google Scholar
Stipp SL, Hochella Jr. MF. Structure and bonding environments at the calcite surface as observed with X-ray photoelectron spectroscopy (XPS) and low energy electron diffraction (LEED). Geochim Cosmochim Acta 1991; 55: 1723−1736.10.1016/0016-7037(91)90142-RSearch in Google Scholar
Subhadra Garai, Saraswati Garai, Jaisankar P, Singh JK, Elango A. A comprehensive study on crude methanolic extract of Artemisia pallens (Asteraceae) and its active component as effective corrosion inhibitors of mild steel in acid solution. Corros Sci 2012; 60: 193−204.10.1016/j.corsci.2012.03.036Search in Google Scholar
The Chemical Society of Japan. Handbook of chemistry basic, 1st ed. Tokyo: Maruzen, 2004 (Japanese).Search in Google Scholar
The Chemical Society of Japan. Handbook of chemistry basic, 2nd ed. Tokyo: Maruzen, 2004 (Japanese).Search in Google Scholar
Touir R, Cenoui M, Bakri ME, Touhami ME. Sodium gluconate as corrosion and scale inhibitor of ordinary steel in simulated cooling water. Corros Sci 2008; 50: 1530−1537.10.1016/j.corsci.2008.02.011Search in Google Scholar
Vasyliev GS. The influence of flow rate on corrosion of mild steel in hot fresh water. Corros Sci 2015; 98: 33−39.10.1016/j.corsci.2015.05.007Search in Google Scholar
Weil KG, Menzel D. Die Einwirkung von Halogenionen auf passives Eisen. Z. Elektrochem 1959; 63: 669−673.10.1002/bbpc.19590630605Search in Google Scholar
Winston RR. Uhrig’s corrosion handbook. New Jersey: John Wily & Sons, 2011.Search in Google Scholar
©2018 Walter de Gruyter GmbH, Berlin/Boston
Articles in the same Issue
- Frontmatter
- In this issue
- Editorial
- Special issue on Recent advances in corrosion science: celebrating the 90th birthday of Professor Norio Sato
- Reviews
- Some microelectrochemical methods for the investigation of passivity and corrosion
- Inhibition effect of underpotential deposition of metallic cations on aqueous corrosion of metals
- Role of anodic oxide films in the corrosion of aluminum and its alloys
- Development of novel surface treatments for corrosion protection of aluminum: self-repairing coatings
- Mini review
- High-temperature corrosion resistance of SiO2-forming materials
- Original articles
- Cyclic carburization-oxidation behavior of Hastelloy-X at 1000°C
- Growth of passive oxide films on iron and titanium under non-stationary state
- Influence of metal cations on inhibitor performance of gluconates in the corrosion of mild steel in fresh water