Inhibition effect of underpotential deposition of metallic cations on aqueous corrosion of metals
-
Masahiro Seo
Masahiro Seo received his PhD degree in applied chemistry (supervisor: Prof. Norio Sato) from Hokkaido University, Japan, in 1971. He joined Fontana Corrosion Center, Ohio State University as a postdoctoral fellow in 1972. From 1990 to 2005, Dr. Seo was a professor at Hokkaido University. His research interests were focused on aqueous corrosion and passivation processes of metal thin films, measurement of stresses generated during anodic oxidation or hydrogen absorption of transition metals, and evaluation of the mechanical properties of passive metal surfaces by nano-indentation in solution. Dr. Seo has authored and co-authored more than 200 scientific papers in the fields of interfacial electrochemistry and corrosion science. He is an ECS fellow and an honorary member of the Japan Society of Corrosion Engineering.


Abstract
The experimental results reported so far for the inhibition effect of underpotential deposition (UPD) of metallic cations on aqueous corrosion of metals are criticized and discussed based on the prerequisite for UPD. The inhibition effect of Pb2+, Cd2+, Zn2+ or Mn2+ on hydrogen evolution or hydrogen absorption on Armco iron or various steels is classified into three potential regions: bulk deposition, UPD and adsorption of metallic cations without discharging. Moreover, the inhibition effect of Pb2+, Tl+ or Sn2+ on anodic dissolution of pure Fe, Ni or Ni-base alloys in acidic solutions is ascribed to the UPD of these metallic cations. Particularly, in situ X-ray absorption spectroscopy (XAS) for Pb-UPD on Ni has indicated that the electro-deposited Pb species on the Ni surface is metallic to form partly surface alloy and the metallic Pb blocks the active dissolution sites of Ni to inhibit the anodic dissolution. In contrast, in situ XAS for Sn-UPD on Ni has indicated that the electro-deposited Sn species is not only bonded with Ni atoms but also bonded with oxygen atoms and that the anodic dissolution of Ni is inhibited by the oxygenated Sn species on Ni.
1 Introduction
It is well known that aqueous corrosion of metals is influenced by metallic cations in solution. Leidheiser (1980) reviewed the inhibition effect of metallic cations on aqueous corrosion of metals from the survey of literature reported until 1980 and discussed the different mechanisms proposed for the corrosion inhibition by metallic cations because of the extensive diversity of ways in which metallic cations affect aqueous corrosion. As described by Leidheiser (1980), most of the corrosion inhibition mechanisms are appropriate only under a limited range (e.g. pH, concentration, potential, temperature and so on) of experimental conditions. In a review (Leidheiser, 1980) the effect of underpotential deposition (UPD) of metallic cations on aqueous corrosion was briefly considered as one of the mechanisms. The term UPD is applied to the reaction of adsorption of metallic cations (Mz+) in solution being electro-deposited up to the monolayer level on a foreign metal substrate (M′) at potentials more positive than the equilibrium potential of the Mz+/M electrode (Kolb et al., 1974; Kolb, 1978). As reviewed by Herrero et al. (2001), there have been many studies of UPD on well-defined single-crystal noble metal substrates such as Ag, Au and Pt in relation to the enhancement of electro-catalytic activity due to UPD.
In contrast, there have been comparatively few studies of the effect of UPD on metallic corrosion (Drazic & Vorkapic, 1978; Lafranconi et al., 1978; Jüttner, 1980; Drazic & Hao, 1983; Adzic, 1984; Rashkov et al., 1988; Zheng et al., 1993; Popov et al., 1994a,b; Radhakrishnan et al., 2005). In general, UPD can take place when ions of a lower work function metal are in contact with a higher work function-substrate metal, and the potential window of UPD is determined by the difference in work function between adsorbed metal and substrate metal (Kolb et al., 1974; Kolb, 1978). The prerequisite for participation of UPD in corrosion, therefore, is that the corrosion potential of substrate metal is located in the potential region where UPD of metallic cations can proceed. Most of studies of corrosion inhibition due to UPD suggested only the possibility of UPD from the electro-chemical measurements such as cyclic voltammetry and could not show any clear evidence of UPD. Nevertheless, the direct evidence of UPD on a corroding metal surface (Seo et al., 2008, 2012, 2014a,b; Seo, 2012) has been recently obtained from the detection and identification of UPD species by using surface-sensitive analytical methods such as X-ray photoelectron spectroscopy (XPS) and in situ X-ray absorption spectroscopy (XAS), which could lead to a more quantitative insight of participation of UPD in aqueous corrosion.
This review focuses on corrosion inhibition due to UPD of metallic cations. First, the prerequisite for participation of UPD in corrosion is described. Second, the results of corrosion inhibition due to UPD reported so far are criticized and discussed based on the prerequisite for UPD. Particularly, detailed discussions are made on the inhibition effects of Pb-UPD and Sn-UPD on anodic dissolution of Ni. Finally, it is stressed that the use of in situ XAS combined with electrochemical measurement is indispensable for clarifying the corrosion inhibition mechanism of metallic cations involving UPD.
2 Prerequisite for participation of UPD in corrosion
Kolb et al. (1974) and Kolb (1978) found the following empirical relation between the potential window of UPD, ΔEUPD, and the difference in work function between electro-deposited metal, M, and substrate metal, M′:
where ΦM and ΦM′ are the work functions of electro-deposited metal, M, and of substrate metal, M′, respectively. In Eq. (1), one should be aware that UPD takes place only if ΦM′>ΦM, i.e. ΔEUPD>0. Eq. (1) holds approximately on many UPD systems in which noble metals such as Pt, Au and Ag are used as substrate metals. Kolb et al. (1974) and Kolb (1978) determined experimentally ΔEUPD as the difference between two characteristic potentials, EM,b, and EM,s, in a potentio-dynamic polarization curve of the substrate noble metal, M′, measured in solution containing metallic cations, Mz+, by anodic potential sweep from a potential more negative than the equilibrium potential of the Mz+/M electrode.
where EM,b and EM,s are the potentials at anodic current peaks corresponding to anodic stripping of bulk-deposited M and electro-deposited M, respectively, as shown schematically in Figure 1. As compared to the noble metal substrates that are not subjected to corrosion or anodic dissolution, corroding metal substrates such as iron and nickel encounter difficulty in electrochemical determination of ΔEUPD by Eq. (2) since the small anodic stripping current of UPD species is often masked with cathodic current of hydrogen evolution or anodic current of metal dissolution. Nevertheless, provided that both ΦM and ΦM′′ are known, ΔEUPD for the corroding substrate metal can be estimated by Eq. (1). When a metal, M′, is immersed into corrosive solution containing a small amount of Mz+ ions, the participation of M-UPD species, Mad, in corrosion of M′ would be operative in the case where the corrosion potential of substrate metal, Ecorr(M′), is located in the potential region of M-UPD as represented by Eq. (3).
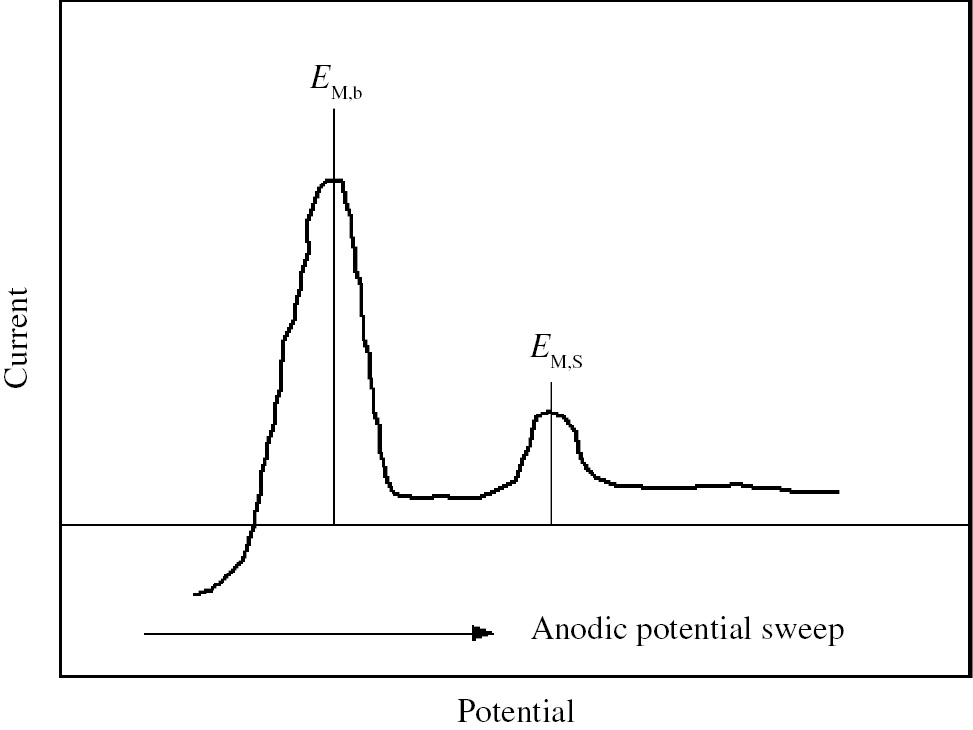
Schematic potentio-dynamic polarization curve of substrate noble metal, M′, in solution containing metallic cations, Mz+, obtained by anodic potential sweep from a potential more negative than the equilibrium potential of the Mz+/M electrode. EM,b and EM,s are the potentials at anodic current peaks corresponding to the anodic stripping of bulk-deposited M and electro-deposited M, respectively.
where Eeq(Mz+/M) is the equilibrium potential of the Mz+/M electrode that can be calculated by using the Nernst equation from the standard electrode potential, Eoeq(Mz+/M). The values of Eoeq(Mz+/M) and ΦM required for estimation of the potential region of UPD are listed in Table 1. The data of Eoeq(Mz+/M) and ΦM in Table 1 are adopted from Electrochemistry Handbook(Izutsu, 2000) and Surface Physics Handbook(Tsukada, 1987), respectively. The values of ΦM fluctuate between literatures, e.g. the values of ΦM reported by Trasatti (1971, 1977) are different from those listed in Table 1. Therefore, one should be careful that ΔEUPD estimated from Eq. (1) depends on the selected values of ΦM and ΦM′. Moreover, it is noted that all potentials described in this review are referred to the standard hydrogen electrode (vs. SHE).
Standard electrode potential, Eoeq(Mz+/M), and work function of metal, ΦM.
| Mz+/M | E o eq(Mz+/M) (V vs. SHE) | ΦM (eV) |
|||
|---|---|---|---|---|---|
| Polya | (110)b | (100)b | (111)b | ||
| Al3+/Al | −1.676 | 4.28 | 4.06 | 4.41 | 4.24 |
| Ag+/Ag | 0.7991 | 4.26 | 4.52 | 4.64 | 4.74 |
| AsO2−/As | −0.68 | 3.75 | |||
| Au3+/Au | 1.520 | 5.1 | 5.37 | 5.47 | 5.31 |
| Bi3+/Bi | 0.3172 | 4.22 | |||
| Cd2+/Cd | −0.4025 | 4.22 | |||
| Co2+/Co | −0.277 | 5.0 | |||
| Cr2+/Cr | −0.90 | 4.5 | |||
| Cu2+/Cu | 0.340 | 4.65 | 4.48 | 4.59 | 4.98 |
| Fe2+/Fe | −0.44 | 4.5 | 4.67 | 4.81 | |
| Ga3+/Ga | −0.529 | 4.2 | |||
| Ge2+/Ge | 0.247 | 5.0 | |||
| Hg2+/Hg | 0.8535 | 4.49 | |||
| In3+/In | −0.3382 | 4.12 | |||
| Mn2+/Mn | −1.18 | 4.1 | |||
| Mo3+/Mo | −0.20 | 4.6 | 4.95 | 4.53 | 4.55 |
| Ni2+/Ni | −0.257 | 5.15 | 5.04 | 5.22 | 5.35 |
| Pb2+/Pb | −0.1263 | 4.25 | |||
| Pd2+/Pd | 0.915 | 5.12 | |||
| Pt2+/Pt | 1.188 | 5.65 | 5.84 | 5.93 | |
| Sn2+/Sn | −0.1375 | 4.42 | |||
| Ti2+/Ti | −1.63 | 4.33 | |||
| Tl+/Tl | −0.336 | 3.84 | |||
| V2+/V | −1.13 | 4.3 | |||
| Zn2+/Zn | −0.7626 | 4.33 | |||
-
Polya refers to the polycrystalline specimen and (hkl)b refers to surface indexes of the single crystal specimen. The data of standard electrode potential and work function are adopted from Electrochemistry Handbook (Izutsu, 2000) and Surface Physics Handbook (Tsukada, 1987), respectively.
When a metal, M′, is cathodically or anodically polarized from Ecorr(M′) in corrosive solution containing a small amount of Mz+ ions, hydrogen evolution on M′ during cathodic polarization or anodic dissolution of M′ followed by passivation during anodic polarization is influenced by bulk-deposited M, M-UPD and Mz+ depending on the position of Ecorr(M′) relative to the potential regions where bulk-deposited M, M-UPD and Mz+ are thermodynamically stable. The schematic diagram in Figure 2 represents three different positions (A), (B) and (C) of Ecorr(M′) relative to the potential regions where bulk-deposited M, M-UPD and Mz+ are thermodynamically stable to explain the influence of stable M species on cathodic or anodic polarization behavior of M′. In the case (a) where Ecorr(M′) satisfies the prerequisite of Eq. (3), the hydrogen evolution reaction on M′ under cathodic polarization is influenced by electro-deposited M (M-UPD) in the potential region between Ecorr(M′) and Eeq(Mz+/M), and by bulk-deposited M in the potential region more negative than Eeq(Mz+/M). On the other hand, the anodic reaction (active dissolution followed by passivation) of M′ under anodic polarization is influenced by M-UPD in the potential region between Ecorr(M′) and Eeq(Mz+/M)+ΔEUPD, and by Mz+ in the potential region more positive than Eeq(Mz+/M)+ΔEUPD. In the case (b) where Ecorr(M′)≤Eeq(Mz+/M), the hydrogen evolution reaction on M′ under cathodic polarization is influenced only by bulk-deposited M. On the other hand, the anodic reaction of M′ under anodic polarization is influenced by bulk-deposited M, M-UPD and Mz+ depending on the respective potential region. In the case (c) where Ecorr(M′)≥Eeq(Mz+/M)+ΔEUPD, the hydrogen evolution reaction on M′ under cathodic polarization is influenced by Mz+, M-UPD and bulk-deposied M depending on the respective potential region. On the other hand, the anodic reaction of M′ under anodic polarization is influenced only by Mz+.
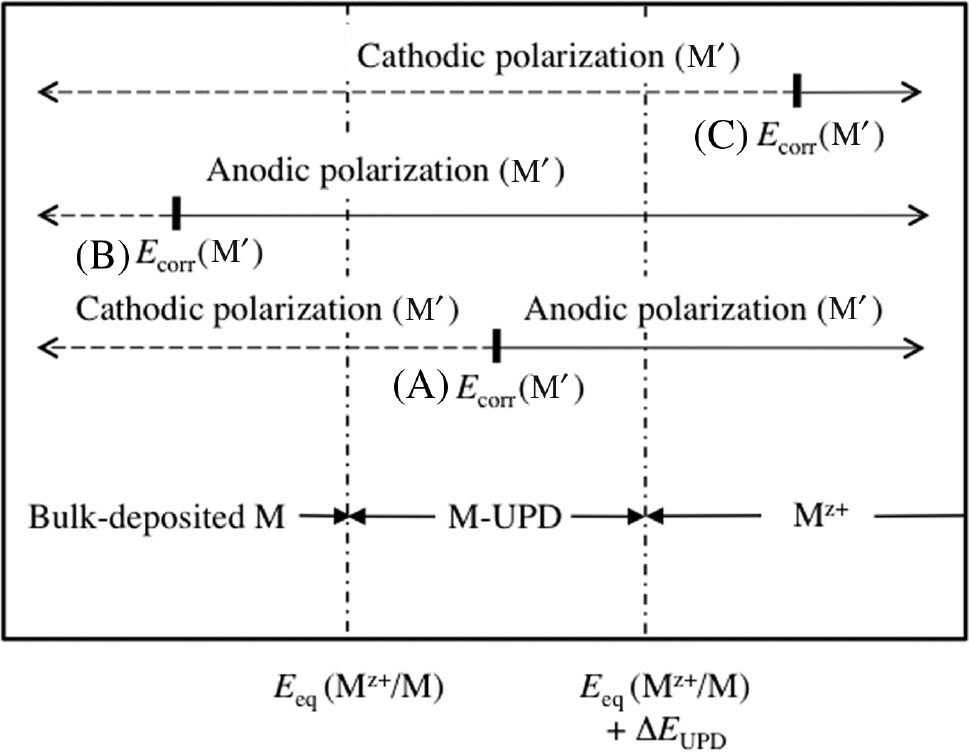
Schematic diagram representing three different positions (A), (B) and (C) of Ecorr(M′) relative to the potential regions where bulk-deposited M, M-UPD and Mz+ are thermodynamically stable to explain the influence of stable M species on the cathodic or anodic polarization behavior of M′. The markes of the vertcal bar designate the positions of Ecorr(M′). The dotted and solid arrows indicate the directions of cathodic and anodic polarization of M′ from Ecorr(M′), respectively.
3 Early studies of the UPD effect on aqueous corrosion
Lafranconi et al. (1978) investigated the effect of trace amount of Pb2+ (10−7m) on stress corrosion cracking (SCC) susceptibility of SUS 304 austenitic stainless steel in deaerated H2SO4+NaCl solution and in deaerated HCl solution. In both solutions, the presence of Pb2+ decreases the corrosion rate and prolongs about two-fold the time of failure for SUS 304 under the U-bent test as well as constant load test. The corrosion potential of SUS 304 is Ecorr=−0.20 V, which is more positive by 0.14 V than Eeq(10−7m Pb2+/Pb)=−0.34 V. Lafranconi et al. (1978) concluded that the decrease in the corrosion rate of SUS 304 is brought by the inhibition of hydrogen evolution due to Pb-UPD and leads to the SCC suppression. The work function of SUS 304 is unknown but may be calculated by allotting the work functions of polycrystalline Fe, Cr and Ni in proportion to the alloy composition (mole fraction: XFe=0.735, XCr=0.19 and XNi=0.075). The work function of SUS 304, ΦSUS304=4.55 eV, is thus calculated from the values of ΦFe, ΦCr and ΦNi listed in Table 1. The potential window, ΔEUPD=0.15 V, of Pb-UPD on SUS 304 is estimated from Eq. (1) by using ΦSUS304=4.55 eV and ΦPb=4.25 eV. As a result, the potential region of Pb-UPD on SUS 304 is from −0.34 V to −0.19 V, indicating that Ecorr=−0.20 V of SUS 304 is located in the potential region of Pb-UPD and the conclusion drawn by Lafranconi et al. (1978) seems valid. Drazic and Vorkapic (1978) investigated the effects of the addition of 0.01–0.5 m Cd2+, Zn2+ and Mn2+ on the corrosion behavior of Armco iron in deaerated 0.25 m H2SO4 and reported that the cathodic current density of Armco iron at −0.40 V decreases in order of Cd2+>Mn2+>Zn2+ with increasing concentration of the added metallic cations. On the basis of the above results, Drazic and Vorkapic (1978) concluded that hydrogen evolution is inhibited by UPD of these metallic cations. However, it is needed to verify the conclusion drawn by Drazic and Vorkapic (1978) since there was no description of the UPD potential window. Let us estimate the potential region where UPD of Cd2+, Mn2+ and Zn2+ takes place on Armco iron. The UPD potential windows estimated from Eq. (1) by using the work functions of polycrystalline metals listed in Table 1 are ΔEUPD=0.14 V for Cd2+, 0.20 V for Mn2+ and 0.085 V for Zn2+. If the concentration of metallic cations is specified to 0.1 m, the UPD potential regions are from −0.433 V to −0.293 V for Cd2+, from −1.21 V to −1.01 V for Mn2+ and from −0.793 V to −0.706 V for Zn2+. The comparison between the estimated UPD potential regions shows that the polarization potential, E=−0.40 V, employed for the cathodic current measurement is located in the potential region of Cd-UPD, while it is far from the potential region of Mn- or Zn-UPD and is more positive than the UPD boundary potential, −1.01 V for Mn2+ or −0.706 V for Zn2+. It is deduced that both Mn- and Zn-UPD on Armco iron could not proceed at −0.40 V. The above situation does not change even in the case where the values of work functions (ΦFe=4.65 eV, ΦCd=4.12 eV, ΦZn=4.30 eV and ΦMn=3.90 eV) reported by Trasatti (1977) are employed in place of those listed in Table 1. As a result, it seems that the conclusion drawn by Drazic and Vorkapic (1978) is valid for Cd2+. The inhibition of hydrogen evolution due to the addition of Mn2+ or Zn2+ may result from the adsorption of metallic cations without discharging on Armco iron although the corrosion inhibition mechanism is not clear.
Jüttner (1980) investigated the effect of Pb2+ on the polarization behavior of pure Fe in deaerated 0.5 m HClO4. The addition (10−4m–2.5×10⁻³m) of Pb(ClO4)2 in 0.5 m HClO4 inhibits not only the hydrogen evolution on Fe but also the anodic dissolution of Fe. Figure 3 shows the steady-state polarization curves of Fe specimens in 0.5 m HClO4 without and with 10−3m Pb(ClO4)2 (Jüttner, 1980). The addition of 10−3m Pb(ClO4)2 shifts the corrosion potential of Fe toward the positive direction by about 0.1 V and decreases the anodic current density by some orders of magnitude within a small potential interval of about 50 mV. Jüttner (1980) attributed the inhibition effect on the anodic dissolution of Fe to Pb-UPD on Fe. The conclusion drawn by Jüttner seems valid since the corrosion potential of Fe, Ecorr=−0.18 V, in the presence of 10−3m Pb2+ is located in the potential region between −0.215 V and −0.09 V where Pb-UPD takes place on Fe. In the presence of 10−3m Pb2+, a cathodic current density of a few μA/cm2 with a small shoulder is measured by cathodic polarization from Ecorr=−0.18 V, which is ascribed to a limiting diffusion-controlled reduction of residual oxygen in the electrolyte. The cathodic current density is increased by further cathodic polarization and attains the limiting diffusion-controlled value for the bulk deposition of Pb on Fe in the potential region between −0.25 V and −0.50 V. The rapid increase in cathodic current density at potentials more negative than −0.50 V corresponds to hydrogen evolution on bulk-deposited Pb, since the hydrogen evolution on Pb needs high overvoltage as compared to that on Fe. Jüttner (1980) also investigated the effect of Pb2+ (10−4m–7.4×10⁻³m) on the anodic dissolution of pure Fe in deaerated acidic sodium chloride solutions with different Cl− concentrations and explained the Pb2+ and Cl− concentration dependences of anodic polarization behavior in terms of competitive adsorption of Cl− and Pb in the potential region of Pb-UPD. Furthermore, Jüttner (1980) investigated the effect of Tl+ (2.5×10⁻³m–2×10⁻²m) on the polarization behavior of pure Fe in deaerated acidic sodium sulfate solution and explained the inhibition effect of Tl+ on the anodic dissolution of Fe in terms of Tl-UPD on Fe. The corrosion potential of Fe, Ecorr=−0.38 V, in the presence of 10−2m Tl+ is located in the potential region of Tl-UPD between −0.454 and −0.124 V estimated from Eeq(10−2m Tl+/Tl)=−0.454 V, ΦTl=3.84 eV and ΦFe= 4.5 eV, which proves the validity of his explanation.
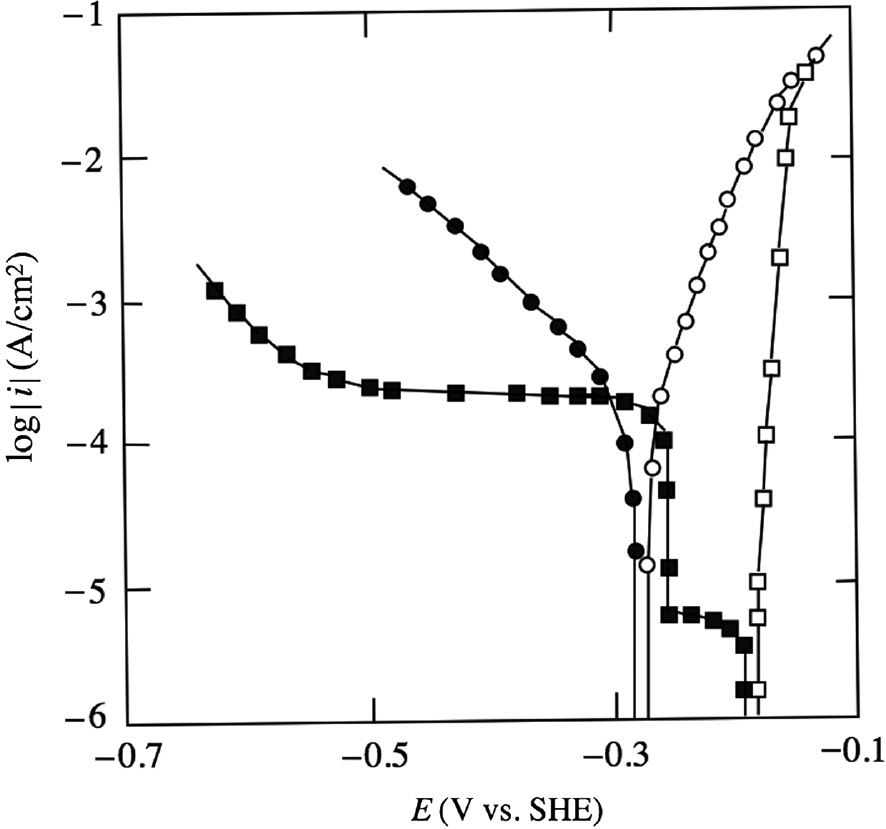
Steady-state polarization curves of Fe specimens in deaerated 0.5 m HClO4 without and with 10−3m Pb(ClO4)2 (Jüttner, 1980). ○, anodic part without 10−3m Pb(ClO4)2; □, anodic part with 10−3m Pb(ClO4)2; ●, cathodic part without 10−3m Pb(ClO4)2 and ■, cathodic part with 10−3m Pb(ClO4)2. Reproduced with permission from © Verlag GmbH & Co. KGaA, 1980.
Rashkov et al. (1988) investigated the relation between Zn-UPD and penetration of hydrogen in Armco iron. The Devanathan-Stachurski method (Devanathan & Stachurski, 1962, 1964) was used for the measurement of hydrogen penetration rate through a bipolar iron membrane. The electrolytes employed in the cathodic compartment for hydrogen evolution were deaerated 1 m Na2SO4+0.2 m NaCl+0.5 m H3BO3 solutions without and with 10−3m–1 m ZnSO4. The presence of Zn2+ decreased abruptly the hydrogen evolution current in the cathodic compartment in the potential region of Zn-UPD. On the other hand, the electrolyte in the anodic compartment for the oxidation of atomic hydrogen penetrating through the iron membrane was 0.2 m NaOH. The presence of Zn2+ also decreased the oxidation current of the atomic hydrogen in the anodic compartment, indicating that the Zn-UPD on Armco iron inhibits both the hydrogen evolution and the penetration of atomic hydrogen. Popov et al. (1994a) also investigated the effect of Zn-UPD on hydrogen absorption and penetration into HY-130 steel by using the Devanathan-Stachurski method (Devanathan & Stachurski, 1962, 1964). The electrolytes employed in the cathodic compartment for hydrogen evolution were deaerated 1 m Na2SO4+0.4 m NaCl+0.4 m H3BO3 solutions without and with 2×10⁻³m ZnSO4. After the HY-130 steel was potentiostatically polarized for 5 min at potentials more positive than Eeq(2×10⁻³m Zn2+/Zn)=−0.84 V to avoid the bulk deposition of Zn, a potentio-dynamic polarization (1 mV/s) toward positive direction was performed to measure the hydrogen evolution current. In addition, the hydrogen permeation current through the HY-130 steel membrane was measured as a function of time by stepwise cathodic polarization. The addition of Zn2+ inhibited both the hydrogen evolution and hydrogen permeation in the estimated potential region of Zn-UPD. However, the inhibition effect of Zn2+ was observed up to potentials more positive than the potential region of Zn-UPD, which was ascribed to the shift in anodic stripping potential of Zn toward the positive direction due to irreversible electro-deposition of Zn or due to alloy formation of Zn with substrate steel.
Zheng et al. (1993) investigated the effect of Pb2+ on hydrogen evolution and permeation into AISI 4340 steel in deaerated 0.5 m HClO4+0.25 m NaClO4 solution by using the Devanathan-Stachurski method (Devanathan & Stachurski, 1962, 1964). Two characteristic cathodic current peaks at −0.15 V and −0.24 V which correspond to the UPD and bulk deposition of Pb, respectively, appeared during cyclic voltammetry of AISI 4340 steel in solution with 2×10⁻³m Pb2+. The potential of −0.24 V corresponding to the bulk deposition of Pb is more negative than Eeq(2×10⁻³m Pb2+/Pb)=−0.206 V, which means that the bulk deposition of Pb on AISI 4340 steel needs a cathodic overvoltage of 34 mV because of the high potential sweep rate of 0.5 V/s. After the electro-deposition of Pb on AISI 430 steel for 5 min at −0.20 V in the presence of 10−4m–2×10⁻³m Pb2+, the cathodic polarization at −0.35 V in the absence of Pb2+ has indicated that the hydrogen evolution current density decreases due to Pb-UPD. The hydrogen permeation experiment at −0.35 V in the absence of Pb2+ after the electro-deposition of Pb has also indicated that the hydrogen permeation current density decreases due to Pb-UPD. Popov et al. (1994b) investigated the effect of Pb2+ on hydrogen evolution and penetration into type 718 alloy in deaerated 0.5 m HClO4+0.25 m NaClO4 solution. The main composition (wt%) of type 718 alloy was 52.5 Ni, 19.0 Cr, 18.5 Fe, 3.0 Mo and 3.6 Nb+Ta. Two characteristic anodic current peaks at −0.15 V and 0.15 V corresponding to the anodic stripping of bulk-deposited Pb and of electro-deposited Pb, respectively, appeared during cyclic voltammetry of type 718 alloy in solution with 10−3m Pb2+. The difference between potentials at two peaks is about 0.3 V, which corresponds to the potential window of Pb-UPD on type 718 alloy. The work function of type 718 alloy is unknown but it can be estimated by allotting the work functions of main components in proportion to the alloy composition. The work function of type 718 alloy thus estimated is Φalloy=4.85 eV. The potential window of Pb-UPD on type 718 alloy eventually estimated from Eq. (1) by taking ΦPb=4.25 eV is 0.3 V, which is consistent with the difference between potentials at two characteristic anodic current peaks appeared during the cyclic voltammetry. However, the potential (−0.15 V) corresponding to the anodic stripping of bulk-deposited Pb is more positive than Eeq(10−3m Pb2+/Pb) =−0.215 V, which means that the anodic stripping of bulk-deposited Pb on type 718 alloy needs an anodic overvoltage of 65 mV. After the electro-deposition of Pb on type 718 alloy for 5 min in the presence of 10−3m Pb2+, cathodic polarization in the absence of Pb2+ has indicated that Pb-UPD inhibits hydrogen evolution. The hydrogen permeation experiment at −0.55 V in the absence of Pb2+ after the electro-deposition of Pb has also indicated that Pb-UPD inhibits hydrogen penetration in type 718 alloy.
4 Recent studies of the UPD effect on aqueous corrosion
4.1 Pb-UPD effect on the anodic dissolution of nickel and nickel-base alloys
There were no available reports regarding the UPD effect on aqueous corrosion of metals for 10 years between 1995 and 2004. However, triggered by the recognitions of lead-induced stress corrosion cracking (Pb-SCC) caused by trace amounts of Pb in steam generator tubes in nuclear power plants (Staehle, 2004, 2005), many researches (e.g. Sakai et al., 1992; Costa et al., 1995; Hwang & Kim, 2002; Lu, 2005; Radhakrishnan et al., 2005; Lu et al., 2007) were conducted with respect to the effect of Pb on corrosion of Ni-base alloys such as alloy 600 and alloy 690 used for steam generator tubes of nuclear power plants. According to the comprehensive reviews by Staehle (2004, 2005), Pb-SCC in high nickel alloys occurs over a range of pH from acidic to alkaline at a concentration of Pb as low as 0.1 ppm along the NiO/Ni equilibrium potential boundary in the Ni-H2O system. The electrochemical polarization measurements of Ni-based super-alloys in high temperature aqueous systems have shown that the addition of Pb (as PbO) increases not only the active current density peak but also the passive and transpassive current density. However, as reported by Lu (2005), it seems that the increase in active current peak results mainly from overlapping with the anodic stripping current of bulk-deposited Pb since bulk-Pb is deposited during cathodic polarization in the case where the applied potential is more negative than Eeq(Pb2+/Pb). The surface characterization by XPS and AES (Hwang & Kim, 2002; Lu et al., 2007) has revealed that Pb species is incorporated in passive film. As a result, the increase in passive current density was ascribed to the degradation of the passive film due to incorporation of Pb species. Despite the above results, the actual mechanism of Pb-SCC is still not made clear.
Radhakrishnan et al. (2005) investigated the effect of 5×10⁻³m Pb2+ (added in solution as PbO) on anodic dissolution and passivation of Ni and Ni-21 Cr alloy at 90°C in deaerated 0.1 m perchloric acid and in acetic acid/sodium acetate buffer solution at pH 3.5. The potentio-dynamic polarization of Ni toward the anodic direction was started after the addition of 5×10⁻³m Pb2+ in solution at potential (−0.14 V) more positive than Eeq(5×10⁻³m Pb2+/Pb)=−0.205 V in order to avoid the bulk deposition of Pb. The results have shown that Pb2+ inhibits the active dissolution of Ni in 0.1 m perchloric acid, which was ascribed to Pb-UPD on Ni. This is the first report that suggests the participation of Pb-UPD in corrosion of Ni although there are many reports of Pb-UPD on noble metals (Herrero et al., 2001). The corrosion potential of Ni in 0.1 m perchloric acid containing 5×10⁻³m Pb2+ is about −0.09 V, which is located in the potential region of Pb-UPD between −0.205 V and 0.245 V on Ni since the potential window of Pb-UPD on Ni estimated from Eq. (1) by using the work functions of Ni and Pb listed in Table 1 is 0.45 V. In contrast to the inhibiting effect of Pb2+ on anodic dissolution of pure Ni in 0.1 m perchloric acid, the addition of Pb2+ activated the anodic dissolution of Ni in acetic acid/sodium acetate buffer solution at pH 3.5, which was ascribed to the incorporation of Pb in pre-passive film such as Ni(OH)2 likely formed on Ni in mild acidic solution (Radhakrishnan et al., 2005). On the other hand, there were no inhibiting and activating effects of Pb2+ on the anodic dissolution of Ni-21Cr alloy. Costa et al. (1995) also observed no effects of Pb2+ on the anodic dissolution of Cr and alloy 690 (60Ni-31Cr-9Fe) in perchloric acid. It is well known that the Cr component is enriched on the surfaces of stainless steels or alloys 600 and 800 to form passive films with high corrosion resistivity (Seo & Sato, 1980; Strehblow & Marcus, 2006). The formation of Cr-enriched oxide film on the alloy surface may be much faster than that of the Pb-UPD layer due to the strong affinity of Cr with oxygen as compared with Pb to suppress the progress of Pb-UPD which would lead to no effects of Pb2+ on anodic dissolution.
4.1.1 Detailed study of the Pb-UPD effect on the anodic dissolution of Ni
Aiming at a more quantitative understanding of the relation between Pb-UPD and corrosion of Ni, Seo et al. (2008) investigated in detail the effect of Pb2+ (10−3m–10−5m) on the polarization behavior of Ni at room temperature in deaerated 0.1 m NaClO4+10−2m HClO4 solution. Figure 4 shows the voltammograms of Ni specimens at the first cycle in the wide potential region between −0.40 V and 1.20 V in the solutions without and with 10−3m Pb2+ (added as PbO to give the desired concentration of Pb2+ in solution). The solid and dotted lines in Figure 4 represent the voltammograms in the presence and absence of Pb2+, respectively. After Ecorr attained a steady state (it takes about 15 min), the voltammograms were measured. The steady state value of Ecorr of Ni in the presence of Pb2+ is 0.09 V, which is more positive by 0.15 V than that (−0.06 V) in the absence of Pb2+. The potentio-dynamic polarization (10 mV/s) is started from Ecorr to the cathodic limit potential, Ec,l=−0.40 V, turned from −0.40 V to the anodic limit-potential, Ea,l=1.20 V, and returned to −0.40 V. The cathodic current peak observed at −0.27 V during the first cathodic potential sweep in the presence of Pb2+ results from the bulk deposition of Pb, while the anodic current peak observed at −0.20 V during the subsequent anodic potential sweep is caused by the anodic stripping of bulk-deposited Pb. Moreover, the anodic current peaks corresponding to the anodic dissolution of Ni are observed at 0.11 V in the absence of Pb2+ and at 0.15 V in the presence of Pb2+. It is remarked that the anodic current peak height of Ni-active dissolution decreases significantly in the presence of Pb2+. It is also noted that in the passive region between 0.40 V and 1.20 V, the passivity-maintaining current density in the presence of Pb2+ is almost the same as that in the absence of Pb2+.
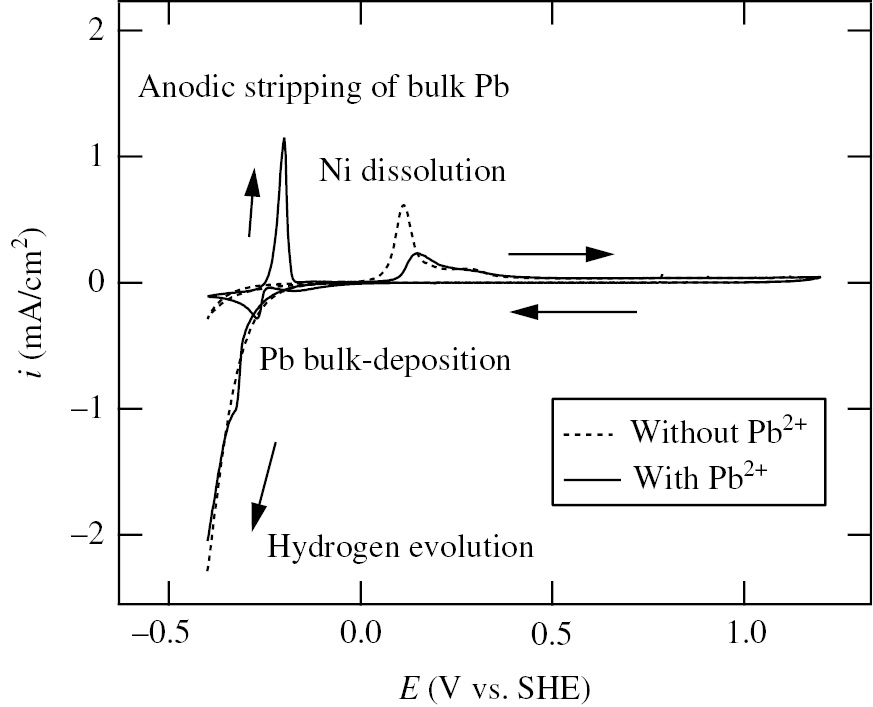
Voltammograms of Ni specimens at the first cycle in the wide potential region between −0.40 V and 1.20 V in deaerated 0.1 m NaCO4+10−2m HClO4 solutions without and with 10−3m Pb2+ (Seo et al., 2008). The solid and dashed lines represent the voltammograms in solutions with and without 10−3m Pb2+, respectively. PbO was added in solution to give 10−3m Pb2+. Potential sweep rate: 10 mV/s. Reproduced with permission from © Elsevier Ltd., 2008. All rights reserved.
Figure 5 shows the voltammograms of Ni specimens in the narrow potential region between −0.215 V and 0.80 V in which Ec,l is fixed at −0.215 V corresponding to Eeq(10−3m Pb2+/Pb) in order to avoid the influence of bulk-deposited Pb on the anodic dissolution of Ni. In Figure 5 as well as Figure 4, the presence of Pb2+ shifts the potential at the anodic current peak of Ni-active dissolution toward the positive direction and decreases the anodic current peak. In addition, in the presence of Pb2+ during the first cathodic potential sweep toward Ec,l, a cathodic current peak is observed at −0.12 V, which is associated with the electro-deposition of Pb (i.e. Pb-UPD) on Ni. On the other hand, during the subsequent anodic potential sweep from −0.215 V, no clear anodic current peak corresponding to the anodic stripping of electro-deposited Pb is observed up to 0.15 V at which the anodic current peak of Ni-active dissolution emerges, suggesting that the anodic current peak due to the anodic stripping of electro-deposited Pb is masked in the background current. The results of Figure 5 indicate that the inhibition effect of Pb2+ on the anodic dissolution of Ni is associated with Pb-UPD on Ni, which is consistent with those obtained in 0.1 m HClO4 at 90°C by Radhakrishnan et al. (2005).
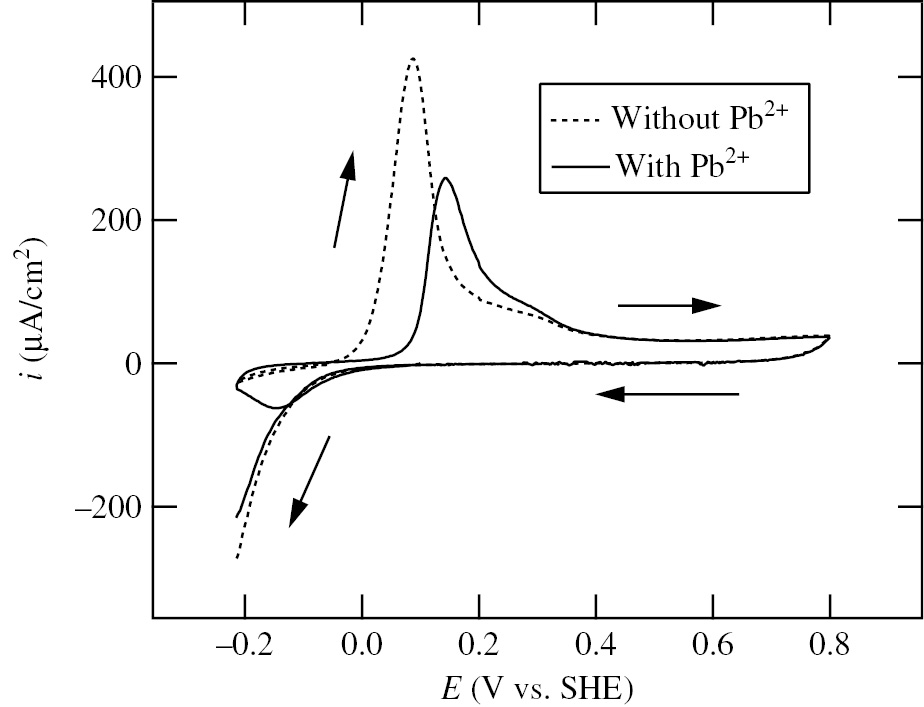
Voltammograms of Ni specimens at the first cycle in the narrow potential region between −0.215 V and 0.80 V in deaerated 0.1 m NaCO4+10−2m HClO4 solutions without and with 10−3m Pb2+ (Seo et al., 2008). The cathodic limit potential is fixed at Ec,l=−0.215 V corresponding to Eeq(10−3m Pb2+/Pb) in order to avoid the influence of bulk-deposited Pb on the anodic dissolution of Ni. The solid and dashed lines represent the voltammograms in solutions with and without 10−3m Pb2+, respectively. Potential sweep rate: 10 mV/s. Reproduced with permission from © Elsevier Ltd., 2008. All rights reserved.
Figure 6 shows the anodic polarization curves of Ni specimens measured starting from Ecorr at a potential sweep rate of 1.0 mV/s in deaerated 0.1 m NaClO4+10−2m HClO4+x M Pb2+ (x=0, 10−5, 10−4 and 10−3) solutions. The steady-state value of Ecorr shifts toward the positive direction with increasing Pb2+ concentration. The values of Ecorr are listed in Table 2. The potential, Ea,p, at the anodic current peak of Ni-active dissolution also shifts toward the positive direction with increasing Pb2+ concentration. Moreover, the height of the anodic current peak decreases with increasing Pb2+ concentration. In Figure 7, the logarithm of the anodic current density, ia, in the potential range between Ecorr and Ea,p is plotted versus the applied potential, E, at various Pb2+ concentrations. The anodic Tafel slope, b+, obtained from the linear relation between log ia and E is listed in Table 2. The corrosion current density, icorr, obtained with the extrapolation of the Tafel line at Ecorr is also listed in Table 2. The addition of 10−4m–10−3m Pb2+ decreases icorr by a factor of 3.
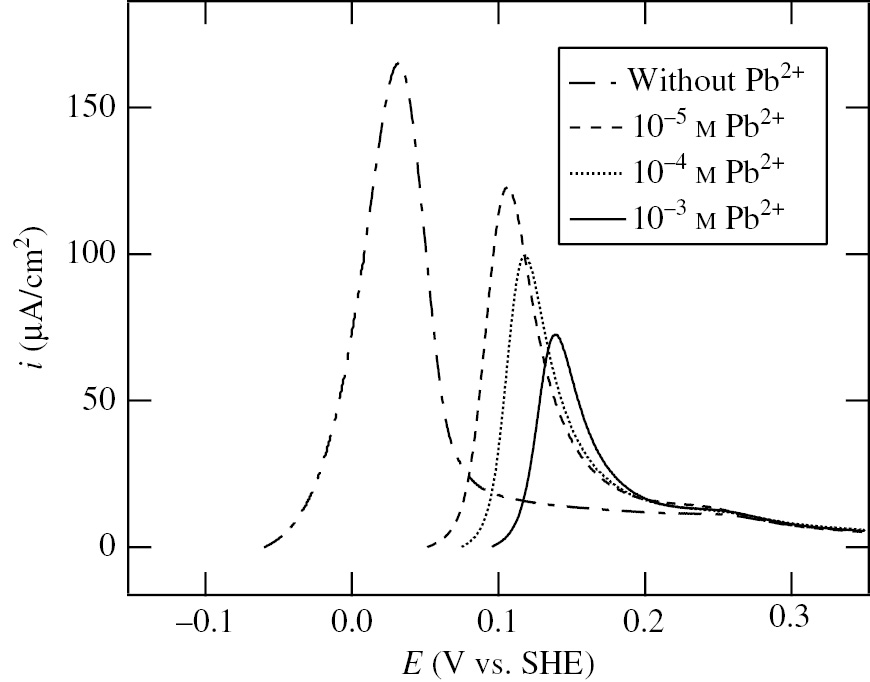
Anodic polarization curves of Ni specimens in deaerated 0.1 m NaClO4+10−2m HClO4+x M Pb2+ (x=0, 10−5, 10−4 and 10−3) solutions (Seo et al., 2008). The anodic polarization is started from Ecorr at a potential sweep rate of 1.0 mV/s. Reproduced with permission from © Elsevier Ltd., 2008. All rights reserved.
Parameters, Ecorr, b+ and icorr for anodic polarization of the Ni specimens in deaerated 0.1 m NaClO4+10−2m HClO4 solutions with various Pb2+ concentrations (Seo et al., 2008).
| cPb2+ (M) | E corr (V vs. SHE) | b + (mV/decade) | i corr (A/cm2) |
|---|---|---|---|
| 0 | −0.060 | 40 | 2.5×10⁻⁶ |
| 10−5 | 0.052 | 20 | 1.0×10⁻⁶ |
| 10−4 | 0.075 | 17 | 8.7×10⁻⁷ |
| 10−3 | 0.091 | 17 | 8.5×10⁻⁷ |
-
Reproduced with permission from © Elsevier Ltd., 2008. All rights reserved.
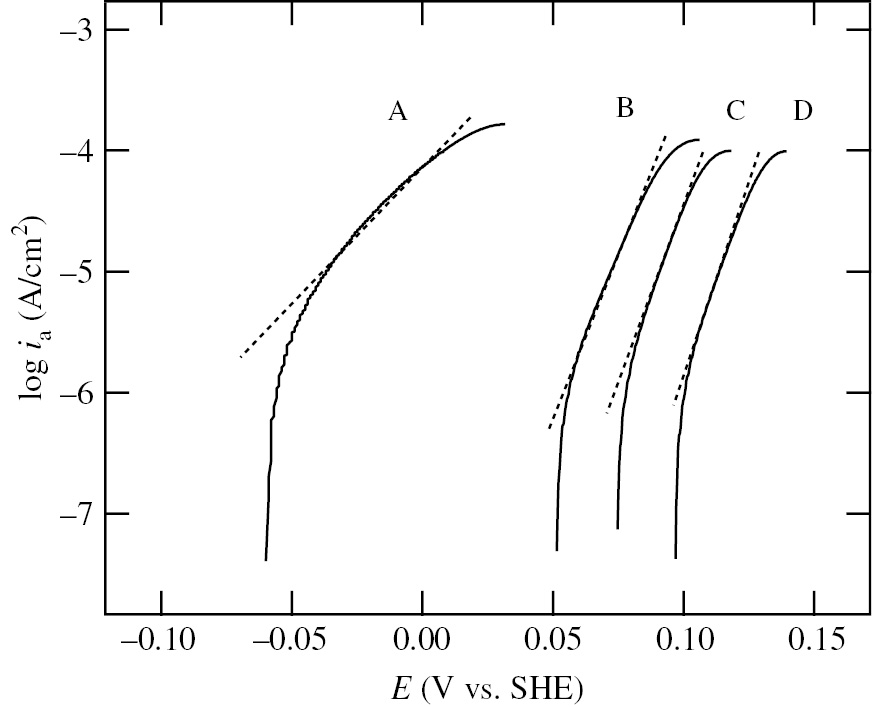
Logarithm of anodic current density, ia, versus applied potential, E, at various Pb2+ concentrations: (A) without Pb2+, (B) with 10−5m Pb2+, (C) with 10−4m Pb2+ and (D) with 10−3m Pb2+ (Seo et al., 2008). The data in Figure 7 are taken from the anodic polarization curves in Figure 6. Reproduced with permission from © Elsevier Ltd., 2008. All rights reserved.
The XPS and glow discharge-optical emission spectroscopy (GDOES) analyses (Seo et al., 2008) of Ni specimens polarized at different potentials in deaerated 0.1 m NaClO4+10−2m HClO4 solution with 10−3m Pb2+ have provided for the first time the evidence that Pb species is present on the Ni surfaces at potentials more positive than Eeq(10−3m Pb2+/Pb)=−0.215 V and the surface coverage of Pb species, θPb, decreases with increasing applied potential. Figure 8 shows the Pb 4f XPS spectra of Ni specimens polarized for 30 min at three different potentials in the presence of 10−3m Pb2+. It has been generally accepted that the amount of UPD species on noble metals is saturated at the equilibrium potential of bulk deposition (Herrero et al., 2001). Assuming θPb=1 at −0.215 V, θPb=0.43 at 0.07 V is estimated from the area ratio of the Pb 4f7/2 XPS peak at 0.07 V to that at −0.215 V. The value of θPb corresponding to Ecorr=0.091 V at 10−3m Pb2+ (Table 2) would be less than θPb=0.43 at 0.07 V since θPb decreases due to the anodic stripping of electro-deposited Pb with increasing potential. As shown in Figure 8, no Pb species is detected on the Ni surface at 0.80 V in the passive potential region of Ni. The GDOES results have also indicated that Pb species is absent on the Ni surface at potentials more positive than 0.30 V (Seo et al., 2008). The absence of Pb species in the passive region of Ni is consistent with the results obtained by Costa et al. (1995).
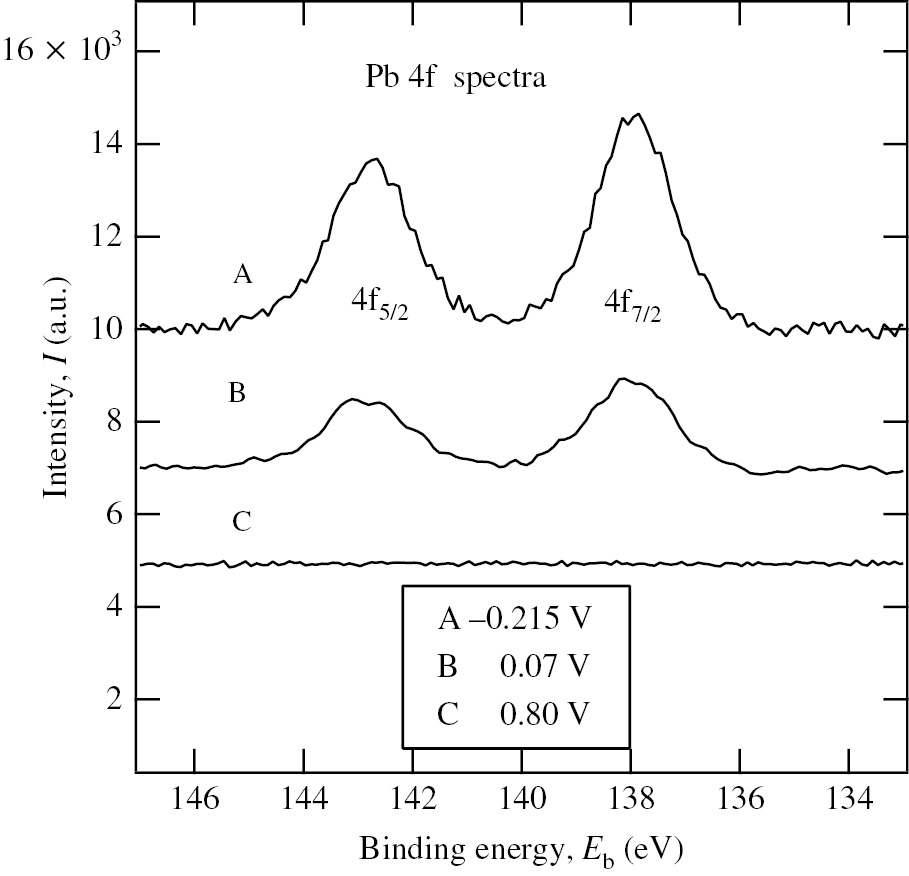
Pb 4f XPS spectra of the Ni specimens polarized for 30 min at three different potentials in deaerated 0.1 m NaClO4+ 10−2m HClO4 solution with 10−3m Pb2+: (A) −0.215 V, (B) 0.07 V and (C) 0.80 V (Seo et al., 2008). Reproduced with permission from © Elsevier Ltd., 2008. All rights reserved.
Assuming a Langmuir type of adsorption isotherm and employing the value of θPb=0.43 at −0.07 V reported by Seo et al. (2008), Protopopoff and Marcus (2013) calculated the standard free energy of formation (defined at θPb=0.5) for Pb-UPD on Ni, ΔGof (298.15 K)=−54.4 kJ/mol, and drew the stability domains of electro-deposited Pb on polycrystalline Ni in potential-pH diagrams at 25°C and 300°C in order to point out the importance of Pb-UPD on Ni for understanding the Pb-SCC mechanism of Ni-base alloys used in nuclear power plants. Figure 9 shows the potential-pH diagram for electro-deposited Pb on polycrystalline Ni at 300°C. It is remarked that the Ni2+/Ni or NiO/Ni equilibrium potential line is located within the stability domain of electro-deposited Pb on Ni. Besides, Protopopoff and Marcus (2017) derived the adsorption energies of Pb on Fe and Cr from density functional theory calculations and drew the stability domains of electro-deposited Pb on Fe and Cr in potential-pH diagrams at 25°C and 300°C. The stability domains of electro-deposited Pb on Fe, Cr and Ni are overlapped, suggesting that Pb-UPD participates in Pb-SCC of Ni-base alloys. According to Staehle (2004, 2005), Pb-SCC of Ni-base alloys in high-temperature water takes place in the vicinity of the NiO/Ni equilibrium potential boundary associated with the active/passive transition of Ni. Consequently, it is very probable that Pb-UPD plays a vital role in Pb-SCC as suggested by Newman (2005) although more detailed experiments on atomistic levels are needed in future to confirm the direct participation of Pb-UPD in the Pb-SCC mechanism.
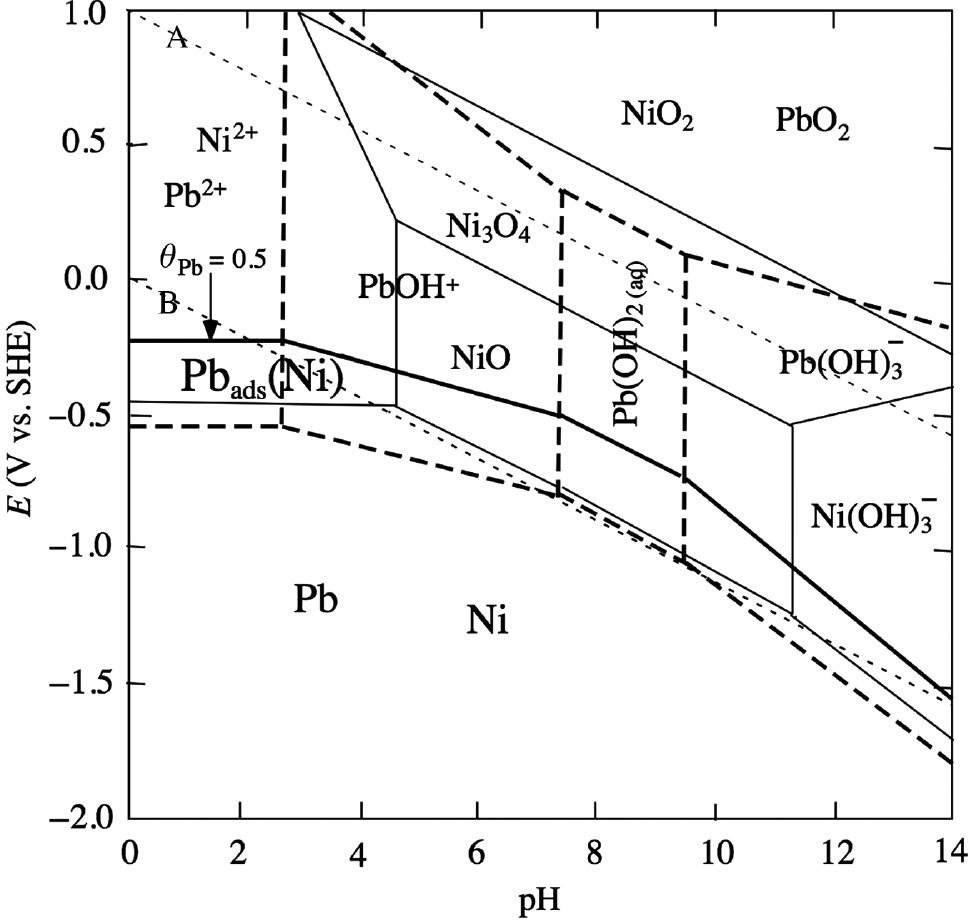
Potential-pH diagram for electro-deposited Pb on polycrystalline Ni at 300°C (Protopopoff & Marcus, 2013). Both molalities of dissolved Pb and Ni species are fixed to 10−6 mol/kg. The stability domains are limited by dotted (A, B) lines for the H2O system, thick-dashed lines for the Pb-H2O system, thin-solid lines for the Ni-H2O system, and the thick-solid lines for the Pbads(Ni)-Pb-H2O system (θPb=0.5), respectively. Reproduced with permission from The Electrochemical Society.
Furthermore, Seo et al. (2016) investigated the effect of Pb-UPD on the anodic dissolution and passivation of Fe, Fe-30Ni and Fe-70Ni binary alloys in acidic perchlorate solution at room temperature in relation to Pb-SCC of Ni-base alloys. The anodic polarization curves of pure Fe, Fe-30 Ni and Fe-70 Ni alloys were measured at a potential sweep rate of 1.0 mV/s from corrosion potential, Ecorr, in deaerated 0.1 m NaClO4+10−2m HClO4 solutions without and with 10−3m Pb2+. The order of Ecorr(Fe)=−0.377 V<Ecorr(Fe-30Ni)=−0.145 V<Ecorr(Fe-70Ni)=−0.095 V in the absence of Pb2+ is consistent with the order of corrosion resistivity of pure Fe and Fe-Ni binary alloys (Economy et al., 1961; Condit, 1972). It is expected that ΔEUPD widens with increasing Ni content in the alloy because of ΦNi=5.15 eV>ΦFe=4.5 eV. It has been found that the addition of 10−3m Pb2+ shifts Ecorr toward the positive direction, irrespective of alloy composition, and the positive shift in Ecorr increases with increasing Ni content in the alloy, suggesting that there is a correlation between Ecorr and ΔEUPD (Seo et al., 2016).
4.1.2 In situ XAS study of Pb-UPD on Ni
Although the presence of Pb species adsorbed on the Ni surface was experimentally verified by XPS, the peak position (138.0 eV) of the Pb 4f7/2 spectrum for the Ni specimens at −0.215 V and 0.07 V in Figure 8 is closer to that (137.95 eV) for Pb(OH)2 than to that (136.8 eV) for metallic Pb (Wagner, 1983), indicating that the Pb species is not metallic but in an oxidation state. However, surface in situ XAS, using synchrotron radiation, has provided clear evidence that the Pb species adsorbed on Ag or Pt is metallic (Samant et al., 1987; McBreen & Sansone, 1994). Consequently, it appears that the Pb species has been oxidized in air before the introduction of the Ni specimen into the XPS apparatus. In fact, surface in situ XAS is a powerful tool for the in situ characterization of the electrode/solution interface (Abruna, 1991; Lützenkirchen-Hecht & Strehblow, 2006; Nagy, 2011). The X-ray absorption near-edge structure (XANES) provides information on the chemical state of adsorbed species and the surface extended X-ray fine structure (EXAFS) provides information on the local atomic structure of the adsorption layer such as coordination number, inter-atomic distance and local order. In general, XAS is not sensitive to a surface since X-rays of high energy have long propagation length in condensed matters.
The surface XAS with grazing incidence excitation and fluorescence detection has to be employed in order to get the information limited to a surface. In application of surface XAS to the electrochemical UPD systems, a specimen electrode with a smooth surface and a thin electrolyte layer are indispensable for grazing angle excitation and for fluorescence detection. In the case of a Ni electrode subjected to corrosion in acidic solution, however, the above technique is not acceptable because of the changes in surface morphology and the precipitation of corrosion products in the thin electrolyte layer.
Seo et al. (2012) developed the periodical emersion method using a surface-roughened (sr-)Ni plate with a surface roughness (ratio of the real surface area to the geometrical surface area) of Sr=78.3 for the in situ XAS study of Pb-UPD on Ni in deaerated acidic perchlorate solution and succeeded in measuring the XAS spectra of Pb species on Ni under potentiostatic polarization. Figure 10 shows the normalized Pb LIII XANES spectra of the sr-Ni plate (solid curve) polarized at −0.185 V in deaerated 0.1 m NaClO4+10−2m HClO4 solution with 10−4m Pb2+, of the metallic Pb foil (dotted curve) and of the Pb2+ solution (dashed curve). The location of photon energy, Ep=13.037 keV, at μ=0.5 in the normalized Pb LIII XANES spectra of the sr-Ni plate at −0.185 V coincides with that of the metallic Pb foil. Moreover, the absorption peak at Ep=13.052 keV typical for the Pb2+ solution is not observed for the sr-Ni plate at −0.185 V. The results of Figure 10 have provided the first confirmative evidence that the Pb species on Ni at potentials more positive than Eeq(10−4m Pb2+/Pb) is metallic. Assuming that the uppermost surface of the Ni plate exposed to solution is mainly oriented to the Ni (111) plane, the EXAFS analysis was made to obtain the information on the surface atomic structure of the Pb-UPD layer on Ni. The most suitable surface atomic structure model for Pb-UPD on Ni obtained eventually by the EXAFS analysis is depicted in Figure 11, which represents the coexistence of the surface alloy and the overlayer with the same p (2×2) structure. Some Pb atoms (black circles) occupy a three-fold hollow site of Ni atoms (white circles), while other Pb atoms (gray circles) are embedded into the Ni lattice, surrounded by six nearest-neighbor Ni atoms in the first Ni layer and coordinated with three Ni atoms (not drawn in Figure 11) in the second Ni layer. Moreover, the inter-atomic distances, dPb-Ni=2.64 Å, between Pb (black or gray circles) and Ni (white circles) atoms, and, dPb-Pb=3.33 Å, between Pb (black circles) and Pb (gray circles) atoms were obtained by the EXAFS analysis. The value of dPb-Ni=2.64 Å is significantly small as compared to that (dPb-Ni=3.00 Å) estimated from a hard sphere model based on the metallic radii (rPb=1.75 Å and rNi=1.25 Å) of bulk polycrystalline Pb and Ni, indicating that the bonding between the Pb and Ni atoms is close to covalent (Brown et al., 2000). The effective radius of the Pb atom, rPb=1.39 Å, described in Figure 11 was determined from dPb-Ni=2.64 Å, assuming that the effective radius of the Ni atom, rNi=1.25 Å, is unchanged.
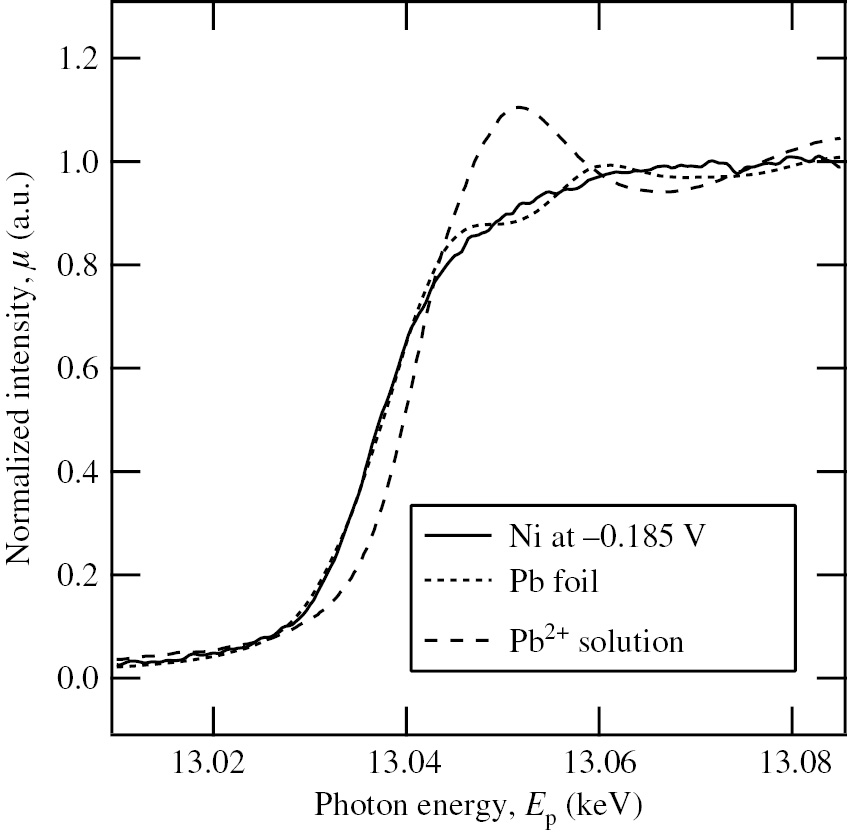
Normalized Pb LIII XANES spectra of the sr-Ni plate (solid curve) polarized at −0.185 V in deaerated 0.1 m NaClO4+10−2m HClO4 solution with 10−4m Pb2+, of the metallic Pb foil (dotted curve) and of the Pb2+ solution (dashed curve) (Seo et al., 2012). Reproduced with permission from © Elsevier B.V., 2012. All rights reserved.
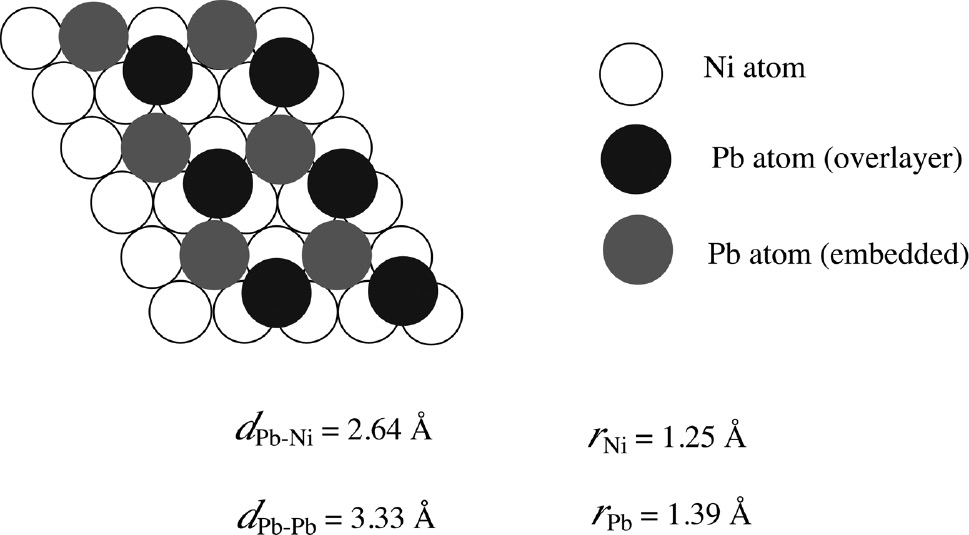
The most suitable surface atomic structure model for Pb-UPD on Ni representing the coexistence of the surface alloy and the overlayer with the same p (2×2) structure (Seo et al., 2012). Some Pb atoms (black circles) occupy a three-fold hollow site of Ni atoms (white circles), while other Pb atoms (gray circles) are embedded into the Ni lattice, surrounded by six nearest-neighbor Ni atoms in the first Ni layer and coordinated with three Ni atoms (not drawn in this figure) in the second Ni layer. The inter-atomic distances, dPb-Ni=2.64 Å, between the Pb (black or gray circles) and Ni (white circles) atoms, and, dPb-Pb=3.33 Å, between the Pb (black circles) and Pb (gray circles) atoms were also obtained by the EXAFS analysis. The effective radius of the Pb atom, rPb=1.39 Å, is determined from dPb-Ni=2.64 Å, assuming that the effective radius of the Ni atom, rNi=1.25 Å, is unchanged. Reproduced with permission from © Elsevier B.V., 2012. All rights reserved.
Despite the immiscibility of Pb in bulk Ni, the coexistence of the surface-constrained alloy phase with the overlayer in Figure 11 may be associated with the compressive surface stress produced by the large difference between the radii of the Pb and Ni atoms as pointed out by Ibach (1997). The transition between surface alloy and overlayer has been discussed by Nagl et al. (1994) for Pb-UPD on Cu (111) and by Shin et al. (2010) for Pb-UPD on Au (111). It is known that certain liquid metals embrittle certain pure or alloyed solid metals, e.g. Hg embrittles Zn and brass (Latanision & Westwood, 1970). The liquid-metal embrittlement (LME) has been discussed in terms of a decrease in surface energy associated with the adsorption of liquid-metal atoms at a crack tip. According to Staehle (2004), there has been no clear evidence that the Pb-LME is operative for Pb-SCC. Nevertheless, the above in situ XAS results (Seo et al., 2012) would give new insight of the Pb-SCC mechanism in which the electro-deposition of metallic Pb, followed by surface alloy formation, may promote the crack initiation of Ni-base alloys due to evolution of large internal compressive stress (equivalent to external tensile stress) in addition to a decrease in surface energy.
4.2 Sn-UPD effect on corrosion or anodic dissolution of iron, steel and nickel
4.2.1 Possibility for participation of Sn-UPD in corrosion of iron and steels
The inhibition effect of Sn2+ on corrosion of iron and steel has been investigated in connection with the development of Sn-containing steels (Buck & Leidheiser, 1957; Kudo & Okamoto, 1968; Osozawa, 1971; Sherlock, 1975; Morad, 2007; Nam et al., 2010; Kamimura et al., 2012). Osozawa (1971) investigated not only the corrosion resistances of austenitic stainless steels (Fe-18Cr-20Ni-2Mo) containing up to 0.26% Sn at 98°C in 5% sulfuric acid but also the effect of 10−4m Sn2+ (added in solution) on corrosion of stainless steel without Sn and reported that Sn2+ added in solution as well as Sn added in stainless steel inhibits both metal dissolution and hydrogen evolution at potentials more negative than −0.04 V. The inhibition of metal dissolution and hydrogen evolution was ascribed to the presence of precipitation film formed on the steel by the reaction of Sn2+ with metal ions dissolved from the steel, as suggested by Kudo and Okamoto (1968). Osozawa (1971) did not refer to the participation of Sn-UPD in corrosion of the steel. The potential window of Sn-UPD on austenitic stainless estimated from the work functions of Sn (ΦSn=4.42 eV) and steel (Φsteel=4.61 eV) is ΔEUPD=0.095 V. Consequently, it is deduced that Sn-UPD proceeds on the steel in the potential region between −0.256 V and −0.161 V. According to the results by Osozawa (1971), the corrosion rate of the steel takes a maximum at about −0.15 V, while the corrosion rate decreases by a factor of more than 100 in the presence of 10−4m Sn2+ at the same potential. Therefore, the participation of Sn-UPD in corrosion inhibition of steel at potentials more negative than −0.15 V may not be excluded.
Kamimura et al. (2012) have developed Sn-bearing steel (Fe-0.1–0.6% Sn) that exhibits a superior atmospheric corrosion resistance, particularly in chloride environment, and have reported that the addition of 5×10⁻⁴m Sn2+ in deaerated 3% NaCl (pH 1.0) solution at 30°C inhibits both anodic dissolution of Fe and hydrogen evolution. Kamimura et al. (2012) explained the inhibition of hydrogen evolution in terms of the bulk deposition of Sn on Fe. However, no clear explanation was made on the inhibition effect of Sn2+ on the anodic dissolution of Fe. According to the polarization results by Kamimura et al. (2012), Ecorr of Fe in the presence of 5×10⁻⁴m Pb2+ is about −0.30 V and an anodic current peak of 60 μA/cm2 appears at −0.27 V; then the anodic current decreases to about 25 μA/cm2 and stays constant in the narrow potential region between −0.24 and −0.20 V. Afterward, the anodic current increases rapidly with increasing potential. Eeq(5×10⁻⁴m Pb2+/Pb)=−0.235 V is more positive than Ecorr=−0.30 V, indicating that the bulk deposition of Sn on Fe proceeds at Ecorr. The potential window of Sn-UPD on Fe estimated from the work functions of Sn (ΦSn=4.42 eV) and Fe (ΦFe=4.5 eV) is ΔEUPD=0.04 V. Consequently, it is deduced that Sn-UPD proceeds on Fe in the narrow potential region between −0.235 V and −0.195 V. The potential region of Sn-UPD on Fe coincides with the narrow potential region of anodic current arrest in the presence of 5×10⁻⁴m Sn2+, suggesting that the participation of Sn-UPD in inhibition of anodic dissolution is likely.
4.2.2 Study of the Sn-UPD effect on the anodic dissolution of Ni
Seo et al. (2014b) investigated the effect of Sn2+ on the anodic dissolution of Ni in deaerated 0.2 m HClO4 solution with Sn2+ (added as SnO) at room temperature. Figure 12 shows the cyclic voltammograms of Ni specimens measured in the potential region between Ec,l=−0.226 V and Ea,l=1.0 V at a potential sweep rate of 10 mV/s in deaerated 0.2 m HClO4 solutions without and with 10−3m Sn2+. Ec,l=−0.226 V corresponds to Eeq(10−3m Sn2+/Sn). Ecorr=0. 22 V in the presence of 10−3m Sn2+ is more positive by 0.17 V than Ecorr=0.05 V in the absence of 10−3m Sn2+. The first potential cycle was initiated from Ecorr to Ec,l and then from Ec,l to Ea,l. The anodic current peak, ia,p, at about 0.2 V in the absence of 10−3m Sn2+ increases with increasing cycle number, while no anodic current peak in the presence of 10−3m Sn2+ appears, irrespective of the cycle number, indicating that the addition of 10−3m Sn2+ inhibits completely the anodic dissolution of Ni in 0.2 m HClO4. The potential window of Sn-UPD on Ni estimated from the work functions of Sn (ΦSn= 4.42 eV) and Ni (ΦNi=5.15 eV) is ΔEUPD=0.365 V. It is thus deduced that Sn-UPD proceeds on Ni in the potential region between −0.226 V and 0.139 V. Ecorr=0.05 V in the absence of 10−3m Sn2+ is located in the potential region of Sn-UPD on Ni, indicating that the shift of Ecorr toward the positive direction due to the addition of 10−3m Sn2+ is associated with Sn-UPD on Ni. However, Ecorr=0.22 V in the presence of 10−3m Sn2+ is more positive than the potential region of Sn-UPD on Ni. Figure 13 shows the Sn 3d XPS spectra of the Ni specimens polarized for 30 min at various potentials in deaerated 0.2 m HClO4 solution with 10−3m Sn2+ (Seo et al., 2014b). The Sn 3d3/2 peak area in Figure 13 decreases with increasing potential due to the anodic stripping of electro-deposited Sn. It is noted that Sn species is still present on the Ni surface at potentials more positive than the potential region of Sn-UPD on Ni and even in the passive region of Ni. The presence of Sn species on Ni means that the anodic stripping of Sn species does not proceed completely and the Sn species in the oxidation state remains partly on the Ni surface. A rotating ring-disk study by Vicente and Bruckenstein (1972) confirmed the incomplete anodic stripping of electro-deposited Sn on Au and the presence of Sn residue on the Au surface. It should be noted that Sn species in the metallic state is not observed in the potential region of Sn-UPD except for −0.20 V in 3d XPS spectra shown in Figure 13. The Sn species electro-deposited on Ni under potential control in solution may be oxidized in air since the Ni specimens after polarization were exposed to air and stored in a desiccator prior to the XPS analysis.
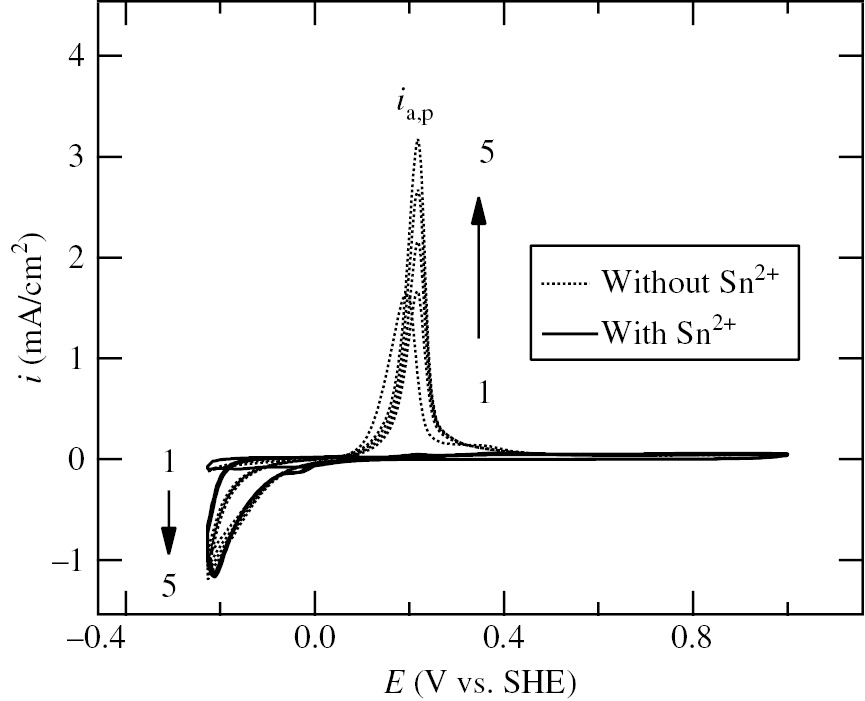
Cyclic voltammograms of Ni specimens measured in the potential region between Ec,l=−0.226 V and Ea,l=1.0 V at a potential sweep rate of 10 mV/s in deaerated 0.2 m HClO4 solutions without and with 10−3m Sn2+ (Seo et al., 2014b). The vertical arrows represent the changes in polarization behavior with cycle number (1→5). SnO was added in solution to give 10−3m Sn2+. Reproduced with permission from The Electrochemical Society.
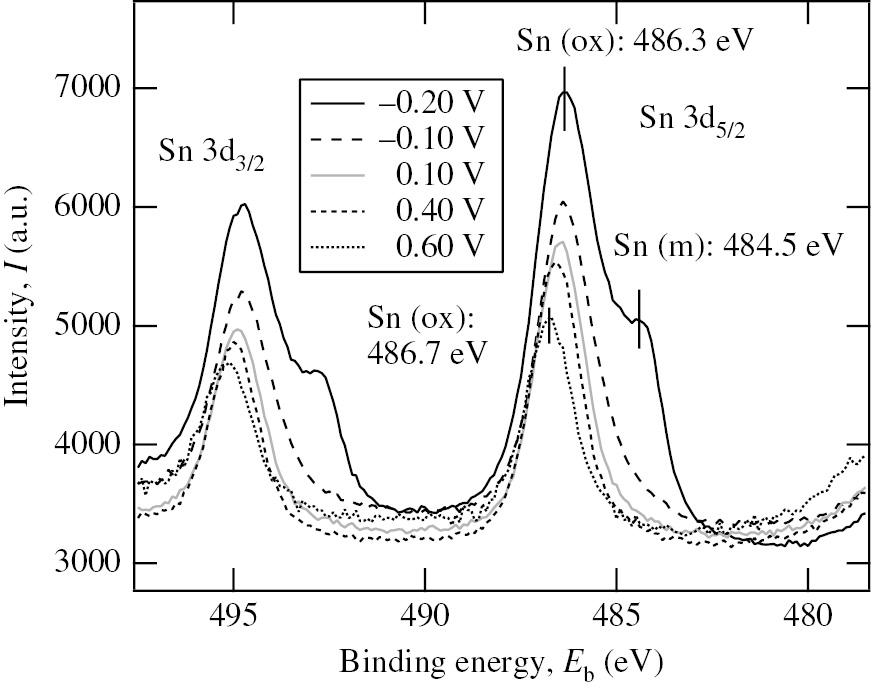
Sn 3d XPS spectra of the Ni specimens polarized for 30 min at various potentials in deaerated 0.2 m HClO4 solution with 10−3m Sn2+ (Seo et al., 2014b). The vertical bars marked with Sn (m) and Sn (ox) in the Sn 3d5/2 peak represent the energy positions of Sn in metallic and oxidized states, respectively. Reproduced with permission from The Electrochemical Society.
4.2.3 In situ XAS study of Sn-UPD on Ni
The in situ XAS study combined with the periodical emersion method using an sr-Ni plate with a surface roughness of 78.3 has been performed by Seo et al. (2014a) in order to investigate the chemical state and local structure of electro-deposited Sn on Ni under potential control in deaerated 0.2 m HClO4 solution with 10−3m Sn2+. Figure 14 shows the normalized XANES spectra of Sn K-edge for the sr-Ni plates polarized at −0.15 V and 0.05 V in deaerated 0.2 m HClO4 solution with 10−3m Sn2+. The normalized Sn K-edge XANES spectrum of the metallic β-Sn foil is also shown in Figure 14 for comparison. The normalized Sn K-edge XANES spectrum of the sr-Ni plate at −0.15 V or 0.05 V shifts to the high-energy side by about 5 eV as compared to that of the metallic β-Sn foil, indicating that the Sn species electro-deposited on the sr-Ni plate is in the oxidized state rather than the metallic state. For the EXAFS analysis of the Sn-UPD layer on Ni, the oscillatory part, χ(κ), of the normalized Sn K-edge XAS spectrum above the absorption edge for the sr-Ni plate was extracted as a function of the wave number, κ, by removing the smooth background to obtain the κ3-weighted EXAFS functions (κ3χ vs. κ curves).
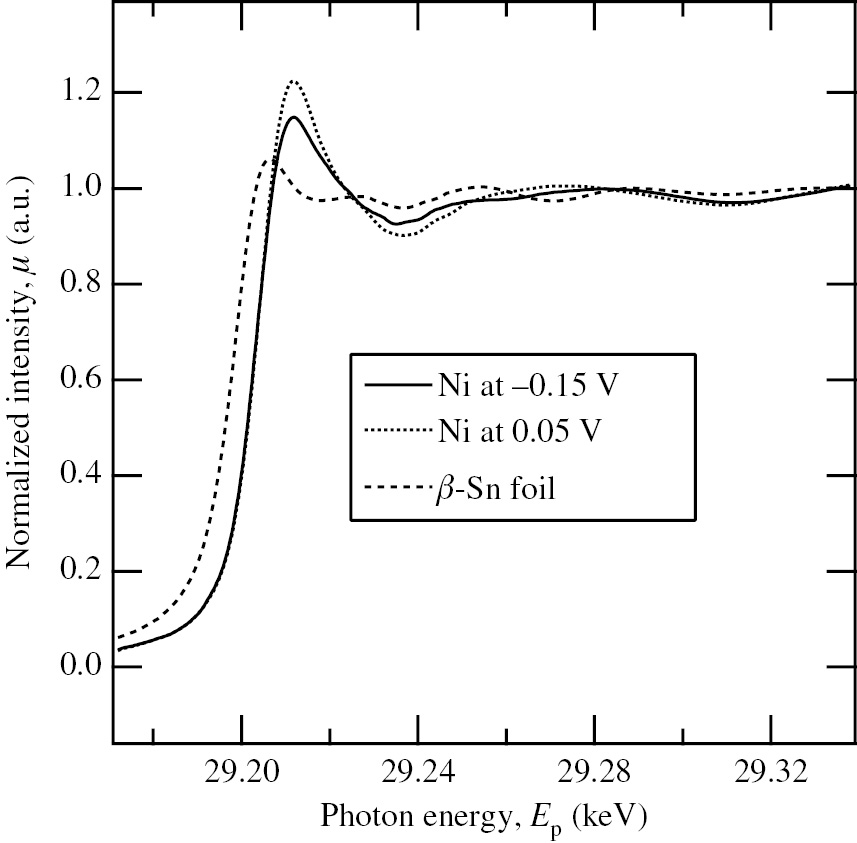
Normalized XANES spectra of the Sn K-edge for the sr-Ni plates polarized at −0.15 V and 0.05 V in deaerated 0.2 m HClO4 solution with 10−3m Sn2+ (Seo et al., 2014a). The normalized Sn K-edge XANES spectrum of a metallic β-Sn foil is also shown for comparison. Reproduced with permission from The Electrochemical Society.
Figure 15 shows the radial structure functions, RSFs (|χ(R)| vs. R curves), obtained by Fourier transforming the κ3-weighted EXAFS functions in the range of κ=2.5 Å−1–12.5 Å−1 for the sr-Ni plates at various potentials. The RSFs in Figure 15 have two major peaks, PA at R=1.7 Å and PB at R=2.2 Å. The peak height of PA increases with increasing potential, while the peak height of PB decreases reversely. These two peaks correspond to the first few coordination shells in the vicinity of absorbing Sn atoms. It has been clarified from the comparison with RSFs of Sn standard materials (β-Sn foil, SnO and SnO2) that the peaks, PA and PB, are assigned to the Sn-O and Sn-Ni interactions, respectively. The RSFs of the surface atomic structure models proposed for the Sn-UPD layer on Ni are simulated by using the program FEFF8.2 (Ankudinov et al., 1998, 2002) to compare wth the real RSFs in Figure 15 by curve fitting. As a result, a Sn-incorporation model is the most suitable in which Sn atoms are substituted like in a surface alloy at face-centered cubic sites in the first Ni layer and further coordinated with oxygen atoms (Seo et al., 2014a).
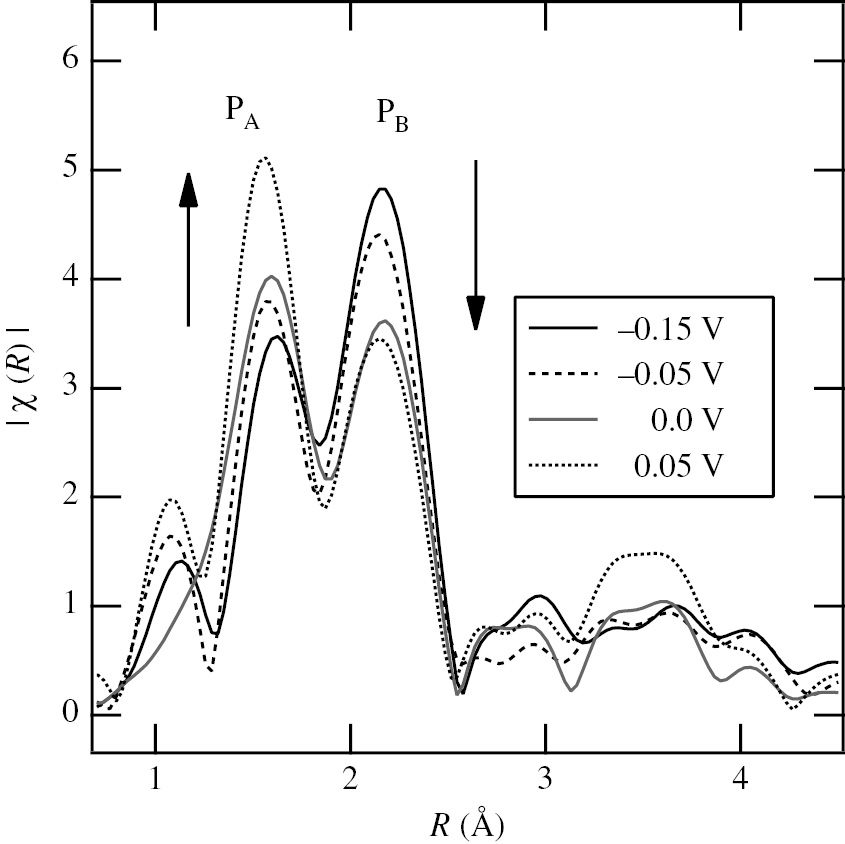
Radial structure functions, RSFs (|χ(R)| vs. R curves), obtained by Fourier transforming the κ3-weighted EXAFS functions (κ3χ vs. κ curves) in the range of κ=2.5 Å−1–12.5 Å−1 for the sr-Ni plates kept at various potentials in deaerated 0.2 m HClO4 solution with 10−3m Sn2+ (Seo et al., 2014a). The peaks, PA and PB, are assigned to the Sn-O and Sn-Ni interactions, respectively. Reproduced with permission from The Electrochemical Society.
The EXAFS parameters (including coordination number, inter-atomic distance, etc.) obtained with curve fitting for two shells of Sn-O and Sn-Ni based on the Sn-incorporation model are listed in Table 3. The inter-atomic distances between Sn and O, dSnO=2.03–2.04 Å, and between Sn and Ni, dSn-Ni=2.55–2.57 Å, are almost independent of potential, while the coordination number of Sn-O, NSn-O, increases from 1.5 to 2.9 with increasing potential and the coordination number of Sn-Ni, NSn-Ni, decreases reversely from 7.1 to 4.6. The values of dSnO and NSn-O at −0.22 V are not listed because of lack of a clear peak corresponding to the Sn-O interaction. The small values of R-factor (goodness of fit), Rf=0.004–0.012, in Table 3 exhibit the excellent match between real and simulated RSFs. Although the Sn K-edge XAS spectra on the sr-Ni plate are not measured at potentials more positive than 0.05 V, the values of NSn-O≈3.8 and NSn-Ni≈4.0 at the boundary potential (0.139 V) of Sn-UPD are estimated from the extrapolation of NSn-O and NSn-Ni at various potentials in Table 3. The EXAFS data in Table 3 support the presence of Sn residue on the Ni surface at potentials more positive than the potential region of Sn-UPD on Ni.
EXAFS parameters obtained with curve fitting for two shells of Sn-O and Sn-Ni based on the Sn-incorporation model for the sr-Ni plates kept at various potentials in deaerated 0.2 m HClO4 solution with 10−3m Sn2+ (Seo et al., 2014a).
| E (V) | Sn-O shell |
Sn-Ni shell |
R f | ||||||
|---|---|---|---|---|---|---|---|---|---|
| N Sn-O | d Sn-O(Å) | σ2 (Å2) | ΔEo(eV) | N Sn-Ni | d Sn-Ni(Å) | σ2 (Å2) | ΔEo(eV) | ||
| −0.22 | – | – | – | – | 7.1 | 2.55 | 0.0109 | −2.57 | 0.012 |
| −0.15 | 1.5 | 2.04 | 0.0012 | 3.07 | 5.7 | 2.57 | 0.0102 | 0.10 | 0.004 |
| −0.05 | 1.9 | 2.03 | 0.0017 | 1.46 | 5.6 | 2.57 | 0.0108 | −0.59 | 0.008 |
| 0.0 | 2.3 | 2.04 | 0.0026 | 4.58 | 4.8 | 2.57 | 0.0109 | −0.99 | 0.009 |
| 0.05 | 2.9 | 2.03 | 0.0021 | 3.30 | 4.6 | 2.55 | 0.0109 | −3.14 | 0.005 |
-
N Sn-O and NSn-Ni, coordination numbers; dSn-O and dSn-N, inter-atomic distances; σ2, Debye-Waller factor; ΔEo, energy shift; Rf, R-factor (goodness-of-fit). Both uncertainties of dSn-O and dSn-N are ±0.01 Å. Reproduced with permission from The Electrochemical Society.
The value of dSn-Ni=2.55–2.57 Å in Table 3 is significantly small as compared to that (dSn-Ni=2.65 Å) predicted from a hard sphere model based on the metallic radii (rSn=1.40 Å and rNi=1.25 Å) of bulk crystalline α-Sn and Ni. If the effective radius of Ni atoms surrounding central Sn atoms is unchanged from the bulk, the effective radius of the Sn atom is estimated to be rSn=1.31 Å, which is less by 0.09 Å than that (rSn=1.40 Å) of bulk crystalline α-Sn, suggesting that the bond between the Sn and Ni atoms is nearly covalent (Woodruff & Robinson, 2003). The significant reduction in the effective radius of the adsorbate at formation of surface alloy was reported for the vapor-deposited Sn monolayer (Woodruff & Vlieg, 2002) and Pb monolayer (Brown et al., 2000; Woodruff & Vlieg, 2002) on Ni (111). When Sn atoms are electro-deposited on the Ni surface, a large compressive surface stress could be produced due to the large difference between the radii of the Sn and Ni atoms, as pointed out by Ibach (1997). The reduction in rSn at the surface alloy formation in spite of the immiscibility of Sn in bulk Ni is energetically preferable since the relaxation of compressive surface stress is brought by the reduction in rSn. The value of dSnO=2.03–2.04 Å for the sr-Ni plate in Table 3 is slightly less than that (dSnO=2.05 Å) for bulk SnO2, which may be associated with the reduction in rSn at the surface alloy formation. It has been finally drawn from the above EXAFS results that the bonding of Sn atoms with oxygen atoms in addition to the covalent bonding of Sn atoms with Ni atoms suppresses the progress in anodic stripping of electro-deposited Sn with increasing potential to leave the Sn residue in the oxidized state on the Ni surface which inhibits completely the anodic dissolution of Ni. As described in the preceding section, the Pb-UPD behavior on Ni is different from the Sn-UPD behavior on Ni. The in situ XAS study of Pb-UPD on Ni (Seo et al., 2012) has indicated that Pb species on Ni is completely metallic and not oxygenated. Although the Pb atoms bonded with Ni atoms block the active sites of the Ni surface to inhibit the anodic dissolution of Ni, the anodic stripping of metallic Pb proceeds completely without leaving any Pb species on the Ni surface with increasing potential to induce the anodic dissolution from the bare surface sites prior to passivation. The difference between Pb-UPD and Sn-UPD on Ni may result from the strong affinity of Sn with oxygen as compared to Pb since the standard free energy (−251.8 kJ/mol) of SnO formation is more negative than that (−188.9 kJ/mol) of PbO formation (Sakai & Yokokawa, 2000).
5 Conclusions
This review criticized the results reported so far for the inhibition effect of the UPD of metallic cations on aqueous corrosion of metals and discussed the corrosion inhibition mechanism directly connected with UPD. The following conclusions were drawn:
The prerequisite for participation of UPD of Mz+ in aqueous corrosion of metal, M′, is that the corrosion potential of metal, M′, is located in the potential region where the UPD (electro-deposition) of Mz+ proceeds on the M′ surface. The potential window of UPD, ΔEUPD, can be estimated from the difference in work function between electro-deposited metal, M, and substrate metal, M′.
The inhibition effect of Mz+ (e.g. Pb2+, Cd2+, Zn2+ or Mn2+) on hydrogen evolution or hydrogen absorption on M′ (e.g. Armco iron, HY-130, SUS 304, AISI 4340 or type 780 alloy) has been classified into three potential regions: (a) bulk deposition, (b) UPD and (c) adsorption of metallic cations without discharging: (a) the potential of M′ is more negative than the equilibrium potential of the Mz+/M electrode, Eeq(Mz+/M), (b) is located between Eeq(Mz+/M) and Eeq(Mz+/M)+ΔEUPD and (c) is more positive than Eeq(Mz+/M)+ΔEUPD. However, the corrosion inhibition mechanism in the potential region (c) is not clear and has to be clarified in future. Moreover, it should be noted for the above classification that ΔEUPD depends on the selected value of work function for M and M′ which fluctuates between literatures.
The inhibition effect of Pb2+, Tl+ or Sn2+ on the anodic dissolution of Fe, Ni or Ni-base alloys in acidic solutions was ascribed to the UPD of these metallic cations. The study of Pb-UPD on Ni in acidic perchlorate solution has been recently undertaken to understand Pb-SCC caused by trace amounts of Pb in steam generator tubes in nuclear power plants. The electro-deposited Pb on Ni blocks the anodic dissolution sites of the Ni surface by strong bonding between the Pb and Ni atoms which inhibits the anodic dissolution.
Nevertheless, the anodic stripping of electro-deposited Pb on Ni proceeds with increasing potential to emerge the bare Ni surface from which the anodic dissolution of Ni takes place prior to passivation. XPS and GDOES analyses have indicated that no Pb species is present on the Ni surface in the passive region and the anodic stripping of electro-deposited Pb proceeds completely.
The study of Sn-UPD on Ni has been performed to compare with Pb-UPD on Ni. The addition of 10−3m Sn2+ inhibits completely the anodic dissolution of Ni in 0.2 m HClO4. XPS analysis has indicated that Sn species still remains on the Ni surface in the passive region and the anodic stripping of electro-deposited Sn species proceeds incompletely.
In situ XAS developed for Pb-UPD on Ni has indicated that Pb species on Ni is metallic and forms partly a surface alloy and has suggested that the possibility of crack initiation due to Pb-UPD for Pb-SCC is not excluded. In contrast, in situ XAS of Sn-UPD on Ni has indicated that Sn species is not only bonded with Ni atoms but also bonded with oxygen atoms and that the anodic dissolution of Ni is completely inhibited by the Sn species in the oxidized state remaining on the Ni surface as a result of the incomplete anodic stripping of Sn species.
In situ XAS is capable of investigating the chemical state of adsorption species and the local adsorption structure on an atomic level. The use of in situ XAS combined with electrochemical measurement is indispensable for clarifying the corrosion inhibition mechanism of metallic cations involving UPD.
About the author

Masahiro Seo received his PhD degree in applied chemistry (supervisor: Prof. Norio Sato) from Hokkaido University, Japan, in 1971. He joined Fontana Corrosion Center, Ohio State University as a postdoctoral fellow in 1972. From 1990 to 2005, Dr. Seo was a professor at Hokkaido University. His research interests were focused on aqueous corrosion and passivation processes of metal thin films, measurement of stresses generated during anodic oxidation or hydrogen absorption of transition metals, and evaluation of the mechanical properties of passive metal surfaces by nano-indentation in solution. Dr. Seo has authored and co-authored more than 200 scientific papers in the fields of interfacial electrochemistry and corrosion science. He is an ECS fellow and an honorary member of the Japan Society of Corrosion Engineering.
Acknowledgments
The author is gratefully indebted to the late Prof. Roger Staehle for bringing information on Pb-SCC in nuclear power plants and providing the motivation to study Pb-UPD. The author would like to thank Dr. Takenori Nakayama and Prof. Hiroki Habazaki for their support and helpful discussions.
References
Abruna HD. X-ray absorption spectroscopy in the study of electrochemical systems. In: Abruna HD, editor. Electrochemical interfaces: modern techniques for in-situ interface characterization. New York: VCH Pub Inc., 1991: 3–54.Search in Google Scholar
Adzic RR. Electrocatalytic properties of the surfaces modified by foreign metal adatoms. In: Gerischer H, editor. Advances in electrochemistry and electrochemical engineering, Vol. 13. New York: John Wiley & Sons, 1984: 242–243.Search in Google Scholar
Ankudinov AL, Ravel B, Rehr JJ, Condrason SD. Real-space multiple-scattering calculation and interpretation of x-ray-absorption near-edge structure. Phys Rev B 1998; 58: 7565–7576.10.1103/PhysRevB.58.7565Search in Google Scholar
Ankudinov AL, Bouldin CE, Rehr JJ, Sim J, Hung H. Parallel calculation of electron multiple scattering using Lanczos algorithms. Phys Rev B 2002; 65: 104–107.10.1103/PhysRevB.65.104107Search in Google Scholar
Brown D, Quinn PD, Woodruff DP, Bailey P, Noakes TCQ. Medium-energy ion scattering structural study of the Ni (111)
Buck WR III, Leidheiser H, Jr. The corrosion of single crystals and recrystallized single crystals of iron and steel in citric acid. J Electrochem Soc 1957; 104: 474–481.10.1149/1.2428630Search in Google Scholar
Condit DO. Potentiodynamic polarization studies of Fe-Ni binary alloys in sulfuric acid solution at 25°C. Corros Sci 1972; 12: 451–462.10.1016/S0010-938X(72)80091-XSearch in Google Scholar
Costa D, Talah H, Marcus P, le Calvar M, Gelpi A. Interaction of lead with nickel-base alloys 600 and 690. In: Proc. 7th international symposium on environmental degradation of materials in nuclear power systems-water reactors, NACE, 1995: 199–207.Search in Google Scholar
Devanathan MAV, Stachurski Z. The adsorption and diffusion of electrolytic hydrogen in palladium. Proc R Soc London Ser A 1962; 270: 90–102.10.1098/rspa.1962.0205Search in Google Scholar
Devanathan MAV, Stachurski Z. The mechanism of hydrogen evolution on iron in acidic solutions by determination of permeation rates. J Electrochem Soc 1964; 111: 619–623.10.1149/1.2426195Search in Google Scholar
Drazic DM, Hao CS. Inhibition of the anodic dissolution of iron in alkaline solution by metal complex ions. Corros Sci 1983; 23: 683–686.10.1016/0010-938X(83)90032-XSearch in Google Scholar
Drazic DM, Vorkapic LZ. Inhibitory effects of manganeous, cadmium and zinc ions on hydrogen evolution reaction and corrosion of iron in sulphuric acid solutions. Corros Sci 1978; 18: 907–910.10.1016/0010-938X(78)90011-2Search in Google Scholar
Economy G, Speiser R, Beck FH, Fontana MG. Anodic polarization behavior of iron-nickel alloys in sulfuric acid solutions. J Electrochem Soc 1961; 108: 337–743.10.1149/1.2428083Search in Google Scholar
Herrero E, Butler LJ, Abruna HD. Underpotential deposition at single crystal surfaces of Au, Pt, Ag and other materials. Chem Rev 2001; 101: 1897–1930.10.1021/cr9600363Search in Google Scholar PubMed
Hwang SS, Kim JS. Electrochemical interactions of lead with alloy 600 and alloy 690 in high-temperature water. Corrosion 2002; 58: 392–398.10.5006/1.3277628Search in Google Scholar
Ibach H. The role of surface stress in reconstruction, epitaxial growth and stabilization of mesoscopic structures. Surf Sci Rep 1997; 29: 193–263.10.1016/S0167-5729(97)00010-1Search in Google Scholar
Izutsu M. Electrochemistry handbook, 5th ed., The electrochemical society of Japan. Tokyo, Japan: Maruzen, 2000: 92–95.Search in Google Scholar
Jüttner K. The inhibition effect of underpotential metal deposits on iron corrosion. Werkst Korros 1980; 31: 358–363.10.1002/maco.19800310506Search in Google Scholar
Kamimura T, Kashima K, Sugae K, Miyuki H, Kudo T. The role of chloride ion on the atmospheric corrosion of steel and corrosion resistance of Sn-bearing steel. Corros Sci 2012; 62: 34–41.10.1016/j.corsci.2012.04.049Search in Google Scholar
Kolb DM. Physical and electrochemical properties of metal monolayers on metallic substrates. In: Gerischer H, Tobias CW, editors. Advances in electrochemistry and electrochemical engineering, Vol. 11. New York: John Wiley & Sons, 1978: 125–271.Search in Google Scholar
Kolb DM, Prazasnyski M, Gerischer H. Underpotential deposition of metals and work function differences. J Electroanal Chem 1974; 54: 25–38.10.1016/0368-1874(74)85093-8Search in Google Scholar
Kudo K, Okamoto G. Ellipsometry of inhibition of iron corrosion by stannous ions in acid solution. Boshoku Gijutsu (Japanese) 1968; 17: 109–113.10.3323/jcorr1954.17.3_109Search in Google Scholar
Lafranconi G, Mazza F, Sivieri E, Torchio S. The inhibition action of Pb2+ on stress corrosion cracking of austenitic stainless steels in acidic chloride media. Corros Sci 1978; 18: 617–629.10.1016/0010-938X(78)90055-0Search in Google Scholar
Latanision ML, Westwood ARC. Surface- and environment-sensitive mechanical behavior. In: Fontana MG, Staehle RW, editors. Advances in corrosion science and technology, Vol. 1. New York: Plenum Press, 1970: 83–91.10.1007/978-1-4615-8252-6_2Search in Google Scholar
Leidheiser H Jr. A review of proposed mechanisms for corrosion inhibition and passivation by metallic cations. Corrosion 1980; 36: 339–345.10.5006/0010-9312-36.7.339Search in Google Scholar
Lu YC. Effect of lead contamination on steam generator tube degradation. In: Allen TR, King PJ, Nelson L, editors. Proc. 12th international conference on environmental degradation of materials in nuclear power systems-water reactors. TMS, 2005: 1211–1219.Search in Google Scholar
Lu BT, Luo JL, Lu YC. A mechanistic study on lead-induced passivity-degradation of nickel-based alloy. J Electrochem Soc 2007; 154: C379–C389.10.1149/1.2741204Search in Google Scholar
Lützenkirchen-Hecht D, Strehblow HH. Synchrotron methods for corrosion research. In: Marcus P, Mansfeld F, editors. Analytical methods in corrosion science and engineering. New York: CRC Press, 2006: 169–235.10.1201/9781420028331.ch6Search in Google Scholar
McBreen J, Sansone M. In-situ X-ray absorption spectroscopic study of adsorbed Pb on carbon-supported Pt. J Electroanal Chem 1994; 373: 227–233.10.1016/0022-0728(94)03330-7Search in Google Scholar
Morad MS. Some environmentally friendly formation as inhibitors for mild steel corrosion in sulfuric acid solution. J Appl Electrochem 2007; 37: 661–668.10.1007/s10800-007-9297-1Search in Google Scholar
Nagl C, Haller O, Platzgummer E, Schmid M, Varga P. Submonolayer growth of Pb on Cu (111): surface alloying and de-alloying. Surf Sci 1994; 321: 237–248.10.1016/0039-6028(94)90189-9Search in Google Scholar
Nagy Z. Electrochemistry at synchrotrons. J Solid State Electrochem 2011; 15: 1679–1695.10.1007/s10008-010-1242-2Search in Google Scholar
Nam ND, Kim MJ, Jang YW, Kim JG. Effect of tin on corrosion behavior of low-alloy steel in an acid chloride solution. Corros Sci 2010; 52: 14–20.10.1016/j.corsci.2009.08.036Search in Google Scholar
Newman RC. Pb-SCC mechanism – a few remarks. In: Proc EPRI/ANL/NRC workshop on effects of lead (Pb) and sulfur (S) on the performance of secondary side tubing of steam generators in PWRs. Argonne National Laboratory, Chicago, 2005: G27–G31.Search in Google Scholar
Osozawa K. The effect of tin on the corrosion of molybdenum-containing austenitic stainless steel in dilute sulfuric acid. Boshoku Gijutsu (Japanese) 1971; 20: 120–126.10.3323/jcorr1954.20.3_120Search in Google Scholar
Popov BN, Zheng G, White RE. The underpotential deposition of zinc for mitigation of hydrogen absorption and penetration into HY-130 steel. Corros Sci 1994a; 36: 2139–2153.10.1016/0010-938X(94)90012-4Search in Google Scholar
Popov BN, Zheng G, White RE. Surface treatment for inhibition of corrosion and hydrogen penetration of type 718 alloy. Corrosion 1994b; 50: 613–619.10.5006/1.3293534Search in Google Scholar
Protopopoff E, Marcus P. Potential-pH diagrams for Pb adsorption on Cu and Ni surfaces at 25 °C and 300 °C. J Electrochem Soc 2013; 160: C106–C110.10.1149/2.017303jesSearch in Google Scholar
Protopopoff E, Marcus P. Potential-pH diagrams for Pb adsorption on Ni, Fe and Cr surfaces at 25 °C and 300 °C. J Electrochem Soc 2017; 164: C164–C170.10.1149/2.0931704jesSearch in Google Scholar
Radhakrishnan H, Carcea AG, Newman RC. Influence of Pb2+ ions on the dissolution and passivation of nickel and Ni-21Cr in acidic solutions. Corros Sci 2005; 47: 3234–3248.10.1016/j.corsci.2005.04.013Search in Google Scholar
Rashkov S, Bozhkov C, Kudryavtsev V, Pedan K, Bagaev S. The relationship between the underpotential deposition of zinc and the penetration of hydrogen in Armco-iron substrates. J Electroanal Chem 1988; 248: 421–429.10.1016/0022-0728(88)85102-7Search in Google Scholar
Sakai N, Yokoyama H. Electrochemistry handbook, 5th ed., The eletrochemical society of Japan. Tokyo, Japan: Maruzen, 2000: 38–40.Search in Google Scholar
Sakai T, Aoki K, Shigemitsu T, Kishi Y. Effect of lead water chemistry on oxide thin film of alloy 600. Corrosion 1992; 48: 746–750.10.5006/1.3315995Search in Google Scholar
Samant MG, Borges GL, Gordon JG II, Melroy OR, Blum L. In-situ surface extended X-ray absorption fine structure spectroscopy of a lead monolayer at a silver (111) electrode/electrolyte interface. J Am Chem Soc 1987; 109: 5970–5974.10.1021/ja00254a013Search in Google Scholar
Seo M. Underpotential deposition and metallic corrosion reaction. Zairyo-to-Kankyo 2012; 61: 341-348 (Japanese). Corros Eng 2012; 61: 237–247 (English Transl).10.3323/jcorr.61.341Search in Google Scholar
Seo M, Sato N. Differential compositional profiles of passive films on Inconel 600 and Incoloy 800 alloys. Corrosion 1980; 36: 334–339.10.5006/0010-9312-36.7.334Search in Google Scholar
Seo M, Fushimi K, Habazaki H, Nakayama T. Effect of underpotential deposition of lead on polarization behavior of nickel in acidic perchlorate solutions at room temperature. Corros Sci 2008; 50: 3139–3146.10.1016/j.corsci.2008.08.034Search in Google Scholar
Seo M, Fushimi K, Aoki Y, Habazaki H, Inaba M, Yokomizo M, Hayakawa T, Nakayama T. In-situ X-ray absorption spectroscopy for identification of lead species adsorbed on a nickel surface in acidic perchlorate solution. J Electroanal Chem 2012; 671: 7–15.10.1016/j.jelechem.2012.02.019Search in Google Scholar
Seo M, Habazaki H, Inaba M, Yokomizo M, Wakabayashi T, Nakayama T. In-situ X-ray absorption spectroscopy study of Sn underpotential deposition on Ni from perchloric acid. J Electrochem Soc 2014a; 161: H195–H202.10.1149/2.044404jesSearch in Google Scholar
Seo M, Hyono A, Habazaki H, Nakayama T. Effect of Sn2+ on anodic dissolution of Ni in perchloric acid. J Electrochem Soc 2014b; 161: C550–C556.10.1149/2.0591412jesSearch in Google Scholar
Seo M, Habazaki H, Nakayama T. Effect of Pb-underpotential deposition on anodic dissolution and passivation of pure Fe and Fe-Ni alloys in acidic perchlorate solution. J Solid State Electrochem 2016; 20: 3133–3142.10.1007/s10008-016-3210-ySearch in Google Scholar
Sherlock J C. Inhibition by stannous ions of the corrosion of mild steel. Br Corros J 1975; 10: 144–149.10.1179/000705975798320666Search in Google Scholar
Shin JW, Bertocci U, Strafford GR. Stress response to surface alloying and de-alloying during underpotential deposition of Pb on (111)-textured Au. J Phys Chem C 2010; 114: 7926–7930.10.1021/jp100357rSearch in Google Scholar
Staehle RW. Assessment of and proposal for a mechanistic interpretation of SCC in high nickel alloys in lead-containing environments. In: Proc 11th international conference on environmental degradation of materials in nuclear power systems-water reactors. American Nuclear Society, 2004: 381–424.Search in Google Scholar
Staehle RW. Clues and issues in the SCC of high nickel alloys associated with dissolved lead. In: Allen TR, King PJ, Nelson L, editors. Proc 12th international conference on environmental degradation of materials in nuclear power systems-water reactors. TMS, 2005: 1163–1210.Search in Google Scholar
Strehblow H-H, Marcus P. X-ray photoelectron spectroscopy in corrosion research. In: Marcus P, Mansfeld F, editors. Analytical method in corrosion science and engineering. New York: CRC Press, 2006: 1–37.10.1201/9781420028331.ch1Search in Google Scholar
Trasatti S. Work function, electronegativity, and electrochemical behavior of metals. J Electroanal Chem Interface Electrochem 1971; 33: 351–378.10.1016/0368-1874(71)80045-XSearch in Google Scholar
Trasatti S. The work function in electrochemistry. In: Gerischer H, Tobias CW, editors. Advances in electrochemistry and electrochemical engineering, Vol. 10, New York: John Wiley & Sons, 1977: 213–321.Search in Google Scholar
Tsukada M. Surface physics handbook. In: Koma A, Yagi K, Tsukada M, Aono M, editors. Tokyo, Japan: Maruzen, 1987: 535–536.Search in Google Scholar
Vicente VA, Bruckenstein S. Rotating gold ring-disk study of tin (II) in 4.0 molar hydrochloric acid. Anal Chem 1972; 44: 297–300.10.1021/ac60310a016Search in Google Scholar
Wagner CD. Auger and photoelectron energies and the Auger parameter: a data set. In: Briggs D, Seah MP, editors. Practical surface analysis by Auger and X-ray photoelectron spectroscopy. New York: John Wiley & Sons, 1983: 477–514.Search in Google Scholar
Woodruff DP, Robinson J. Some structural issues in surface alloys and alloy surface: rumpling, stacking faults and disorder. Appl Surf Sci 2003; 219: 1–10.10.1016/S0169-4332(03)00627-5Search in Google Scholar
Woodruff DP, Vlieg E. The structure of surface alloy phases on metallic substrate. In: Woodruff DP, editor. The chemical physics of solid surfaces, Vol. 10. Amsterdam, the Netherlands: Elesevier Science, 2002: 277–304.10.1016/S1571-0785(02)80095-5Search in Google Scholar
Zheng G, Popov BN, White RE. Surface treatment for mitigation of hydrogen absorption and penetration into AISI 4340 steel. J Electrochem Soc 1993; 140: 3153–3158.10.1149/1.2221001Search in Google Scholar
©2018 Walter de Gruyter GmbH, Berlin/Boston
Articles in the same Issue
- Frontmatter
- In this issue
- Editorial
- Special issue on Recent advances in corrosion science: celebrating the 90th birthday of Professor Norio Sato
- Reviews
- Some microelectrochemical methods for the investigation of passivity and corrosion
- Inhibition effect of underpotential deposition of metallic cations on aqueous corrosion of metals
- Role of anodic oxide films in the corrosion of aluminum and its alloys
- Development of novel surface treatments for corrosion protection of aluminum: self-repairing coatings
- Mini review
- High-temperature corrosion resistance of SiO2-forming materials
- Original articles
- Cyclic carburization-oxidation behavior of Hastelloy-X at 1000°C
- Growth of passive oxide films on iron and titanium under non-stationary state
- Influence of metal cations on inhibitor performance of gluconates in the corrosion of mild steel in fresh water