Chinese and English text classification techniques incorporating CHI feature selection for ELT cloud classroom
-
Yufen Wei


Abstract
Although online cloud classroom teaching has been popular, the current English teaching cloud classroom has the defects of low information utilization and low information acquisition accuracy. To improve the information utilization and accuracy in teaching, a Chinese and English text classification algorithm is proposed. The algorithm is based on an improved Chi-squared test feature selection (CHI) algorithm. The performance of CHI is optimized by adding parameters such as word frequency, document coverage, and coefficient of variation to the CHI algorithm. According to the experimental results, the proposed algorithm achieved a recall of up to 1.0 under the Chinese dataset. Its accuracy rate was 0.49 higher than traditional CHI. Under the English dataset, the MO of the proposed algorithm reached 0.9. The results indicate that the proposed algorithm has reliable classification ability for both English and Chinese texts and has the potential to be applied to the English language teaching cloud classroom.
1 Introduction
The Internet era has led to a change in teaching methods, and Internet-based teaching models are favored by the community. However, there are a variety of data and information in the Internet, such as text, images, sound, and video. Compared with other information storage modes, text is widely used in various application scenarios because of its fast uploading and downloading speed and less resource consumption [1]. In text, a variety of data information is stored. To improve the efficiency of text resources utilization, text classification techniques have emerged to improve the accuracy of text data information acquisition [2]. Text classification techniques can be used for filtering useless spam, creating digital libraries, and analyzing the emotional information of individuals [3]. Feature selection in text classification methods is an important way to reduce the dimensionality of information, eliminate irrelevant features, and improve classification accuracy. English language teaching (ELT) refers to the process of teaching English to people who are or are not the first language. English teaching involves a variety of professional theoretical knowledge, including linguistics, second-language acquisition, lexicology, syntax, stylistics, corpus theory, cognitive psychology, etc. In the application of the ELT cloud classroom, the relevant Chinese and English text data also need to be classified and studied [4]. In order to improve the efficiency of using text data information and the accuracy of data information acquisition in the English teaching cloud classroom, the Chi-squared test feature selection (CHI) method is proposed in this experiment to classify Chinese and English texts. In order to improve the application of the method, new parameters are introduced in the experiment for the direction of improvement and optimization. It is hoped that the optimization and improvement of the CHI feature selection method will improve the accuracy and application effect of Chinese and English text classification techniques in ELT cloud classrooms. The article introduces the process of the text classification system, starting with the feature selection algorithm as the improvement direction for the Chinese English text classification method. The research improves the efficiency of utilizing text data information in English teaching cloud classrooms and enhances the accuracy of Chinese and English text classification. This provides a new direction for text classification methods in English teaching cloud classrooms.
2 Review of the literature
The development of Internet technology has facilitated the emergence of cloud classrooms. The emergence of cloud classrooms has broken the limitations of time, space, and other factors [5]. Users are able to apply the cloud classroom for online learning and obtain relevant learning resources from the cloud classroom. Through the cloud classroom, users can exchange information with teachers or classmates to build their own set of knowledge structures. In the cloud classroom, students can use the Internet technology to study relevant courses. Catechism is one of the forms of cloud classroom applications. Xie and Mai improved this traditional teaching method. They analyzed the teaching needs using artificial intelligence as well as computer and other technologies. At the same time, they built a functional module that can be adjusted accordingly to the teaching effectiveness. The results proved that the model can effectively achieve the efficiency of English online teaching [6]. In order to improve the practical effectiveness of cloud classroom teaching, Sarac et al. set up a set of online teaching evaluations. By scoring information on students’ performance, participation, and attendance, teachers were able to control students’ learning in real time. At the same time, students were able to make timely adjustments and improvements in their learning methods based on this information feedback [7]. Researchers improved the intelligence of the cloud classroom by mining deeper information, such as user preferences. The introduction of a recommendation system allowed users to better access differentiated teaching resources. Additionally, the program filtered out useless spam, improving the accuracy of the recommendation method [8]. The utilization of cloud technology provided suitable recommendations for the staff involved. The technology was able to effectively solve the problems such as information interruptions during communication, thus improving the communication services [9]. The development of cloud technology provided strong technical support for the development of cloud classrooms. To analyze the impact of cloud computing on student performance, researchers collected and evaluated relevant factors. The relationship between student achievement and its influencing factors was finally obtained by establishing a relevant evaluation model [10].
There is a huge amount of data information in Internet teaching, which cannot be effectively used if it is not reasonably and effectively classified and processed. Therefore, it is also necessary to choose the appropriate classification method. In the existing research, decision trees, feature selection, support vector machine (SVM), and other methods can achieve accurate classification. To improve the accuracy as well as the efficiency of the classification model, Nigus and Doraiswamy used random forest for information filtering. In the validation of the classification method, the improved method was able to achieve an accuracy of more than 99% [11]. However, SVMs and Random Forests need to be adapted to the appropriate scenario for their application. Additionally, feature selection is a crucial aspect of text classification and can be effectively applied in this field. Pereira et al. improved this method and applied it to multi-label classification. The experimental results confirmed that the improved feature selection method has higher technical advantages. The method can perform accurate classification even when the data information increases and its scalability is high [12]. The CHI feature selection method can work with sparse text features. The study showed that the CHI feature selection-based text classification method outperforms other classification methods to some extent. The method exhibited higher classification accuracy as well as classification performance [13]. CHI feature selection was able to classify the fetus accurately when making the determination of its health level. The method can obtain the best features that can be used for the determination of the degree of heart health. In the validation experiments of accuracy and other indicators, the method had a high classification effect [14].
Studies have shown that contextualized instruction plays a pivotal role in language teaching [15]. Therefore, scene classification and information extraction are also needed in ELT. Therefore, feature selection-based Chinese and English text classification techniques play an important role in ELT. The above study shows that the feature selection method has a high text classification effect. To enhance the practicality of Chinese and English text classification technology in ELT cloud classrooms, this experiment proposes to use the CHI feature selection method to classify Chinese and English texts. To enhance the application of the method, further optimization parameters are introduced. It is hoped that the optimization and improvement of the CHI feature selection method can improve the accuracy and application effect of Chinese and English text classification techniques in English teaching cloud classrooms.
3 Fusion of improved CHI Chinese and English text classification algorithm
3.1 Improved CHI algorithm for feature words
CHI algorithm, as a statistical-based text classification algorithm, can finely measure the relationship between classified categories and feature words and has the characteristics of low complexity and high generalizability [16]. CHI can take into account both local and global features. However, CHI has non-negligible drawbacks in the practical application of text classification; first, this algorithm only takes the document frequency of feature words as the main judgment element and does not consider the word frequency and the distribution characteristics of feature words in the dataset [17]. This calculation method will give higher weights to low-frequency words, which leads to low-frequency defects [18]. Under the CHI algorithm, the CHI values between features and categories need to be calculated first, as in the following equation:
In equation (1),

Parameter judgment process of the CHI algorithm.
For text classification problems, the total amount of text in their corpus is usually fixed, and therefore categories in the corpus are also fixed. Parametrically, this means that both A + C and B + D are fixed values that do not vary with features. In the calculation of correlation, the factors that are not related to the object can be omitted, so the calculation of CHI values can be simplified to the following equation:
In practical text classification tasks, the corpus often contains plural categories, so the CHI values of object features corresponding to each category need to be calculated separately. Thereafter, the CHI value of the feature for the whole corpus is derived by the maximum value method, and the process is shown in the following equation:
In equation (3),
In equation (5),
In equation (6),
Distribution of features in corpus
| Feature\Category | Belong | Not belong | Total | |
|---|---|---|---|---|
| tI | Included | A = 95 | B = 5 | A + B = 100 |
| Excluded | C = 200 | D = 200 | C + D = 400 | |
| Total | A + C = 295 | B + D = 205 | — | |
| tII | Included | A = 60 | B = 40 | A + B = 100 |
| Excluded | C = 200 | D = 200 | C + D = 400 | |
| Total | A + C = 260 | B + D = 240 | — | |
| tIII | Included | A = 45 | B = 55 | A + B = 100 |
| Excluded | C = 200 | D = 200 | C + D = 400 | |
| Total | A + C = 245 | B + D = 255 | — | |
According to the ranking results of feature terms in Table 1, the value of parameter A is proportional to the classification ability of features, and the value of parameter B is inversely proportional to the classification ability of features. Based on this law, a document coverage index is constructed, and the value of this index is proportional to the classification ability of features, as shown in the following equation:
In equation (6),

Schematic diagram of word frequency coverage.
When performing a classification task with multiple texts, the feature terms used for differentiation should have the highest possible word frequency. A parameter
In equation (8),
In equation (9),
3.2 Optimization and construction of coefficient of variation for CHI Chinese and English text classification algorithm
The CHI algorithm is the core of Chinese and English text classification techniques. After the construction of the CHI algorithm is completed, other techniques and optimization methods need to be used to build the Chinese and English text classification algorithms. Here, the coefficient of variation and classifier techniques will be used to complete the Chinese and English text classification algorithms. The coefficient of variation is a measure of the fluctuation of variables in the data, and its mathematical expression is shown in the following equation:
In equation (11),
The denominator in equation (13) needs to be added 1 to avoid the case of a zero denominator. In the mathematical expression of this parameter, the numerator is the mean of the word frequencies, and the denominator is the variance of the word frequencies. This is the inverse form of the coefficient of variation, so the larger this parameter is, the greater the value of the feature term for its corresponding classification. After adding this parameter to the CHI algorithm, the CHI algorithm changes to the form shown in the following equation:
After completing the feature selection based on the CHI algorithm, the selected feature words need to be given the correct weights. Here, the term frequency-inverse document frequency (TF-IDF) algorithm is used to complete the weighting work. As a highly generalized weighting technique, the weight of a keyword is calculated based on its frequency of occurrence in the text and its importance in the text collection for similarity comparison and relevance ranking of text content. Where the inverse document frequency is a measure of the general importance of a term, i.e., the number of times a keyword appears in all documents, reflecting the importance of the term. Therefore, the core idea of the TF-IDF algorithm is that the weights of words that appear more frequently in the text should be appropriately adjusted downward, while the weights of words that do not appear much in the text but appear more frequently in other texts should be appropriately increased [19]. The mathematical definition of TF-IDF is shown in the following equation:
In equation (14),
The proposed algorithm is a Chinese and English text classification algorithm based on improved CHI (ICHI) with improved TF-IDF. According to its construction process, the algorithm flowchart is shown in Figure 3. Document coverage, word frequency, inter-class word frequency variance, and coefficient of variation are added to optimize the traditional CHI, which to some extent compensates for the problem of incomplete consideration of feature term distribution in the traditional CHI. In addition, the TF-IDF algorithm based on variance coefficient optimization is used to assign weights in the weighting session, which improves the problem that ORIGINAL TF-IDF cannot effectively handle the intra-category distribution.

Flowchart of the proposed algorithm.
The constructed text classification algorithm needs classifiers to operate, and the commonly used classifiers include the plain Bayesian algorithm, K-nearest neighbors (KNN) algorithm, and so on. The proposed algorithm is applied to two classifiers separately to compare which classifier is more suitable for Chinese and English text classification under the proposed algorithm. The two classifiers are shown in Figure 4. KNN compares a new sample with an existing sample and finds the nearest sample to that sample to complete the classification. In contrast, the plain Bayesian algorithm assumes that the sample features are independent of each other, calculates the probability corresponding to each category by means of probability calculation formulas such as prior probability, conditional probability, and posterior probability, and assigns the test sample to the category with the highest probability.

Two classifiers. (a) KNN. (b) Naïve bayes.
Finally, the validation process of the text classification algorithm needs to be designed, as shown in Figure 5. The process is based on the general process of text classification, where the text corpus is divided into a training set and a test set after common word separation and pre-processing. After the data are processed by the text classification algorithm and classifier, the performance of the classification algorithm is evaluated by its output results.
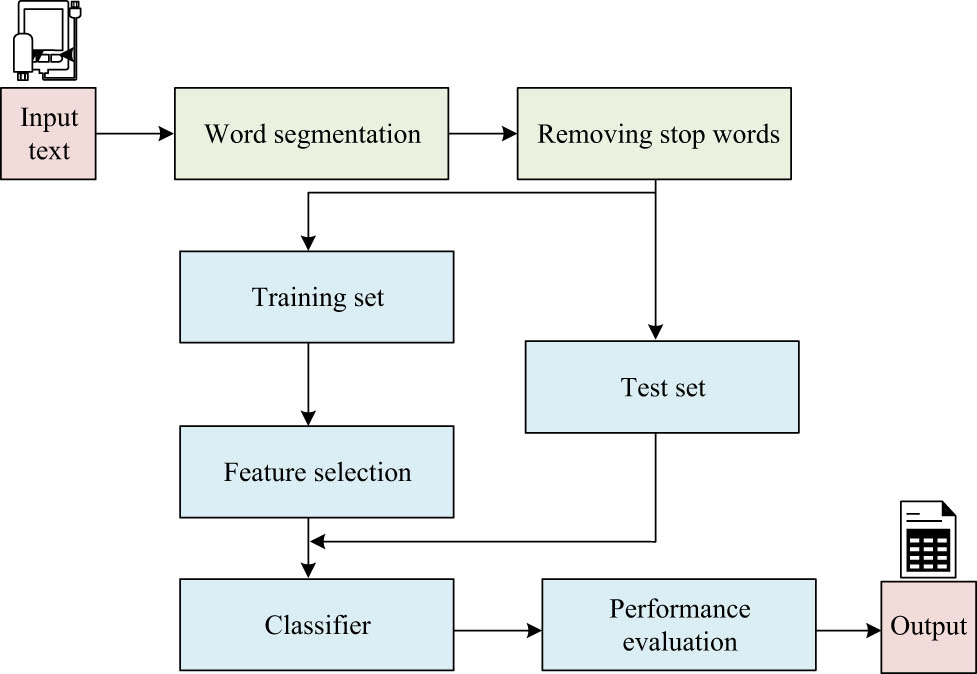
Algorithm validation process.
4 Experiment on CHI feature selection based on Chinese and English text classification algorithms
The experimental verification of a model refers to the process of measuring the data processing ability (i.e., reliability) of the calibrated model. The system environment used in the experiment is Windows 10, which has a good balance between stability and timeliness. The programming environment is Python, and the running memory is 32 GB. Since the proposed ICHI algorithm can target both Chinese and English, the dataset used in the experiment should also contain both Chinese and English corpus [21]. The specific datasets used are shown in Table 2. Training the proposed method in the experiment using different types of databases can improve its learning ability in Chinese and English text classification, thereby improving the accuracy of the method. Due to the greater difficulty of learning Chinese text than English text, more learning areas are chosen to train the methods designed in the experiment. Due to the possibility of involving knowledge from different disciplines in online teaching, the selection of corpus should not be limited to basic knowledge. Therefore, a corpus with a wide range is selected for model training and learning in the experiment. The corpus used in this study is the Chinese text classification corpus from the Intelligent Information Processing Laboratory of the School of Information Management at Sun Yat-sen University. It consists of 14 categories and 36,865 documents that have been manually annotated with high accuracy. For the experiment, ten categories with a large number of texts are selected, and two datasets, balanced corpus and unbalanced corpus, are used for text classification. The two datasets have identical conditions, except for the varying number of texts in each category. This study utilizes the renowned Reuters 21,578 news corpus in English. Due to the skewed nature of this corpus, the experiment only employs an unbalanced corpus. For the Chinese dataset, ten different categories of datasets are used, which corresponded to topics such as culture, education, news, sports, and science. For the English dataset, a total of 7 datasets are used, covering topics such as Student, Trade, Ship, and Interest. The total corpus of English data is over 2 MB.
Data set used
| Data set | Amount (kB) | Total (kB) | |
|---|---|---|---|
| Chinese | Culture | 1,500 | 15,000 |
| Education | 1,500 | ||
| Entertainment | 1,500 | ||
| News | 1,500 | ||
| Finance | 1,500 | ||
| Race | 1,500 | ||
| Health | 1,500 | ||
| Belief | 1,500 | ||
| Sports | 1,500 | ||
| Technology | 1,500 | ||
| English | Acy | 460 | 2,103 |
| Crude | 180 | ||
| Earn | 545 | ||
| Interest | 318 | ||
| Ship | 195 | ||
| Student | 205 | ||
| Trade | 200 | ||
The KNN classifier is mainly used as the vehicle for running the text classification algorithm during the experiments. Before the performance test starts, the ICHI algorithm needs to be run on a trial basis under different parameters to determine the best configuration. The results of the trial run are shown in Figure 6, where Figure 6(a) shows the performance of the algorithm under different K values, and Figure 6(b) and (c) show the classification results of the algorithm under different feature dimensions for English and Chinese, respectively. To identify the performance of the proposed algorithm by comparison, the CHI algorithm is used as the reference system in this experiment. As the value of K increases, the ICHI algorithm shows a trend of increasing and then decreasing. The F1 value of the ICHI algorithm reaches its maximum value when the value of K is 7, which is 0.86. The performance of the CHI algorithm fluctuates less with the value of K, but its performance is lower than that of the ICHI algorithm at any K value. The performance of the ICHI algorithm is significantly higher than that of CHI in both English and Chinese scenes, and ICHI performs best in English scenes with the highest F1 value when the feature dimension is 20 and in Chinese scenes when the feature dimension is 150. In summary, during the experiments and applications, the algorithm has a feature dimension of 20 and 150 in English and Chinese, respectively, while its KNN classifier has a K value of 7.
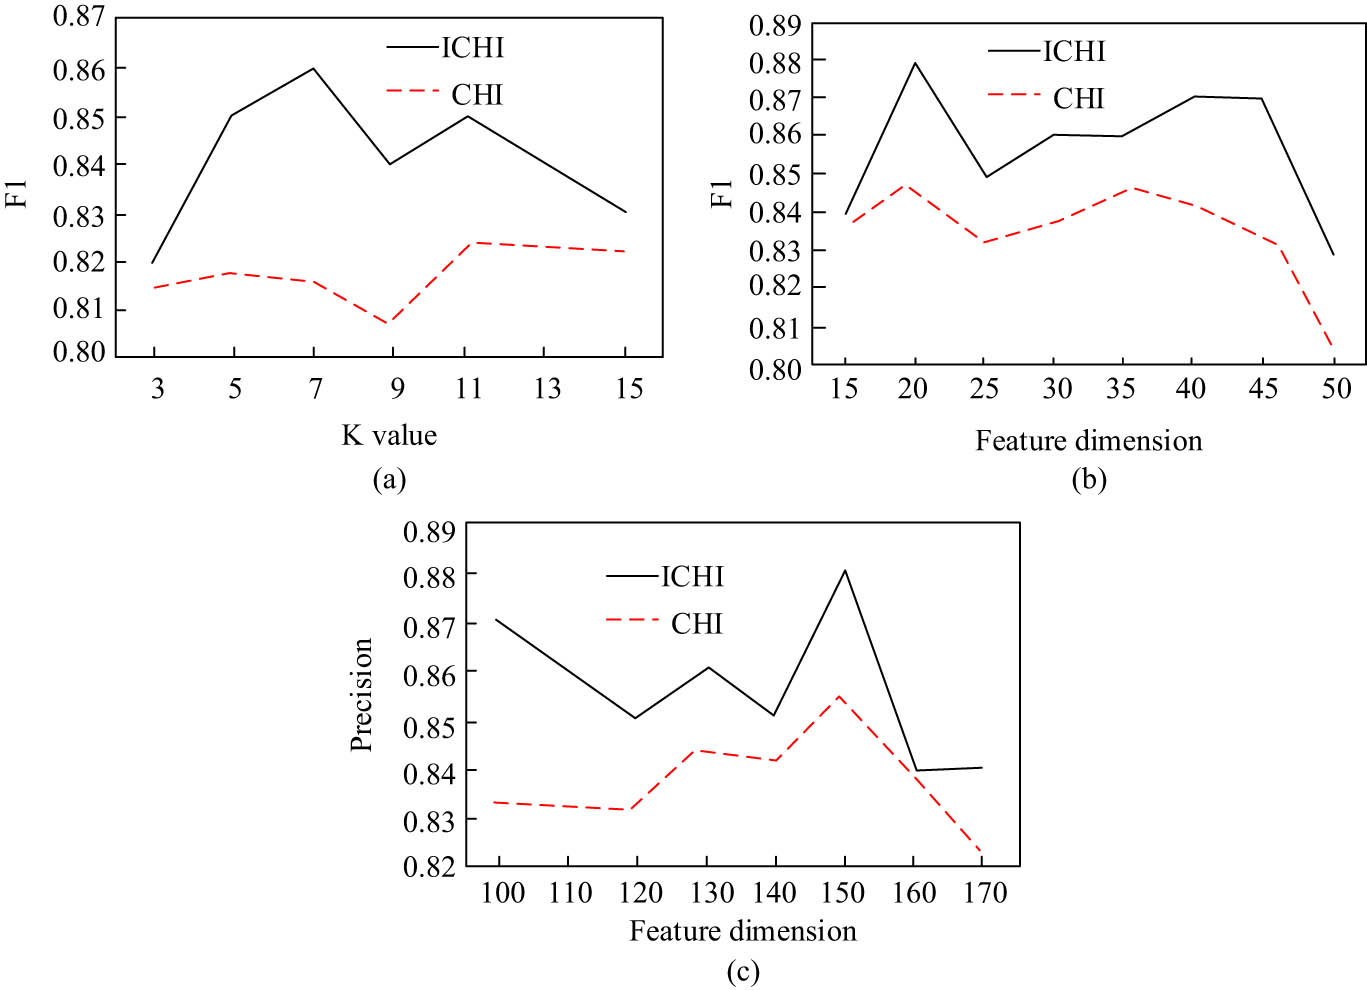
Performance under different settings. (a) Performance under different K. (b) English classification under different feature dimension. (c) Chinese classification under different feature dimension.
In artificial intelligence algorithms, evaluating the trained model is necessary to determine its quality after implementing the algorithm model training. The main evaluation indicators include precision, which represents the proportion of correctly predicted positive results to all predicted positive results, and recall rate, which represents the proportion of correctly predicted positives to all actual positives. The F1 score is calculated as the harmonic mean of precision and recall, and a higher score indicates better performance. The performance of the algorithm is first tested and compared under the Chinese data set. The test results are shown in Figure 7. Figure 7(a)–(c) depict the precision rate, recall rate, and F1 value of ICHI and traditional CHI algorithms under ten types of Chinese corpus, respectively. In terms of precision, ICHI outperforms CHI in seven datasets, and the difference between them reaches up to 0.49. CHI outperforms ICHI in only two datasets, and the difference only reaches up to 0.03. In terms of recall, ICHI outperforms CHI in 9 out of 10 datasets, and the recall of ICHI reaches up to 1.0, when the Chinese corpus is Belief. In addition, the F1 value of ICHI reached a maximum of 0.96, corresponding to the Chinese corpus Race, and its F1 value is higher than that of CHI in eight Chinese datasets.
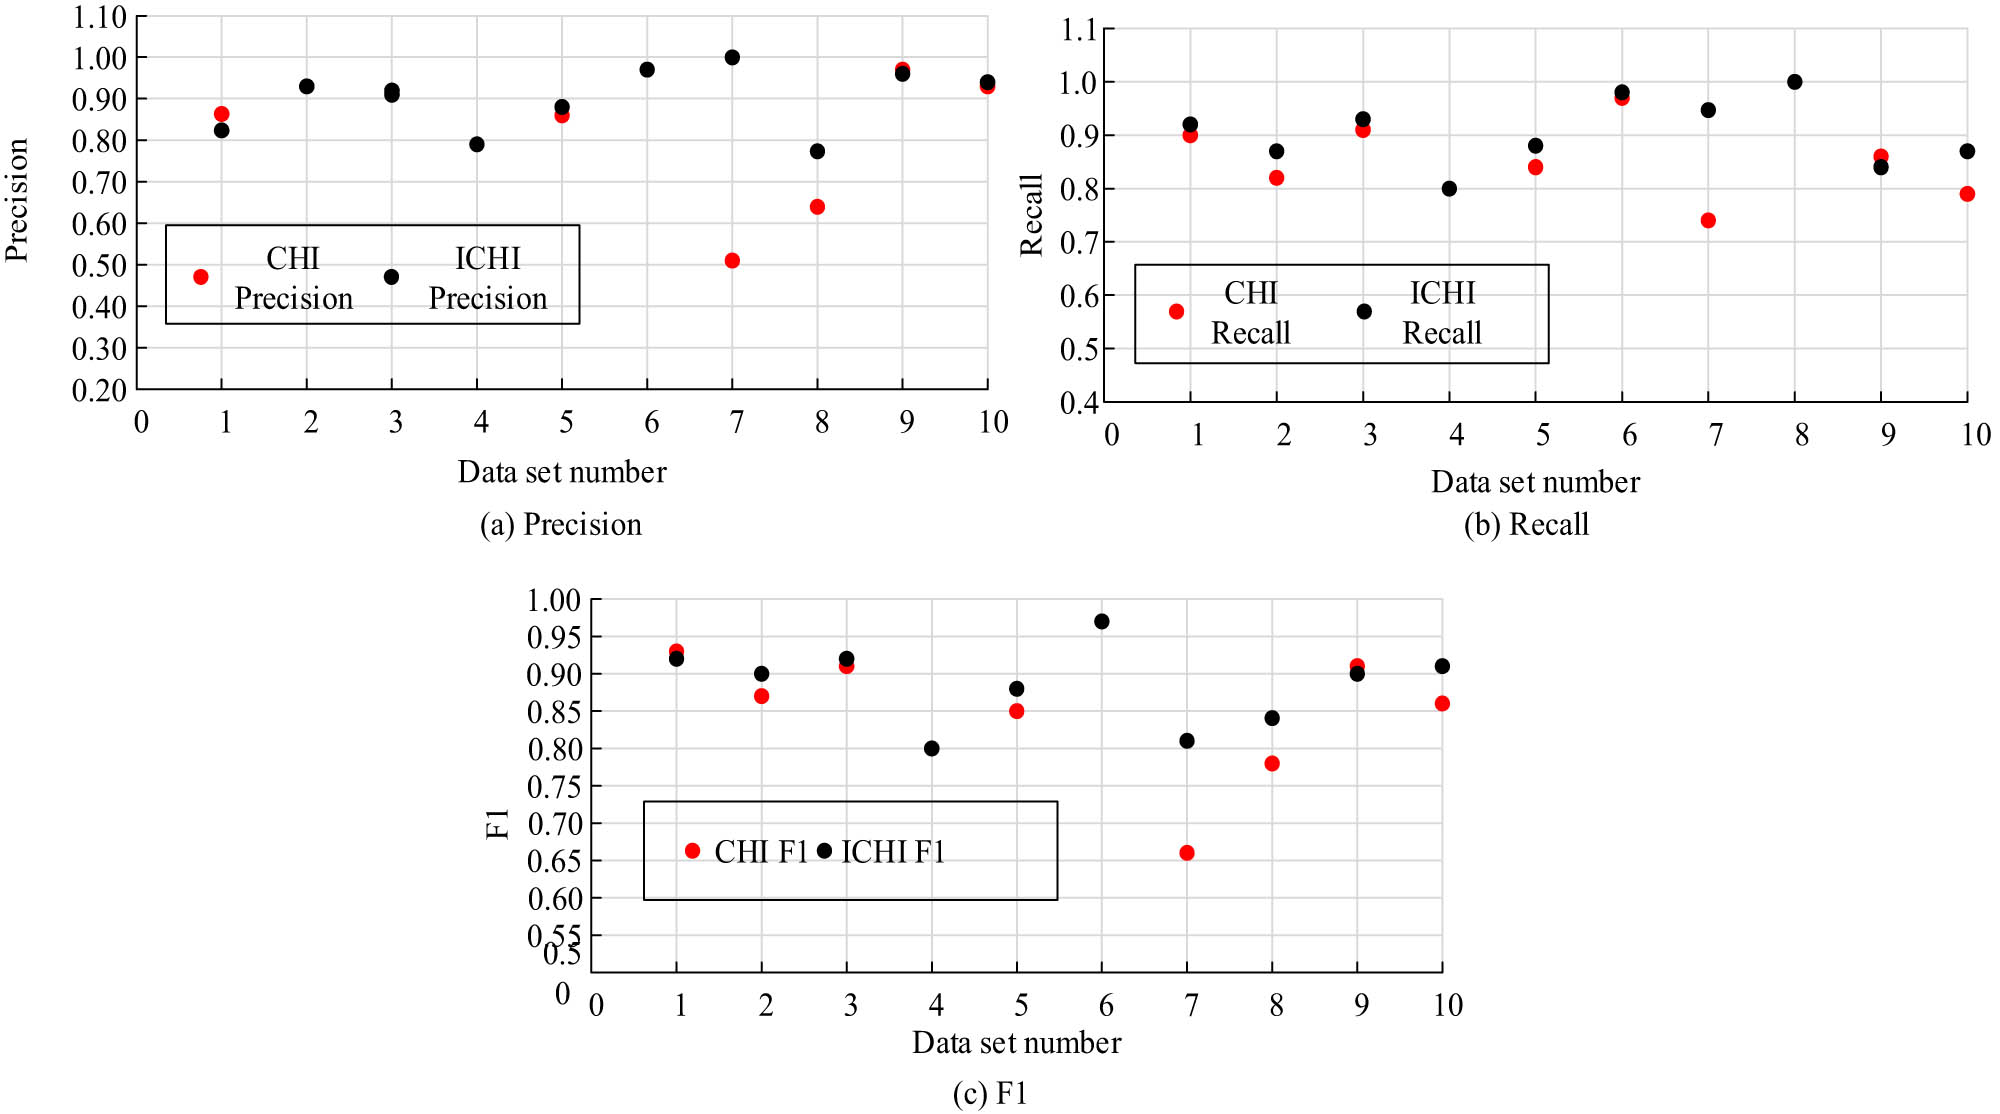
Performance under Chinese. (a) Precision, (b) recall, (c) F1.
After conducting experiments on the Chinese corpus, the algorithms are tested for their classification performance in an English environment. The results of the tests are presented in Figure 8, which shows the precision rate, recall rate, and F1 value of both the ICHI and traditional CHI algorithms on seven different English corpora with varying topics. The precision rate of the ICHI algorithm is consistently higher than that of the CHI algorithm for all English corpora. The difference between CHI and ICHI in terms of accuracy is small, with a minimum difference of 0.01 and a maximum difference of 0.05. In terms of recall, ICHI outperforms CHI for five corpora, with a maximum difference of 0.33. In terms of the F1 value, CHI outperforms ICHI only for the student topic, with a maximum difference of 0.33. The difference between the two is up to 0.33.

Performance under English. (a) Precision, (b) recall, (c) F1.
The trials and evaluations about the proposed algorithm so far have been based on case-by-case evaluations of a specific corpus. To further judge the overall capability of the algorithm, the macro-evaluation index cases of CHI and ICHI are calculated based on the experimental results, and their comparison results are shown in Figure 9. The algorithm’s macro evaluation results are presented in Figure 9(a) for the English environment and in Figure 9(b) for the Chinese environment. Macro evaluation metrics include macro average precision (MP), macro average recall (MR), and macro average F1 (MF). The images show that the triangle area of ICHI’s macro metrics is larger than that of CHI in both language environments. This suggests that ICHI’s overall performance in the three macro metrics is superior to that of CHI. In the English environment, the MO of ICHI reaches 0.9, while the value of CHI is only 0.88. Meanwhile, the MR of ICHI reaches 0.87, while the MR of CHI is lower than that by 0.07.

Macro indicators. (a) English data, (b) Chinese data.
Finally, the choice of classifier is a significant factor that affects the results of text classification. The main classifiers in text classification models are the KNN algorithm, Bayesian algorithm, and SVM. Thus, the three algorithms are compared to the method proposed in this experiment. Table 3 shows the comparison results. The KNN classifier produced an average accuracy, recall, and F1 of 0.88, 0.88, and 0.92, respectively. The Bayesian algorithm resulted in an average accuracy, recall, and F1 of 0.91. The SVM algorithm produced an average accuracy, recall, and F1 of 0.84, 0.87, and 0.84, respectively. The proposed model achieved an average accuracy, recall, and F1 score of 0.90, 0.91, and 0.93, respectively. These results demonstrate that the proposed method outperforms KNN, Bayesian, and SVM algorithms in terms of average accuracy, recall, and F1 score. The experiment calculated the time it took to classify these four methods. The results show that the algorithm proposed in this study achieves text classification in 1.83 ms, which is faster than KNN’s 2.05 ms, Bayes’ 2.36 ms, and SVM’s 3.57 ms. This suggests that the experimental method is more efficient and has better real-time performance than the other methods.
Contrast the results between the different algorithms
| Item | This paper | KNN | Bayes | SVM | ||||||||
|---|---|---|---|---|---|---|---|---|---|---|---|---|
| Precision | Recall | F1 | Precision | Recall | F1 | Precision | Recall | F1 | Precision | Recall | F1 | |
| Culture | 0.91 | 0.94 | 0.95 | 0.93 | 0.92 | 0.90 | 0.96 | 0.84 | 0.92 | 0.94 | 0.90 | 0.91 |
| Education | 0.92 | 0.85 | 0.91 | 0.93 | 0.87 | 0.95 | 0.92 | 0.98 | 0.90 | 0.90 | 0.82 | 0.85 |
| Entertainment | 0.93 | 0.94 | 0.96 | 0.91 | 0.93 | 0.94 | 0.93 | 0.94 | 0.92 | 0.91 | 0.90 | 0.90 |
| News | 0.86 | 0.89 | 0.91 | 0.79 | 0.80 | 0.77 | 0.73 | 0.80 | 0.80 | 0.78 | 0.79 | 0.79 |
| Finance | 0.87 | 0.83 | 0.85 | 0.88 | 0.88 | 0.85 | 0.86 | 0.83 | 0.88 | 0.85 | 0.83 | 0.84 |
| Race | 0.97 | 1.00 | 0.99 | 0.97 | 0.98 | 0.96 | 0.98 | 0.95 | 0.97 | 0.96 | 0.96 | 0.96 |
| Health | 0.87 | 0.88 | 0.90 | 1.00 | 0.68 | 0.93 | 0.87 | 1.00 | 0.81 | 0.50 | 0.91 | 0.65 |
| Belief | 0.89 | 0.92 | 0.95 | 0.47 | 1.00 | 0.98 | 0.95 | 1.00 | 0.64 | 0.63 | 0.99 | 0.77 |
| Sports | 0.85 | 0.93 | 0.95 | 0.96 | 0.84 | 0.95 | 0.96 | 0.94 | 0.90 | 0.96 | 0.85 | 0.90 |
| Technology | 0.95 | 0.88 | 0.92 | 0.94 | 0.87 | 0.92 | 0.94 | 0.90 | 0.91 | 0.92 | 0.78 | 0.85 |
| Average | 0.90 | 0.91 | 0.93 | 0.88 | 0.88 | 0.92 | 0.91 | 0.91 | 0.91 | 0.84 | 0.87 | 0.84 |
5 Conclusion
The current cloud-based English teaching platform suffers from low efficiency in utilizing textual data and low accuracy in obtaining information. To address these issues, this study proposes an algorithm for Chinese–English text classification using an improved ICHI model that leverages the bilingual features of current English teaching. Test results demonstrated that in a Chinese environment, ICHI outperforms CHI on seven datasets, with the highest difference between the two being 0.49. The ICHI algorithm achieved a maximum recall rate of 1.0. In English environments, its accuracy consistently surpassed that of the CHI algorithm, with the highest accuracy reaching 1. In an English-speaking environment, the ICHI achieved an MO of 0.9, while CHI only reached 0.88. Additionally, the ICHI’s MR was 0.87, which was 0.07 higher than CHI’s MR. The KNN classifier yielded an average accuracy, recall, and F1 of 0.88, 0.88, and 0.92, respectively. The Bayesian algorithm produced an average accuracy, recall, and F1 of 0.91. Finally, the SVM algorithm resulted in an average accuracy, recall, and F1 of 0.84, 0.87, and 0.84, respectively. The proposed model achieved an average accuracy, recall, and F1 score of 0.90, 0.91, and 0.93, respectively, outperforming KNN, Bayesian, and SVM algorithms. In summary, the ICHI algorithm proposed in this experiment demonstrates superior classification ability in multiple aspects. However, the algorithm still has some shortcomings that require further improvement. The Chinese and English text classification systems implemented in this article are mainly based on previous experiences, and the entire framework is built on this foundation. However, a new classification system has not been developed yet. The next step is to explore the construction of a new text classification system. Additionally, the dimension of feature words in this experiment lacks a control group. The next step is to select multiple dimensions for the experiment and determine the final dimension based on the experimental results. As the number of documents in the Chinese corpus used in this experiment is limited, the experimental results may have certain limitations. To ensure the effectiveness of the algorithm, it should be considered to use a larger scale Chinese corpus for future experiments.
The experimental method’s superiority has been validated through comparison with relevant text classification methods. However, it has not yet been experimentally validated in other fields. Future research could expand the method’s application scope beyond its current specificity. This study focuses on classifying Chinese and English texts in English teaching classrooms. This study has not been applied in other fields, and expanding its scope could be a valuable avenue for future research.
Acknowledgements
None.
-
Funding information: The research is supported by Research on Digital Protection and Innovative Dissemination Mechanism of Weinan Intangible Cultural Heritage Under Network Media (ZDYFJH-35); Research on the Construction of Intelligent Teaching Environment and Innovation of Talent Cultivation Model in Foreign Language Majors (2024HZ0849).
-
Author contributions: Yufen Wei wrote the manuscript.
-
Conflict of interest: The author declares that there is no conflict of interest.
-
Data availability statement: The datasets generated during and analyzed during the current study are available from the corresponding author on reasonable request.
References
[1] P. Bhuvaneshwari and A. N. Rao, “A comparative study on various pre-processing techniques and deep learning algorithms for text classification,” Int. J. Cloud Comput., vol. 11, no. 1, pp. 61–78, 2022.10.1504/IJCC.2022.121076Search in Google Scholar
[2] B. Parlak and A. K. Uysal, “A novel filter feature selection method for text classification: Extensive feature selector,” J. Inf. Sci., vol. 49, no. 1, pp. 59–78, 2023.10.1177/0165551521991037Search in Google Scholar
[3] V. Arya and R. Agrawal, “Sentiment classification using feature selection techniques for text data composed of heterogeneous sources,” Recent. Adv. Comput. Sci. Commun., vol. 15, no. 2, pp. 207–214, 2022.10.2174/2666255813999200818133555Search in Google Scholar
[4] A. Alzamil, “L2 learning of English conditionals: Online versus traditional classroom teaching,” Sino-US Engl. Teach., vol. 19, no. 3, pp. 79–87, 2022.10.17265/1539-8072/2022.03.001Search in Google Scholar
[5] Y. Chen, “Most common types of online English teaching during covid-19 pandemic in China -An introduction to Fanya and Chaoxiang platform,” Engl. Teach., vol. 18, no. 4, pp. 79–85, 2021.10.17265/1539-8072/2021.04.001Search in Google Scholar
[6] H. Xie and Q. Mai, “College English cross-cultural teaching based on cloud computing MOOC platform and artificial intelligence,” J. Intell. Fuzzy Syst. Appl. Eng. Technol., vol. 40, no. 4, pp. 7335–7345, 2021.10.3233/JIFS-189558Search in Google Scholar
[7] M. Sarac, S. Adamovic, and M. Saracevic, “Interactive and collaborative experimental platforms for teaching introductory internet of things concepts,” Int. J. Eng. Educ., vol. 37, no. 4, pp. 1071–1079, 2021.Search in Google Scholar
[8] J. Gao, X. G. Yue, L. Hao, M. J. C. Crabbe, O. Manta, and N. Duarte, “Optimization analysis and implementation of online wisdom teaching mode in cloud classroom based on data mining and processing,” Int. J. Emerg. Technol. Learn. (IJET), vol. 16, no. 1, pp. 205–218, 2021.10.3991/ijet.v16i01.18233Search in Google Scholar
[9] Z. Wang, B. A. Muthu, and S. N. Kadry, “Research on the design of analytical communication and information model for teaching resources with cloud-haring,” Comput. Appl. Eng. Educ., vol. 29, no. 2, pp. 359–369, 2021.10.1002/cae.22375Search in Google Scholar
[10] S. A. Raza and K. A. Khan, “Knowledge and innovative factors: how cloud computing improves students’ academic performance,” Interact. Technol. Smart Educ., vol. 19, no. 2, pp. 161–183, 2022.10.1108/ITSE-04-2020-0047Search in Google Scholar
[11] M. Negus and D. Doraiswamy, “Feature selection for household insecurity classification: Wrapper approach,” Asian J. Inf. Technol., vol. 20, no. 5, pp. 146–151, 2021.Search in Google Scholar
[12] R. B. Pereira, A. Plastino, B. Zadrozny, and L. H. Merschmann, “A lazy feature selection method for multi-label classification,” Intell. Data Anal., vol. 25, no. 1, pp. 21–34, 2021.10.3233/IDA-194878Search in Google Scholar
[13] B. Parlak and A. K. Uysal, “The effects of globalization techniques on feature selection for text classification,” J. Inf. Sci., vol. 47, no. 6, pp. 727–739, 2021.10.1177/0165551520930897Search in Google Scholar
[14] S. E. Presto, H. Presto, and S. Arti, “Cardiotocographic classification using feature selection: a comparative study,” JITCE J. Inf. Technol. Comput. Eng., vol. 5, no. 1, pp. 25–32, 2021.10.25077/jitce.5.01.25-32.2021Search in Google Scholar
[15] Å. Haukås, S. Mercer, and A. M. Svalberg, “School teachers’ perceptions of similarities and differences between teaching English and a non-language subject,” TESOL Q., vol. 56, no. 2, pp. 474–498, 2022.10.1002/tesq.3062Search in Google Scholar
[16] A. Gibran, Y. Junita, and D. Rodahl, “Urea fertilizer quality testing with chi-squared automatic interaction detection (CHAID) algorithm,” Sriwij. J. Inform. Appl., vol. 1, no. 1, pp. 14–21, 2020.10.36706/sjia.v1i1.10Search in Google Scholar
[17] Q. Li, H. Peng, J. Li, C. Xia, R. Yang, L. Sun, et al., “A survey on text classification: from traditional to deep learning,” ACM Trans. Intell. Syst. Technol., vol. 13, no. 2, pp. 311–351, 2022.10.1145/3495162Search in Google Scholar
[18] A. Nath, D. Kandra, and R. Gupta, “An efficient cross-lingual BERT model for text classification and named entity extraction in multilingual dataset,” Int. J. Sci. Res. Comput. Sci. Eng. Inf. Technol., vol. 1, pp. 280–286, 2021.10.32628/CSEIT217353Search in Google Scholar
[19] M. Jaiswal, S. Das, and K. Khushboo, “Detecting spam e-mails using stop word TF-IDF and stemming algorithm with Nave Bayes classifier on the multicore GPU,” Int. J. Electr. Comput. Eng., vol. 11, no. 4, pp. 3168–3175, 2021.10.11591/ijece.v11i4.pp3168-3175Search in Google Scholar
[20] M. Bou Nabi, K. Elmoutaouakil, and K. Satori, “A new neuromorphic TF-IDF term weighting for text mining tasks: text classification use case,” Int. J. Web Inf. Syst., vol. 17, no. 3, pp. 229–249, 2021.10.1108/IJWIS-11-2020-0067Search in Google Scholar
[21] N. Veer Anjaneyulu, J. D. Bodapati, S. S. Kurra, and G. Ketepalli, “Text document classification using user defined string kernels,” J. Optoelectron. Laser, vol. 41, no. 5, pp. 230–238, 2022.Search in Google Scholar
© 2024 the author(s), published by De Gruyter
This work is licensed under the Creative Commons Attribution 4.0 International License.
Articles in the same Issue
- Regular Articles
- AFOD: Two-stage object detection based on anchor-free remote sensing photos
- A Bi-GRU-DSA-based social network rumor detection approach
- Task offloading in mobile edge computing using cost-based discounted optimal stopping
- Communication network security situation analysis based on time series data mining technology
- The establishment of a performance evaluation model using education informatization to evaluate teacher morality construction in colleges and universities
- The construction of sports tourism projects under the strategy of national fitness by wireless sensor network
- Resilient edge predictive analytics by enhancing local models
- The implementation of a proposed deep-learning algorithm to classify music genres
- Moving object detection via feature extraction and classification
- Listing all delta partitions of a given set: Algorithm design and results
- Application of big data technology in emergency management platform informatization construction
- Evaluation of Internet of Things computer network security and remote control technology
- Solving linear and nonlinear problems using Taylor series method
- Chinese and English text classification techniques incorporating CHI feature selection for ELT cloud classroom
- Software compliance in various industries using CI/CD, dynamic microservices, and containers
- The extraction method used for English–Chinese machine translation corpus based on bilingual sentence pair coverage
- Material selection system of literature and art multimedia courseware based on data analysis algorithm
- Spatial relationship description model and algorithm of urban and rural planning in the smart city
- Hardware automatic test scheme and intelligent analyze application based on machine learning model
- Integration path of digital media art and environmental design based on virtual reality technology
- Comparing the influence of cybersecurity knowledge on attack detection: insights from experts and novice cybersecurity professionals
- Simulation-based optimization of decision-making process in railway nodes
- Mine underground object detection algorithm based on TTFNet and anchor-free
- Detection and tracking of safety helmet wearing based on deep learning
- WSN intrusion detection method using improved spatiotemporal ResNet and GAN
- Review Article
- The use of artificial neural networks and decision trees: Implications for health-care research