The construction of sports tourism projects under the strategy of national fitness by wireless sensor network
-
Zhen Yuan


Abstract
In recent years, sports events have continuously attracted people’s attention, and people’s enthusiasm and participation in sports have been rising. The sports + tourism model can meet people’s travel needs and enjoy sports-related entertainment and experiences. With the expansion of sports tourism, people have a new understanding of sports + tourism. Sports tourism based on the current strategic background of national fitness is an emerging industry, and it has had a certain degree of development prospects before this. This article explores traditional sports tourism with national characteristics under the blessing of the wireless sensor network. This exploration discusses and explores the development and construction of local sports + tourism in terms of literature and logical analysis. The experimental results of this article show that most consumers are not satisfied with the construction of sports tourism network information, and they are the least satisfied with key information coverage, e-commerce, and security systems. It shows that in these aspects, the construction of sports tourism informatization is relatively lagging, and it is in urgent need of improvement and improvement.
1 Introduction
With the relevant support of the state, the construction of sports and fitness has been developed rapidly and has received attention. Especially as the current national conditions have been affected by the epidemic, people have paid more attention to the importance of health. Many people have spontaneously increased sports-related travel activities, and diversified entertainment needs have gradually shown a trend of industrial integration. At present, wireless networks + sports, wireless networks + tourism, and tourism + sports are slowly integrating. Sports tourism integrates fitness and tourism and can meet people’s various needs for entertainment and sports at the same time. In the relevant guidance issued by the state, it is also clearly stated that it is necessary to promote industrial interaction and integration, especially integration with sports-related industries. Among them, sports + tourism is the most favored one. With the full application of network technology, more and more people have participated in the sports + tourism approach. Based on the perspective of the Internet platform built in the upsurge of national fitness, the article analyzes the development model of the target location and its countermeasures and proposes the improvement points for integrated development.
The domestic tourism industry has always been on an upward trend of rapid development. Now, based on the country’s development and promotion of sports, relevant support measures have been introduced, to promote reform and improve the development capacity of the sports industry as the main points, strengthen the alliance with other industries, find a new development route, and achieve common joint development. Under the strategic conditions of national fitness, China’s sports industry will construct a reasonable and standardized “sports + tourism” sports entertainment development system in line with its development philosophy [1,2]. This article integrates the wireless network and sports tourism that are indispensable in today’s life, so that it can occupy a place in the refined tourism market. Of course, domestic sports tourism and national fitness are still under development, and the combination of sports tourism and national fitness needs to be further strengthened in practice. Therefore, this article focuses on exploring the development of sports tourism resources, promoting the development of national fitness, and providing some scientific basis for the future development of sports tourism.
Traditional national sports fitness can no longer fully adapt to the development of the times. Dongmei W introduced the characteristics of population aging and the deployment and promotion of national and international sports and fitness development strategies. In response to the problem of population aging, he analyzed the development of national sports and fitness issues. Through the questionnaire survey, four main factors affecting health are found. Before the comprehensive investigation, he studied the economic development of elderly fitness in different regions through visits and surveys. As a result, from the perspective of population aging, he proposed a new direction for the development of national sports and fitness, proposed to open indoor gymnasiums to the public, organize a number of sports and fitness activities, and let the elderly engage in sports, so that the physical fitness of the whole people and social stability and harmony have improved [3]. The dynamic development of the fitness field is one of the most profitable fields in the world, so it is attractive for investment. Vorobiova performed research based on the analysis of literature sources and experts’ opinions on the prospects of fitness development in Ukraine and compared the development trends of the world and European and American countries (such as the United States and Spain) in 2018; it can be found that the development trend of the world reflects 95% of the development trend of the United States, while the development trend of other representative countries is only general. The current facts prove that it is necessary to study national trends instead of focusing on “world” trends, because they mainly reflect the development prospects of a country (the United States) [4]. Due to the limited energy supply of sensor nodes, energy efficiency has become a key issue in designing broadcast protocols. Hong and Scaglione analyzed the energy savings provided by a form of cooperative broadcasting called the Large Array of Opportunities (OLA) and compared it with the performance of traditional multi-hop networks that do not use cooperation for transmission. Cooperation in OLA allows receivers to use the accumulation of signal energy provided by transmitters that relay the same symbol to detect. In this work, they derived the optimal energy allocation strategy, which can minimize the total energy cost of the OLA network based on the SNR (or BER) requirements of all receivers. Although the cooperative broadcast protocol provides significant energy saving, it proves that the optimal energy distribution of the cooperative network is an NP-complete problem and therefore usually requires high computational complexity [5]. These research results show that physical education has an important impact on human health and can effectively improve people’s physique.
Most of the ebb and flow of research work only considers the communication behavior to calculate the trust of the sensor hub. Due to the far-reaching vicious attack, it is not enough for trust evaluation. Jiang et al. proposed an efficient distributed trust model (EDTM) for WSN. First, as shown by the number of packets obtained by the sensor hub, direct trust and recommended trust are specifically calculated. At this time, communication trust, vitality trust, and information trust are considered in the estimation of direct trust. In addition, the trustworthiness and nature of the trust are used to improve the accuracy of the recommendation trust. His proposed EDTM can more accurately assess the reliability of sensor hubs and more successfully maintain security vulnerabilities [6]. How to perceive and monitor the environment with high quality is an important research topic in the Internet of Things. Hu et al. discussed the important issue of the balance between target detection quality and lifetime in wireless sensor networks. They proposed two target monitoring schemes: One scheme uses sensing frequency K (TDSFK) for target detection, which allocates the current sensing time that is only part of the sensing period to the entire sensing period. In other words, the sensing frequency is increased from 1 to k. Another solution is Target Detection with Adjustable Sensing Frequency, which adjusts the sensing frequency on those nodes with residual energy. The simulation results show that the TDSF scheme can increase the network lifetime by more than 17.4%, and the weighted detection delay can be reduced by more than 101.6% [7]. The EST results found four strategic parts (namely vacation, green, action-oriented, and active tourists), traveler-related activities, and the level of demand for ecological certification. In a practical sense, EST activities provide a unique opportunity for tourism managers, which can have a positive impact on communities, protected areas, and sports events and their surroundings [8]. Uvinha et al. conducted a comparative analysis of the incentives for sports tourism in Brazil and Hong Kong. The results of Hong Kong (n = 134) and So Paulo (n = 151) revealed the different travel patterns, skills, and characteristics of sports event supporters, who practice sports events irregularly in frequency. Uvinha et al. also pointed out that in these two countries, interest in sports events is mainly driven by factors such as excitement and safety [9]. The above-mentioned scholars mostly conduct large-base data surveys for a certain large-scale location. It is not a simple matter to collect a wide range of effective data. It requires a wide range of support to succeed, or it requires a special basis for the design of wireless network sensors.
The article discusses and studies the “Sports + tourism” of the comprehensive development model. Through its exploration, it provides a certain path of integration. The article takes Country X as an example and studies the ethnic characteristics and tourism of Country X. Through relevant analysis, it can be concluded that sports tourism is greatly related to supply status and sustainable development. The article provides a certain reference for the sports tourism model and can provide a certain benchmark for sports tourism.
2 Wireless network sensor
2.1 Basic concepts and theory of wireless sensor network positioning algorithm
Wireless sensors are based on self-organizing management of a large number of distribution of sensor nodes, which can easily collect physical information and convert it into digital signals [10,11]. The network architecture of the wireless sensor network is shown in Figure 1:

Wireless sensor network system.
In a typical wireless sensor network, sensor nodes are scattered in an area as shown in Figure 2. Each sensor node has the ability to collect data and can transmit data back to the data aggregation node through multiple routes [12,13], and the aggregation node can transmit the data back to the task management node through wired or wireless Internet for analysis and use [14,15].

Application of wireless sensor network.
Wireless sensors can provide real-time data and interactive experiences in sports tourism, optimize safety management and event experience, and also promote the intelligent management and sustainable development of venues.
2.2 Common distance measurement types and estimation methods for wireless sensor network positioning
In wireless sensor networks, there are many solutions for different positioning system solutions, but the methods that can measure data are indeed relatively rare [16].
2.2.1 Common distance measurement types of wireless sensor networks
Information strength: The distance of wireless signal transmission of the wireless sensor is related to the RSSI value in the node [17], as the parameter measurement terminal RSSI of the signal receiver, as shown in Figure 3: The received signal will change with the time change of space and frequency. Using the attenuation model of signal propagation to convert the propagation loss into distance [18], the equation expression of the attenuation model is:
In equation (1), the signal strengths at nodes a and
The arrival time of the signal: by detecting the propagation time and the propagation speed of the wireless signal between two nodes, the product of these two values is the distance of the signal propagation [19], as shown in Figure 4, and the signal forms a cyclic transmission chain between the sending and receiving nodes. Through the “handshake” connection between the two parties, the distance can be inferred from the periodic delay of the nodes [20]:

Depletion during transmission.
The measurement method in the above equation has a certain error. The main reason is the signal processing time [21], such as the delay of the receiving node, where the signal transmission speed of the wireless sensor is represented by U.
Time difference of signal transmission: The method of measuring distance based on the difference in arrival time is mainly based on the difference of the propagation time of two different propagation signals between nodes to calculate the distance [22], as shown in Figure 5, and the TDOA algorithm for measuring distance has achieved good results in current positioning research. Based on this method, two signals of radio frequency and ultrasound are used [23], namely:

Schematic diagram of the positioning principle of TOA.
For the simultaneous RF signal speed
Signal arrival angle: This method mainly uses the device to sense the direction angle of the reference node and then uses the triangulation method to calculate the coordinates of the location node [24].

Schematic diagram of TDOA’s positioning principle.
2.2.2 Common geometric algorithms for wireless positioning based on measurement distance
Trilateral measurement: This measurement method is the most commonly used basic algorithm for calculating coordinates in wireless sensor networks based on ranging [25].
As shown in Figure 6, the geometric positions of the layout of 1, 2, 3, and 4, the coordinates of the marking reference nodes 1, 2, and 3 are (A 1, B 1), (A 2, B 2), (A 3, B 3), and unknown nodes 4 (A, B) in the three reference node distances Q 1, Q 2, Q 3, expressed as:

Positioning method of trilateral measurement.
Without considering multiple solutions, combined with the position of the node, the coordinates of node 4 are calculated:
This detection method has a certain degree of error, mainly because the three circles may not meet at one point [26].
Triangulation: The principle is shown in Figure 7. Assuming that the coordinates (A, B) of node 4 are at nodes 1 and 3 and angle ∠143, establish a circle with center C1 and radius R,

Diagram of the triangulation method of positioning.
Based on the above equation, the coordinates of the center of the circle and its radius can be calculated. Based on the same method, other coordinates and radii of the center of the circle can be obtained. Similarly, the coordinates of the unknown node (A, B) can be calculated.
Maximum likelihood estimation: the specific method is shown in Figure 8, the coordinates of known signal marking points A, B, C,…, n are (Ax, Ay), (Bx, By),…, (nx, xy), the distances when they reach the pending node 4 are, respectively, denoted as Q 1, Q 2, Q 3,…, Q n , assuming that the coordinates of node 4 are (AX, BX).

Schematic diagram of the localization of the maximum likelihood estimator.
Then, the existing equation is:
To solve equation (11), only the difference between the first n − 1 term and the n term is considered as a linear equation:
Among them,
Using the smallest mean square error to estimate the coordinates of node 4:
2.3 Evaluation of the positioning accuracy of the Cramer-Rao lower bound of the wireless sensor
When the limited data length in the sense of the probability of Cramer-Rao lower bound (CRLB) is given, the lower bound equation of the parameter estimation covariance [27]. The lower bound of unbiased estimation can be obtained, and the problems of signal processing and parameter estimation are included. Therefore, this method is a key measurement algorithm for positioning accuracy [28]:
Under this theorem, the probability density of the random quantity x under the condition of parameter
The proof of the theorem refers to the well-known CRLB inequality [29], which can show that the variance of the estimated value deviation cannot be less than the diagonal element of the Fisher information matrix [30].
The CRLB is derived under line-of-sight conditions, as shown in Figure 9:

Schematic representation of distance and angle under line-of-sight conditions.
As shown in Figure 9, (A, B, C) are ordinary unknown node coordinates, and the known coordinates of the nth anchor point are (A n , B n , C n ). Here, 1 and 2 represent the azimuth and tilt angle of the received signal at the nth anchor point, and the distance table b from the ordinary node to the nth anchor point. Therefore:
In the case of measurement errors, the measurement equation is:
Among them,
2.4 Sports tourism based on the national fitness strategy
2.4.1 Relevant conceptual significance of sports tourism
For the definition of sports tourism, we refer to the literature research of many scholars, and we can start from different angles, and the definition of it is also slightly different. But on the whole, it is an entertainment activity developed based on people’s needs and interests in sports and a product form with tourism as the carrier [32].
2.4.2 Development of sports tourism resources
Sports tourism, which has evolved with the development of the tourism industry, belongs to tourism resources in terms of resources and tourism. It is a basis of tourism activities and may be part of the development of tourism. Domestic scholars believe that sports tourism is a sports tourism resource that can produce unique attractions for sports travelers [33].
2.4.3 Development of sports tourism
Tourism resources, as one of the commodities, have developed steadily in society and the economic form has changed. It appears based on the supply and demand relationship of the masses for sports tourism and is closely related to the country’s economy. The development of tourism will affect the social economy, and the prosperity of the national economy will also promote the development of tourism, as shown in Figure 10. With the success of the Olympic Games, China’s sports tourism has also made breakthroughs, and sports tourism has gradually become the primary choice for travel.

Growth rate of urban tourism in relation to income and consumption.
3 The status quo of sports tourism information construction under wireless network sensors
The empirical research in this article is based on China’s multi-ethnic customs and selected X states full of ethnic minority characteristics as the reference place. Through the analysis of the status quo of sports tourism under the background of the current wireless network, the appropriate development model is discussed.
3.1 The establishment of an information-based tourism network platform
3.1.1 Status of information-based tourism websites in X state
Based on today’s masses mostly search through network software. In recent years, Country X has actively promoted the establishment of a network platform and a system connected to the main popular application software platform. This system is specially set up for the tourism industry and provides information on related resources. However, at present, the websites and information that provide travel services on the Internet are still relatively insufficient to meet the needs of individual consumers. The specific situation is shown in Table 1.
Some informational tourism websites in X state
| Website | Services | Disadvantages | |
|---|---|---|---|
| Official website | www.xxz.gov.cn | Post travel, policy, and weather information | Lack of communication, and online processing capabilities |
| www.xxzl.com | Publish hotel information, provide communication and trading platform | Slow information update, single way, no characteristics | |
| Business | www.0743.net | Search and reservation of attractions, routes, and accommodation information | Slow information update |
| www.xxgdly.com | 24-h online consultation | Single service content |
From the above situation, we can see that the deepening reform of the sports tourism industry informatization is imperative. This article takes the natural villages of ethnic minorities in Country X as the research object. Sports tourism can allow tourists to experience national culture, natural environment, and characteristic activities in depth, promote the inheritance and protection of national culture, promote community interaction and development, and also promote the sustainable development of the local economy.
3.1.2 Current status of tourism app software in State X
The ethnic minority natural villages in this area are tourist destinations for sports tourists. Whether it is a noisy festival ethnic sports performance, or various sports activities such as fishing along the stream, mountain climbing, karst cave exploration, etc., visitors can experience a new feeling. The way to combine the three to achieve the greatest effect is the use of informatization. The development of national sports tourism in X state is inseparable from the promotion, organization, and reception of tourism enterprises and travel agencies, as well as the development and profitability of the tourism industry itself. Sports tourism in X state has increased the promotion of network informatization in recent years, and specific sports tourism information can be obtained through related websites, and can also subscribe to sports tourism resources and purchase participation tickets through websites and major mobile phone app software.
3.1.3 Status of tourism resource platform in X state
X State has its own unique cultural characteristics of ethnic minorities, which makes the entire region full of weird and magnificent colors, rich in natural landscapes and cultural heritage. And these special natural scenery and cultural characteristics are tourism brands that cannot be copied by the outside world. X state is extremely rich in tourism resources, especially the site of the ancient city of Warring States, which fully demonstrates the local charm. The continuous development of these resources has formed a unique tourism resource brand, laying the foundation for the specialization of sports resources. However, according to the survey, only 40% of the scenic spots in X state conduct online publicity, 68% of manual ticket sales, and 78% of manual ticket inspections. The network informatization of the scenic spot channel is obviously insufficient, and the scenic spot service information is not perfect.
3.2 The impact of wireless sensor network informatization construction on sports tourism
Network information is a key factor for the success or failure of sports tourism information construction. In order to gain a competitive advantage in tourism destinations, it is necessary to improve the ability to respond to sports tourism information. Because when tourists decide to travel before traveling, they always try to obtain various sports tourism information through various methods. The popularity of the Internet now allows people to obtain a variety of information from it, and it also makes people dependent on the channels for obtaining information, forming a network-based query method. It includes an understanding of the natural and cultural environment, tourism resources, tourism facilities, and services of tourist destinations, so as to improve the quality of tourism (Figure 11).

Relevant functional requirements of the tourism system.
Information guidance is actually crucial to the development of the tourism market in the tourism function, so the collection, processing, transmission, and utilization of information occupies an important position in tourism. The impact of informatization construction on the sports tourism industry in X state is as follows:
3.2.1 Informatization enhances the competitiveness of the sports tourism industry
Information technology itself, as a productivity factor, has a wide range of penetration and appreciation. At the same time, network information technology has played a catalytic and boosting role in the productivity of other factors. The tourism industry is a kind of industry with strong comprehensiveness, great relevance, and wide coverage. Therefore, the factor of information technology entering the tourism industry will greatly improve the efficiency of the tourism industry in X state and promote the optimization of the tourism industry structure.
The sports tourism industry is a consumer-oriented industry. It is a combination of multiple industries. It is e-commerce that promotes product consumption changes through information and network technology, which can improve work efficiency and strengthen the interconnection of various industries. E-Commerce has a booster effect on the competitive and orderly sports tourism market.
E-Commerce is based on the flow of network information to guide the flow of business, capital, and personnel. Taking e-commerce as the driving force can promote the deepening reform of local economic development.
3.2.2 Informatization has increased the industrialization of sports tourism
In the past 5 years, the average annual growth rate of tourist arrivals and tourism (including sports) in the X state area has been about 20%. The total number of tourists was approximately 33.62 million, and tourism revenue was 216.9 billion yuan, an increase of 19.6 and 24.3%. The total tourism revenue is equivalent to 42.3% of the region’s GDP. The sports tourism industry has promoted the rapid development of industry, agriculture, transportation, commerce, and other industries. There are 250,000 people engaged in tourism directly and indirectly (Figure 12):
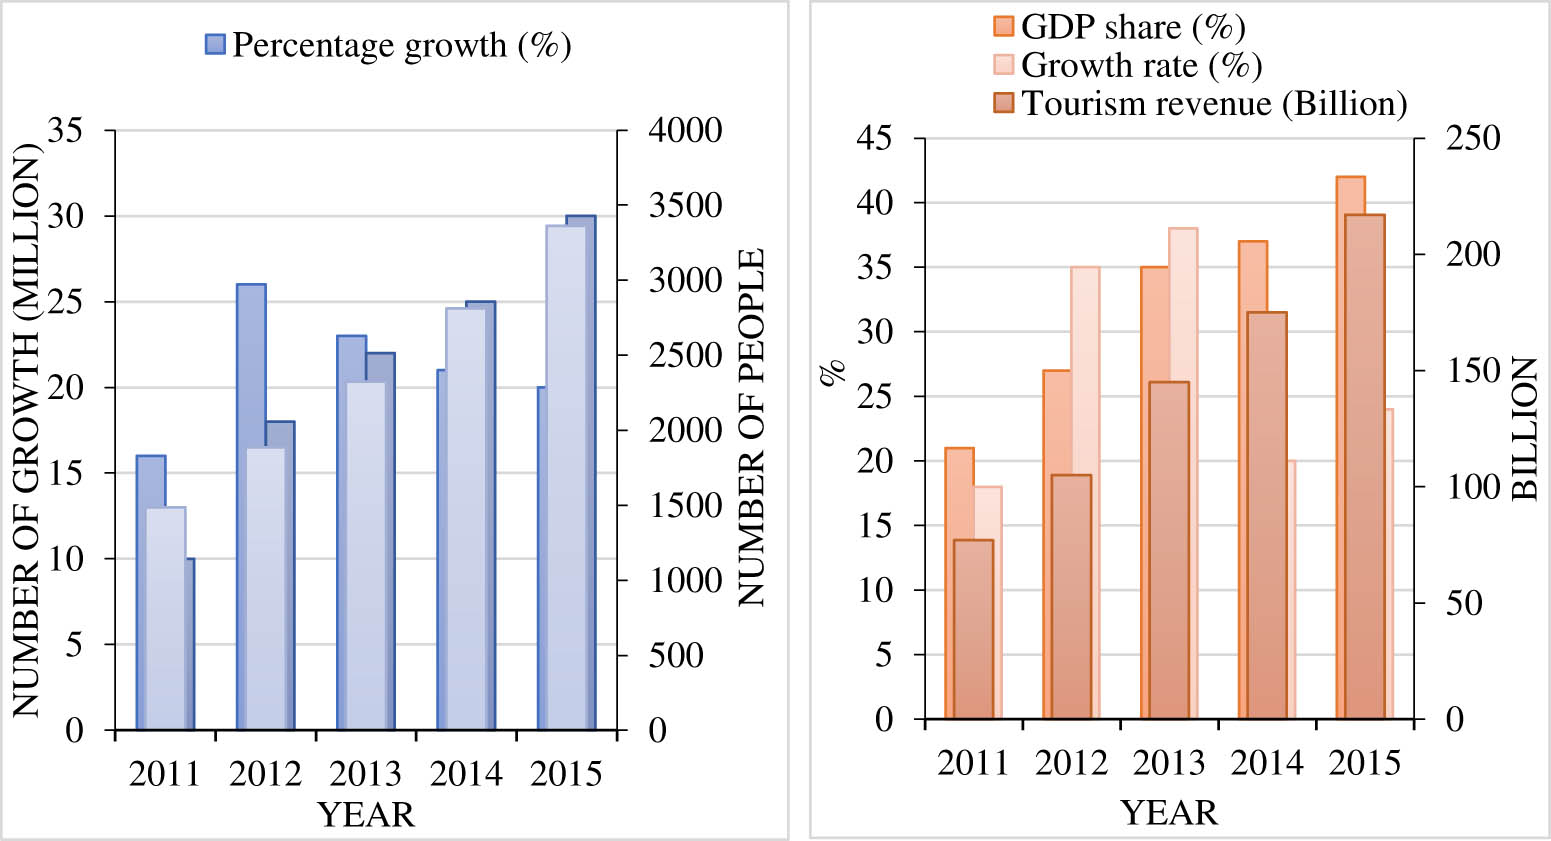
Statistical chart related to the sports tourism industry.
3.2.3 Informatization has added tourist service facilities and personnel
In terms of information investment, investment in infrastructure construction such as power and communications was completed in 2015 with a cumulative increase of 22%. As shown in Table 2. There were 136,600 fixed-line telephone users, and the penetration rate dropped by 22.2%; mobile phone users were 1.806 million, and the penetration rate increased by 37% from the previous year. At the end of the year, Internet broadband users reached 358,000, an increase of 30.7%. The number of people surfing the Internet was 1.767 million.
Statistics of tourism service facilities in X state
| 2011 | 2015 | Growth (%) | |
|---|---|---|---|
| Number of receptions (million) | 1,486 | 3,362 | 55.8 |
| Tour operators | 25 | 31 | 19.3 |
| Star hotels | 60 | 131 | 54 |
| Total number of beds | 45,268 | 99,141 | 54.3 |
| Tour bus | 385 | 462 | 17.2 |
| Number of guided tours | 600 | 800 | 25 |
| Number of employees (million) | 10 | 30 | 66.7 |
| Tourism revenue (billion) | 77 | 217 | 64.5 |
| Share of GDP (%) | 21 | 42.3 | 49.6 |
Folk sports tourism is inseparable from the six elements of tourism, tourism, accommodation, catering, shopping, and entertainment. The development and prosperity of folk sports tourism can not only stimulate travel agencies that directly serve folk sports tourism, transportation, communications, etc. but also stimulate the indirect economic development of hotel and catering companies.
Although the sports tourism industry in State X has developed rapidly, it is mostly in an extensive form. The lagging development of informatization has led to insufficient resource utilization, and the added value of sports tourism products is not high, and it is difficult to promote the improvement of the effect, which affects the sustainable development of the sports tourism industry and the market competitiveness of the sports tourism industry.
3.3 The influence of network informatization on the dissemination of sports tourism
The influx of competitors: With the development of sports tourism, tourism companies in State X will be threatened from all aspects of the domestic and international markets. Most tourism companies in X state have not fully realized the extreme importance and necessity of sports and tourism to develop and occupy the market by relying on high-tech means. It seems that network operation and management are still far away. This will make it difficult for X state tourism companies to adapt to the rules of the international market and weaken their international competitiveness after the opening of the tourism market.
Tourists’ individualization trend: With the development of economy and sports tourism, tourists are increasingly seeking initiative and individualization, and individual tourists have increasingly become the main force of tourism. The emergence of the personal travel wave has brought challenges to travel companies. Due to the increasing ability of tourists to obtain information, many tourists query their own tourism products on the Internet, are interested in information, and design tourism products suitable for them based on their own circumstances. With the increasing proportion of the personal travel market, individuals are more inclined to obtain travel product information through the Internet’s product portfolio, which brings more severe challenges to the production and sales of tourism companies in State X.
Tourism service companies’ reliance on intermediaries is weakened: Tourism service companies are getting rid of the intermediary services of travel intermediaries, and their reliance on travel intermediaries has weakened, because they can directly face tourists from far away tourist sources on the Internet. In the service supply network of tourism companies, the aviation industry and the hotel industry have compared with tourism companies in the application of information technology. In addition to promoting their products on their websites, most of them have established their own reservation systems. As a result, the status and bargaining power of travel intermediaries in the negotiation of travel service companies has been relatively weakened. The revenue of ticket sales and restaurants sold by travel agencies will decline year by year, and new profitable marketization must be sought.
The Internet has increased the threat of substitution to tourism companies: it is easier for tourists to compare and judge tourism products and their substitutes, thereby increasing the possibility of turning to substitutes. Therefore, the Internet provides an invisible means for the competition of alternative industries by tourism companies in State X, increasing the threat of substitution.
The emergence of information technology has intensified the competition of existing tourism companies: From the perspective of the internal management of tourism companies in State X, some tourism companies use information technology to save labor costs, improve work efficiency, and enhance corporate competitiveness. In addition, when some tourism companies have implemented the sports tourism informatization strategy, it will also cause challenges and pressures for the tourism companies that have not implemented informatization.
4 Measures for the construction of sports tourism information under the background of wireless networks
4.1 Develop a strategic plan for the construction of sports tourism informatization in X state
4.1.1 The design of the Internet informationization scheme of the fine sports tourism industry
In view of the high amount of uncertainty and the rapidly changing information market, when the competitive environment changes, tourism companies in State X have to rethink their strategies and make adjustments. At this time, tourism companies can also use this set of corporate network informationization program design frameworks and methods to continuously review and implement informatization strategies, and seek the best solutions for informatization implementation, as shown in Figure 13.

Sports tourism network information program.
4.1.2 Giving full play to the leading functions of the government
The first task is to integrate the existing network resources and the advantages of traditional culture to form a government-led information website platform. Through the improvement of platform functions and the expansion of platform resources, more tourism resources will be integrated to attract tourists with rich content. In turn, the development of related industries such as surrounding hotels and travel agencies will be improved. As an organizer supporting the development of sports tourism, the government should play a leading role in preventing the difficult problems encountered by the tourism industry in State X.
4.1.3 Improving the Internet informatization of sports tourism services
The construction of an information service system for tourism enterprises is a huge system project to build a cross-industry, cross-regional, and sports tourism information service network system that adapts to the development of modern tourism, actively expand the channels of sports tourism information services, continuously improve the quality of sports tourism information services, manage public tourism, commerce, and industry, provide high-quality sports tourism information services, and further enhance the core competitiveness of the tourism industry.
4.1.4 Promoting the standardization of sports tourism information management system
The sports tourism information management system should be built from the following aspects: First, the management of data collection, processing, retrieval, storage, transmission, utilization and maintenance, etc., should be strengthened to achieve advanced processing such as reasonable organization, maintenance, and access to data. Processing the relationship between applications and data can predict the development direction of the tourism industry and the stage of the tourism industry and timely adjust the insufficient development of the tourism industry. Second, using tourist information to understand the needs of tourists for tourism products and timely develop products with distinctive features and distinctive personalities can meet the needs of tourists.
4.1.5 Strengthening industry collaboration and expanding the value circle of tourism products
The construction of sports tourism informatization is a systematic project with wide coverage and multiple industry projects, and it must cooperate with other regions and other industries. The quality of the collaboration will directly affect the normal progress and operation of the information construction of the sports tourism network in State X. Therefore, we must pay attention to studying the basic ideas and methods of internal coordination and public management among various tourist attractions and units under the management of multiple systems.
4.2 Construction of the indicator system
Through the analysis of the status quo of the development of sports tourism informatization in State X, the establishment of an evaluation system for the construction of sports tourism network informatization development can be viewed from the following aspects, as shown in Figure 14:

Sports tourism network information evaluation system.
The importance of the sports tourism evaluation system lies in providing a basis for decision-making, promoting sustainable development, evaluating economic and social benefits, enhancing competitiveness, and protecting consumer rights and interests. Through the use of the evaluation system, the success rate and sustainable development of sports tourism projects can be improved, thereby promoting the development of sports tourism. The development of sports tourism combined with Internet informatization in X state mainly refers to the combination of the sports tourism industry and Internet information:
The construction indicators of Internet informatization organization can be measured by several secondary indicators of sports tourism talents, sports tourism informatization team, development prospects of sports tourism informatization, and planning and construction of sports tourism information departments. The organizational positioning of the information department is to clarify the direction of information development. Only in this way can the limited resources of the department be effectively integrated to provide better support and services for other departments. The construction of informatization team includes the quantity and quality of technical personnel for informatization construction. Human resources in the sports tourism industry, here mainly refers to compound talents, in addition to deep technical skills and an in-depth understanding of the sports tourism industry, they should also understand business. The economics of informatization planning are analyzed through the investment costs and benefits required for informatization construction.
Sports tourism is structured through sports information equipment, sports tourism industry networks, and the level of network construction through website click-through rates and website information disclosure. The level of Internet informatization technology construction is reflected through a comprehensive comparison of the technology development level of the same industry.
Information resource indicators. Factors affecting sports tourism information resources include the scale of database construction and application level, and the secondary index of data mining depth. The construction scale and application level of the database are mainly reflected by the reasonable organization, maintenance, and access of data related to the sports tourism industry, as well as handling the relationship between application programs and data. The depth of data mining is based on whether it can extract useful information from tourism-related data to support management decision-making.
Application information indicators. Combining the characteristics of sports tourism informatization and the conclusions of current research, it can be analyzed from the following aspects: the information service status of the sports tourism industry, the management and mode of the sports tourism industry itself, the use of Internet information technology, and the sports safety system. The sports safety system is mainly reflected through the measurement, analysis, and prediction of hidden dangers of tourism resources.
Through the development of sports tourism resources, improving service quality, innovating products, strengthening marketing and publicity, upgrading infrastructure construction, promoting cooperation and collaborative development, and paying attention to the sports tourism experience, the competitiveness of sports tourism can be effectively improved, more tourists can be attracted, and the healthy development of the industry can be promoted.
4.3 Comprehensive evaluation of sports tourism informatization
Based on the status quo of sports tourism informatization in X state and the status of sports tourism informatization system, the establishment of the sports tourism index system in Xiangxi is analyzed and evaluated, and suggestions are provided for the composition of the sports tourism informatization index system in Xiangxi.
Through the investigation and analysis of consumers, the evaluation of the development level of sports tourism informatization in Xiangxi is summarized as shown in Table 3:
After calculating the collected and summarized consumer information and feedback, the evaluation index ratio table of each item is obtained, as shown in Figure 15.
Using Analytic Hierarchy Process, that is, at each level, all elements of the level in pairs are compared according to a certain standard. Experts are asked to use the 1–9 scale method to compare several indicators in the same layer pair by pair to obtain a judgment matrix. By calculating the largest eigenvalue of the judgment matrix and the corresponding eigenvector, the weight of each element of this layer relative to the criterion of this layer is obtained. After analysis and induction, the comprehensive level of consumer satisfaction with the development of the sports tourism network in State X can be obtained. The evaluation value is shown in Figure 16.

Evaluation of the level of development of information technology of sports tourism network in X state.

Comprehensive evaluation of the level of network information in X state.
Evaluation of sports tourism network information development
| Satisfied | More satisfied | Dissatisfied | No idea | |
|---|---|---|---|---|
| Sports organization positioning (A1) | 2 | 2 | 28 | 6 |
| Networked team building (A2) | 3 | 5 | 27 | 3 |
| Networked human resources (A3) | 0 | 2 | 30 | 5 |
| The economics of sports planning (A4) | 3 | 5 | 20 | 10 |
| Equipment and equipment degree (A5) | 5 | 6 | 20 | 7 |
| Landline ownership rate (A6) | 21 | 15 | 0 | 2 |
| Computer ownership rate (A7) | 21 | 9 | 2 | 6 |
| Network, website construction (A8) | 6 | 19 | 3 | 10 |
| Information technology construction (A9) | 3 | 7 | 20 | 8 |
| Application level (A10) | 0 | 1 | 28 | 9 |
| Data mining depth (A11) | 0 | 0 | 32 | 6 |
| Regulatory reform of the management model(A12) | 4 | 7 | 20 | 6 |
| Service social commoditization (A13) | 12 | 10 | 11 | 5 |
| Office automation (A14) | 21 | 15 | 0 | 2 |
| System coverage (A15) | 8 | 7 | 15 | 8 |
| E-commerce share (A16) | 7 | 6 | 16 | 10 |
| Security systems (A17) | 0 | 0 | 35 | 4 |
Because the dissatisfaction with the comprehensive evaluation value of the development level of sports tourism informatization in X state accounted for 57.01, more than half, it can be summarized as consumers’ lack of understanding of the construction and development of sports tourism informatization. In order to put forward perfect opinions on the shortcomings, it is necessary to understand the satisfaction of all the indicators, and the calculation is shown in Figure 17.

Affiliation of web information development judging indicators in X states.
It can be seen from Figure 17 that the user ownership rate of conversational machines per person, the computer ownership rate per 100 people, the socialization and commercialization of information services, and office automation are very satisfactory, are satisfied with the level of tourism network and website construction, but are dissatisfied with the coverage of the management information system, the proportion of e-commerce, and the security system.
The development of sports tourism needs to pay attention to key points such as sports events, tourism product innovation, infrastructure, marketing and publicity, talent training, cooperative innovation, customer experience and satisfaction, and sustainable development, and promote the prosperity and development of sports tourism through comprehensive promotion in many aspects.
5 Conclusions
Sports tourism is an emerging industry with wide coverage, rich content, and diverse participants. For the rapid development and basic operation of this emerging industry, information is its core driving force. Constructing an Internet-based sports tourism industry is the guarantee and trend of the development of sports tourism. Based on the literature review, this article comprehensively expounds on the role of the sports tourism information system in the development of sports tourism and analyzes the influence and significance of network information construction on sports tourism in X state. Firstly, the current situation of X state sports tourism network information construction is explained from the aspects of infrastructure construction and information industry construction. And using the analytic hierarchy process, fuzzy decision method, and other technologies to establish an evaluation method in line with the informationization of the sports tourism industry in Xiangxi, and effectively analyze the development level of the sports tourism information in X state, to analyze and study the status of the evaluation system of the sports tourism network information construction in X state, and propose corresponding countermeasures according to the actual situation. With the growth of global demand for sports tourism and the continuous development of technology, it is expected that sports tourism will continue to develop rapidly. In the future, we can look forward to the launch of more personalized and customized sports tourism products, and the provision of more innovative social and interactive experiences.
-
Funding information: This work was supported by the He'nan Educational Committee, grant number 2024JKZD46.
-
Conflict of interest: Author states no conflict of interest.
-
Data availability statement: Research data are not shared.
References
[1] N. Zhang, “Promoting outdoor sports tourism by natural resources and environment protection,” Nat. Environ. Prot., vol. 3, no. 1, pp. 44–51, 2022.10.38007/NEP.2022.030106Search in Google Scholar
[2] Y. Yu, “Exploring the value of strengthening natural environment protection to enhance the competitiveness of urban tourism,” Nat. Environ. Prot., vol. 3, no. 2, pp. 30–41, 2022.10.38007/NEP.2022.030204Search in Google Scholar
[3] W. Dongmei and W. Yanjun, “Research on the development strategy of national sports fitness in the background of population aging,” Agro Food Ind. Hi Tech., vol. 28, no. 1, pp. 679–682, 2017.Search in Google Scholar
[4] A. Vorobiova, “World and national fitness trends 2019,” Sport. Sci. Hum. Health, vol. 1, no. 1, pp. 62–69, 2019.10.28925/2664-2069.2019.1.2Search in Google Scholar
[5] Y. W. Hong and A. Scaglione, “Energy-efficient broadcasting with cooperative transmissions in wireless sensor networks,” IEEE Trans. Wirel. Commun., vol. 5, no. 10, pp. 2844–2855, 2016.10.1109/TWC.2006.04608Search in Google Scholar
[6] R. Cai, Y. Jiang, W. Yang, W. Yang, S. Shi, C. Shi, et al., “An efficient distributed trust model for wireless sensor networks,” IEEE Trans. Parallel Distrib. Syst., vol. 26, no. 5, pp. 1228–1237, 2016.10.1109/TPDS.2014.2320505Search in Google Scholar
[7] Y. Hu, M. Dong, K. Ota, A. Liu, and M. Guo, “Mobile target detection in wireless sensor networks with adjustable sensing frequency,” IEEE Syst. J., vol. 10, no. 3, pp. 1160–1171, 2017.10.1109/JSYST.2014.2308391Search in Google Scholar
[8] S. Singh, T. R. Dash, and I. Vashko, “Tourism, ecotourism and sport tourism: the framework for certification,” Mark. Intell. & Plan., vol. 34, no. 2, pp. 236–255, 2016.10.1108/MIP-09-2014-0180Search in Google Scholar
[9] R. R. Uvinha, C. S. Chan, C. K. Man, and L. M. Marafa, “Sport tourism: a comparative analysis of residents from Brazil and Hong Kong,” Rev. Brasileira de. Pesqui. em Turismo, vol. 12, no. 1, pp. 180–206, 2018.10.7784/rbtur.v12i1.1374Search in Google Scholar
[10] J. Ren, Y. Zhang, K. Zhang, A. Liu, J. Chen, and X. S. Shen, “Lifetime and energy hole evolution analysis in data-gathering wireless sensor networks,” IEEE Trans. Ind. Inform., vol. 12, no. 2, pp. 788–800, 2016.10.1109/TII.2015.2411231Search in Google Scholar
[11] R. S. Bhadoria and N. S. Chaudhari, “Pragmatic sensory data semantics with service-oriented computing,” J. Organ. End. User Comput. (JOEUC), vol. 31, no. 2, pp. 22–36, 2019. 10.4018/JOEUC.2019040102.Search in Google Scholar
[12] X. Zeng, Z. Wang, and Y. Hu, Enabling efficient deep convolutional neural network-based sensor fusion for autonomous driving, arXiv preprint arXiv:2202.11231, 2022.10.1145/3489517.3530444Search in Google Scholar
[13] S. Liu, J. Wang, Z. Wang, B. Yu, W. Hu, Y. Liu, et al., “Brief industry paper: The necessity of adaptive data fusion in infrastructure-augmented autonomous driving system,” In 2022 IEEE 28th Real-Time and Embedded Technology and Applications Symposium (RTAS), IEEE, Milano, Italy, 2022, May, pp. 293–296.10.1109/RTAS54340.2022.00031Search in Google Scholar
[14] R. Han, W. Mo, and D. Shao, “Research on the construction strategy of information model for manchuria style architecture and its application,” Int. J. Smart Home, vol. 10, no. 7, pp. 175–184, 2016.10.14257/ijsh.2016.10.7.18Search in Google Scholar
[15] C. Benzaid, K. Lounis, A. Al-Nemrat, N. Badache, and M. Alazab, “Fast authentication in wireless sensor networks,” Future Gener. Comput. Syst., vol. 55, no. FEB, pp. 362–375, 2016.10.1016/j.future.2014.07.006Search in Google Scholar
[16] P. G. V. Naranjo, M. Shojafar, H. Mostafaei, Z. Pooranian, and E. Baccarelli, “P-SEP: a prolong stable election routing algorithm for energy-limited heterogeneous fog-supported wireless sensor networks,” J. Supercomput., vol. 73, no. 2, pp. 1–23, 2017.10.1007/s11227-016-1785-9Search in Google Scholar
[17] H. Zhang, X. Hong, J. Cheng, A. Nallanathan, and V. C. Leung, “Secure resource allocation for OFDMA two-way relay wireless sensor networks without and with cooperative jamming,” IEEE Trans. Ind. Inform., vol. 12, no. 5, pp. 1714–1725, 2017.10.1109/TII.2015.2489610Search in Google Scholar
[18] M. Dong, K. Ota, and A. Liu, “RMER: Reliable and energy-efficient data collection for large-scale wireless sensor networks,” IEEE Internet Things J, vol. 3, no. 4, pp. 511–519, 2017.10.1109/JIOT.2016.2517405Search in Google Scholar
[19] G. Han, J. Jiang, C. Zhang, T. Q. Duong, M. Guizani, and G. K. Karagiannidis, “A survey on mobile anchor node assisted localization in wireless sensor networks,” IEEE Commun. Surv. & Tutor., vol. 18, no. 3, pp. 2220–2243, 2017.10.1109/COMST.2016.2544751Search in Google Scholar
[20] Y. Deng, L. Wang, M. Elkashlan, A. Nallanathan, and R. K. Mallik, “Physical layer security in three-tier wireless sensor networks: a stochastic geometry approach,” IEEE Trans. Inf. Forensics Secur., vol. 11, no. 6, pp. 1128–1138, 2017.10.1109/TIFS.2016.2516917Search in Google Scholar
[21] Z. Fei, B. Li, S. Yang, C. Xing, H. Chen, and L. Hanzo, “A survey of multi-objective optimization in wireless sensor networks: metrics, algorithms, and open problems,” IEEE Commun. Surv. Tutor., vol. 19, no. 1, pp. 550–586, 2017.10.1109/COMST.2016.2610578Search in Google Scholar
[22] J. Oller, I. Demirkol, J. Casademont, J. Paradells, G. U. Gamm, and L. Reindl, “Has time come to switch from duty-cycled MAC protocols to wake-up radio for wireless sensor networks?,” IEEE/ACM Trans. Netw., vol. 24, no. 2, pp. 674–687, 2016.10.1109/TNET.2014.2387314Search in Google Scholar
[23] J. Duan, D. Gao, D. Yang, C. H. Foh, and H. H. Chen, “An energy-aware trust derivation scheme with game theoretic approach in wireless sensor networks for IoT applications,” IEEE Internet Things J., vol. 1, no. 1, pp. 58–69, 2017.10.1109/JIOT.2014.2314132Search in Google Scholar
[24] F. Dobslaw, T. Zhang, and M. Gidlund, “End-to-end reliability-aware scheduling for wireless sensor networks,” IEEE Trans. Ind. Inform., vol. 12, no. 2, pp. 758–767, 2016.10.1109/TII.2014.2382335Search in Google Scholar
[25] M. S. Farash, M. Turkanović, S. Kumari, and M. Hölbl, “An efficient user authentication and key agreement scheme for heterogeneous wireless sensor network tailored for the Internet of Things environment,” Ad Hoc Netw., vol. 36, no. P1, pp. 152–176, 2016.10.1016/j.adhoc.2015.05.014Search in Google Scholar
[26] S. B. Prabhu, V. S. Vigneesh, A. Babu, and T. C. Anand, “Mobility assisted dynamic routing for mobile wireless sensor networks,” Soc. Sci. Electron. Publ., vol. 3, no. 1, pp. 9–19, 2017.10.5121/ijait.2013.3102Search in Google Scholar
[27] S. H. Seo, J. Won, S. Sultana, and E. Bertino, “Effective key management in dynamic wireless sensor networks,” IEEE Trans. Inf. Forensics Secur., vol. 10, no. 2, pp. 371–383, 2017.10.1109/TIFS.2014.2375555Search in Google Scholar
[28] Y. Gu, F. Ren, Y. Ji, and J. Li, “The evolution of sink mobility management in wireless sensor networks: a survey,” IEEE Commun. Surv. Tutor., vol. 18, no. 1, pp. 507–524, 2017.10.1109/COMST.2015.2388779Search in Google Scholar
[29] A. B. Noel, A. Abdaoui, T. Elfouly, M. H. Ahmed, A. Badawy, and M. S. Shehata, “Structural health monitoring using wireless sensor networks: a comprehensive survey,” IEEE Commun. Surv. Tutor., vol. 19, no. 3, pp. 1403–1423, 2017.10.1109/COMST.2017.2691551Search in Google Scholar
[30] F. Yaghoubi, A. Abbasfar, and B. Maham, “Energy-efficient RSSI-based localization for wireless sensor networks,” IEEE Commun. Lett., vol. 18, no. 6, pp. 973–976, 2016.10.1109/LCOMM.2014.2320939Search in Google Scholar
[31] H. Yetgin, K. T. K. Cheung, M. El-Hajjar, and L. Hanzo, “A survey of network lifetime maximization techniques in wireless sensor networks,” IEEE Commun. Surv. Tutor., vol. 19, no. 2, pp. 828–854, 2017.10.1109/COMST.2017.2650979Search in Google Scholar
[32] E. Hurych, “Authenticity in the perspective of sport tourism: some selected examples,” Phys. Cult. Sport. Stud. Res., vol. 73, no. 1, pp. 44–53, 2017.10.1515/pcssr-2017-0001Search in Google Scholar
[33] H. W. Lin and H. F. Lu, “Valuing residents’ perceptions of sport tourism development in Taiwan’s North Coast and Guanyinshan National Scenic Area,” Asia Pac. J. Tour. Res., vol. 21, no. 4, pp. 398–424, 2016.10.1080/10941665.2015.1050424Search in Google Scholar
© 2024 the author(s), published by De Gruyter
This work is licensed under the Creative Commons Attribution 4.0 International License.
Articles in the same Issue
- Regular Articles
- AFOD: Two-stage object detection based on anchor-free remote sensing photos
- A Bi-GRU-DSA-based social network rumor detection approach
- Task offloading in mobile edge computing using cost-based discounted optimal stopping
- Communication network security situation analysis based on time series data mining technology
- The establishment of a performance evaluation model using education informatization to evaluate teacher morality construction in colleges and universities
- The construction of sports tourism projects under the strategy of national fitness by wireless sensor network
- Resilient edge predictive analytics by enhancing local models
- The implementation of a proposed deep-learning algorithm to classify music genres
- Moving object detection via feature extraction and classification
- Listing all delta partitions of a given set: Algorithm design and results
- Application of big data technology in emergency management platform informatization construction
- Evaluation of Internet of Things computer network security and remote control technology
- Solving linear and nonlinear problems using Taylor series method
- Chinese and English text classification techniques incorporating CHI feature selection for ELT cloud classroom
- Software compliance in various industries using CI/CD, dynamic microservices, and containers
- The extraction method used for English–Chinese machine translation corpus based on bilingual sentence pair coverage
- Material selection system of literature and art multimedia courseware based on data analysis algorithm
- Spatial relationship description model and algorithm of urban and rural planning in the smart city
- Hardware automatic test scheme and intelligent analyze application based on machine learning model
- Integration path of digital media art and environmental design based on virtual reality technology
- Comparing the influence of cybersecurity knowledge on attack detection: insights from experts and novice cybersecurity professionals
- Simulation-based optimization of decision-making process in railway nodes
- Mine underground object detection algorithm based on TTFNet and anchor-free
- Detection and tracking of safety helmet wearing based on deep learning
- WSN intrusion detection method using improved spatiotemporal ResNet and GAN
- Review Article
- The use of artificial neural networks and decision trees: Implications for health-care research