Development of Aβ and anti-Aβ dynamics models for Alzheimer’s disease
-
Cindyawati Cindyawati
 ,
Hendradi Hardhienata
and
Agus Kartono
,
Hendradi Hardhienata
and
Agus Kartono


Abstract
Alzheimer’s disease is one of the most prevalent types of dementia worldwide. It is caused by the accumulation of amyloid-beta (Aβ) plaques in the brain, disrupting communication pathways and memory. Microglia and astrocytes act as the immune system of the brain, clearing Aβ plaque deposits. However, these cells can lose effectiveness when Aβ plaque accumulation exceeds normal limits, leading to inflammation induced by proinflammatory cytokines. One type of treatment involves anti-Aβ drug therapy. Anti-Aβ drugs are believed to have the ability to reduce Aβ plaque deposits effectively. The mechanism of Aβ plaque accumulation can be explained by ordinary differential equations describing the growth of Aβ monomers. In this study, we aimed to develop a new mathematical model to elucidate the role of the immune system and drug therapy in reducing Aβ plaque deposits. Based on the simulation results, we conclude that the use of anti-Aβ drug therapy can decrease the concentration of Aβ plaque deposits, and the effective treatment duration for Alzheimer’s patients is estimated to be approximately 4 months starting from the time the drug was first administered.
1 Introduction
Dementia is a type of disease that affects the nervous system and causes memory loss [5]. The most common type of dementia is Alzheimer’s disease, accounting for approximately 60–80% of cases [42]. Generally, individuals aged 65 years and older with Alzheimer’s disease, especially women, are more susceptible to this disease [14]. Alzheimer’s disease accounts for only 4–6% of deaths. According to information from Statista and the Alzheimer’s Association, approximately 37 out of 100 thousand people, or approximately 0.037%, died due to Alzheimer’s disease from 2000 to 2019 [11]. However, the number of Alzheimer’s sufferers worldwide reached 47 million in 2016, and this figure is expected to continue to increase to 131 million by 2050 [10]. The estimated cost to Alzheimer’s patients worldwide is approximately US$818 billion [7]. Therefore, Alzheimer’s disease patients require special care because the management of this disease has social and economic implications.
One of the causes of Alzheimer’s disease is the accumulation of Aβ plaques in the hippocampus. In Alzheimer’s disease patients, the hippocampus undergoes atrophy, leading to difficulties in processing and transmitting memories [8]. Amyloid precursor protein (APP) cleavage mistakes result in misfolding of the Aβ monomer, which leads to the formation of Aβ plaques. APP undergoes two crucial processes: nonamyloidogenic and amyloidogenic processes. Under normal conditions, APP undergoes a nonamyloidogenic process, in which it is cleaved by α-secretase and γ-secretase to produce soluble sAPP-α and p3 in the cerebrospinal fluid. Conversely, under abnormal conditions, APP undergoes the amyloidogenic process, where it is cleaved by β-secretase and γ-secretase, resulting in soluble sAPP-β and non-soluble monomer Aβ in the brain [20,26]. Aβ monomers accumulate to form oligomers and eventually form fibrils. Fibril stacks precipitate and eventually form toxic plaques [8].
The Aβ aggregation process is divided into two phases: nucleation and elongation [12,15]. Thermodynamically, the nucleation phase requires more energy than the elongation phase. This is because, in contrast to the elongation phase, the nucleation phase develops more slowly and involves the production of Aβ monomers (M 1) into dimers (M 2), trimers (M 3), tetramers (M 4), and ultimately oligomers (O). On the other hand, the elongation phase requires less energy. This is because the elongation phase involves the process of adding length to oligomers (O) to form fibrils (P), and it proceeds more quickly [5].
Astrocytes and microglia are immune systems present in the brain. In Alzheimer’s patients, the main trigger for the activation of microglia and astrocytes is the accumulation of Aβ. Microglia, which function like macrophages, play a role in clearing Aβ deposits. This process causes microglia to enlarge, gradually reducing their functional capacity over time. This decline in function reduces the ability to break down Aβ plaques, leading to the accumulation of Aβ and the production of proinflammatory cytokines that can damage neurons [4]. Astrocytes function to repair nerve injuries and play a role in neurotransmitter activity. Tumor necrosis factor alpha (TNF-α) is a cytokine that affects astrocyte activation. It automatically causes the production of monocyte chemotactic protein 1 (MCP-1). MCP-1 attracts monocytes from the blood into plaques. When danger is detected, monocytes differentiate into macrophages. Macrophages are divided into proinflammatory (
Research on Aβ plaque accumulation as one of the causes of Alzheimer’s disease is continually being conducted, both through experiments and simulations. Numerous mathematical models have been applied, primarily aiming to understand the mechanism of Aβ plaque growth. Current medications can only reduce Aβ plaque deposits, and treatment duration plays a crucial role in recovery. Simulation models of Aβ dynamics aim to predict Aβ growth to determine an effective treatment duration. Therefore, this research aimed to simulate the biological dynamics of Aβ growth, the interaction between the immune system and the use of anti-Aβ drug therapy.
Mathematical models serve as effective tools to test hypotheses and confirm experiments using dynamic simulations. Through these models, we can manipulate the mechanisms of biological dynamic systems in a relatively short time without risking extensive laboratory trial periods. Variations in biological system dynamics models can be adjusted to match the experiments under consideration. In Alzheimer’s disease dynamic simulations, models can be validated using clinical experimental information, although clinical experiments are still trate. Therefore, simulation results can be used as hypotheses for Alzheimer’s disease development, considering treatment durations. Quantitative models have been developed as an experimental approach to Alzheimer’s disease. These models are typically formulated as ordinary differential equations based on Aβ concentrations, opening avenues for research in Alzheimer’s disease modeling. As this research can enhance Alzheimer’s disease treatment models, the models can be utilized to determine effective treatment durations.
Craft et al. [8] formulated and analyzed a mathematical model for Aβ aggregation from a monomeric form to a fibril. Because the model is written in coupled differential equations, the mechanism by which monomers grow into fibrils and eventually form plaques can be examined. The models they outlined rely on both continuous-time and dynamic-time models. Their simulation results indicate that the concentration of Aβ aggregates is influenced by parameters involved in monomer production during the nucleation phase, emphasizing the need for accurate parameter value estimates.
Hao and Friedman [14] developed a mathematical model of Alzheimer’s disease that incorporates the roles of microglia and astrocytes. The model is expressed in partial differential equations. The role of the immune system in clearing Aβ plaque deposits can be analyzed, making it applicable for simulating the effects of the most effective drugs.
Currently, drug development research is ongoing both in silico and in vivo. Some examples of potential drugs are Etanercept, Bindarit, and Aducanumab [14]. Aducanumab is a type of anti-Aβ drug that functions as a monoclonal immune system. This drug is designed to target and bind to accumulated Aβ. According to data from the Drug Bank, Aducanumab successfully received approval from the Food and Drug Administration as the first Alzheimer’s therapy drug in 2021 [10]. Aducanumab works selectively by binding to Aβ oligomers and fibrils rather than in a monomeric form. This distinction distinguishes Aducanumab from other anti-Aβ drugs.
Thus, to track the development of Aβ concentrations, we will create a mathematical model in this study that will be used for studies of the immune system and anti-Aβ medication. The results of developing this model are expected to provide insights into effective treatment durations and the future development of drug manufacturing.
This research will present the development of a mathematical model describing the growth of Aβ monomers into fibrils, interactions with the immune system, and anti-Aβ drug therapy. The article consists of three sections. Section 2 presents the development of the mathematical model and the detailed values of the model parameters used. Section 3 provides the results and analysis of the simulations conducted. Finally, Section 4 presents the conclusion.
2 Formulation of mathematical models of combination therapy
2.1 Mathematical model of the growth of Aβ
This research began with developing a model based on equations proposed by Craft et al. [8]. The Aβ aggregation process is modeled by selecting the nucleation phase, where the process occurs more slowly. This makes it possible to consider the concentrations of monomer (M 1), dimer (M 2), trimer (M 3), and so on. The next process builds oligomer (O) and fibril (P) models by considering them as the average values of O and P.
The first assumption is that an oligomer forms at least n + 1 monomers, resulting in an equation containing n + 2 components, namely, monomers (M
1), dimers (M
2), trimers (M
3), …,
where
Because monomers are produced in the brain, the third assumption is that the production process can be represented by the saturation function
Explanation of the assumptions used in the simulation model:
Oligomer formation: The formation of oligomers begins stepwise from monomers (M 1), dimers (M 2), trimers (M 3), and so on, consisting of at least
Aggregation process: The aggregation into larger structures occurs through the gradual addition of monomers, such as the first monomer joining with the second to form a dimer. This dimer can then add a third monomer to form a trimer, and so on.
Monomer production rate: The third assumption indicates that the rate of monomer production depends on the concentration of the monomers themselves, meaning there is an initial rapid growth when the monomer concentration is low, but the growth rate slows down and eventually stops when the maximum capacity is reached.
Degradation factor (
Meanwhile, the assumptions used can be written in the following differential equations:

The factors
The selection of initial conditions and parameter values is crucial in the development of the Alzheimer’s dynamic model because it can influence the simulation results. Equation (3) indicates the parameter values and initial conditions used in the simulation.
Naturally, the parameters involved in the Aβ aggregation process have a very wide range of values. Based on this, the values of
Description and parameter estimation values based on reference for the Aβ aggregation model for equations (2) and (3)
| Parameter | Description | Value | Reference |
|---|---|---|---|
|
|
Nucleation rate |
|
[7,20] |
|
|
Elongation rate |
|
[7,8,20,26] |
|
|
Average oligomer size |
|
[12,15,24] |
|
|
Average fibril size |
|
[26] |
|
|
Degradation rate of monomers |
|
[8,14] |
|
|
Degradation rate of oligomers |
|
[14] |
|
|
Degradation rate of fibrils |
|
Estimated |
The estimation of the parameter
The degradation rate (
In the initial condition, the value of
2.2 Mathematical model of the immune system
Hao and Friedman [14] developed a mathematical model for the role of microglia and astrocytes in Alzheimer’s disease. There are two phenotypes of active microglia: proinflammatory (
The equation for the immune system includes proinflammatory (

So, the model of the immune system can be written as follows:
where
Description and estimated parameter values based on references for the role of the immune system models for equation (4)
| Parameter | Description | Value | Reference |
|---|---|---|---|
|
|
Concentration of microglia | 0.047
|
|
|
|
Activation rate of microglia by neurofibrillary tangles (NFT) |
|
|
|
|
Concentration of NFT outside neurons |
|
|
|
|
Average concentration of extracellular NFT |
|
|
|
|
Activation rate of microglia by astrocytes |
|
|
|
|
Density of astrocytes outside neurons |
|
|
|
|
Average concentration of oligomer Aβ |
|
|
| β | Proinflammatory/anti-inflammatory ratio | 10 | |
|
|
Ratio of TNF-α to half-life of TNF-α |
|
[14] |
|
|
Ratio of IL-10 to half-life of IL-10 |
|
|
|
|
Rate of
|
|
|
|
|
Value of TGF-β |
|
|
|
|
Half-life of TGF-β |
|
|
|
|
Value of proinflammatory and anti-inflammatory microglia |
|
|
|
|
Half-life of TNF-α |
|
|
|
|
Value of IL-10 |
|
|
|
|
Half-life of IL-10 |
|
2.3 Mathematical model of drug therapy
Hao and Friedman [14] developed a mathematical model for the use of Alzheimer’s drug therapy. One of the drugs used is Aducanumab. Aducanumab is chosen as an anti-Aβ agent. The use of anti-Aβ drugs can be described by the below equation:
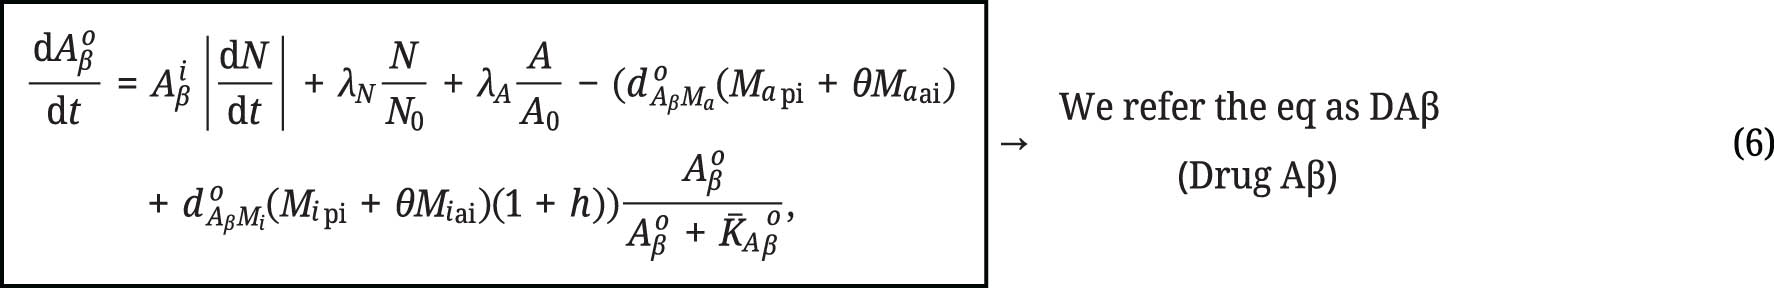
The parameter h represents the dosage of the drug, and the value is 10. We used 10 because based on the clinical test of the drug. N represents the number of live neurons,
Description and parameter estimation values based on reference for the drug therapy models for equation (6)
| Parameter | Description | Value | Reference |
|---|---|---|---|
|
|
Concentration of Aβ inside neurons |
|
[14] |
|
|
Concentration of Aβ outside neurons |
|
|
|
|
Production rate of
|
|
|
|
|
Production rate of
|
|
|
|
|
Clearance rate of
|
|
|
|
|
Clearance rate of
|
|
|
|
|
Concentration of macrophages proinflammatory and anti-inflammatory | 0
|
|
|
|
Concentration of microglia proinflammatory and anti-inflammatory |
|
|
|
|
Ratio effectivity
|
0.9 | |
|
|
Michaelis–Menten coefficient of
|
|
2.4 Connection of the model
In this subsection, the integration of the immune system model (2.2) and the drug therapy model (2.3) into the core Aβ growth model (2.1) will be shown. The equations in Sections 2.2 and 2.3 will serve as “modifier” equations for the core model; hence, the Aβ growth would also modified. The modification is performed by incorporating the equations from Sections 2.2 and 2.3 into the equation
The results of the modifications to the core Aβ growth model are as follows:
| 1 | Growth of Aβ | = | GAβ |
| 2 | Modification by the immune system on Aβ growth | = | Growth of the Aβ − model of the immune system |
| = | GAβ − MIS | ||
| 3 | Modification by drugs and the immune system on Aβ growth | = | Modification by the Immune System on the Aβ growth − model of drug therapy |
| = | GAβ − MIS − DAβ |
In this study, we aimed to integrate mathematical models derived from equations (5) and (6) into equation (2) to obtain three curves: The role of the immune system, the application of drug therapy combined with the immune system, and a model without both as a control. The simulation results include the concentrations of monomer Aβ transforming into fibrils and a comparison of the concentrations of monomeric Aβ transforming into fibrils in the immune system and drug therapy models over time.
3 Results and discussion
The results of the third simulation of model development over a duration of 180 days exhibit a sigmoid curve. This sigmoid curve serves as the initial input for the Aβ accumulation process, as it depicts the concentration of Aβ accumulation as a function of time [4,19].
Based on Figure 1, the sigmoid curve consists of three parts: the lag phase, the exponential phase, and the stationary phase. The lag phase indicates a slow initial growth concentration, the exponential phase indicates a rapid growth concentration, and the stationary phase indicates a concentration where growth remains unchanged [18]. The nucleation phase begins in the lag phase, where the process involves the formation of monomers until the formation of Aβ oligomers. The elongation phase starts from the exponential phase to the stationary phase, indicating the growth of oligomers into fibrils, ultimately culminating in the formation of Aβ plaques.

The sigmoid curve serves as the initial input, divided into the nucleation phase and the elongation phase.
The nucleation phase is the starting point in the aggregation process, causing the aggregation process to occur more slowly than the elongation phase. This is because the nucleation phase is the initial process, requiring a significant amount of energy and being thermodynamically unfavorable. Conversely, in the elongation phase, the aggregation process is slightly faster because it is thermodynamically more favorable and requires less energy [5].
3.1 Simulation results of the growth of Aβ
The simulation results show the concentration growth of Aβ over time, from the monomeric form (M
1) to the fibrils form (P), as depicted in Figure 2. Figure 2 shows that the concentration of Aβ increased from M
1 to P. The M
1 curve indicates that on day 0, the monomer already had a high concentration of 73.8

The Aβ growth concentrations
The laws of thermodynamics state that the Gibbs free energy will reach a minimum value. In this case, the equilibrium between Aβ monomers and aggregates results from the lowest change in free energy [3,34,44]. The concentrations of M 2, M 3, M 4, M 5, M 6 slightly increased and reached saturation after day 150
The saturation of the Aβ concentration indicates that the amount of Aβ that can dissolve in the brain reaches the maximum. When the Aβ concentration saturation, it aggregates to form plaques in the brain [38]. Aβ plaques have a denser structure, making them difficult to clear.
Moreover, for M 2, M 3, M 4, M 5, M 6, and O, the Aβ concentration significantly increased from day 0 to day 90, then increased slowly until day 150 and stabilized until day 180. The concentration of the fibrils (P) increased until day 180 because the fibrils tended to be more stable and more difficult to break down than the other Aβ structures. Therefore, the concentration of fibrils tends to increase in the brain over time.
Table 4 shows the Aβ growth concentration values over 180 days at intervals of 30 days. According to Table 4, there was a difference in the concentrations of Aβ in M 2, M 3, M 4, M 5, M 6, and O on the same day. This demonstrates that the growth concentrations of M 1, M 2, M 3, M 4, M 5, M 6, and O increase daily over the course of 180 days, but the difference in concentration between M 1, M 2, M 3, M 4, M 5, M 6, and O decreases at the same time.
The values of the Aβ concentration over 180 days
| Concentration (
|
Days to- | ||||||
|---|---|---|---|---|---|---|---|
| 0 | 30 | 60 | 90 | 120 | 150 | 180 | |
| M 1 | 0 | 73.828 | 73.828 | 73.828 | 73.828 | 73.828 | 73.828 |
| M 2 | 0 | 9.864 | 13.146 | 14.231 | 14.589 | 14.707 | 14.746 |
| M 3 | 0 | 1.819 | 2.699 | 2.991 | 3.088 | 3.120 | 3.130 |
| M 4 | 0 | 0.269 | 0.419 | 0.469 | 0.485 | 0.491 | 0.493 |
| M 5 | 0 | 0.114 | 0.183 | 0.206 | 0.214 | 0.216 | 0.217 |
| M 6 | 0 | 0.022 | 0.036 | 0.040 | 0.042 | 0.042 | 0.042 |
| O | 0 | 0.011 | 0.018 | 0.020 | 0.021 | 0.021 | 0.021 |
| P | 0 | 1.006 | 4.317 | 8.546 | 13.079 | 17.710 | 22.373 |
The kinetic process of Aβ begins with Aβ monomers, which are normal products of APP cleavage. Monomers have the potential to undergo association through noncovalent interactions. Subsequently, the monomers undergo the nucleation phase, which involves a critical concentration of monomers for nucleus formation. The initiation point of nucleation starts with the formation of nuclei, which serve the purpose of forming small aggregates. Once the nuclei are formed, Aβ monomers will continue to undergo aggregation until oligomers are formed [39].
Oligomers can evolve into protofibrils with larger structures. Protofibrils represent the transitional phase between oligomers and fibrils. Subsequently, protofibrils undergo an elongation phase in which they elongate and aggregate to form fibrils. The fibrils then continue to accumulate, forming Aβ plaques [6,17,37].
In the nucleation phase, there are sometimes two types of cleavage: primary nucleation and secondary nucleation. Primary nucleation refers to the formation of Aβ from monomers without the involvement of preexisting aggregates. Moreover, secondary nucleation involves preexisting aggregates. Generally, preexisting fibrils can act as seeds for the aggregation of new monomers. Secondary nucleation is a process that can accelerate the growth of Aβ fibrils and is more efficient [29,35,41].
Thermodynamically, secondary nucleation is more favorable and occurs spontaneously than primary nucleation. During secondary nucleation, preexisting aggregates act as templates, reducing the activation energy and facilitating the formation of new nuclei. Conversely, the formation of nuclei during primary nucleation involves the assembly of monomers into aggregates. This process requires a significant amount of energy, making it less favorable and not occurring spontaneously [5,21].
3.2 Simulation results for the immune system
The immune system within the brain includes microglia and astrocytes. Figure 3 shows a comparison of the concentration of Aβ in the Aβ growth models without the immune system and with the immune system.

Comparison of Aβ growth concentration values
As shown in Figure 3, the effect of the immune system on the Aβ growth model showed a pattern of concentration increase similar to that of the model without the immune system. However, the concentrations calculated for the immune system were lower. This indicates that the abilities of microglia and astrocytes, which are involved in the immune system, play a role in reducing Aβ accumulation. The role of the immune system becomes apparent from the growth of dimers (M 2) to fibrils (P). This is expected to bring the concentration of Aβ growth from the dimers to the fibrils back to the initial monomeric form. Compared with those in the model without the immune system, the concentrations of Aβ generated by M 2, M 3, M 4, M 5, M 6, O (oligomer), and P (fibril) were significantly lower.
Table 5 shows the changes in the Aβ concentration with the involvement of the immune system. There was a difference in the change in Aβ concentration with the immune system compared to without the immune system over 180 days. A difference in the change in the Aβ concentration was observed at the saturation state on day 180. This is because Aβ growth has reached a point where there is no further accumulation. The difference in the change in concentration for each form is 1.389
The concentration of Aβ increased with the involvement of the immune system over 180 days
| Concentration (
|
Days to- | ||||||
|---|---|---|---|---|---|---|---|
| 0 | 30 | 60 | 90 | 120 | 150 | 180 | |
| M 1 | 0 | 73.828 | 73.828 | 73.828 | 73.828 | 73.828 | 73.828 |
| M 2 | 0 | 8.933 | 11.907 | 12.890 | 13.214 | 13.321 | 13.357 |
| M 3 | 0 | 1.647 | 2.445 | 2.709 | 2.797 | 2.826 | 2.835 |
| M 4 | 0 | 0.243 | 0.379 | 0.425 | 0.440 | 0.445 | 0.446 |
| M 5 | 0 | 0.103 | 0.166 | 0.187 | 0.193 | 0.196 | 0.196 |
| M 6 | 0 | 0.020 | 0.032 | 0.036 | 0.038 | 0.038 | 0.038 |
| O | 0 | 0.010 | 0.016 | 0.018 | 0.019 | 0.019 | 0.019 |
| P | 0 | 0.910 | 3.909 | 7.739 | 11.844 | 16.039 | 20.263 |
Most Aβ peptides can be soluble in brain fluid, especially in the form of monomers or small oligomers. Under normal conditions, Aβ peptides are cleared through two mechanisms: the enzymatic pathway and the nonenzymatic pathway. The nonenzymatic pathway includes phagocytosis by microglia in small quantities and transport across the blood–brain barrier. Conversely, enzymatic clearance involves several proteases such as neprilysin and insulin-degrading enzyme, which play a role in breaking down Aβ into smaller fragments, allowing it to dissolve in the extracellular fluid [40,43]. However, Aβ peptides can become insoluble, leading to aggregation and the formation of plaques composed of larger fibrils.
The accumulation of Aβ in Alzheimer’s patients leads to inflammation in the brain, activating astrocytes and microglia, which then produce proinflammatory cytokines that damage neurons. If not addressed, more damaged and dead neurons will accumulate, disrupting communication pathways and cognitive functions. This is due to apoptosis, a programmed cell death process. Proinflammatory cytokines such as TNF-α trigger apoptosis, causing the gradual death of neurons [2,27].
Anti-inflammatory cytokines can regulate the immune system to stimulate microglia and macrophages to clear Aβ plaques. Macrophages, which exhibit phagocytic properties, engulf Aβ particles. The concentration of Aβ in growing plaques decreases over time. If the number of Aβ plaques decreases, inflammation will also decrease, allowing for the resolution of neuronal death.
The ability of microglia to clear Aβ plaques is influenced by several factors such as the concentration of Aβ oligomers, microglial performance, and individual variability. The greater the concentration of Aβ oligomers in the brain is, the longer it may take for microglia to clear Aβ plaques. Age can affect the performance of microglia, potentially slowing the clearance process. Other factors such as genetics and overall health can impact the efficiency of microglia as antibodies [22].
3.3 Simulation results of drug therapy
One approach to addressing Alzheimer’s disease is through drug therapy. Drug therapy involving the immune system is used to simulate the formation of dimers (M 2) to fibrils (P). The rationale is similar to the application in the immune system, aiming to reduce the concentration of dimer to fibril growth in Aβ back to the monomeric form.
The drug therapy used involves anti-Aβ medications. As shown in Figure 4, the effect of drug therapy on the Aβ growth model showed a pattern of concentration increase similar to that of the immune system model and the model without the immune system. However, the concentrations calculated for drug therapy were lower than those for the immune system and the model without the immune system. This finding indicates that the effectiveness of anti-Aβ drugs is an effective therapeutic approach for reducing Aβ plaque growth.

Comparison of Aβ growth concentration values
Table 6 shows the concentrations of Aβ increased with the use of a combination of drugs and the immune system. According to Table 6, the Aβ concentration significantly decreased compared to the concentrations in the previous model, especially the fibril concentration. There was a difference in the change in the Aβ concentration between patients who did and did not receive drug therapy over 180 days. A difference in the change in the Aβ concentration was observed at the saturation state on day 180. This is because Aβ growth has reached a point where there is no further accumulation. The difference in the change in concentration for each form was 4.343
The concentration of Aβ increased with the use of a combination of drugs and the immune system over 180 days
| Concentration (
|
Days to- | ||||||
|---|---|---|---|---|---|---|---|
| 0 | 30 | 60 | 90 | 120 | 150 | 180 | |
| M 1 | 0 | 73.828 | 73.828 | 73.828 | 73.828 | 73.828 | 73.828 |
| M 2 | 0 | 6.953 | 9.273 | 10.039 | 10.292 | 10.376 | 10.404 |
| M 3 | 0 | 1.281 | 1.904 | 2.110 | 2.179 | 2.201 | 2.209 |
| M 4 | 0 | 0.189 | 0.295 | 0.331 | 0.342 | 0.346 | 0.347 |
| M 5 | 0 | 0.080 | 0.129 | 0.145 | 0.151 | 0.152 | 0.153 |
| M 6 | 0 | 0.015 | 0.025 | 0.028 | 0.029 | 0.030 | 0.030 |
| O | 0 | 0.008 | 0.013 | 0.014 | 0.015 | 0.015 | 0.015 |
| P | 0 | 0.707 | 3.041 | 6.024 | 9.221 | 12.489 | 15.779 |
Drug therapy for Alzheimer’s disease mainly involves inhibiting Aβ aggregation. The drug used in this study was Aducanumab. Aducanumab is an anti-Aβ drug classified as immunoglobulin type 1 (IgG1). Anti-Aβ drugs aim to reduce the formation of toxic Aβ oligomers and enhance the clearance of Aβ from the brain [25]. These drugs work by targeting specific molecular mechanisms, such as primary nucleation, secondary nucleation, and concentration-dependent aggregation of monomers [1].
Anti-Aβ drugs selectively target Aβ aggregates, including Aβ plaques and oligomers, but do not target Aβ monomers. This is because, in the aggregation process, Aβ has a high energy barrier for the transition state [36]. Oligomers are believed to be more toxic form than fibril assemblies [13]. As a result, Aducanumab binds to Aβ plaques and oligomers and then stimulates microglia to reduce Aβ. The effectiveness of anti-Aβ drug therapy can reduce the rate of Alzheimer’s disease decline by approximately 30% and has a significant impact on disease progression [33]. The dosage and duration of treatment significantly influence the effectiveness of anti-Aβ drugs in slowing cognitive impairment.
3.4 Determining the duration of treatment
The duration of treatment can be determined from Figure 4. Figure 4, shows that the Aβ concentration begins to increase from day 120 to day 180. The saturation values in the context of drug usage imply that the frequency of drug administration is no longer capable of significantly increasing therapeutic effectiveness. The effectiveness of drug therapy in this case refers to the ability to reduce the concentration of Aβ.
According to Honig and Boyd [16], in controlled trials, the typical duration of treatment is approximately 6 months, at which point the drug has provided significant benefits. The simulation results for determining the duration of treatment confirmed the reference, which is approximately 4 months starting from day 0 to 120th days. However, the duration of treatment for Alzheimer’s patients is influenced by several factors such as age, the patient’s condition, and the Aβ concentration. The findings regarding the treatment duration can provide insights for further research on developing more effective drugs. Until now, the use of anti-Aβ drug therapy has only been able to reduce the concentration of Aβ but has not been able to completely clear Aβ from the brain [45].
The ideal duration of treatment depends on the specific condition of the patient. According to Osborne and Schenk, the average duration of drug availability for Alzheimer’s disease patients ranges from 31 weeks until 243 weeks [9,32,36].
3.5 Simulation results of the concentration rate
The growth concentration rate indicates the kinetics of changes that can indicate how fast or slow Aβ growth is. Figure 5 shows the comparison of the rate of increase in the Aβ concentration with the immune system, drug therapy, and the absence of both agents. All three simulation models exhibit patterns of increasing and decreasing rates on the same days. However, based on Figure 5, it is evident that the concentration of Aβ in the context of drug therapy decreased compared to that in the immune system and in the absence of both agents.

Comparison of the growth concentration rates
A significant difference in the Aβ concentration was detected in M 2. This is due to the difference in the structure between Aβ monomers and dimers (M 2). Structural differences can influence the Aβ growth concentration rate significantly by impacting how quickly dimers are formed [23]. Aβ dimers result from the aggregation of monomeric forms, increasing the density of dimers. Denser dimers tend to join other Aβ molecules more quickly, triggering an increase in the concentration. Additionally, the availability of Aβ monomers also affects the concentration of M 2. When the concentration of Aβ monomers is very high, dimer formation increases, thereby increasing the rate of dimer formation.
At high concentrations, Aβ will interact with each other through chemical interactions to form aggregates with large molecular weights that are capable of producing larger aggregates. These aggregates are the precursors to fibril growth. The ability of monomers to aggregate also influences the concentration rate [28]. Therefore, the curve of trimer (M 3) to oligomer (O) has different points of maximum rate increase due to the presence of a critical concentration that triggers the aggregation process [31]. If the formed nucleus is the same size, then in the nucleation stage, the aggregation rate will tend to be uniform [30].
4 Conclusions
The development of an Alzheimer’s disease model through computation can provide insights into the dynamics and kinetics of Alzheimer’s. The dynamics and kinetics of Aβ aggregation involve numerous processes, including primary nucleation, secondary nucleation, and elongation. In the dynamics of Alzheimer’s disease model development, there is a complexity in the pathological progression that involves the accumulation of Aβ plaques, inflammation, and synaptic damage over time. Meanwhile, the kinetics of Alzheimer’s describes the factors influencing the development of Alzheimer’s disease, such as the accumulation of Aβ protein, the immune system response, and the response to drug therapy.
The initial concentration of the Aβ monomer and its ability to aggregate are factors that influence the rate of Aβ release. The relationship between growth concentration and aggregation indicates that an increase in Aβ concentration can enhance the potential for aggregation. Conversely, an increase in Aβ aggregation can lead to greater accumulation, thereby increasing the Aβ concentration.
Simulations of Aβ growth involving the immune system and drug therapy have shown that the use of a combination of drugs and the immune system influences the Aβ concentration, thus capable of slowing the aggregation process. Currently, drug therapy has not been able to completely eliminate Aβ in the brain. This indicates that the available drugs still need further development.
The effective duration of drug treatment based on simulation results is approximately 4 months starting from the time the drug was first administered. This is because the administered drug is no longer able to provide a significant effect. The determination of the treatment duration depends on the patient’s condition. The longer the treatment is, the more likely it is to result in side effects, resistance, and a reduction in the benefits of the drug.
-
Funding information: Authors state no funding involved.
-
Author contributions: Cindyawati Cindyawati, Faozan Ahmad, and Agus Kartono conceived the idea, conducted analyses and simulation, and drafted the manuscript. Hendradi Hardhienata conceptualized the flow for the entire manuscript draft, verified all the results, and edited the draft.
-
Conflict of interest: There are no conflicts of interest to declare. The authors have no competing interests.
-
Ethical approval: This research did not require ethical approval.
-
Code availability: Not applicable, formulas can be coded using any programming platform.
References
[1] M. Bartolini, C. Bertucci, M. L. Bolognesi, A. Cavalli, C. Melchiorre, & V. Andrisano. (2007). Insight into the kinetic of amyloid β (1-42) peptide self-aggregation: Elucidation of inhibitors’ mechanism of action. ChemBioChem, 8(17), 2152–2161. doi: 10.1002/cbic.200700427.Search in Google Scholar PubMed
[2] G. Bieri, K. M. Lucin, C. E. O’Brien, H. Zhang, S. A. Villeda, & T. Wyss-Coray, (2018). Proteolytic cleavage of Beclin 1 exacerbates neurodegeneration. Molecular Neurodegeneration, 13(1), 1–19. doi: 10.1186/s13024-018-0302-4.Search in Google Scholar PubMed PubMed Central
[3] A. K. Buell. (2022). Stability matters, too – the thermodynamics of amyloid fibril formation. Chemical Science, 13(35), 10177–10192. doi: 10.1039/d1sc06782f.Search in Google Scholar PubMed PubMed Central
[4] S. Burgold, S. Filser, M. M. Dorostkar, B. Schmidt, & J. Herms. (2014). In vivo imaging reveals sigmoidal growth kinetic of β-amyloid plaques. Acta Neuropathologica Communications, 2(1), 1–11. doi: 10.1186/2051-5960-2-30.Search in Google Scholar PubMed PubMed Central
[5] E. Chatani, & N. Yamamoto. (2017). Recent progress on understanding the mechanisms of amyloid nucleation. Biophysical Reviews, 10(2), 527–534. doi: 10.1007/s12551-017-0353-8.Search in Google Scholar PubMed PubMed Central
[6] G. F. Chen, T. H. Xu, Y. Yan, Y. R. Zhou, Y. Jiang, K. Melcher, H. Eric Hu. (2017). Amyloid beta: Structure, biology and structure-based therapeutic development. Acta Pharmacologica Sinica, 38(9), 1205–1235. doi: 10.1038/aps.2017.28.Search in Google Scholar PubMed PubMed Central
[7] S. I. A. Cohen, M. Vendruscolo, C. M. Dobson, & T. P. J. Knowles. (2012). From macroscopic measurements to microscopic mechanisms of protein aggregation. Journal of Molecular Biology, 421(2–3), 160–171. doi: 10.1016/j.jmb.2012.02.031.Search in Google Scholar PubMed
[8] D. L. Craft, L. M. Wein, & D. J. Selkoe. (2002). A mathematical model of the impact of novel treatments on the Aβ burden in the Alzheimer’s brain, CSF and plasma. Bulletin of Mathematical Biology, 64(5), 1011–1031. doi: 10.1006/bulm.2002.0304.Search in Google Scholar PubMed
[9] J. Cummings, G. Lee, A. Ritter, & K. Zhong. (2018). Alzheimer’s disease drug development pipeline: 2018. Alzheimer's & Dementia: Translational Research & Clinical Interventions, 4(2018), 195–214. doi: 10.1016/j.trci.2018.03.009.Search in Google Scholar PubMed PubMed Central
[10] J. Cummings, & S. Salloway. (2021). Aducanumab: Appropriate use recommendations. Alzheimer's & dementia : the journal of the Alzheimer's Association, 18(3), 1–3. doi: 10.1002/alz.12444.Search in Google Scholar PubMed PubMed Central
[11] A. Fani Maleki, & S. Rivest. (2019). Innate immune cells: Monocytes, monocyte-derived macrophages and microglia as therapeutic targets for Alzheimer’s disease and multiple sclerosis. Frontiers in Cellular Neuroscience, 13, 1–8. doi: 10.3389/fncel.2019.00355.Search in Google Scholar PubMed PubMed Central
[12] P. E. Fraser, L. K. Duffy, M. B. O’Malley, J. Nguyen, H. Inouye, & D. A. Kirschner. (1991). Morphology and antibody recognition of synthetic β‐amyloid peptides. Journal of Neuroscience Research, 28(4), 474–485. doi: 10.1002/jnr.490280404.Search in Google Scholar PubMed
[13] S. Giorgetti, C. Greco, P. Tortora, & F. A. Aprile. (2018). Targeting amyloid aggregation: An overview of strategies and mechanisms. International Journal of Molecular Sciences, 19(9). doi: 10.3390/ijms19092677.Search in Google Scholar PubMed PubMed Central
[14] W. Hao, & A. Friedman. (2016). Mathematical model on Alzheimer’s disease. BMC Systems Biology, 10(1), 1–18. doi: 10.1186/s12918-016-0348-2.Search in Google Scholar PubMed PubMed Central
[15] S. E. Hill, J. Robinson, G. Matthews, & M. Muschol. (2009). Amyloid protofibrils of lysozyme nucleate and grow via oligomer fusion. Biophysical Journal, 96(9), 3781–3790. doi: 10.1016/j.bpj.2009.01.044.Search in Google Scholar PubMed PubMed Central
[16] L. S. Honig, & C. D. Boyd. (2013). Treatment of Alzheimer’s disease: Current management and experimental therapeutics. Current Translational Geriatrics and Experimental Gerontology Reports, 2(3), 174–181. doi: 10.1007/s13670-013-0056-3.Search in Google Scholar PubMed PubMed Central
[17] M. Hoshino. (2017). Fibril formation from the amyloid-β peptide is governed by a dynamic equilibrium involving association and dissociation of the monomer. Biophysical Reviews, 9(1), 9–16. doi: 10.1007/s12551-016-0217-7.Search in Google Scholar PubMed PubMed Central
[18] Y. R. Huang, & R. T. Liu. (2020). The toxicity and polymorphism of β-amyloid oligomers. International Journal of Molecular Sciences, 21(12), 1–19. doi: 10.3390/ijms21124477.Search in Google Scholar PubMed PubMed Central
[19] C. R. Jack Jr, H. J. Wiste, T. G. Lesnick, S. D. Weigand, D. S. Knopman, P. Vemuri … R. C. Petersen. (2013). Brain β-amyloid load approaches a plateau. Neurology, 80(10), 890–896. doi: 10.1212/WNL.0b013e3182840bbe.Search in Google Scholar PubMed PubMed Central
[20] T. P. J. Knowles, C. A. Waudby, G. L. Devlin, S. I. A. Cohen, A. Aguzzi, M. Vendruscolo … C. M. Dobson. (2009). An analytical solution to the kinetics of breakable filament assembly. Science, 326(5959), 1533–1537. doi: 10.1126/science.1178250.Search in Google Scholar PubMed
[21] S. Kumar, & J. Walter. (2011). Phosphorylation of amyloid beta peptides. Aging (Albany NY), 3(8), 803–812. doi: 10.18632/aging.100362.Search in Google Scholar PubMed PubMed Central
[22] C. Y. D. Lee, & G. E. Landreth. (2010). The role of microglia in amyloid clearance from the AD brain. Journal of Neural Transmission, 117(8), 949–960. doi: 10.1007/s00702-010-0433-4.Search in Google Scholar PubMed PubMed Central
[23] M. R. Lindstrom, M. B. Chavez, E. A. Gross-Sable, E. Y. Hayden, & D. B. Teplow. (2021). From reaction kinetics to dementia: A simple dimer model of Alzheimer s disease etiology. PLoS Computational Biology, 17(7), 1–24. doi: 10.1371/journal.pcbi.1009114.Search in Google Scholar PubMed PubMed Central
[24] S. Linse. (2017). Monomer-dependent secondary nucleation in amyloid formation. Biophysical Reviews, 9(4), 329–338. doi: 10.1007/s12551-017-0289-z.Search in Google Scholar PubMed PubMed Central
[25] S. Linse. (2019). Mechanism of amyloid protein aggregation and the role of inhibitors. Pure and Applied Chemistry, 91(2), 211–229. doi: 10.1515/pac-2018-1017.Search in Google Scholar
[26] A. Lomakin, D. B. Teplow, D. A. Kirschner, & G. B. Benedeki. (1997). Kinetic theory of fibrillogenesis of amyloid β-protein. Proceedings of the National Academy of Sciences of the United States of America, 94(15), 7942–7947. doi: 10.1073/pnas.94.15.7942.Search in Google Scholar PubMed PubMed Central
[27] S. López-Ortiz, J. Pinto-Fraga, P. L. Valenzuela, J. Martín-Hernández, M. M. Seisdedos, O. García-López … A. Santos-Lozano. (2021). Physical exercise and alzheimer’s disease: Effects on pathophysiological molecular pathways of the disease. International Journal of Molecular Sciences, 22(6), 1–29. doi: 10.3390/ijms22062897.Search in Google Scholar PubMed PubMed Central
[28] V. H. Man, X. He, B. Ji, S. Liu, X. Q. Xie, & J. Wang. (2019). Molecular mechanism and kinetics of amyloid-β42 aggregate formation: a simulation study. ACS Chemical Neuroscience, 10(11), 4643–4658. doi: 10.1021/acschemneuro.9b00473.Search in Google Scholar PubMed PubMed Central
[29] G. Meisl, X. Yang, E. Hellstrand, B. Frohm, J. B. Kirkegaard, S. I. Cohen … T. P. J. Knowles. (2014). Differences in nucleation behavior underlie-the contrasting aggregation kinetics of the aβ40 and aβ42. Proceedings of the National Academy of Sciences, 111(26), 9384–9389. doi: 10.1073/pnas.1401564111.Search in Google Scholar PubMed PubMed Central
[30] S. Nag, B. Sarkar, A. Bandyopadhyay, B. Sahoo, V. K. A. Sreenivasan, M. Kombrabail … S. Maiti. (2011). Nature of the amyloid-β monomer and the monomer-oligomer equilibrium. Journal of Biological Chemistry, 286(16), 13827–13833. doi: 10.1074/jbc.M110.199885.Search in Google Scholar PubMed PubMed Central
[31] M. Novo, S. Freire, & W. Al-Soufi. (2018). Critical aggregation concentration for the formation of early Amyloid-β (1-42) oligomers. Scientific Reports, 8(1), 3–10. doi: 10.1038/s41598-018-19961-3.Search in Google Scholar PubMed PubMed Central
[32] O. M. Osborne, O. Naranjo, B. L. Heckmann, D. Dykxhoorn, & M. Toborek. (2023). Anti-amyloid: An antibody to cure Alzheimer’s or an attitude. iScience, 26(8), 107461. doi: 10.1016/j.isci.2023.107461.Search in Google Scholar PubMed PubMed Central
[33] A. Salehipour, M. Bagheri, M. Sabahi, M. Dolatshahi, & D. Boche. (2022). Combination therapy in Alzheimer’s disease: Is it time?. Journal of Alzheimer's Disease, 87(4), 1433–1449. doi: 10.3233/JAD-215680.Search in Google Scholar PubMed
[34] B. Sarkar, A. K. Das, & S. Maiti. (2013). Thermodynamically stable amyloid-β monomers have much lower membrane affinity than the small oligomers. Frontiers in Physiology, 4(1–11). doi: 10.3389/fphys.2013.00084.Search in Google Scholar PubMed PubMed Central
[35] T. Scheidt, U. Łapińska, J. R. Kumita, D. R. Whiten, D. Klenerman, M. R. Wilson … P. Arosio. (2019). Secondary nucleation and elongation occur at different sites on Alzheimer’s amyloid-b aggregates. Science Advances, 5(4), 1. doi: 10.1126/sciadv.aau3112.Search in Google Scholar PubMed PubMed Central
[36] D. Schenk, G. S. Basi, & M. N. Pangalos. (2012). Treatment strategies targeting amyloid-protein. Cold Spring Harbor Perspectives in Medicine, 2, 1–33. doi: 10.1101/cshperspect.a006387.Search in Google Scholar PubMed PubMed Central
[37] J. D. Schmit, K. Ghosh, & K. Dill. (2011). What drives amyloid molecules to assemble into oligomers and fibrils?. Biophysical Journal, 100(2), 450–458. doi: 10.1016/j.bpj.2010.11.041.Search in Google Scholar PubMed PubMed Central
[38] U. Sengupta, A. N. Nilson, & R. Kayed. (2016). The role of amyloid-β oligomers in toxicity, propagation, and immunotherapy. EBioMedicine, 6(42–49. doi: 10.1016/j.ebiom.2016.03.035.Search in Google Scholar PubMed PubMed Central
[39] X. Sun, W. D. Chen, & Y. D. Wang. (2015). β-Amyloid: The key peptide in the pathogenesis of Alzheimer’s disease. Frontiers in Pharmacology, 6, 221. doi: 10.3389/fphar.2015.00221.Search in Google Scholar PubMed PubMed Central
[40] J. M. Tarasoff-Conway, R. O. Carare, R. S. Osorio, L. Glodzik, T. Butler, E. Fieremans … M. J. de Leon. (2015). Clearance systems in the brain – Implications for Alzheimer disease. Nature Reviews Neurology, 11(8), 457–470. doi: 10.1038/nrneurol.2015.119.Search in Google Scholar PubMed PubMed Central
[41] D. Thacker, M. Barghouth, M. Bless, E. Zhang, & S. Linse. (2023). Direct observation of secondary nucleation along the fibril surface of the amyloid β 42 peptide. Proceedings of the National Academy of Sciences of the United States of America, 120(25), 1–9. doi: 10.1073/pnas.2220664120.Search in Google Scholar PubMed PubMed Central
[42] W. Y. Wang, M. S. Tan, J. T. Yu, & L. Tan. (2015). Role of pro-inflammatory cytokines released from microglia in Alzheimer’s disease. Annals of Translational Medicine, 3(10), 1–15. doi: 10.3978/j.issn.2305-5839.2015.03.49.Search in Google Scholar PubMed PubMed Central
[43] K. R. Wildsmith, M. Holley, J. C. Savage, R. Skerrett, & G. E. Landreth. (2013). Evidence for impaired amyloid β clearance in Alzheimer’s disease. Alzheimer's Research &Therapy, 5(4), 1–6. doi: 10.1186/alzrt187.Search in Google Scholar PubMed PubMed Central
[44] W. Yiming, S. J. Bunce, & S. E. Radford. (2018). Thermodynamic phase diagram of amyloid β (16-22) peptide. Proceedings of the National Academy of Sciences, 116(6), 2091–2096. doi: 10.1073/pnas.1819592116.Search in Google Scholar PubMed PubMed Central
[45] Y. Zhang, H. Chen, R. Li, K. Sterling, & W. Song. (2023). Amyloid β-based therapy for Alzheimer’s disease: challenges, successes and future. Signal Transduction and Targeted Therapy, 8(1), 1–26. doi: 10.1038/s41392-023-01484-7.Search in Google Scholar PubMed PubMed Central
© 2024 the author(s), published by De Gruyter
This work is licensed under the Creative Commons Attribution 4.0 International License.
Articles in the same Issue
- Special Issue: Recent Trends in Mathematical Biology – Theory, Methods, and Applications
- Editorial for the Special Issue: Recent trends in mathematical Biology – Theory, methods, and applications
- Behavior of solutions of a discrete population model with mutualistic interaction
- Influence of media campaigns efforts to control spread of COVID-19 pandemic with vaccination: A modeling study
- Optimal control and bifurcation analysis of SEIHR model for COVID-19 with vaccination strategies and mask efficiency
- A mathematical study of the adrenocorticotropic hormone as a regulator of human gene expression in adrenal glands
- On building machine learning models for medical dataset with correlated features
- Analysis and numerical simulation of fractional-order blood alcohol model with singular and non-singular kernels
- Stability and bifurcation analysis of a nested multi-scale model for COVID-19 viral infection
- Augmenting heart disease prediction with explainable AI: A study of classification models
- Plankton interaction model: Effect of prey refuge and harvesting
- Modelling the leadership role of police in controlling COVID-19
- Robust H∞ filter-based functional observer design for descriptor systems: An application to cardiovascular system monitoring
- Regular Articles
- Mathematical modelling of COVID-19 dynamics using SVEAIQHR model
- Optimal control of susceptible mature pest concerning disease-induced pest-natural enemy system with cost-effectiveness
- Correlated dynamics of immune network and sl(3, R) symmetry algebra
- Variational multiscale stabilized FEM for cardiovascular flows in complex arterial vessels under magnetic forces
- Assessing the impact of information-induced self-protection on Zika transmission: A mathematical modeling approach
- An analysis of hybrid impulsive prey-predator-mutualist system on nonuniform time domains
- Modelling the adverse impacts of urbanization on human health
- Markov modeling on dynamic state space for genetic disorders and infectious diseases with mutations: Probabilistic framework, parameter estimation, and applications
- In silico analysis: Fulleropyrrolidine derivatives against HIV-PR mutants and SARS-CoV-2 Mpro
- Tangleoids with quantum field theories in biosystems
- Analytic solution of a fractional-order hepatitis model using Laplace Adomian decomposition method and optimal control analysis
- Effect of awareness and saturated treatment on the transmission of infectious diseases
- Development of Aβ and anti-Aβ dynamics models for Alzheimer’s disease
- Compartmental modeling approach for prediction of unreported cases of COVID-19 with awareness through effective testing program
- COVID-19 transmission dynamics in close-contacts facilities: Optimizing control strategies
- Modeling and analysis of ensemble average solvation energy and solute–solvent interfacial fluctuations
- Application of fluid dynamics in modeling the spatial spread of infectious diseases with low mortality rate: A study using MUSCL scheme