Short- and medium-term pre-analytical stability of human serum insulin-like growth factor-1
-

 ,
,
und
,
,
und

Abstract
Objectives
Insulin-like growth factor-1 (IGF-1) is a peptide hormone currently lacking data surrounding its pre-analytical stability. This study aimed to investigate the impact of delaying centrifugation and analysis at different storage temperatures on the in vitro stability of IGF-1.
Methods
The study followed the Checklist for Reporting Stability Studies (CRESS). Ten healthy, adult participants were recruited to donate 40 mL of blood each. Blood was collected into serum separator tubes. Samples were aliquoted and split into two main categories i.e., immediate centrifugation (timepoint zero) and delayed centrifugation (by 8 and 24 h). These categories were further subdivided into different storage temperatures i.e., −20 °C, 4 °C, 20–25 °C and 30 °C. All measurements were conducted in duplicate on a DiaSorin LIAISON® XL (Via Crescentino snc, Saluggia, Italy). Analysis occurred immediately after centrifugation (timepoint zero), after 8, 24, 48, 72, 168 and 672 h in the respective categories. The percentage deviation (PD) from baseline was calculated and a maximum permissible difference of ≥10.7 % (based on biological variation) was considered significant.
Results
In our study, IGF-1 was stable for at least 72 h regardless of delay in centrifugation or storage temperature. Samples that were refrigerated were stable until 168 h (PD≤5.5 %) regardless of a delay in centrifugation. Samples that were frozen at −20 °C were stable up to 672 h (PD −1.5 %).
Conclusions
IGF-1 is stable up to 72 h after sampling regardless of delay in centrifugation or storage temperature. Stability may be lengthened to 7 days by refrigerating at 4 °C.
Introduction
Insulin-like growth factor-1 (IGF-1) is a polypeptide hormone produced by the liver in response to human growth hormone (hGH) stimulation. hGH displays significant diurnal variation with a peak during non-rapid eye movement sleep and a nadir upon waking [1]. IGF-1 mediates many of the actions of hGH including cell growth, differentiation and proliferation in both children and adults [2]. The clinical utility of IGF-1 measurement includes the screening of children with suspected hGH deficiency and suspected hGH excess in both children and adults [3], [4], [5], [6], [7], [8]. Measurement of IGF-1 is preferred to measurement of hGH since IGF-1 does not display diurnal variation and sampling can occur at any time of day [7], [8], [9].
Current literature on the pre-analytical stability of IGF-1 in humans is incomplete with the effects of delayed centrifugation and storage at different temperatures not adequately investigated [10], [11], [12], [13], [14], [15]. IGF-1 may be subject to delays in separation and analysis in any centre where batched analysis occurs. Delays in centrifugation have been found to have significant impacts on the stabilities of both insulin and C-peptide which are peptide hormones with structural homology to IGF-1 [16].
Stability and pre-analytical studies have been shown to improve patient outcomes, decrease costs and increase cost-effectiveness by guiding appropriate sample rejection. Sample rejection, of any cause, often leads to recollection with ensuing patient distress and delay in definitive treatment [17], [18], [19], [20]. To this end, the European Federation of Clinical Chemistry and Laboratory Medicine’s (EFLM) Working Group for the Pre-Analytical Phase (WG-PRE) has developed a Checklist for Reporting Stability Studies (CRESS) [21]. The CRESS includes comprehensive guidelines ranging from the title of a stability study all the way to reporting findings. The WG-PRE also published specific recommendations on the design of stability studies [22]. The WG-PRE has called for more stability studies on all measurands [23].
Therefore, the aim of this study was to investigate the effects of both delays in centrifugation and storage at various temperatures on the in vitro concentration of serum IGF-1. The study was conducted over a 28-day period (672 h) and adhered strictly to the CRESS as well as the WG-PRE supplementary guidelines [21], 22].
Materials and methods
Study design and participants
This single centre stability study was conducted during the months of March and April 2024 at the National Health Laboratory Service (NHLS) laboratory at Charlotte Maxeke Johannesburg Academic Hospital (CMJAH) in South Africa.
Ethics approval
The University of the Witwatersrand’s human research Ethics Committee granted approval in accordance with the Declaration of Helsinki (clearance certificate number M230725-A-0005).
Study participants and sample type
Ten adults from the general population were recruited into the study and bled in a single day. This number of participants was chosen as per the CRESS and is in keeping with other stability studies [13], 16], 21], 22]. All consenting adults were eligible for inclusion in the study. During recruitment an attempt was made to have equal numbers of males and females. The concentration of IGF-1 is dependent on age with lower concentrations at advanced years and higher concentrations in younger adults. In an attempt to obtain a wider range of results, a previous publication on age-stratified reference intervals was used as a guide to select different age groups [25]. Exclusion criteria included those below the age of 18 or persons on exogenous substances with the potential to interfere with analysis (e.g., exogenous insulin, growth hormone or anabolic steroids). The manufacturer, however, reports minimal to no interference from a range of tested substances [24]. The concentration of IGF-1 is not affected by feeding or fasting status and thus the participants were not instructed to fast [26]. Participants completed questionnaires which included medication and exogenous substance histories which may interfere with analyses. All participants provided written informed consent prior to sampling.
IGF-1 is routinely measured in serum and thus only gel-separated serum separator tubes (SSTs) were used [24]. Each participant donated eight vials of blood into SSTs (BD Vacutainer® Cat#3135066) which came to roughly 40 mL per participant. Phlebotomy occurred using evacuated tubes and a sampling device from the same manufacturer. Samples were split into the categories as per Table 1.
Times of participant sample analysis.
| Tube # | Centrifuged | Storage temperature | 0 h | Re-analysis | |||||||
|---|---|---|---|---|---|---|---|---|---|---|---|
| 8 h | 24 h | 48 h | 72 h | 168 h | 672 h | ||||||
| Participant number | 1 | Left to clot for 30 min |
Immediately | −20 °C | Baseline analysis |
✓ | ✓ | ✓ | ✓ | ||
| 2 | 4 °C | ✓ | ✓ | ✓ | ✓ | ||||||
| 3 | 20–25 °C | ✓ | ✓ | ✓ | ✓ | ||||||
| 4 |
|
30 °C |
|
✓ |
|
✓ |
✓ |
✓ |
|||
| 5 | 8 h delay |
4 °C | ✓ | ✓ | ✓ | ✓ | ✓ | ||||
| 6 |
|
20–25 °C |
|
✓ |
✓ |
|
✓ |
✓ |
✓ |
||
| 7 | 24 h delay | 4 °C | ✓ | ✓ | ✓ | ✓ | ✓ | ||||
| 8 | 20–25 °C | ✓ | ✓ | ✓ | ✓ | ✓ | |||||
Sample collection
Table 1 and Supplementary Figure 1 display the algorithm covering sampling, centrifugation, storage, and analyses of specimens. Centrifugation was done on a LABEX centrifuge (United Scientific, Cape Town, South Africa) at 3,500 rpm for 10 min at room temperature.
Sample analysis
Baseline analysis (timepoint zero) occurred on the samples which were centrifuged immediately (after a delay of 30 min to allow blood to clot). All sampling and timepoint zero analyses occurred on a single day. Subsequent analyses were also conducted in co-ordinated runs and all runs were undertaken by the same user to minimise sources of variation. All analyses were batched and occurred on six distinct days as per the individual time periods. After analysis at timepoint zero, samples were aliquoted into cryovials (Provetta CryoGen®, 2 mL vials, LOT#11P049003) and stored at the various temperatures as depicted in Table 1. Samples stored at −20 °C and 4 °C were kept in a freezer and refrigerator respectively. Samples kept at 20–25 °C, to emulate room temperature, were stored in a cupboard subjected to temperature monitoring. Samples kept at 30 °C were stored in a warm bath with built-in monitoring. This temperature was chosen to mimic what a sample might experience in extreme situations such as in rural clinics. Temperatures were monitored with electronic thermistors which were calibrated and maintained as per their package inserts. Temperatures were documented over the 28-day period. No deviation more than 2 °C (positively or negatively) occurred in any of the categories.
All analyses occurred on a DiaSorin LIAISON® XL (Via Crescentino snc, Saluggia, Italy) which employs a heterogenous electrochemiluminescent immunometric assay. The assay employs murine monoclonal antibodies to quantitively determine the concentration of IGF-1 in human serum. Results are reported in µg/L from a limit of quantitation of 10 up to 1,500 μg/L (end of linear range). The assay is traceable to the 1st WHO International Standard for insulin-like growth factor-1 (NIBSC code: 02/254) [24].
As per the CRESS and guidelines by the WG-PRE (Gómez-Rioja et al. [22]), each sample was analysed in duplicate and the average of the two results was used for data interpretation to minimise analytical variation [21], 22]. None of the aliquots required dilution. All aliquots were left at room temperature for 20 min prior to analysis to allow frozen samples to thaw and heated samples to cool down. Aliquots were measured only once (in duplicate) and then discarded to prevent added effects of the freeze-thaw cycle.
The same reagent lot number was used for all analyses to prevent lot-to-lot variation (LIAISON® IGF-1 REF313231 LOT#214346).
Two concentrations of internal quality control (IQC) samples (supplied by DiaSorin) were run before and after each analytical run. Over the 28-day period, IQC was performed twice a day on days when analyses occurred. Please see Supplementary Figure 2 and Supplementary Table 1 for additional details on IQC performance. Performance was acceptable and demonstrated a between-run CV within desirable EFLM biological variation analytical performance specifications. The assay is enrolled in an external quality assurance program (RIQAS, UKAS Proficiency Testing) and has been performing acceptably. The laboratory where analyses were performed is ISO 15189 accredited.
Statistical analysis
Results were extracted from the instrument and compiled into a Microsoft Excel (Office 365, Microsoft Corp, Seattle, WA, USA) spreadsheet. R statistical software (RStudio version 2025.05.0 build 496) was used for all statistical analyses and generation of plots (packages included base R, outliers and ggplot) [27]. Participant characteristics were described with descriptive statistics.
As per the CRESS guidelines, the percentage deviation (PD) was used to assess if a significant change had occurred between baseline and subsequent analyses [22]. PD is calculated as follows:
PD was deemed significant when it was more than the product of biological variation and a factor which conforms to minimal analytical performance specifications i.e., multiply by 0.375 [13]. At the time of writing, the EFLM biological variation database listed the biological variation of IGF-1 as a within subject variation (CVI) of 9.4 % and a between subject variation (CVG) of 27.0 % [28].
I.e., any PD≥10.7 % was deemed significant and this cut-off was used as the maximal permissible difference (MPD). Linear regression analysis was performed to determine the instability equation:
where a is the slope of the equation. As per Gómez-Rioja et al. [22], the regression analysis equation was forced through zero [22].
The Shapiro-Wilk test was used to determine if data followed a Gaussian distribution for each category. Grubbs’ test was used to detect outliers. Normally distributed data were reported as mean with standard deviation (SD), while non-normally distributed data were reported as median with interquartile range (IQR). Additionally, the number of samples crossing the MPD per category was also counted. Absolute values with percentages were used to report categorical data. Subsequent analyses at each time interval in their respective categories were compared to the baseline analysis. Normally distributed data were subjected to the paired t-test and non-normally distributed data were subjected to the Wilcoxon signed-rank test. A p-value of <0.05 was considered statistically significant. The PD for each category was summarised as the mean or median of the group according to whether the distribution was Gaussian or not.
Results
Participants
Supplementary Table 1 summarizes the participant details. The 10 participants included five females. Ethnic distributions included one participant of South Asian, four of African, and five of European ancestry. The median age was 32 years (IQR 28–44). None of the females reported being pregnant at the time of sampling. None of the participants reported use of exogenous substances which could potentially interfere with analyses. None of the participants were excluded. The median baseline IGF-1 concentration was 178.1 μg/L (IQR 139.3–192.9).
The total number of data points obtained was 798 which included 400 samples analysed in duplicate. Only the first category yielded normally distributed data while all other categories were non-normally distributed and analysed with the appropriate statistical tests. The biggest percentage difference in duplicate analyses of a single pair was 9.6 % (213.3 vs. 192.9 μg/L). This sample had centrifugation delayed by 24 h and was stored at 20–25 °C. The mean percentage difference of duplicate pairs was 2.7 %. Two of the samples were insufficient for duplicate analysis (one sample where centrifugation was delayed for 24 h with storage at 4 °C and another sample delayed by 8 h and stored at 20–25 °C). For these two samples only the singleton value was used. Grubbs’ test did not identify any outliers and thus all 798 data points were used for statistical analysis.
Stability of IGF-1 (Table 2)
Immediate centrifugation
Stored at −20 °C (Figure 1)
None of these samples exceeded the MPD over the 28-day period. The only statistically significant p-value was at 168 h (p=0.01). This is the only category that displayed acceptable stability throughout the whole experiment.
In vitro percentage deviation of IGF-1 across various storage conditions.
| 8 h | 24 h | 48 h | 72 h | 168 h | 672 h |
|---|---|---|---|---|---|
|
|
|||||
| Immediate centrifugation | |||||
| Stored at −20 °C; instability equation: PD = −0.0008 × Time; r = −0.08 | |||||
| N/A | 0.1 (2.3); p=0.93 | N/A | −0.7 (3.6); p=0.55 | 3.7 (3.8); p=0.01 | −1.5 (3.1); p=0.16 |
|
|
|||||
| Stored at 4 °C; PD = −0.0464 × Time; r = −0.84 | |||||
| N/A | 2.1 (−1.2 to 3.2); p=0.19 | N/A | −0.4 (−6.8 to 4.2); p=0.63 | 0.8 (−10.4 to 5.1); p=0.77 | −33.1 (−42.7 to −22.5); p<0.01 |
|
|
|||||
| Stored at 20–25 °C; PD = −0.0299 × Time; r = −0.67 | |||||
| N/A | 4.3 (2.3–5.8); p<0.01 | N/A | 7.4 (4.8–7.6); p<0.01 | 12.9 (7.8–13.4); p<0.01 | −27.3 (−29.0 to −24.3); p<0.01 |
|
|
|||||
| Stored at 30 °C; PD = −0.0493 × Time; r = −0.78 | |||||
| N/A | 4.1 (3.3–6.3); p<0.01 | N/A | 9.9 (8.3–12.6); p<0.01 | 8.2 (6.4–10.9); p<0.01 | −38.3 (−40.7 to −37.2); p<0.01 |
|
|
|||||
| Centrifugation delayed by 8 h | |||||
|
|
|||||
| Stored at 4 °C; PD = −0.0401 × Time; r = −0.80 | |||||
| 4.1 (2–6.7); p=0.01 | 1.3 (0.8–1.8); p=0.19 | N/A | 0.8 (−4.5 to 4.7); p=0.85 | 3.1 (−5.7 to 8.1); p=0.77 | −28.3 (−37.0 to −21.4); p<0.01 |
|
|
|||||
| Stored at 20–25 °C; PD = −0.0307 × Time; r = −0.68 | |||||
| 5 (3.8–7.4); p<0.01 | 3.3 (2.0–5.2); p<0.01 | N/A | 7.4 (4.5–8.3); p<0.01 | 9.0 (7.2–13.5); p<0.01 | −27.5 (−33.0 to −20.0); p<0.01 |
|
|
|||||
| Centrifugation delayed by 24 h | |||||
|
|
|||||
| Stored at 4 °C; PD = −0.0272 × Time; r = −0.61 | |||||
| N/A | 6.2 (5.4–11.5); p<0.01 | 4.6 (3.3–6.1); p=0.01 | 4.6 (−0.8 to 8.5); p=0.11 | 5.5 (−0.1 to 12.2); p=0.28 | −24 (−30.1 to −9.6); p<0.01 |
|
|
|||||
| Stored at 20–25 °C; PD = −0.0312 × Time; r = −0.62 | |||||
| N/A | 6.9 (3.2–9.7); p<0.01 | 5.9 (4.4–8.1); p<0.01 | 8.4 (4.5–12.3); p<0.01 | 12.4 (11.5–16.2); p<0.01 | −30.2 (−33.6 to −23.6); p<0.01 |
-
All values are mean/median percentage deviation (%) with standard deviation/interquartile range in parentheses. The p-values are paired t-tests or Wilcoxon signed-rank tests for each category vs. baseline. The r-values are the Pearson correlation coefficients of the individual instability equations. Bolded values are those that exceed the maximal permissible difference of ±10.7 %.

In vitro percentage deviation of IGF-1 from baseline when centrifuged immediately and stored at −20 °C. (A) Raw data from individual participants (p01–p10) with mean line in black and 95 % CI shaded. (B) Instability equation with 95 % CI in shaded area. Individual dots represent subsequent results at individual time points. MPD of ±10.7 % not displayed as this was the only category that demonstrated acceptable stability until day 28.
Stored at 4 °C (Figure 2)
These samples revealed acceptable stability up to day 7 (median PD 0.8 %, p=0.77, two samples crossed the MPD negatively and one positively). The MPD was exceeded on day 28 (PD −33.1 %, p<0.01, nine samples crossed the MPD negatively). The instability equation predicts the time at which the MPD was exceeded to be 230.6 h (day 9) (95 % CI 194.3–283.4 h).
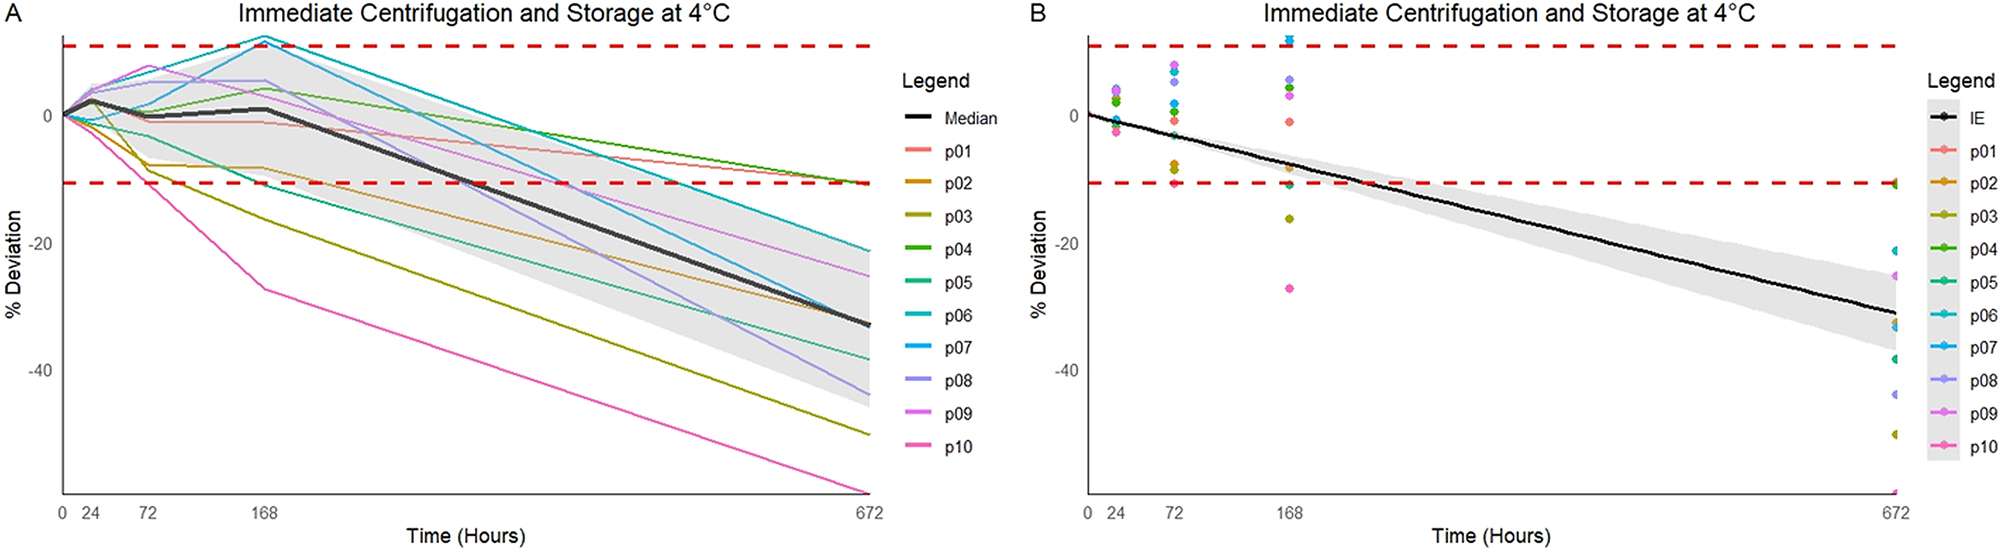
In vitro percentage deviation of IGF-1 from baseline when centrifuged immediately and stored at 4 °C. (A) Raw data from individual participants (p01–p10) with median line in black and 95 % CI shaded. (B) Instability equation with 95 % CI in shaded area. Individual dots represent subsequent results at individual time points. MPD of ±10.7 % displayed as the red dashed horizontal lines.
Stored at 20–25 °C (Figure 3)
These samples demonstrated acceptable stability up to 72 h (PD 7.4 %, p<0.01, two samples crossed the MPD positively). Notably, the concentration of IGF-1 increased and exceeded the MPD positively on day 7 (PD 12.9 %, p<0.01, seven samples crossed the MPD positively). On day 28 the median PD was −27.3 % (p<0.01, nine samples crossed the MPD negatively) and the instability equation predicts the MPD was exceeded negatively at 358.4 h (day 14) (95 % CI 275.3–513.4 h).

In vitro percentage deviation of IGF-1 from baseline when centrifuged immediately and stored at 20–25 °C. (A) Raw data from individual participants (p01–p10) with median line in black and 95 % CI shaded. (B) Instability equation with 95 % CI in shaded area. Individual dots represent subsequent results at individual time points. MPD of ±10.7 % displayed as the red dashed horizontal lines.
Stored at 30 °C (Figure 4)
These displayed acceptable stability up to day 7 (PD 8.2 %, p<0.01, one sample crossed the MPD positively). The MPD was exceeded on day 28 (PD −38.3 %, p<0.01, 10 samples crossed the MPD negatively) and the instability equation predicts the MPD was exceeded at 217.1 h (day 9) (95 % CI 180.4–272.4).

In vitro percentage deviation of IGF-1 from baseline when centrifuged immediately and stored at 30 °C. (A) Raw data from individual participants (p01–p10) with median line in black and 95 % CI shaded. (B) Instability equation with 95 % CI in shaded area. Individual dots represent subsequent results at individual time points. MPD of ±10.7 % displayed as the red dashed horizontal lines.
Centrifugation delayed by 8 h (Figure 5)
Stored at 4 °C
This category also yielded acceptable stability up to day 7 (PD 3.1 %, p=0.77, two samples crossed the MPD negatively and one positively). The MPD was exceeded on day 28 (PD −28.3 %, p<0.01, nine samples crossed the MPD negatively) and the instability equation predicts the MPD was exceeded at 267.1 h (day 11) (223.6–331.6).

In vitro percentage deviation of IGF-1 from baseline when centrifuged after 8 h and stored at 4 °C and 20–25 °C. (A) Raw data from individual participants when centrifuged after 8 h and stored at 4 °C. The median line is in black, and the 95 % CI is shaded. (B, D) Instability equation with 95 % CI in shaded area. Individual dots represent subsequent results at individual time points. (C) Raw data from individual participants when centrifuged after 8 h and stored at 20–25 °C. The median line is in black, and the 95 % CI is shaded. MPD of ±10.7 % displayed as the red dashed horizontal lines.
Stored at 20–25 °C
Stability was maintained up to day 7 (PD 9 %, p-value<0.01, four samples crossed the MPD positively). The MPD was exceeded on day 28 (PD −27.5 %, p-value<0.01, nine samples crossed the MPD negatively) and the instability equation predicts the MPD was exceeded at 348.9 h (day 14) (273.1–482.9).
Centrifugation delayed by 24 h (Figure 6)
Stored at 4 °C
This category demonstrated acceptable stability up to day 7 (PD 5.5 %, p=0.28, two samples crossed the MPD negatively and four positively) and exceeded the MPD by day 28 (PD −24 %, p<0.01, seven samples crossed the MPD negatively). The instability equation predicts that the MPD was exceeded at 393.0 h (day 16) (296.4–585.7).

In vitro percentage deviation of IGF-1 from baseline when centrifuged after 24 h and stored at 4 °C and 20–25 °C. (A) Raw data from individual participants when centrifuged after 24 h and stored at 4 °C. The median line is in black, and the 95 % CI is shaded. (B, D) Instability equation with 95 % CI in shaded area. Individual dots represent subsequent results at individual time points. (C) Raw data from individual participants when centrifuged after 24 h and stored at 20–25 °C. The median line is in black, and the 95 % CI is shaded. MPD of ±10.7 % displayed as the red dashed horizontal lines.
Stored at 20–25 °C
The final category displayed acceptable stability up to 72 h (PD 8.4 %, p<0.01, four samples crossed the MPD positively) and exceeded the MPD positively on day 7 (PD 12.4 %, p<0.01, eight samples crossed the MPD negatively). The instability equation predicts that the MPD was exceeded negatively at 343.0 h (day 14) (260.1–503.5).
Discussion
In this study we determined the short- and medium-term in vitro stability of human Insulin Like Growth Factor-1 (IGF-1) with strict adherence to the Checklist for Reporting Stability Studies (CRESS) [21].
Our results indicate that the concentration of IGF-1 in an SST is stable for the first 72 h regardless of time to centrifugation and/or storage temperature. Stability may be prolonged to 7 days when samples are stored at 4 °C, regardless of whether samples experience delayed centrifugation or not. Additionally, when samples were centrifuged after allowing to clot for 30 min and then stored at −20 °C stability was noted for at least 28 days. Except for samples that were centrifuged immediately and stored at −20 °C, all categories exceeded the MPD by day 28.
Previous studies evaluated the stability of IGF-1 in a multitude of conditions. Zhou et al. [13] followed the CRESS for 65 analytes including IGF-1 analysed on DiaSorin over a 24-hour period [13]. Similar to our study, their MPD of 10.7 % was based on EFLM biological variation. In contrast to our study, they analysed in singleton. Zhou et al. found that the concentration of serum IGF-1 rose and exceeded the MPD positively in the first 24 h which is contrary to our results of a rise in concentrations within the first 24 h but not exceeding MPD. Studies prior to the publication of the CRESS did not have the luxury of established guidelines which makes comparison difficult [14], 15]. Hartog et al. [15] encountered an initial rise in serum IGF-1 concentrations, which was not observed in EDTA plasma, on an immunometric assay (Immulite, Siemens Diagnostics, Los Angeles CA, USA) [15]. They concluded that IGF-1 was stable in serum for 72 h and up to 7 days in EDTA plasma at approximately 20 °C. Samples were collected from female participants only. Elmlinger et al. [14] added aprotinin (a protease inhibitor) to samples stored at 4 °C, 22 °C and 37 °C and measured on an Immulite. They did not investigate the effects of freezing and thawing samples. Aprotinin increased the stability in heparinised whole blood but not in serum samples. They concluded, similar to our findings, that IGF-1 is stable in serum up to 72 h regardless of storage temperature when using an MPD of 10 %. They did not explore the effects of delayed centrifugation.
An initial increase in IGF-1 concentration was observed in our study as well as all the above-mentioned studies [13], [14], [15]. Notably, all studies employed immunometric assays from two different suppliers. DiaSorin employs a homogenous murine monoclonal immunometric assay whereas Immulite uses a heterogenous murine monoclonal immunometric assay [24], 29]. The cause of this initial rise, and any possible clinical significance, remains uncertain and could be explained by multiple factors. It is possible that a compound within the matrix could be forming and cross reacting with the immunoassays.
Of note is that statistically significant changes from baseline occurred in all categories before 7 days except when samples were immediately centrifuged and stored at either −20 °C or 4 °C. Delaying centrifugation by 8 h or storing immediately centrifuged samples at more than 20 °C led to statistically significant PDs from baseline, although they did not exceed the MPD. Delays of more than 8 h may be a reality as IGF-1 is commonly batched for analysis in centralised laboratories. Our own centre often receives unspun samples around 8 h after collection. Furthermore, delaying centrifugation by 24 h led to greater PDs when compared to delays of 8 h. Although these did not exceed the chosen MPD, they do highlight how selection of an appropriate MPD is vital in identifying changes which carry clinical significance. Using PD as the sole parameter to determine acceptability may be inappropriate as it is a mean/median for all participant results. Paired statistical analysis is effective at identifying statistically significant changes which may or may not be clinically relevant. Similarly, the proportion of individual samples crossing the MPD may also be examined. This approach may be useful in identifying increased variation amongst individual samples within the larger group. For example, more than half the samples that had centrifugation delayed by 24 h and which were stored at 4 °C crossed the MPD (two negatively and four positively) by day 7. However, the median of the group was still within MPD, and the p-value indicated that there was no statistically significant change from baseline. Variability within a given group can be assessed by reviewing the 95 % CI around the mean/median PD together with the proportion of individual samples crossing the MPD. The current recommendation, as per the CRESS, is that the mean/median PD should be used for determining whether instability has been reached. However, selecting pre-analytical conditions which result in the least variability between individual samples is advisable.
The major strength of our study is the strict adherence to CRESS and supplementary guidelines. We excluded confounding variables as much as possible by analysing in duplicate, aliquoting into cryovials, maintaining the same lot numbers across consumables and performing analysis with the same user on the same days. Stability was tested over a routine 7-day period, but we also extended our study to 28 days to allow for more data and thus more robust statistical analysis. We explored the effects of different storage temperatures and time to separation which may be important factors in IGF-1 analysis. The results of our study may prove useful in the development and implementation of routine handling of IGF-1 in individual clinical laboratories.
Our study could have been further improved by expanding the variables within the stability experiment. Although our data set is robust, further analysis such as testing on days 14 or 21, testing on fasted participants, testing in plasma or on different platforms could have added to our findings. Similarly, our participants included only healthy adults, and our results may not apply to children or diseased individuals. Our participant number was only 10 and a larger group may have yielded results with greater statistical power.
Conclusions
IGF-1 is stable in vitro up to 72 h after sampling regardless of delay in centrifugation or storage temperature. We recommend analysing within 72 h whenever possible. Sample stability may be lengthened to 7 days by refrigerating at 4 °C. Our findings provide practical guidance on the pre-analytical handling of IGF-1 which should prove true in many settings. Although storage at −20 °C may provide stability up to 28 days this may not be necessary for routine laboratories.
Acknowledgments
We would like to thank the study participants for their voluntary, informed contribution to the study.
-
Research ethics: The University of the Witwatersrand’s Human Research Ethics Committee granted approval in accordance with the Declaration of Helsinki (clearance certificate number M230725−A−0005).
-
Informed consent: All participants provided written informed consent prior to sampling.
-
Author contributions: All authors have accepted responsibility for the entire content of this manuscript and approved its submission.
-
Use of Large Language Models, AI and Machine Learning Tools: ChatGPT−4o helped refine the code for the plots generated in R. No part of the manuscript was written or edited with the use of AI.
-
Conflict of interest: The authors state no conflict of interest.
-
Research funding: DiaSorin supplied half of the reagent kits. NHLS K−funding provided funding for all further consumables. Funders had no role in the design, implementation, or interpretation of the study.
-
Data availability: Not applicable.
References
1. Klerman, EB, Adler, GK, Jin, M, Maliszewski, AM, Brown, EN. A statistical model of diurnal variation in human growth hormone. Am J Physiol Endocrinol Metab 2003;285:1118–26. https://doi.org/10.1152/ajpendo.00562.2002.Suche in Google Scholar PubMed
2. Bailes, J, Soloviev, M. Insulin-like growth factor-1 (IGF-1) and its monitoring in medical diagnostic and in sports. Biomolecules 2021;11:1–15. https://doi.org/10.3390/biom11020217.Suche in Google Scholar PubMed PubMed Central
3. Clemmons, DR. Clinical utility of measurements of insulin-like growth factor 1. Nat Clin Pract Endocrinol Metabol 2006;2:436–46. https://doi.org/10.1038/ncpendmet0244.Suche in Google Scholar PubMed
4. Peacey, SR, Shalet, SM. Insulin-like growth factor 1 measurement in diagnosis and management of acromegaly. Ann Clin Biochem 2001;38:297–303. https://doi.org/10.1258/0004563011900678.Suche in Google Scholar PubMed
5. Rosenfeld, RG, Albertsson-Wikland, K, Cassorla, F, Frasier, SD, Hasegawa, Y, Hintz, RL, et al.. Diagnostic controversy: the diagnosis of childhood growth hormone deficiency revisited. J Clin Endocrinol Metab 1995;80:1532–40. https://doi.org/10.1210/jcem.80.5.7538145.Suche in Google Scholar PubMed
6. Ribeiro-Oliveira, JA, Barkan, A. The changing face of acromegaly – advances in diagnosis and treatment. Nat Rev Endocrinol 2012;8:605–11. https://doi.org/10.1038/nrendo.2012.101.Suche in Google Scholar PubMed
7. Ibba, A, Corrias, F, Guzzetti, C, Casula, L, Salerno, M, Di Iorgi, N, et al.. Igf1 for the diagnosis of growth hormone deficiency in children and adolescents: a reappraisal. Endocr Connect 2020;9:1095–102. https://doi.org/10.1530/ec-20-0347.Suche in Google Scholar
8. Akirov, A, Masri-Iraqi, H, Dotan, I, Shimon, I. The biochemical diagnosis of acromegaly. J Clin Med 2021:1–8. https://doi.org/10.3390/jcm10051147.Suche in Google Scholar PubMed PubMed Central
9. Giustina, A, Biermasz, N, Casanueva, FF, Fleseriu, M, Mortini, P, Strasburger, C, et al.. Consensus on criteria for acromegaly diagnosis and remission. Pituitary 2024, 27:7–22. https://doi.org/10.1007/s11102-023-01360-1.Suche in Google Scholar PubMed PubMed Central
10. Ito, Y, Nakachi, K, Imai, K, Hashimoto, S, Watanabe, Y, Inaba, Y, et al.. Stability of frozen serum levels. J Epidemiol 2005;15:S67–73. https://doi.org/10.2188/jea.15.s67.Suche in Google Scholar PubMed PubMed Central
11. Menne, F, Schipke, CG, Clark, C, Popp, J. Long-term stability and age-dependence of six regulatory serum proteins. Biomark Med 2022;16:511–21. https://doi.org/10.2217/bmm-2021-0518.Suche in Google Scholar PubMed
12. Oddoze, C, Lombard, E, Portugal, H. Stability study of 81 analytes in human whole blood, in serum and in plasma. Clin Biochem 2012;45:464–9. https://doi.org/10.1016/j.clinbiochem.2012.01.012.Suche in Google Scholar PubMed
13. Zhou, J, Fabros, A, Lam, SJ, Coro, A, Selvaratnam, R, Brinc, D, et al.. The stability of 65 biochemistry analytes in plasma, serum, and whole blood. Clin Chem Lab Med 2024;62:1557–69. https://doi.org/10.1515/cclm-2023-1192.Suche in Google Scholar PubMed
14. Elmlinger, MW, Zwirner, M, Kühnel, W. Stability of insulin-like growth factor (IGF)-I and IgF binding protein (IGFBP)-3 measured by the immulite ® automated chemi-luminescence assay system in different blood specimens. Clin Lab 2005;51:145–52.Suche in Google Scholar
15. Hartog, H, van der Graaf, WTA, Wesseling, J, van der Veer, E, Boezen, HM. Measurement of insulin-like growth factor-1 and insulin-like growth factor binding protein-3 after delayed separation of whole blood samples. Clin Biochem 2008;41:636–9. https://doi.org/10.1016/j.clinbiochem.2008.02.001.Suche in Google Scholar PubMed
16. Nkuna, DX, Khoza, SP, George, JA, Maphayi, MR. The stability of C-peptide and insulin in plasma and serum samples under different storage conditions. Clin Chem Lab Med 2023;61:2150–8. https://doi.org/10.1515/cclm-2023-0339.Suche in Google Scholar PubMed
17. Zaninotto, M, Graziani, MS, Plebani, M. The harmonization issue in laboratory medicine: the commitment of CCLM. Clin Chem Lab Med 2023;61:721–31. https://doi.org/10.1515/cclm-2022-1111.Suche in Google Scholar PubMed
18. Lippi, G, Simundic, A-M. The EFLM strategy for harmonization of the preanalytical phase. Clin Chem Lab Med 2018;56:1660–6. https://doi.org/10.1515/cclm-2017-0277.Suche in Google Scholar PubMed
19. Plebani, M, Scott, S, Simundic, A-M, Cornes, M, Padoan, A, Cadamuro, J, et al.. New insights in preanalytical quality. Clin Chem Lab Med 2025;63:1682–92. https://doi.org/10.1515/cclm-2025-0478.Suche in Google Scholar PubMed
20. Cao, L, Chen, M, Phipps, RA, Del Guidice, RE, Handy, BC, Wagar, EA, et al.. Causes and impact of specimen rejection in a clinical chemistry laboratory. Clin Chim Acta 2016;458:154–8. https://doi.org/10.1016/j.cca.2016.05.003.Suche in Google Scholar PubMed
21. Cornes, M, Simundic, AM, Cadamuro, J, Costelloe, SJ, Baird, G, Kristensen, GBB, et al.. The CRESS checklist for reporting stability studies: on behalf of the European Federation of Clinical Chemistry and Laboratory Medicine (EFLM) Working Group for the Preanalytical Phase (WG-PRE). Clin Chem Lab Med 2020;59:59–69. https://doi.org/10.1515/cclm-2020-0061.Suche in Google Scholar PubMed
22. Gómez-Rioja, R, Segovia Amaro, M, Diaz-Garzón, J, Bauçà, JM, Martínez Espartosa, D, Fernández-Calle, P. A protocol for testing the stability of biochemical analytes. Technical document. Clin Chem Lab Med 2019;57:1829–36. https://doi.org/10.1515/cclm-2019-0586.Suche in Google Scholar PubMed
23. Gomez-Rioja, R, Von Meyer, A, Cornes, M, Costelloe, S, Vermeersch, P, Simundic, A-M, et al.. Recommendation for the design of stability studies on clinical specimens. Clin Chem Lab Med 2023;61:1708–18. https://doi.org/10.1515/cclm-2023-0221.Suche in Google Scholar PubMed
24. DiaSorin, SPA. Insulin-Like Growth Factor-1. 2015.Suche in Google Scholar
25. Bidlingmaier, M, Friedrich, N, Emeny, RT, Spranger, J, Wolthers, OD, Roswall, J, et al.. Reference intervals for Insulin-Like Growth Factor-1 (IGF-I) from birth to senescence: results from a multicenter study using a new automated chemiluminescence IGF-I immunoassay conforming to recent international recommendations. J Clin Endocrinol Metab 2014;99:1712–21. https://doi.org/10.1210/jc.2013-3059.Suche in Google Scholar PubMed
26. Rahmani, J, Kord Varkaneh, H, Clark, C, Zand, H, Bawadi, H, Ryan, PM, et al.. The influence of fasting and energy restricting diets on IGF-1 levels in humans: a systematic review and meta-analysis. Ageing Res Rev 2019;53:100910. https://doi.org/10.1016/j.arr.2019.100910.Suche in Google Scholar PubMed
27. R Core Team. R: a language and environment for statistical computing. Vienna, Austria: R Foundation for Statistical Computing; 2025.Suche in Google Scholar
28. Aarsand, AK, Fernandez-Calle, P, Webster, C, Coskun, A, Gonzales-Lao, E, Diaz-Garzon, J, et al.. The EFLM biological variation database. [Internet]. [cited 2023 Mar 13]. Available from: https://biologicalvariation.eu/search?query=Insulin-like%20growth%20factor-1%20(IGF-1.Suche in Google Scholar
29. Immulite. 2000. Insulin-Like growth Factor-1. Germany: IMMULITE 2000; 2005.Suche in Google Scholar
Supplementary Material
This article contains supplementary material (https://doi.org/10.1515/cclm-2025-0868).
© 2025 the author(s), published by De Gruyter, Berlin/Boston
This work is licensed under the Creative Commons Attribution 4.0 International License.
Artikel in diesem Heft
- Frontmatter
- Editorial
- The European Health Data Space: challenges and opportunities for laboratory medicine
- Review
- Saliva sampling matters for salivary diagnostics of viral infections
- Opinion Papers
- Mass spectrometry based precision diagnostics: on the cusp of selective testing
- Supporting trend detection in the cumulative display of electronic laboratory reports from multiple laboratories while preserving measurement provenance
- Secondary use of external quality assessment data – estimating inter-assay variation in LOINC-coded datasets
- Methodological evaluation and clinical interpretation of hs-cTnI and hs-cTnT variations: a reappraisal
- Point of care testing of biochemical markers for monitoring astronauts during long duration missions in deep space
- EFLM Paper
- Strategy of Laboratory Medicine – EFLM Vision
- Guidelines and Recommendations
- Recommendations for the study of monoclonal gammopathies in the clinical laboratory. A consensus of the Spanish Society of Laboratory Medicine and the Spanish Society of Hematology and Hemotherapy. Part III: Clinical and analytical recommendations for the study of monoclonal gammopathies by MALDI-TOF mass spectrometry
- Genetics and Molecular Diagnostics
- Optimization and comparison of genomic DNA extraction from whole blood collected in PAXgene blood RNA tube using automated platforms
- Small-scale external quality assessment of methylated SHOX2 and RASSF1A detection in China: findings from 2023–2024
- General Clinical Chemistry and Laboratory Medicine
- Development and validation of a machine learning model for accurate detection of wrong blood in tube errors in hospitalized patients
- Short- and medium-term pre-analytical stability of human serum insulin-like growth factor-1
- Creatinine measurement from finger stick dried blood spots with a routine chemistry analyzer for estimation of GFR
- Towards a global framework of entrustable professional activities for undergraduate clinical laboratory interns: a competency-based approach
- Spot urine is a suitable matrix for measurement of copeptin
- Reference Values and Biological Variations
- Use of indirect methods and machine learning algorithms for the estimation of reference intervals, taking cortisol measurements as an example
- ReferenceRangeR: a novel tool designed to facilitate reference interval estimation and verification
- VeRUS: verification of reference intervals based on the uncertainty of sampling
- Hematology and Coagulation
- Hemolysis index. Can we uncritically trust manufacturer declarations?
- Cancer Diagnostics
- Thresholds adjustments and impact on clinical performance of three FIT assays in a colorectal cancer screening program
- A robust ddPCR assay for the absolute quantification of miR-192-5p in hepatocellular carcinoma liquid biopsies
- Pro-gastrin releasing peptide as a tumor marker of medullary thyroid carcinoma: a comparative bivariate meta-analysis
- Infectious Diseases
- Prognostic utility of serial procalcitonin measurements in ICU sepsis: a laboratory-led modelling approach in a resource-limited setting procalcitonin modelling for sepsis mortality in a low-resource ICU
- Letters to the Editor
- Biological variation of serum transthyretin concentrations
- Pitfalls of immunoassays for diagnosis of hypoglycemia of undetermined etiology
- Cross reactivity of endogenous and exogenous 25-hydroxyvitamin D2 in commercial vitamin D assays; an evaluation using the Dutch external quality assessment scheme
- Interference with immunofixation in a dabigatran-overdosed patient treated with idarucizumab: beware of a diagnostic pitfall
- Potential savings of two practical interventions on vitamin D ordering practices at a large academic medical center
- Familial erythrocytosis and phenotypic heterogeneity associated with different defects in alpha globin genes: a significant new case of Hb Wroclaw (α88(F9) Ala>Glu; HBA1: c.266C>A)
- ROTEM-guided diagnostic pathway in a centralized Laboratory Medicine setting: an organizational report