VeRUS: verification of reference intervals based on the uncertainty of sampling
-
 ,
,
 and
and

Abstract
Objectives
Laboratories are required to routinely verify reported reference intervals (RIs), but common verification methods like the CLSI-EP28-A3c binomial test are often impractical due to sample collection requirements. Indirect verification methods like equivalence limits (ELs) use routine data from patient care but lack systematic evaluation. This study aimed to develop and evaluate a novel indirect verification method: verification of reference intervals based on the uncertainty of sampling (VeRUS).
Methods
VeRUS compares the to-be-verified candidate RI to an RI estimated from local routine data. Acceptable differences are based on the sampling uncertainty intrinsic to the nonparametric method for establishing RIs with n=120 samples. The three verification methods were systematically compared with simulated test sets resembling 10 differently distributed biomarkers and a wide range of plausible candidate RIs.
Results
The binomial test is inherently unable to reject too wide RIs; e.g. the 99.8 %-interval, for which ELs and VeRUS showed high rejection rates (mean 89.2 %, SD 31.5 % and mean 95.8 %, SD 2.3 %, respectively). Moreover, the binomial test incorrectly accepts 29.3 % of “too narrow” 80%-intervals, whereas the false acceptance rates of ELs and VeRUS were lower (mean 21.7 %, SD 40.9 % and mean 7.2 %, SD 4.7 %, respectively). Overall, both indirect verification methods demonstrated increased statistical power, while ELs were least consistent among different biomarker distributions.
Conclusions
Its robust performance without the need for sample collection makes VeRUS an attractive tool for RI verification. By enabling routine verification of previously practically unverifiable RIs (e.g., in pediatrics), VeRUS may enhance clinical decision-making and improve patient care.
Introduction
Clinical decisions, including diagnosis and treatment, are frequently guided by numerical laboratory test results [1], 2]. A commonly used tool for interpreting these results is the reference interval (RI) [3], 4], which usually describes the central 95 % of values observed in a reference population consisting of apparently healthy subjects [5]. Inclusion of RIs in laboratory reports is mandated to facilitate the interpretation of biomarker measurements [6]. Currently, most laboratories provide RIs in their reports that were established externally, such as RIs taken from manufacturers’ package inserts, expert panel recommendations, guidelines, or publications [4], 7]. To ensure that the RIs used in laboratory reports describe the local population adequately, regulatory bodies require laboratories to regularly verify their RIs. However, the exact procedures to comply with these standards are not defined [6].
The Clinical Laboratory Standards Institute (CLSI) EP28-A3c guideline recommends using a binomial test for the verification of RIs [5]. Briefly, the CLSI binomial test evaluates a RI by determining the proportion of reference samples falling outside its limits. The RI is verified if this proportion is ≤10 %. If this proportion is between 10 and 20 % it is recommended to repeat the test once [5]. This binomial test can be conducted with 20–120 reference samples [5]. However, due to the substantial effort involved in sample collection, a number at the lower end of this range is usually chosen [7]. Notwithstanding its utility, the binomial test has several known limitations, primarily the practical challenges associated with collecting reference samples [8]. The collection of samples for the purpose of verifying pediatric RIs is a particularly challenging endeavor, primarily due to the ethical considerations involved [9], 10]. These challenges are amplified when verifying RIs partitioned by categories such as age and sex, which require separate sample cohorts for each category. Furthermore, and clinically important, the test is inherently unable to detect too wide RIs [5], even though too wide RIs expose patients to the risk of inadequate clinical decisions.
Alternatively, several studies suggest that RIs can be verified by comparing them to RIs estimated using indirect methods, which infer the reference distribution a posteriori from routine data, employing a variety of different approaches. These approaches include the subjective comparison of numeric reference limits [11], 12], distribution medians, or flagging rates [4], 8]. Another approach involves assessing whether the CIs of indirectly established RIs overlap with those of the candidate RI or encompass its limits [13], 14]. Since indirect methods typically use large datasets, these indirectly estimated RIs often have comparatively narrow CIs. These narrow CIs may lead to rejection of candidate RIs even when differences lack clinical significance [15]. Therefore, RI verification should be based on more objective acceptance criteria that are independent of the size of the input data set.
One such approach utilizes adapted equivalence limits (ELs) as acceptance criterion, which estimate the permissible analytical standard deviations at each reference limit. These ELs are calculated with a simple algorithm that necessitates several assumptions, including the assumption that all biomarkers are lognormally distributed [16]. This approach is integrated into multiple applications [17], 18]. However, to our knowledge, there exists no systematic comparison of the characteristics of the binomial test and ELs, which would allow an objective assessment of each method.
Here, we propose a novel approach for the verification of RIs based on indirect methods: “Verification of Reference Intervals based on the Uncertainty of Sampling”, short VeRUS. VeRUS combines the practicality of indirect methods with acceptance criteria based on the uncertainty associated with the nonparametric direct method of establishing RIs as recommended by the CLSI EP28-A3c guideline [5]. We implemented VeRUS as part of the open-source R-package refineR version 2.0.0 available on CRAN (CRAN. R-project .org/package=refineR). Guidance on how to apply the VeRUS algorithm can be found in the ‘verification’ vignette of this R-package. Additionally, we present the first systematic comparison of these RI verification methods, namely the binomial test recommended by the CLSI EP28-A3c guideline, ELs, and VeRUS, using simulated datasets from RIbench [19] to evaluate strengths and weaknesses of each approach.
Materials and methods
Description of VeRUS
The fundamental concept of VeRUS is the comparison of the candidate RI with an RI estimated from local routine data (local RI) by assessing the numerical differences between the individual reference limits. The criteria when the differences are considered acceptable are derived from the statistical sampling uncertainty of the nonparametric direct approach for establishing RIs. A schematic representation of the VeRUS methodology is shown in Figure 1.
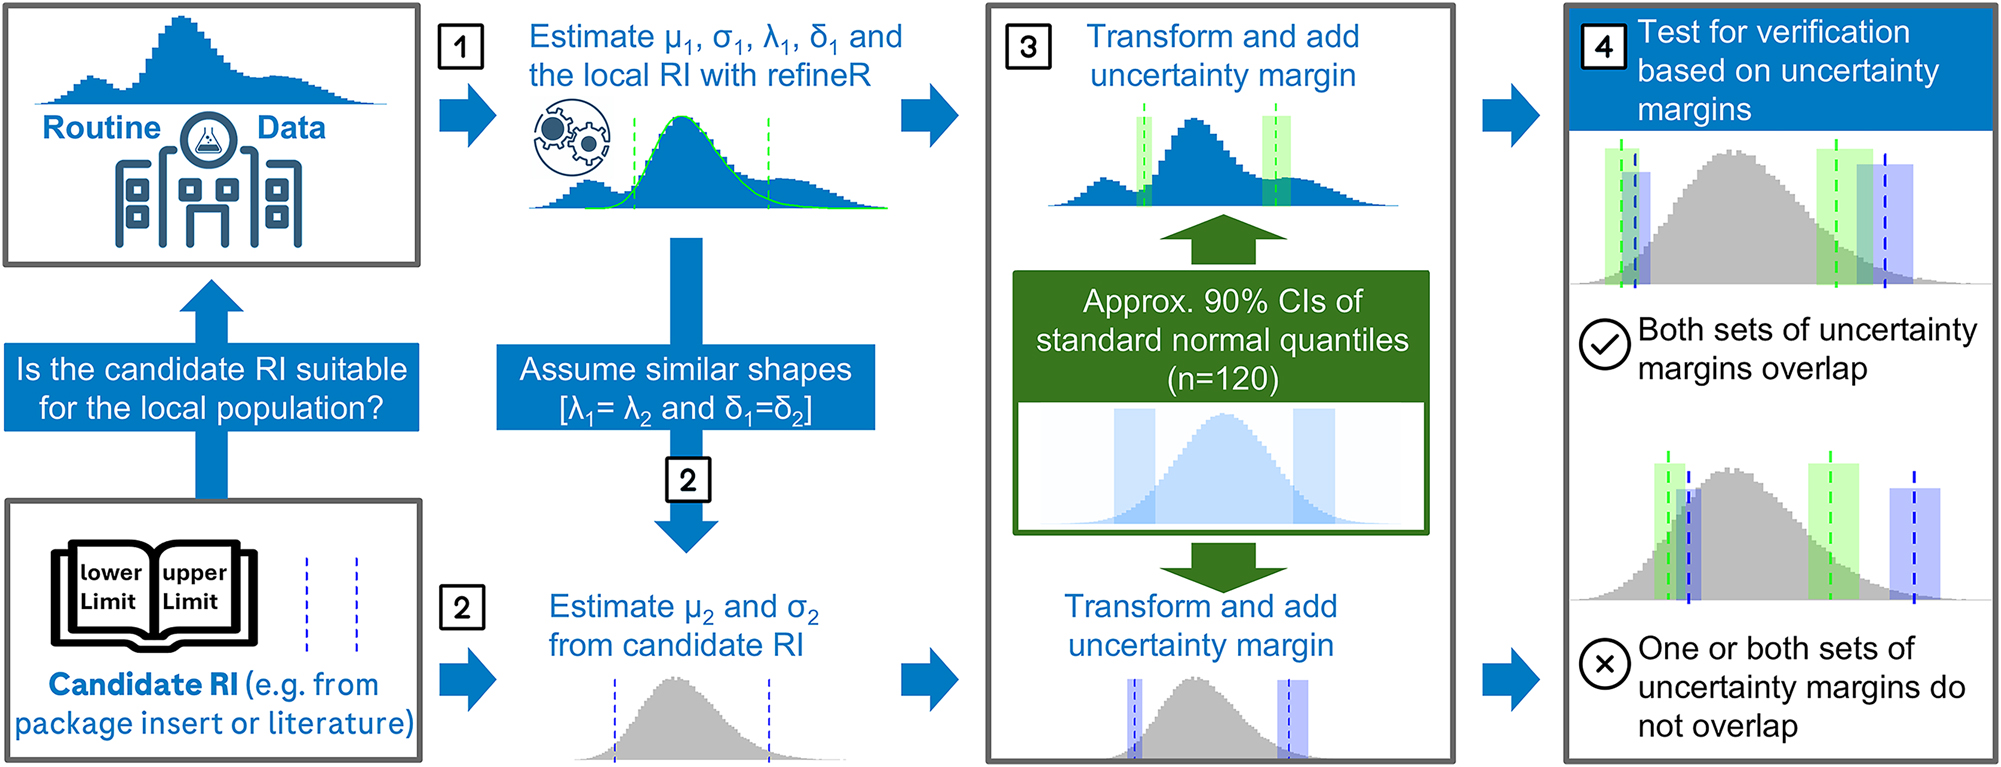
Schematic overview of VeRUS for the verification of a candidate reference interval (RI). (1) The local RI is derived after modelling the non-pathological fraction of routine data with mean (μ1), standard deviation (σ1), power (λ1), and shift (δ1) parameters. (2) Assuming similar distributional shapes (λ1=λ2 and δ1=δ2), mean (μ2) and standard deviation (σ2) of the reference distribution underlying the candidate RI are inferred from its limits. (3) Uncertainty margins (UMs) for both RIs are calculated based on the uncertainty of the nonparametric direct method (n=120). (4) Verification requires overlap of all corresponding UMs.
The first step of VeRUS is modeling the distribution of the local reference population from readily available routine data, i.e., test results obtained during patient care, using the refineR algorithm [20]. With this model, the local RI is estimated (Step 1). As VeRUS relies on accurate RI estimation, assessment of the routine data and critical evaluation of the resulting refineR model is strongly recommended [13], 20]. Subsequently, the underlying distribution of the candidate RI’s reference population is modeled. If the reference values are available, this may be done as described in [21]. In the more common case where no distributional information is available, VeRUS operates on the assumption that if two populations are comparable enough to consider RI transfer (as per CLSI EP28-A3c guidelines regarding, e.g., age, sex, geographic location [5], 8]), their underlying distribution shape is likely to also be comparable. This is implemented by transferring the shape parameters, power (λ) and shift (δ), from the local refineR model to characterize the candidate distribution. The location (μ) and scale (σ) parameters of the candidate distribution are then estimated based on the candidate’s reported upper and lower reference limits, as they are directly susceptible to inter-laboratory variation such as imprecision or bias (Step 2). With these estimated distribution parameters uncertainty margins (UMs) are calculated for each reference limit of both the local RI and the candidate RI (Step 3). Specifically, the UMs are obtained by first approximating the confidence intervals (CIs) for the percentiles defining these RIs (usually the 2.5th and 97.5th percentiles) of the standard normal distribution applying a formula published by Serfling [22]. To obtain the UMs, these CI approximations are then transformed to the appropriate scale, using the distribution parameters determined in steps 1 and 2. The resulting UMs can be interpreted as the minimal width of the CIs for reference limits, as sources of uncertainty other than those caused by random sampling, such as measurement imprecision or bias, are not taken into account [15], 22]. The candidate RI is verified if the UMs of each corresponding reference limit of the candidate RI and the local RI overlap (Step 4). A more detailed description of each step and an evaluation of the Serfling formula for approximating the CI of percentiles (Supplementary Figure 1) is provided in the Supplementary Material.
By default, VeRUS requires a two-sided candidate RI, and a set of routine data. However, some adjustments enable the comparison of one-sided RIs, two numerical RIs and the direct comparison of two indirectly estimated RIs. These adjustments and assumptions are described in the Supplementary Material.
Establishing RIs for heavily right-skewed biomarkers with limited sample sizes (e.g., 120) results in extensively large CIs of the upper reference limit [15], while the lower CI can converge towards a width of zero. This effect is a direct consequence of the skewed shape of the biomarker distribution, which is also reflected in the width of UMs. Extensively narrow UMs at the lower limit may cause acceptable candidate RIs to be rejected. To address this issue, we implemented a correction in the form of an artificial shift applied to the inverse Box–Cox transformation when calculating UMs. This asymmetry correction is only applied if the upper UM width is greater than 75 % of the RI width, i.e., in the case of extremely skewed distributions. This correction broadens the lower UM, while the upper UM width is limited to a maximum of 75 % of the RI width.
Evaluation of the verification approaches
We conducted a systematic assessment of the binomial test currently recommended by the CLSI [5], ELs [16] and VeRUS using the RIbench benchmarking suite [19], which contains simulated test sets mimicking real biomarker distributions with added pathological data. RIbench includes test sets of 10 common biomarkers: hemoglobin (Hb), calcium (Ca), free thyroxine (FT4), aspartate transaminase (AST), lactate (LACT), γ-glutamyltransferase (GGT), thyroid-stimulating hormone (TSH), immunoglobulin E (IgE), c-reactive protein (CRP), lactate dehydrogenase (LDH). The simulated test sets of each biomarker differ in total sample size, fraction of pathological samples, and the degree of overlap between pathological and non-pathological distributions [19]. We did not include CRP in our analysis as typically a clinical decision limit is defined for CRP instead of a RI.
To directly compare the extent of ELs or UMs around reference limits, we calculated those for the simulated nonpathological distributions. For UMs we used default settings corresponding to the sampling uncertainty expected for RI estimation with 120 samples and a more strict setting reflecting RI estimation with 1,000 samples as suggested for highly skewed – e.g., log-normal – distributions [23]. To evaluate the different verification approaches, a comprehensive set of candidate RIs was generated for each biomarker by combining plausible lower and upper limits derived from the lower and upper quartile of the theoretical biomarker distribution in equidistant steps. Specifically, the lower limits were located between the 0.001st and 25th percentiles and the upper limits covered the range between the 75th and 99.999th percentiles. The ground truth of the local RI was modeled as the two-sided, central 95 % interval (2.5th to 97.5th percentile) of each distribution.
The probability of verifying each of these candidate RIs with the binomial test was determined directly from the cumulative distribution function. We modeled the binomial test as described by the CLSI EP28-A3c guideline with n=20 samples and with the repetition of the test if three or four samples are outside the RI [5].
ELs and VeRUS are based on indirect methods, which may provide imperfect estimations of the distribution of the local reference population. To assess how these possibly imperfect estimations impact the verification with ELs and VeRUS, we applied refineR to simulated test sets from RIbench. The test sets were restricted to those with up to 20 % pathological samples to emulate realistic scenarios resulting in 288 unique test sets per biomarker. Each plausible candidate RI was compared to all RIs estimated from the simulated test sets by ELs and VeRUS. The fraction of test sets for which each candidate RI was verified was determined for both methods as a proxy for the probability of verifying the candidate RI. Using refineR, a reference distribution was modeled from each test set. The default one-parameter (λ) Box–Cox transformation was used for all biomarkers except LDH, which requires a two-parameter (λ, δ) transformation to adequately capture its distribution [19]. These estimated distribution parameters were subsequently used in the VeRUS verification process. ELs were essentially calculated as described by Haeckel et al. [16], except that we used full-precision standard normal quantiles rather than the rounded values reported in the original publication. The candidate RI was considered verified if the ELs of the corresponding limits of both RIs overlap as Haeckel et al. described [24].
The same analysis was conducted with candidate RIs derived at equidistant steps on the linear concentration scale instead of the percentile scale (Supplementary Figures 2, 3), and with the assumption of perfect model estimation of refineR (Supplementary Figures 4–7).
Results
Comparing the extent of ELs or UMs around reference limits shows that ELs and the UMs of VeRUS at default settings are essentially identical for normally distributed biomarkers (Table 1). For skewed distributions, ELs aligned more closely with VeRUS UMs computed with n=1,000 at the upper limit, whereas at the lower limit ELs were closer to VeRUS UMs at default settings. Overall, VeRUS at default settings was the most permissible method, followed by ELs, and VeRUS with n=1,000 resulted in the smallest margins around the reference limits.
Uncertainty margins (UMs) and equivalence limits (ELs) for simulated reference limits. Point estimates of the reference limits (2.5th and 97.5th percentiles) were derived from biomarker distributions from RIbench. UMs were calculated using both default (n=120, 90 % CI) and stricter (n=1,000, 95 % CI) parameters. For each reference limit, the columns ‘Lower lim.’ and ‘Upper lim.’ show the lower and upper bounds of the respective UM or EL.
| Biomarker (distribution type) | Method | Lower reference limit | Upper reference limit | ||||
|---|---|---|---|---|---|---|---|
| Lower lim. | Point estimate | Upper lim. | Lower lim. | Point estimate | Upper lim. | ||
| Hb (normal) | Equivalence limits | 11.6 | 12.0 | 12.4 | 15.5 | 16.0 | 16.5 |
| VeRUS (default) | 11.7 | 12.0 | 12.4 | 15.5 | 16.0 | 16.5 | |
| VeRUS (n=1,000, 95 % CIs) | 11.9 | 12.0 | 12.1 | 15.8 | 16.0 | 16.2 | |
| Ca (normal) | Equivalence limits | 2.10 | 2.15 | 2.20 | 2.44 | 2.50 | 2.56 |
| VeRUS (default) | 2.12 | 2.15 | 2.18 | 2.46 | 2.50 | 2.54 | |
| VeRUS (n=1,000, 95 % CIs) | 2.14 | 2.15 | 2.16 | 2.48 | 2.50 | 2.52 | |
| FT4 (normal) | Equivalence limits | 11.4 | 12.0 | 12.6 | 21.0 | 22.0 | 23.0 |
| VeRUS (default) | 11.3 | 12.0 | 12.8 | 20.7 | 22.0 | 23.4 | |
| VeRUS (n=1,000, 95 % CIs) | 11.7 | 12.0 | 12.3 | 21.4 | 22.0 | 22.6 | |
| AST (skewed) | Equivalence limits | 13.0 | 14.0 | 15.0 | 33.0 | 35.0 | 37.0 |
| VeRUS (default) | 12.7 | 14.0 | 15.4 | 31.9 | 35.0 | 38.4 | |
| VeRUS (n=1,000, 95 % CIs) | 13.5 | 14.0 | 14.6 | 33.7 | 35.0 | 36.4 | |
| LACT (skewed) | Equivalence limits | 0.451 | 0.50 | 0.549 | 2.04 | 2.20 | 2.36 |
| VeRUS (default) | 0.430 | 0.50 | 0.582 | 1.89 | 2.20 | 2.56 | |
| VeRUS (n=1,000, 95 % CIs) | 0.470 | 0.50 | 0.532 | 2.07 | 2.20 | 2.34 | |
| GGT (skewed) | Equivalence limits | 8.96 | 10.0 | 11.0 | 46.3 | 50.0 | 53.7 |
| VeRUS (default) | 8.48 | 10.0 | 11.8 | 42.4 | 50.0 | 59.0 | |
| VeRUS (n=1,000, 95 % CIs) | 9.34 | 10.0 | 10.7 | 46.7 | 50.0 | 53.5 | |
| TSH (heavily skewed) | Equivalence limits | 0.204 | 0.250 | 0.296 | 3.61 | 4.00 | 4.39 |
| VeRUS (default) | 0.188 | 0.250 | 0.332 | 3.01 | 4.00 | 5.31 | |
| VeRUS (n=1,000, 95 % CIs) | 0.222 | 0.250 | 0.281 | 3.56 | 4.00 | 4.50 | |
| IgE (heavily skewed) | Equivalence limits | 0.893 | 1.50 | 2.11 | 99.1 | 114 | 129 |
| VeRUS (default) | 0.963 | 1.50 | 2.34 | 73.2 | 114 | 178 | |
| VeRUS (n=1,000, 95 % CIs) | 1.25 | 1.50 | 1.80 | 94.9 | 114 | 137 | |
| LDH (skewed and shifted) | Equivalence limits | 129 | 135 | 141 | 205 | 214 | 223 |
| VeRUS (default) | 129 | 135 | 142 | 204 | 214 | 224 | |
| VeRUS (n=1,000, 95 % CIs) | 132 | 135 | 138 | 210 | 214 | 218 | |
In our systematic assessment of the three verification methods, we compared the fraction of test cases verified by each approach for a wide range of plausible, to-be-verified candidate RIs using graphical representations (Figures 2 and 3; Supplementary Figures 2–7). On the universal percentile scale, the CLSI binomial test results in the same pattern across all assessed biomarkers (Figures 2 and 3; Supplementary Figures 4, 5).

Comparison of RI verification methods: CLSI binomial test, equivalence limits (EL), and VeRUS. Each point represents a candidate RI consisting of a lower (Y-axis) and upper (X-axis) limit. Axes are scaled linearly to the percentile values of the simulated distribution. Colors indicate the probability of RI verification (binomial test) or the fraction of verified RIs estimated from simulated test sets (ELs, VeRUS). Red lines mark the ‘true’ reference limits.

Comparison of RI verification methods: CLSI binomial test, equivalence limits (EL), and VeRUS. Each point represents a candidate RI consisting of a lower (Y-axis) and upper (X-axis) limit. Axes are scaled linearly to the percentile values of the simulated distribution. Colors indicate the probability of RI verification (binomial test) or the fraction of verified RIs estimated from simulated test sets (ELs, VeRUS). Red lines mark the ‘true’ reference limits.
Similar to the CLSI binomial test, the plots generated with VeRUS are comparable for all biomarkers (Figures 2 and 3; Supplementary Figures 2–7). Slightly different shapes of the acceptance areas can be observed at TSH and IgE, biomarkers categorized as heavily skewed (Figure 3; Supplementary Figures 3, 5, 7). ELs were considerably less consistent in verifying candidate RIs of different biomarkers than the other two methods. This is evident as the highest degree of variation in the sizes of acceptance regions, ranging from the smallest for TSH to the largest for Ca, is observed for ELs. The transition from highest to lowest probability of verifying the candidate RI was most gradual for the binomial test, whereas it was relatively sharp for ELs and VeRUS. The most gradual transitions for ELs and VeRUS occurred with skewed biomarkers, e.g., GGT, TSH, IgE.
Verification rates for candidate RIs representing ‘too narrow’ (central 80 %), “correct/true” (central 95 %), and ‘too wide’ (central 99.8 %) intervals are presented in Table 2. All three methods verified the ‘correct/true’ candidate RIs consistently at high rates. The CLSI binomial test is designed to accept RIs which encompass 95 % of a distribution (“correct/true” RIs) with 99.2 % probability [5], while ELs and VeRUS depend on the accuracy of parameter estimation with refineR. Despite this dependency, ELs verified true RIs in 85.4–100 % of cases (mean 94.3 %, SD 6.0 %), and VeRUS achieved verification rates between 96.2 and 100 % (mean 98.2 %, SD 1.2 %).
Fraction of test cases in which a candidate RI is verified. Lower percentages are better for categories “too wide” and “too narrow”, higher values are better for category “correct/true”.
| Biomarker | Candidate RI [Percentiles] | Category | Percentage of verified test cases | ||
|---|---|---|---|---|---|
| Binomial test | ELs | VeRUS | |||
| AST | [10.0, 90.0] | Too narrow | 29.3 | 0.35 | 7.29 |
| [2.5, 97.5] | Correct/true | 99.2 | 96.2 | 97.6 | |
| [0.10, 99.9] | Too wide | 100 | 0.00 | 6.60 | |
| Ca | [10.0, 90.0] | Too narrow | 29.3 | 99.7 | 8.68 |
| [2.5, 97.5] | Correct/true | 99.2 | 99.7 | 99.0 | |
| [0.10, 99.9] | Too wide | 100 | 94.8 | 5.21 | |
| FT4 | [10.0, 90.0] | Too narrow | 29.3 | 0.69 | 5.21 |
| [2.5, 97.5] | Correct/true | 99.2 | 100 | 100 | |
| [0.10, 99.9] | Too wide | 100 | 0.00 | 2.78 | |
| GGT | [10.0, 90.0] | Too narrow | 29.3 | 0.00 | 3.12 |
| [2.5, 97.5] | Correct/true | 99.2 | 88.9 | 96.2 | |
| [0.10, 99.9] | Too wide | 100 | 0.00 | 5.21 | |
| Hb | [10.0, 90.0] | Too narrow | 29.3 | 87.5 | 8.68 |
| [2.5, 97.5] | Correct/true | 99.2 | 100 | 99.0 | |
| [0.10, 99.9] | Too wide | 100 | 1.74 | 6.60 | |
| IgE | [10.0, 90.0] | Too narrow | 29.3 | 0.00 | 18.4 |
| [2.5, 97.5] | Correct/true | 99.2 | 86.5 | 99.3 | |
| [0.10, 99.9] | Too wide | 100 | 0.00 | 0.00 | |
| LACT | [10.0, 90.0] | Too narrow | 29.3 | 0.00 | 5.56 |
| [2.5, 97.5] | Correct/true | 99.2 | 93.1 | 96.9 | |
| [0.10, 99.9] | Too wide | 100 | 0.00 | 5.90 | |
| LDH | [10.0, 90.0] | Too narrow | 29.3 | 7.29 | 4.51 |
| [2.5, 97.5] | Correct/true | 99.2 | 98.6 | 99.0 | |
| [0.10, 99.9] | Too wide | 100 | 0.35 | 2.08 | |
| TSH | [10.0, 90.0] | Too narrow | 29.3 | 0.00 | 3.12 |
| [2.5, 97.5] | Correct/true | 99.2 | 85.4 | 97.2 | |
| [0.10, 99.9] | Too wide | 100 | 0.00 | 3.82 | |
The CLSI binomial test incorrectly verifies the 80 % “too narrow” candidate RI in 29.3 % of cases. Using IgE as an example, this indicates a 29.3 % probability of accepting a candidate RI of [5.2 × 10³, 80.5 × 10³ IU/L] when the true RI is [1.5 × 10³, 114.0 × 10³ IU/L]. ELs verify these “too narrow” candidate RIs generally at lower rates between 0.0 and 99.7 % of cases (mean 21.7 %, SD 40.9 %). However, ELs hardly rejected the “too narrow” intervals for Ca and Hb with verification rates of 99.7 and 87.5 %, respectively. For the other biomarkers, the “too narrow” RI was verified between 0.00 and 0.4 %. In comparison, VeRUS verified the “too narrow” candidate RIs more consistently at low rates between 3.1 and 18.4 % (mean 7.2 %; SD 4.7 %).
The 99.8 %, “too wide” RI was falsely verified by the CLSI binomial test with a probability of 100 %. Unlike the binomial test, ELs and VeRUS are designed to reject too wide RIs. The successful rejection of candidate RIs with low lower limits and high upper limits can be observed in most biomarkers (Figures 2 and 3). Indeed, the “too wide” candidate RIs were verified at lower rates by ELs between 0.0 and 94.8 % (mean 10.8, SD 31.5 %), and by VeRUS between 0.0 and 6.6 % (mean 4.2, SD 2.3 %).
Discussion
We have developed a novel method for the “Verification of Reference Intervals based on the Uncertainty of Sampling”, short VeRUS. Our systematic comparison of VeRUS to the current de facto standard, the CLSI binomial test [5], and to ELs [16] demonstrates that VeRUS is a robust and consistent method for the verification of RIs.
Our results (Figures 2 and 3; Supplementary Figures 2–7) show that VeRUS and the binomial test verify fairly consistent ranges of candidate RIs on percentile scale, whereas ELs yield varying outcomes depending on the specific biomarker distribution. This difference likely arises because ELs assume log-normal distributions [16], while VeRUS utilizes estimated distribution parameters provided by refineR which better reflect the biomarker specific distribution.
Deviations from the generally consistently shaped acceptance ranges are observed when verifying the highly skewed biomarkers TSH and IgE (Figures 2 and 3; Supplementary Figures 2–7) with VeRUS. These deviations are a direct consequence of the integrated asymmetry correction. The asymmetry correction is a crucial feature, as perfectly consistent acceptance areas on highly skewed biomarkers translate into unrealistically narrow UMs of the lower reference limits, thereby reducing practical utility. Therefore, the asymmetry correction ensures more applicable UMs in these scenarios. Additionally, VeRUS generally verified the “correct/true” RI at higher rates than ELs (Table 2).
VeRUS and ELs both overcome the main disadvantages of the binomial test. Neither requires the collection of dedicated reference samples when combined with indirect methods like refineR and both are capable of rejecting inappropriately wide candidate RIs [5], 8]. Furthermore, the binomial test with n=20 has a particularly gradual transition from high rates of verification to effectively 100 % rejection. This indicates a high probability of accepting RIs as verified that almost certainly should not be considered equivalent. However, by increasing the sample size the transition gets substantially less gradual (Supplementary Figure 10). In comparison, the gradual transitions observed in ELs and VeRUS caused by imperfect model estimation were minor. If the refineR model would always correspond to the ground truth, i.e., eliminating errors occurring in the estimation step, it would result in perfectly sharp transitions (Supplementary Figures 4–7).
However, there is no universally accepted definition to what degree RIs are allowed to differ to be considered equivalent. Like any statistical test, the verification process is ultimately a compromise between acceptable false positive and false negative rates. As RIs are guiding clinical decisions, the ideal verification method would maximize the rejection of RIs supporting adverse decisions with respect to clinical outcome and accept RIs that, while differing from the theoretical optimum, maintain clinical utility. These considerations require biomarker-specific rules depending on the clinical significance of each biomarker, which is beyond the scope of this paper.
In contrast, the methods for RI verification compared in this study apply generic rules for acceptance independent of the biomarker to be evaluated. The CLSI binomial test is defined purely statistically. ELs are derived from the concept of permissible imprecision [16], while VeRUS relies on UMs that are based on the uncertainty of sampling generally accepted for establishing RIs with the nonparametric direct approach [5].
As UMs are conceptually derived from CIs, it should be noted that while non-overlapping CIs indicate a statistically significant difference, overlapping CIs do not imply equivalence with the same strength as a formal hypothesis test. Achieving this level of significance may require that the UM for each reference limit includes the point estimate of the corresponding reference limit [25]. This more stringent acceptance criterion results in a much narrower range of verified candidate RIs compared to the CLSI binomial test (Supplementary Figures 8, 9). Conversely, the acceptance criterion of overlapping UMs yields a similar range of verified upper and lower limits as the CLSI binomial test, while also rejecting RIs that are too wide (Figure 2; Supplementary Figures 2, 4, 6). These findings suggest that VeRUS, at its default settings, serves as a reasonable tool for verifying RIs.
In the common case that only the limits of the candidate RI are available but no additional distributional information, VeRUS assumes a shared distributional shape (λ and δ) of the candidate and local reference distributions. It is advisable to assess whether this modeling choice is appropriate within the respective context. The underlying premise is that a biomarker’s fundamental distribution shape is likely primarily governed by physiological factors, which should be conserved between the comparable populations required for RI transfer [5]. In contrast, inter-laboratory variations in analytical methods and preanalytical processes, e.g., specimen collection, transportation, and handling, manifest more directly as changes in µ and σ. Thus, this data-driven approach of inferring the shape from the local data may be more plausible than the common practice of assuming a Gaussian or log-normal distribution for all biomarkers when no additional information is available [16], 17], 23].
The universal acceptance criteria compared in this study might not be the perfect choice for every biomarker. For example, the defaults of VeRUS are based on the approximation of the 90 % CIs of the nonparametric method of establishing RIs, using 120 samples. However, this sample size is recognized as potentially inadequate for establishing RIs for highly skewed – e.g., log-normal – distributions, often yielding excessively wide upper CIs [5], 15]. This inherent distributional property is also mirrored by VeRUS that directly applies the n=120 nonparametric uncertainty via UMs resulting in the aforementioned impractically narrow UMs around the lower reference limit and extensively wide UMs around the upper limits (Supplementary Figures 3, 7). Hence, the default n=120 assumption itself might be suboptimal for verifying certain highly skewed biomarkers depending on clinical considerations, although VeRUS’s asymmetry correction mitigates the most extreme effects. Recognizing the issue of excessively wide upper CIs in the context of RI establishment, larger sample sizes are recommended for biomarkers with skewed distributions [5], 15]. Importantly, VeRUS is a flexible approach allowing users to adjust the parameters used for UM calculation including the underlying sample size or the width of the approximated CIs (see Table 1). This flexibility of VeRUS allows for adaptation of the verification stringency to better suit specific biomarker characteristics or differing levels of required clinical certainty.
Building upon its flexibility, VeRUS can be extended to quantify the similarity between two RIs. The UMs are defined as the approximate CIs of the population quantiles for a given sample size. Consequently, larger sample sizes lead to smaller UMs and vice versa. The degree of similarity between the two RIs can be quantified by the maximum sample size for which all corresponding UMs of the two RIs overlap.
Limitations
Although VeRUS and ELs can be applied with RIs, determined directly or indirectly, they serve only as a practical alternative to the binomial test when used in conjunction with indirect methods. Consequently, the practicality of VeRUS and ELs depends on the accurate estimation of distribution parameters, which is fundamentally linked to the quality of the input data [13], 20]. In our analysis we used test sets from RIbench to simulate a wide range of real-world scenarios. However, simulated data sets can never account for all possible scenarios. For example, the non-pathological distributions are modeled as Box–Cox transformed normal distributions, which may not accurately represent all biomarkers [19].
Additionally, in practice it is often ambiguous whether the distribution of a biomarker is most accurately represented by a model of a one or two-parameter Box–Cox transformed normal distribution, which may add uncertainty to the estimation of model parameters. Furthermore, we restricted the RIbench test sets to those including a maximum fraction of 20 % pathological data and a minimum of 1,000 samples. This level of quality and quantity of input data may not be achievable in all real-world scenarios. Nevertheless, we believe a sufficient amount of data can be realistically acquired in most situations where the binomial test is currently applied. In most cases, the appropriate quality of data can be ensured, and an appropriate model can be selected by following the practical suggestions proposed by Ammer et al. [13]. While our simulations may not encompass all real-world complexities, they provide valuable comparative insights into the characteristics of VeRUS, the CLSI binomial test, and ELs, which is only possible with a simulation-based evaluation.
Conclusions
In this study, we introduced VeRUS, a novel method for verifying RIs, and compared it to the CLSI binomial test and ELs. Since VeRUS and ELs make use of already available routine data, they are substantially less resource intensive than the binomial test. As no collection of reference samples is required, these methods enable the verification of RIs in scenarios where RI verification is often restricted, such as in resource-limited settings, for highly partitioned RIs or in pediatrics. Our analysis revealed that VeRUS exhibited robust statistical properties while verifying fairly consistent ranges of candidate RIs. Removing the need for sample collection, its consistency and flexibility make VeRUS a valuable tool for regular RI verification.
Funding source: Roche Diagnostics
-
Research ethics: Not applicable.
-
Informed consent: Not applicable.
-
Author contributions: All authors have accepted responsibility for the entire content of this manuscript and approved its submission. Matthias Beck: Formal analysis, Methodology, Software, Visualization, Writing – original draft, Writing – review & editing. Florian Dufey: Methodology, Writing – review & editing. Tatjana Ammer: Writing – review & editing, Validation. André Schützenmeister: Funding acquisition, Resources, Supervision, Writing – review & editing. Manfred Rauh: Conceptualization, Supervision, Writing – review & editing. Jakob Zierk: Conceptualization, Supervision, Writing – review & editing. Christopher M Rank: Conceptualization, Methodology, Software, Supervision, Visualization, Writing – original draft, Writing – review & editing. The present work was performed in partial fulfillment of the requirements for obtaining the degree “Dr. rer. biol. hum.”
-
Use of Large Language Models, AI and Machine Learning Tools: The authors utilized GPT-4o, Gemini 2.5, and DeepL (free) for language enhancement. Additionally, GPT-4o, Claude 3.5, and Claude 3.7 were used for coding assistance.
-
Conflict of interest: M Beck, F Dufey, T Ammer, A Schuetzenmeister and CM Rank are employees of Roche Diagnostics GmbH. F Dufey, T Ammer, CM Rank hold stocks/shares in F. Hoffmann-La-Roche Ltd. M Rauh received honoria from Roche Diagnostics GmbH. J Zierk does not declare any competing interest.
-
Research funding: Funding was provided by: Roche Diagnostics GmbH, Nonnenwald 2, 82377 Penzberg/Germany.
-
Data availability: Not applicable.
-
Software availability: The VeRUS algorithm will be published under GPLv3 license at the same time as the publication of the manuscript.
References
1. Ceriotti, F, Henny, J. Are my laboratory results normal? Considerations to be made concerning reference intervals and decision limits. EJIFCC 2008;19:106–14.Search in Google Scholar
2. Doyle, K, Bunch, DR. Reference intervals: past, present, future. Crit Rev Clin Lab Sci 2023;60:466–82. https://doi.org/10.1080/10408363.2023.2196746.Search in Google Scholar PubMed
3. Jones, G, Barker, A. Reference intervals. Clin Biochem Rev 2008;29:S93–7.Search in Google Scholar
4. Tate, JR, Tina, Y, Jones, GR. Transference and validation of reference intervals. Clin Chem 2015;61:1012–5. https://doi.org/10.1373/clinchem.2015.243055.Search in Google Scholar PubMed
5. Clinical and Laboratory Standards Institute. Defining, establishing, and verifying reference intervals in the clinical laboratory; approved guideline, 3rd ed. Wayne: Clinical and Laboratory Standards Institute; 2008. EP28-A3c.Search in Google Scholar
6. DIN-Normenausschuss Gesundheitstechnologien. Medizinische Laboratorien – anforderungen an die Qualität und Kompetenz (ISO 15189:2022); Deutsche Fassung EN ISO 15189:2022 + A11:2023. Berlin: DIN; 2024.Search in Google Scholar
7. Ceriotti, F, Hinzmann, R, Panteghini, M. Reference intervals: the way forward. Ann Clin Biochem 2009;46:8–17. https://doi.org/10.1258/acb.2008.008170.Search in Google Scholar PubMed
8. Ozarda, Y, Higgins, V, Adeli, K. Verification of reference intervals in routine clinical laboratories: practical challenges and recommendations. Clin Chem Lab Med 2018;57:30–7. https://doi.org/10.1515/cclm-2018-0059.Search in Google Scholar PubMed
9. Ceriotti, F. Establishing pediatric reference intervals: a challenging task. Clin Chem 2012;58:808–10. https://doi.org/10.1373/clinchem.2012.183483.Search in Google Scholar PubMed
10. Shaw, JLV, Marvasti, BT, Colantonio, D, Adeli, K. Pediatric reference intervals: challenges and recent initiatives. Crit Rev Clin Lab Sci 2013;50:37–50. https://doi.org/10.3109/10408363.2013.786673.Search in Google Scholar PubMed
11. Laugesen, K, Winther-Larsen, A. Paediatric reference intervals for haematology parameters analysed on Sysmex XN-9000: a comparison of methods in the framework of indirect sampling. Clin Chem Lab Med 2025;63:812–20. https://doi.org/10.1515/cclm-2024-1179.Search in Google Scholar PubMed
12. Doyle, K, Frank, EL. Verifying clinically derived reference intervals for daily excretion rates of fractionated metanephrines using modern indirect reference interval models. Am J Clin Pathol 2021;156:691–9. https://doi.org/10.1093/ajcp/aqab006.Search in Google Scholar PubMed
13. Ammer, T, Schützenmeister, A, Rank, CM, Doyle, K. Estimation of reference intervals from routine data using the refineR algorithm – a practical guide. J Appl Lab Med 2023;8:84–91. https://doi.org/10.1093/jalm/jfac101.Search in Google Scholar PubMed
14. Ceriotti, F, Vidali, M. Reference interval harmonization: will big data provide a solution? Clin Chem 2023;69:945–7. https://doi.org/10.1093/clinchem/hvad098.Search in Google Scholar PubMed
15. Haeckel, R, Wosniok, W, Streichert, T. Members of the Section Guide Limits of the DGKL. Review of potentials and limitations of indirect approaches for estimating reference limits/intervals of quantitative procedures in laboratory medicine. J Lab Med 2021;45:35–53. https://doi.org/10.1515/labmed-2020-0131.Search in Google Scholar
16. Haeckel, R, Wosniok, W, Arzideh, F. Equivalence limits of reference intervals for partitioning of population data. Relevant differences of reference limits. LaboratoriumsMedizin 2016;40:199–205. https://doi.org/10.1515/labmed-2016-0002.Search in Google Scholar
17. Hoffmann, G, Klawitter, S, Trulson, I, Adler, J, Holdenrieder, S, Klawonn, F. A novel tool for the rapid and transparent verification of reference intervals in clinical laboratories. J Clin Med 2024;13:4397. https://doi.org/10.3390/jcm13154397.Search in Google Scholar PubMed PubMed Central
18. Petersmann, A. rifindR [Online]. https://kc.uol.de/rifindr/ [Accessed 1 Sept 2025].Search in Google Scholar
19. Ammer, T, Schützenmeister, A, Prokosch, HU, Zierk, J, Rank, CM, Rauh, M. RIbench: a proposed benchmark for the standardized evaluation of indirect methods for reference interval estimation. Clin Chem 2022;68:1410–24. https://doi.org/10.1093/clinchem/hvac142.Search in Google Scholar PubMed
20. Ammer, T, Schützenmeister, A, Prokosch, HU, Zierk, J, Rank, CM, Rauh, M. refineR: a novel algorithm for reference interval estimation from real-world data. Sci Rep 2021;11:16023. https://doi.org/10.1038/s41598-021-95301-2.Search in Google Scholar PubMed PubMed Central
21. Hawkins, DM, Esquivel, RN. A quantile–quantile toolbox for reference intervals. J Appl Lab Med 2024;9:357–70. https://doi.org/10.1093/jalm/jfad109.Search in Google Scholar PubMed
22. Serfling, RJ. Confidence intervals of quantiles. In: Bloomfield, P, Cressie, NA, Fisher, NI, Johnstone, IM, Kadane, JB, Ryan, LM, et al.., editors. Approximation theorems of mathematical statistics. New York: John Wiley & Sons; 2002:102–7 pp.Search in Google Scholar
23. Haeckel, R, Wosniok, W, Arzideh, F, Zierk, J, Gurr, E, Streichert, T. Critical comments to a recent EFLM recommendation for the review of reference intervals. Clin Chem Lab Med 2017;55:341–7. https://doi.org/10.1515/cclm-2016-1112.Search in Google Scholar PubMed
24. Haeckel, R, Ammer, T, Wosniok, W, Krebs, A, Torge, A, Özcürümez, M, et al.. Age-and sex-specific reference intervals of total cholesterol, LDL cholesterol, HDL cholesterol and non-HDL cholesterol. Comparison of two algorithms for the indirect estimation of reference intervals. J Lab Med 2023;47:55–62. https://doi.org/10.1515/labmed-2022-0147.Search in Google Scholar
25. Greenland, S, Senn, SJ, Rothman, KJ, Carlin, JB, Poole, C, Goodman, SN, et al.. Statistical tests, P values, confidence intervals, and power: a guide to misinterpretations. Eur J Epidemiol 2016;31:337–50. https://doi.org/10.1007/s10654-016-0149-3.Search in Google Scholar PubMed PubMed Central
Supplementary Material
This article contains supplementary material (https://doi.org/10.1515/cclm-2025-0728).
© 2025 the author(s), published by De Gruyter, Berlin/Boston
This work is licensed under the Creative Commons Attribution 4.0 International License.
Articles in the same Issue
- Frontmatter
- Editorial
- The European Health Data Space: challenges and opportunities for laboratory medicine
- Review
- Saliva sampling matters for salivary diagnostics of viral infections
- Opinion Papers
- Mass spectrometry based precision diagnostics: on the cusp of selective testing
- Supporting trend detection in the cumulative display of electronic laboratory reports from multiple laboratories while preserving measurement provenance
- Secondary use of external quality assessment data – estimating inter-assay variation in LOINC-coded datasets
- Methodological evaluation and clinical interpretation of hs-cTnI and hs-cTnT variations: a reappraisal
- Point of care testing of biochemical markers for monitoring astronauts during long duration missions in deep space
- EFLM Paper
- Strategy of Laboratory Medicine – EFLM Vision
- Guidelines and Recommendations
- Recommendations for the study of monoclonal gammopathies in the clinical laboratory. A consensus of the Spanish Society of Laboratory Medicine and the Spanish Society of Hematology and Hemotherapy. Part III: Clinical and analytical recommendations for the study of monoclonal gammopathies by MALDI-TOF mass spectrometry
- Genetics and Molecular Diagnostics
- Optimization and comparison of genomic DNA extraction from whole blood collected in PAXgene blood RNA tube using automated platforms
- Small-scale external quality assessment of methylated SHOX2 and RASSF1A detection in China: findings from 2023–2024
- General Clinical Chemistry and Laboratory Medicine
- Development and validation of a machine learning model for accurate detection of wrong blood in tube errors in hospitalized patients
- Short- and medium-term pre-analytical stability of human serum insulin-like growth factor-1
- Creatinine measurement from finger stick dried blood spots with a routine chemistry analyzer for estimation of GFR
- Towards a global framework of entrustable professional activities for undergraduate clinical laboratory interns: a competency-based approach
- Spot urine is a suitable matrix for measurement of copeptin
- Reference Values and Biological Variations
- Use of indirect methods and machine learning algorithms for the estimation of reference intervals, taking cortisol measurements as an example
- ReferenceRangeR: a novel tool designed to facilitate reference interval estimation and verification
- VeRUS: verification of reference intervals based on the uncertainty of sampling
- Hematology and Coagulation
- Hemolysis index. Can we uncritically trust manufacturer declarations?
- Cancer Diagnostics
- Thresholds adjustments and impact on clinical performance of three FIT assays in a colorectal cancer screening program
- A robust ddPCR assay for the absolute quantification of miR-192-5p in hepatocellular carcinoma liquid biopsies
- Pro-gastrin releasing peptide as a tumor marker of medullary thyroid carcinoma: a comparative bivariate meta-analysis
- Infectious Diseases
- Prognostic utility of serial procalcitonin measurements in ICU sepsis: a laboratory-led modelling approach in a resource-limited setting procalcitonin modelling for sepsis mortality in a low-resource ICU
- Letters to the Editor
- Biological variation of serum transthyretin concentrations
- Pitfalls of immunoassays for diagnosis of hypoglycemia of undetermined etiology
- Cross reactivity of endogenous and exogenous 25-hydroxyvitamin D2 in commercial vitamin D assays; an evaluation using the Dutch external quality assessment scheme
- Interference with immunofixation in a dabigatran-overdosed patient treated with idarucizumab: beware of a diagnostic pitfall
- Potential savings of two practical interventions on vitamin D ordering practices at a large academic medical center
- Familial erythrocytosis and phenotypic heterogeneity associated with different defects in alpha globin genes: a significant new case of Hb Wroclaw (α88(F9) Ala>Glu; HBA1: c.266C>A)
- ROTEM-guided diagnostic pathway in a centralized Laboratory Medicine setting: an organizational report