Creatinine measurement from finger stick dried blood spots with a routine chemistry analyzer for estimation of GFR
-
J. Corné van Dam


Abstract
Objectives
Measuring creatinine levels is essential for assessing kidney function. However, traditional venous sampling poses challenges in terms of sample collection, storage, and transportation. Recently, dried blood spot (DBS) analysis has emerged as a potential alternative for measuring creatinine levels, although its clinical application remains limited. Creatinine measurements from DBS could facilitate chronic kidney disease screening, medication management, and at-home patient monitoring.
Methods
Precision and hematocrit effect were assessed according to Clinical and Laboratory Standards Institute protocols to validate creatinine measurements in DBS. Subsequently, the protocol was applied in a method comparison involving 115 patients. Lastly, robustness was assessed by investigating creatinine stability over time and the influence of spotting effects.
Results
Creatinine measurements in DBS resulted in low bias and correcting for hematocrit further improved accuracy. A comparison of creatinine and estimated glomerular filtration rate (eGFR) between venous plasma and finger stick DBS showed an R2 of 0.97 and 0.86, respectively. Moreover, sensitivity and specificity for detecting decreased eGFR (<60 mL/min/1.73 m2) were 91 and 96 %, respectively. Creatinine remained stable in DBS for up to a month at −20 °C and 4 °C, up to six days at 20 °C, and one day at 37 °C. Finally, spotting effects such as double spotting had negligible effects.
Conclusions
In conclusion, creatinine from DBS can be analyzed using an automated high-throughput chemistry analyzer, enabling accurate eGFR classification. This method may support blood sampling at home for screening programs, patient follow-up, and medication management.
Introduction
Creatinine is a metabolic byproduct of muscle metabolism and serves as a reliable marker for kidney function. Traditionally, serum or plasma creatinine levels have been used to estimate glomerular filtration rate (eGFR), which is used for screening for chronic kidney disease, medication management, and patient follow-up [1]. However, conventional venipuncture-based blood collection methods present several logistical challenges, including the need for trained personnel, venous access, and specialized storage conditions.
Dried blood spot (DBS) technology has the potential to revolutionize blood sample collection, storage, and transportation. DBS involves the collection of a small volume of capillary blood onto a filter paper card, which is then air-dried and stored at room temperature. This method offers numerous advantages, including ease of collection, minimal invasiveness, small sample volume, and stability of analytes during storage and transport [2], 3]. Moreover, DBS enables self-sampling of blood at home or work and centralization of analysis. Therefore, this method is particularly suitable for remote healthcare settings and large-scale population screening programs. The global prevalence of chronic kidney disease is 11–13 % and this number is increasing [4]. This highlights the importance of easy-to-use, cost-effective, and high-throughput screening methods for kidney function in large populations [2], [3], [4].
In the literature, creatinine measurement from DBS has mainly been described for one widely used clinical application, namely therapeutic drug monitoring. Some studies have had success with accurately measuring creatinine from DBS. However, these studies use liquid chromatography-mass spectrometry analyzers, which are expensive and require significant amounts of time, expertise, and manual labor [5], [6], [7], [8].
In this study, we addressed the question whether creatinine measured from finger stick DBS could be implemented on an automated chemistry analyzer used in routine diagnostics. Therefore, we validated the analysis of creatinine from DBS on a Siemens Atellica CH 930 analyzer and subsequently tested the capability of this method to classify patients with reduced eGFR. Finally, we examined the stability of creatinine and assessed whether spotting variations – such as double spotting or changes in blood spot volume – affect its detection.
Materials and methods
DBS extraction and creatinine analysis
Previously, accurate measurements of CRP and TSH from DBS on a routine chemistry analyzer were validated [9], 10]. Here, we sought to apply the same protocol to creatinine. DBS extraction was performed as previously reported [9], 10]. 40 µL whole blood was spotted on Whatman 903™ filter paper (Eastern Business Forms LLC, Greenville, USA) and left to dry overnight at room temperature. Three dried EDTA blood spots of 8 mm diameter were transferred to an Eppendorf tube. 450 µL PBS was added and samples were incubated at room temperature for 15 min on an orbital shaker at 600 rpm. After centrifugation at 21,130 g for 3 min at room temperature, the supernatant was transferred to analyzer cups (Tube-Top sample cups, Atellica® Solution, Siemens Healthcare Diagnostics Inc., Tarrytown, USA) without any modification to the sample volume. The Atellica analyzer processed these eluates as if they were standard plasma samples. Creatinine in DBS extracts was measured enzymatically (ECre3) in triplicate using the Atellica CH Analyzer (Siemens Healthcare Diagnostics Inc., Tarrytown, USA) following the manufacturer’s instructions to obtain a single result. In venous samples, creatinine was measured in lithium heparin (LH) plasma.
The study was performed under the tenets of the Helsinki Declaration and all relevant national regulations and institutional policies. The study protocol was approved by the authors’ institutional review board (23U-0136).
Calibration and quality control
To convert creatinine concentrations from DBS to plasma-equivalent concentrations, two calibration lines were prepared: venous EDTA whole blood vs. venous LH plasma and capillary finger stick whole blood vs. venous LH plasma. The venous EDTA whole blood calibration curve consisted of 20 samples spanning a range of 18–615 μmol/L. The capillary finger stick whole blood calibration curve consisted of 5 samples spanning a range of 56–346 μmol/L. After spotting and drying, DBS were extracted and measured as described above. The venous EDTA whole blood calibration line was used for experiments addressing precision, stability, influence of hematocrite (Hct), and spotting effects. The finger stick calibration line was used for method comparison. DBS creatinine concentrations were corrected for Hct (see below). Subsequently, the corresponding calibration lines were used offline (i.e. post analyzer) and no additional computational adjustments were made. For method comparison the following equation was used: plasma DBS creatinine converted to plasma = (DBS creatinine Hct corrected)/0.07325.
Quality and stability of the analyzer calibration was monitored by measuring quality control (QC) samples both directly and after the spotting and drying process as described above (Liquid Assayed Multiqual Premium Levels (means of 24, 99 and 489 μmol/L), Bio-Rad Laboratories, Clinical Diagnostics Group, CA, USA) before every run. Spotted QC samples were calculated from the off-line calibration curve without Hct correction because of the absence of erythrocytes. For each run, QC of Hct measurement using near-infrared (NIR) spectroscopy was performed with EDTA whole blood DBS samples with known Hct concentrations. QC samples confirmed analyzer calibration accuracy as batches with QC exceeding ± 2 SD were excluded from analysis. This appeared to be the case for one batch.
Precision
Precision was assessed following the CLSI EP15-A3 guideline, utilizing an extended protocol. Venous EDTA whole blood patient pools consisting of three patients with matching blood types were made with three different creatinine concentrations: low (creatinine: 52 μmol/L), medium (creatinine: 103 μmol/L), and high (creatinine: 337 μmol/L). EDTA whole blood samples were spotted and dried as previously described. For seven consecutive days, every pool was spotted and extracted four times and measured in duplicate.
Influence of hematocrit on creatinine concentration from DBS
To investigate the influence of Hct, plasma pools were created and mixed in different ratios with red blood cells to generate a Hct range. Briefly, pooled venous EDTA whole blood samples, consisting of five patient samples per pool, were centrifuged at 2,500 g for 7 min. Plasma was divided into six tubes, and the cell fraction was added to obtain a Hct range of 0.1–0.6 L/L. This protocol was performed for three pools with low, medium, and high plasma creatinine concentration (50, 97, and 292 μmol/L, respectively) to investigate the influence of Hct on different creatinine levels. After mixing samples by inversion, Hct concentrations were measured using a Cell-Dyn Sapphire Hematology Analyzer (Abbott, Abbott Park, IL, USA). Measurement of Hct in DBS was performed by NIR-spectroscopy on a NIRFlex N-500 Fiber Optic Solids (BÜCHI Labortechnik, Hendrik-Ido-Ambacht, the Netherlands) [11]. DBS creatinine levels were plotted against measured Hct. The slope found for the effect of Hct on the measurement of creatinine from DBS was used to correct subsequent creatinine measurements from DBS for this effect with the following equation: Hct corrected DBS creatinine=uncorrected creatinine DBS – (Hct* –23.18+9.27).
Method comparison
In the method comparison, 122 patients presenting to the outpatient clinic of the University Medical Center (UMC) Utrecht were included after giving written informed consent.
Venous blood sampling was performed via venipuncture with the BD Vacutainer® Eclipse™ Blood Collection needle with Pre-Attached Holder (Becton Dickinson, Franklin Lakes, USA) and collected in VACUTEST® 3.6 mg K2EDTA tubes (2 mL, VACUTEST KIMA, Arzergrande, IT) and BD Vacutainer® Barricor™ LH plasma tubes (3 mL, Becton Dickinson, Franklin Lakes, USA).
In addition to venipuncture, capillary blood samples were obtained by the finger stick technique in accordance with CLSI standard GP42-A6. Briefly, the puncture site was cleaned with a tissue containing isopropyl alcohol 70 % and allowed to dry. The skin was punctured using a BD Microtainer® contact-activated lancet (Becton Dickinson, Franklin Lakes, USA) to a depth of 2.0 mm and the first drop of blood was wiped off. If necessary, the skin was warmed before the puncture with a gel pack of 42 °C for a maximum of 3 min. Blood drops were collected on Whatman 903™ filter paper. Samples that were multi-spotted, unable to fully penetrate the back side of the filter paper, or <8 mm in diameter were excluded from analysis. Creatinine was measured in LH plasma within 4 h after sampling. Two samples were excluded from analysis; one due to double spotting and one because of the high creatinine level (this data point is reported in the figure legend).
From the creatinine levels, eGFR, P30, and P10 were derived. eGFR was computed with the Chronic Kidney Disease Epidemiology collaboration (CKD-EPI, 2009) formula [12] which corrects for sex, age, and body surface without correcting for race as recommended by the EFLM [13]. P30 and P10 are defined as the percentage of patients for which the creatinine in DBS is within 30 and 10 % range of plasma creatinine levels, respectively [14]. eGFR above 90 mL/min/1.73 m2 was depicted as 91 since the formula was validated in patients with chronic kidney disease and values higher than 90 are not reported in clinical practice. Since this will skew regression analysis and P30 and P10 values, we excluded all patients above 90 mL/min/1.73 m2 for these analyses. For sensitivity, specificity, positive predictive value, and negative predictive value, 60 mL/min/1.73 m2 was used as clinical cut-off.
Time and temperature stability of creatinine from DBS
In clinical practice, DBS have to travel at various temperatures and for different days before reaching the laboratory. To investigate creatinine stability in this process, DBS were spotted and dried at room temperature for 3 h before storing them at temperatures of −20 °C, +4 °C, +20 °C, or +37 °C for 1, 2, 3, 6, 14, and 31 days. During DBS extraction of samples stored at −20 °C, repeated freeze–thaw cycles were analyzed simultaneously. Therefore, day 1 samples were freeze–thawed once, day 2 samples were freeze–thawed twice, etc.
Spot effects on analysis of creatinine from DBS
Outside controlled laboratory environments, spotting variations may occur and hamper accurate diagnostics. Therefore, the effect of double spotting, different blood volumes, and number of spots was investigated (all samples were spotted in triplicate).
Effect of double spotting
Venous EDTA whole blood samples with five different target concentrations were spotted and 30 and 60 s after the first spot, a second blood drop was spotted on top. Creatinine measurements were performed as described before.
Effect of volume of blood spotted
Venous EDTA whole blood samples with three distinct creatinine concentrations spanning the clinical range were selected. Varying blood volumes (20–50 µL) and spots were processed as described.
Effect of number of spots and extraction buffer proportions
Venous EDTA whole blood samples with three different creatinine concentrations were spotted. For extraction, either 1, 2, 3, or 4 spots were used. For each spot, 150 µL extraction buffer was added. Extraction and analysis were performed as described previously.
Statistical analysis
Graphs were generated using GraphPad Prism 9 (Version 9.3.0; GraphPad Software, LLC, San Diego, USA). EP Evaluator (Data Innovations, VT, USA; version 12.2) was used to evaluate precision, Deming regression analysis, and bias. 95 % confidence interval (CI) for R2 was calculated according to R2 ± 2 × SER2, where
The Clinical Laboratory Improvement Amendments (CLIA) requirements for analytical quality for creatinine are: target value ± 18 μmol/L or ±10 % (total allowable error (TEa)). TEa was used to analyze spotting effects by comparing the average values (target values) of venous creatinine and DBS measurements. Stability was analyzed by comparison with CLIA acceptance limits.
Results
Precision
Evaluation of precision in patient samples showed that total coefficient of variation was between 4.1 and 17.7 % for creatinine concentrations of 345 and 49 μmol/L, respectively (Table 1).
Dried blood spot creatinine precision at three different concentrations.
| Within run | Between run | Between day | Total | |
|---|---|---|---|---|
| Concentration mean: 353.4 | ||||
| %CV | 1.6 | 2.2 | 3.0 | 4.1 |
| Concentration mean: 104.9 | ||||
| %CV | 5.9 | 3.9 | 0.9 | 7.1 |
| Concentration mean: 48.8 | ||||
| %CV | 16.9 | 0.0 | 5.0 | 17.7 |
Dried blood spot creatinine levels are negatively correlated with hematocrit
Since Hct can bias DBS measurements, we examined the potential effect of Hct. A consistent negative correlation between DBS creatinine levels and Hct was observed across all creatinine concentrations studied (Figure 1A and Table 2). To determine the effect of Hct on the measurement of creatinine from DBS, uncorrected DBS creatinine values were plotted against Hct (Figure 1B). Creatinine was corrected for Hct using the formula derived from the intermediate level, as it closely aligns with the clinical cut-off. Using two correction formulas (one for high and one for medium/low levels) did not improve results (data not shown). Thus, creatinine levels in DBS showed a negative correlation with Hct. However, applying the correction effectively minimized the impact of Hct.
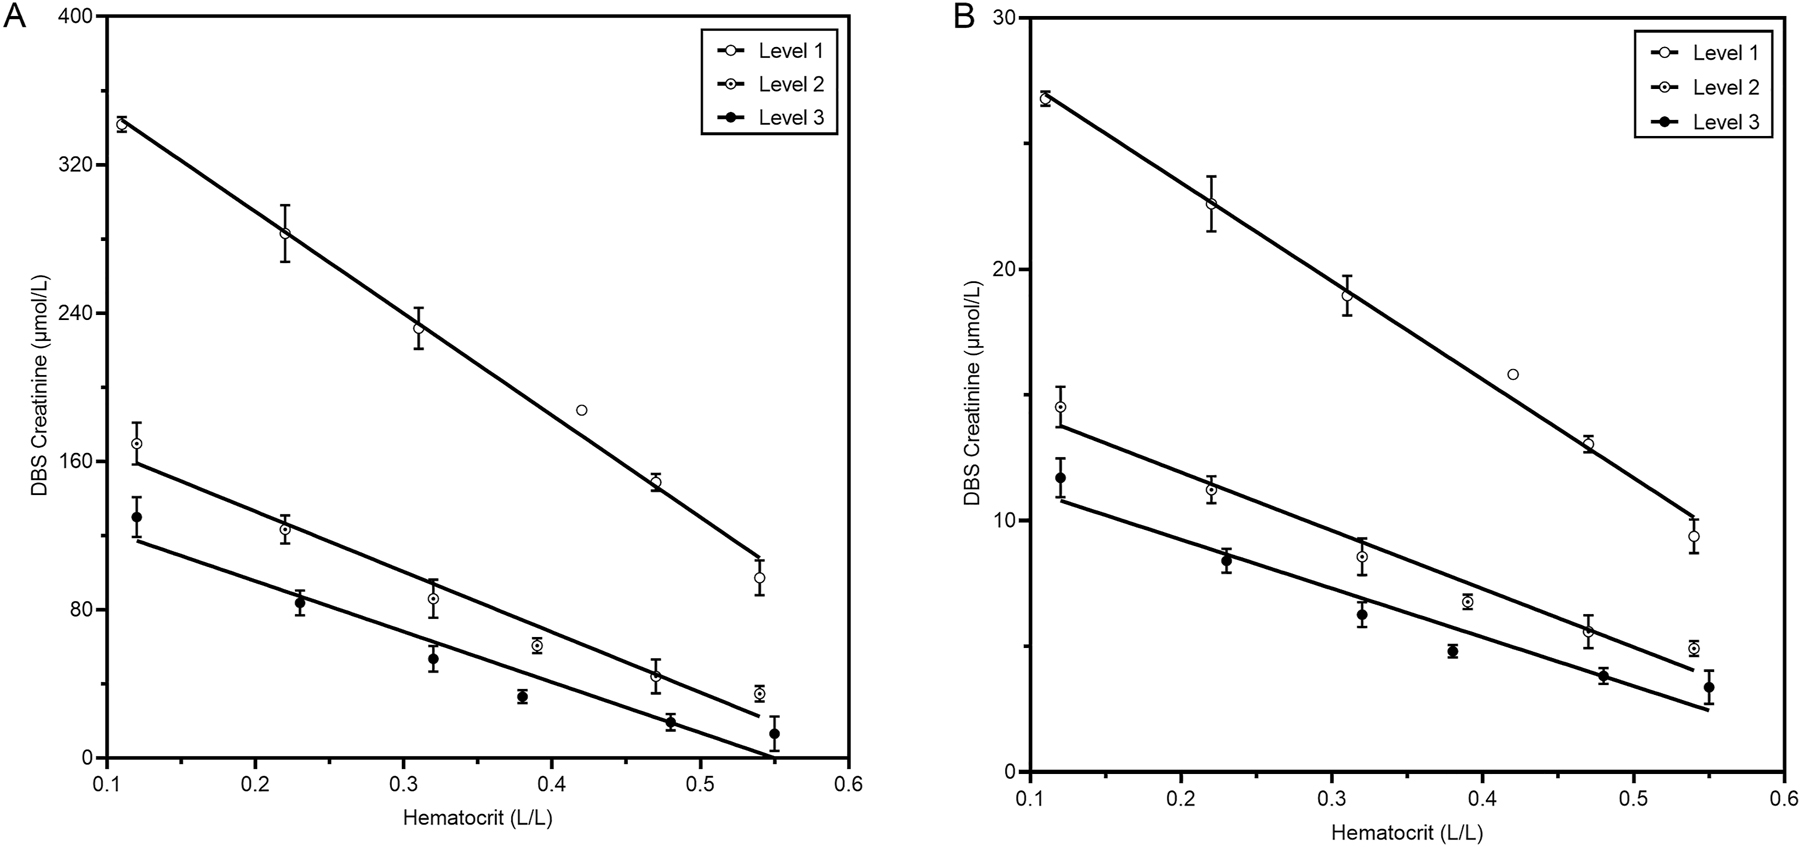
Influence of hematocrit on the concentration of creatinine from DBS. Pools from three patients with three different target concentrations were made. From each pool, a Hct dilution range was created. Then, blood was spotted on DBS cards and dried overnight before analysis in triplicate. (A) Shows plasma equivalent creatinine concentrations from DBS. Uncorrected creatine DBS results plotted against Hct measured with a NIRFlex N-500 are shown in (B).
Effect of hematocrit on creatinine.
| Level | Plasma creatinine concentration, µmol/L at Hct 0.40 | Creatinine decrease, µmol/L per 0.10 Hct increase | Creatinine decrease (%) per 0.10 Hct increase |
|---|---|---|---|
| 1 | 292 | 52.1 [3.51] | 17.8 [1.20] |
| 2 | 97 | 29.0 [4.29] | 29.9 [4.42] |
| 3 | 50 | 24.9 [4.91] | 49.8 [9.82] |
-
Creatinine decrease is indicated as mean with SD between brackets.
Method comparison of creatinine levels and eGFR in patients using DBS
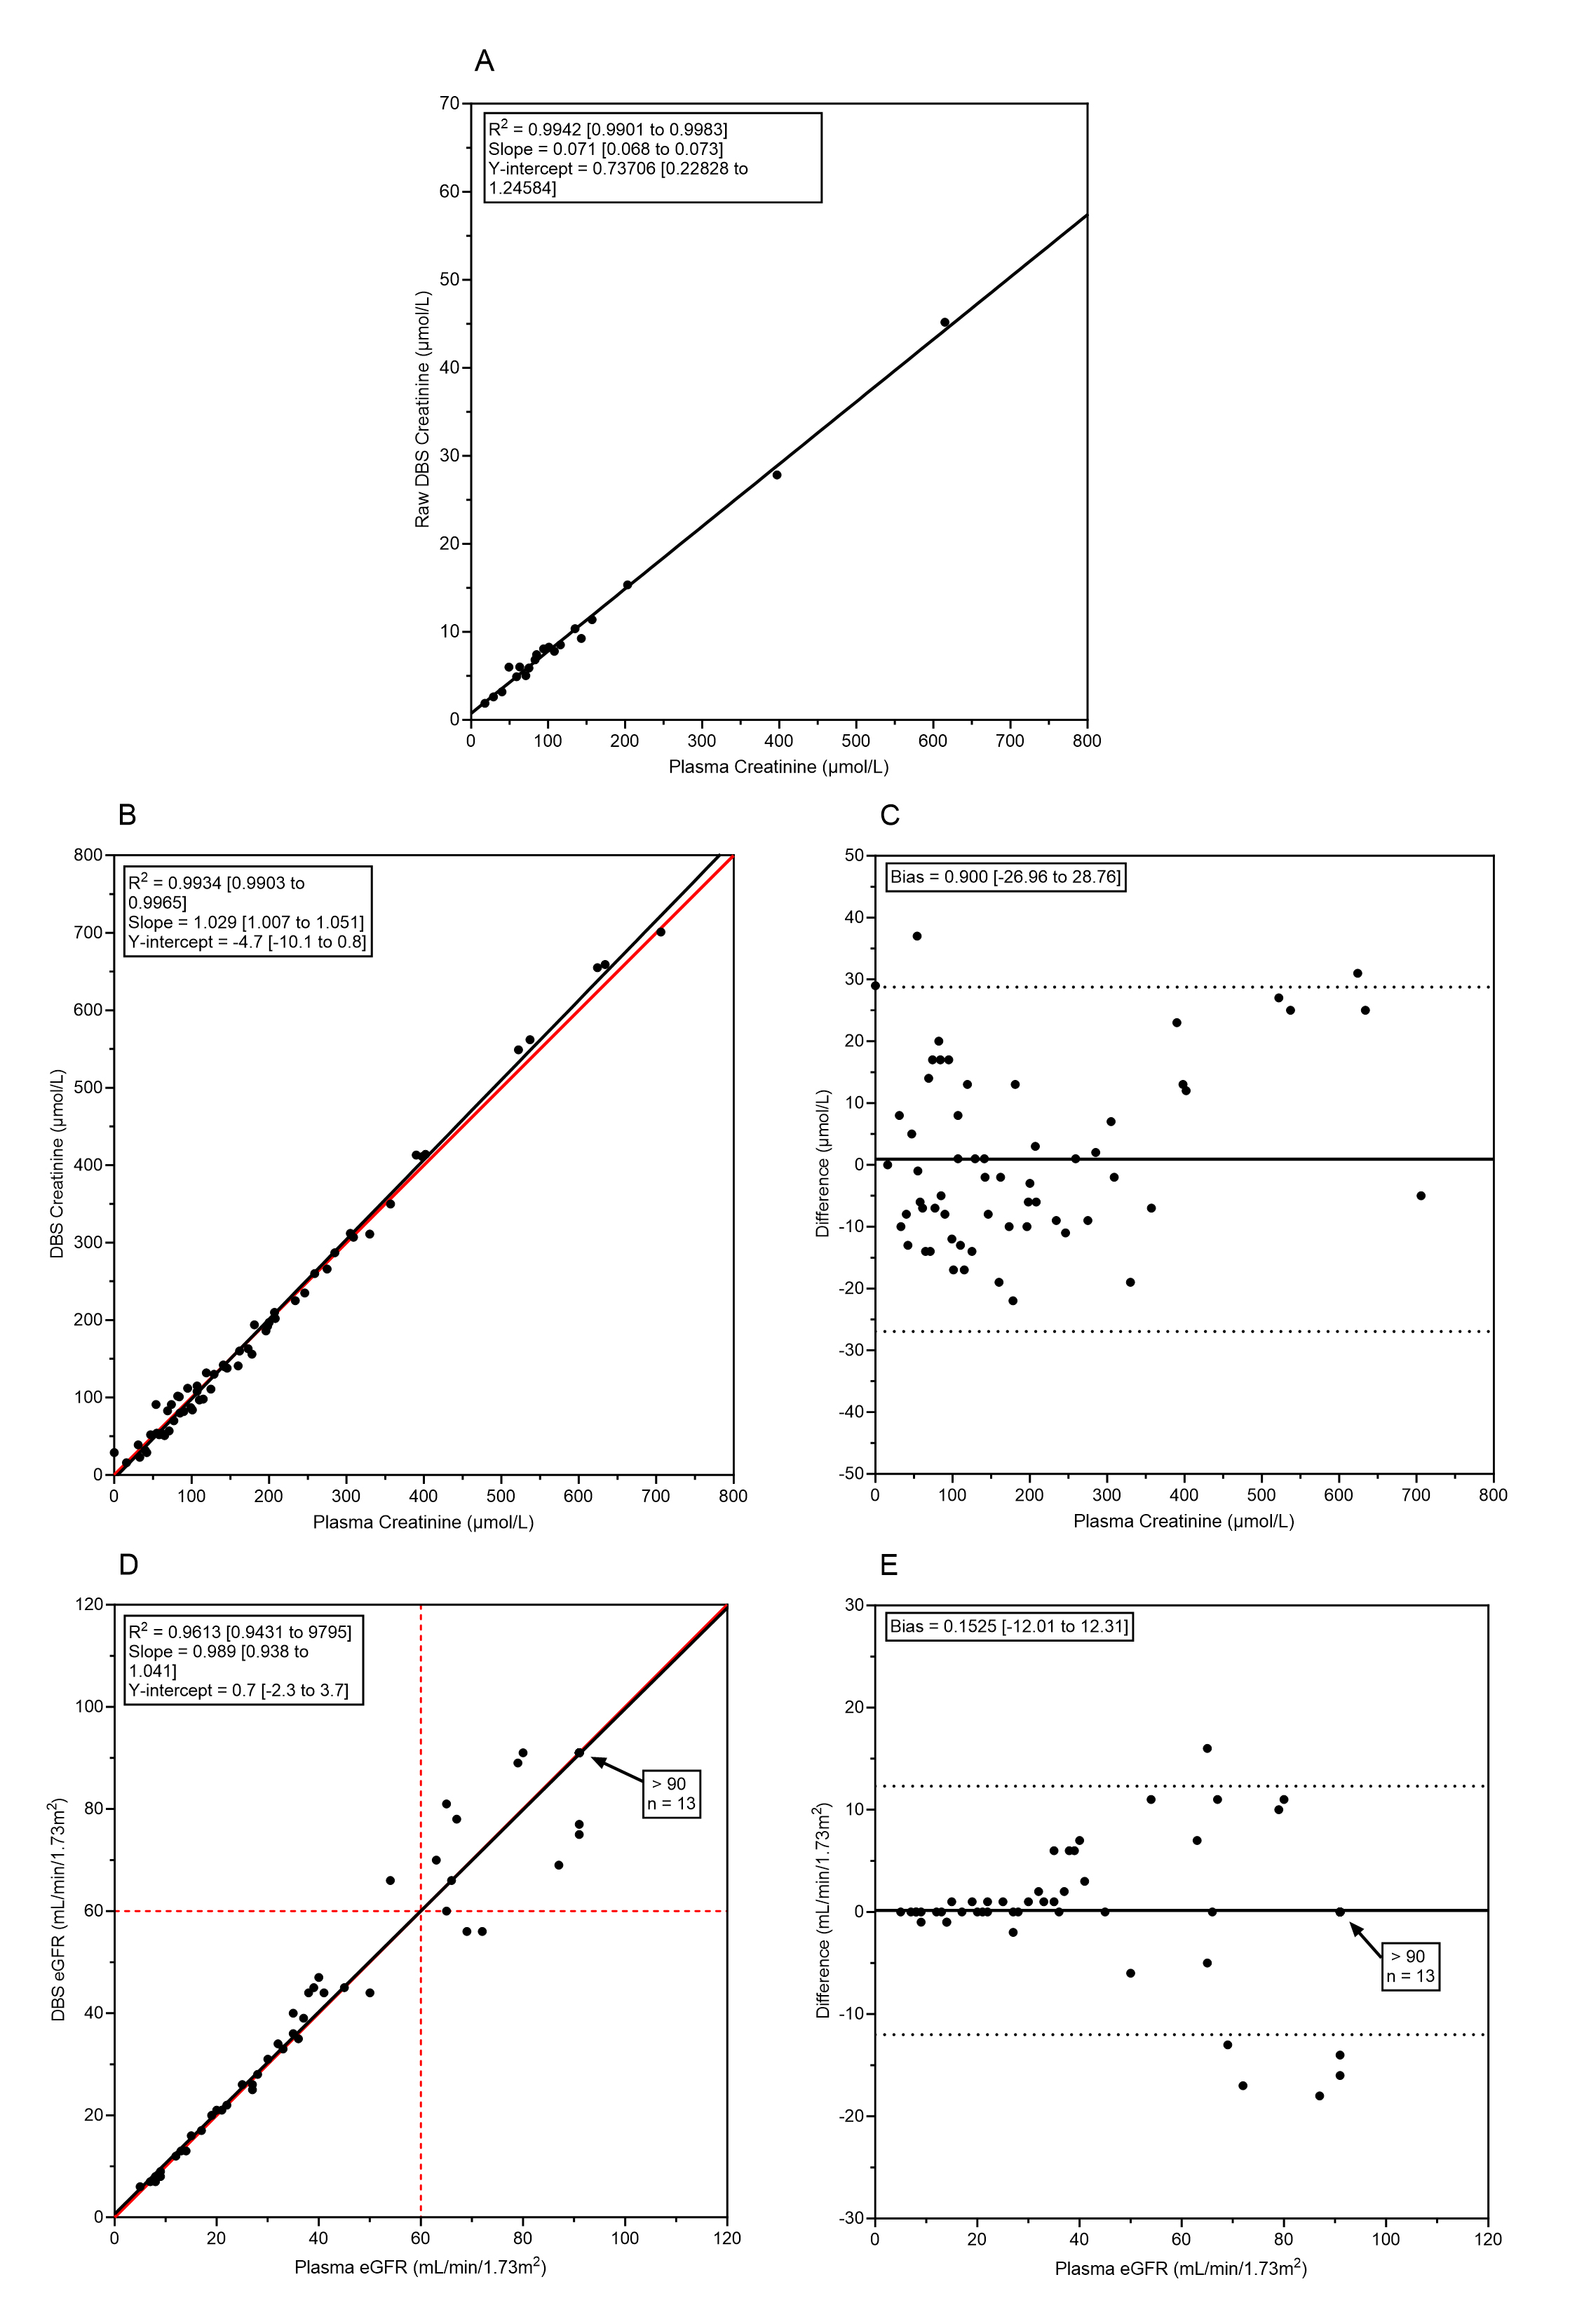
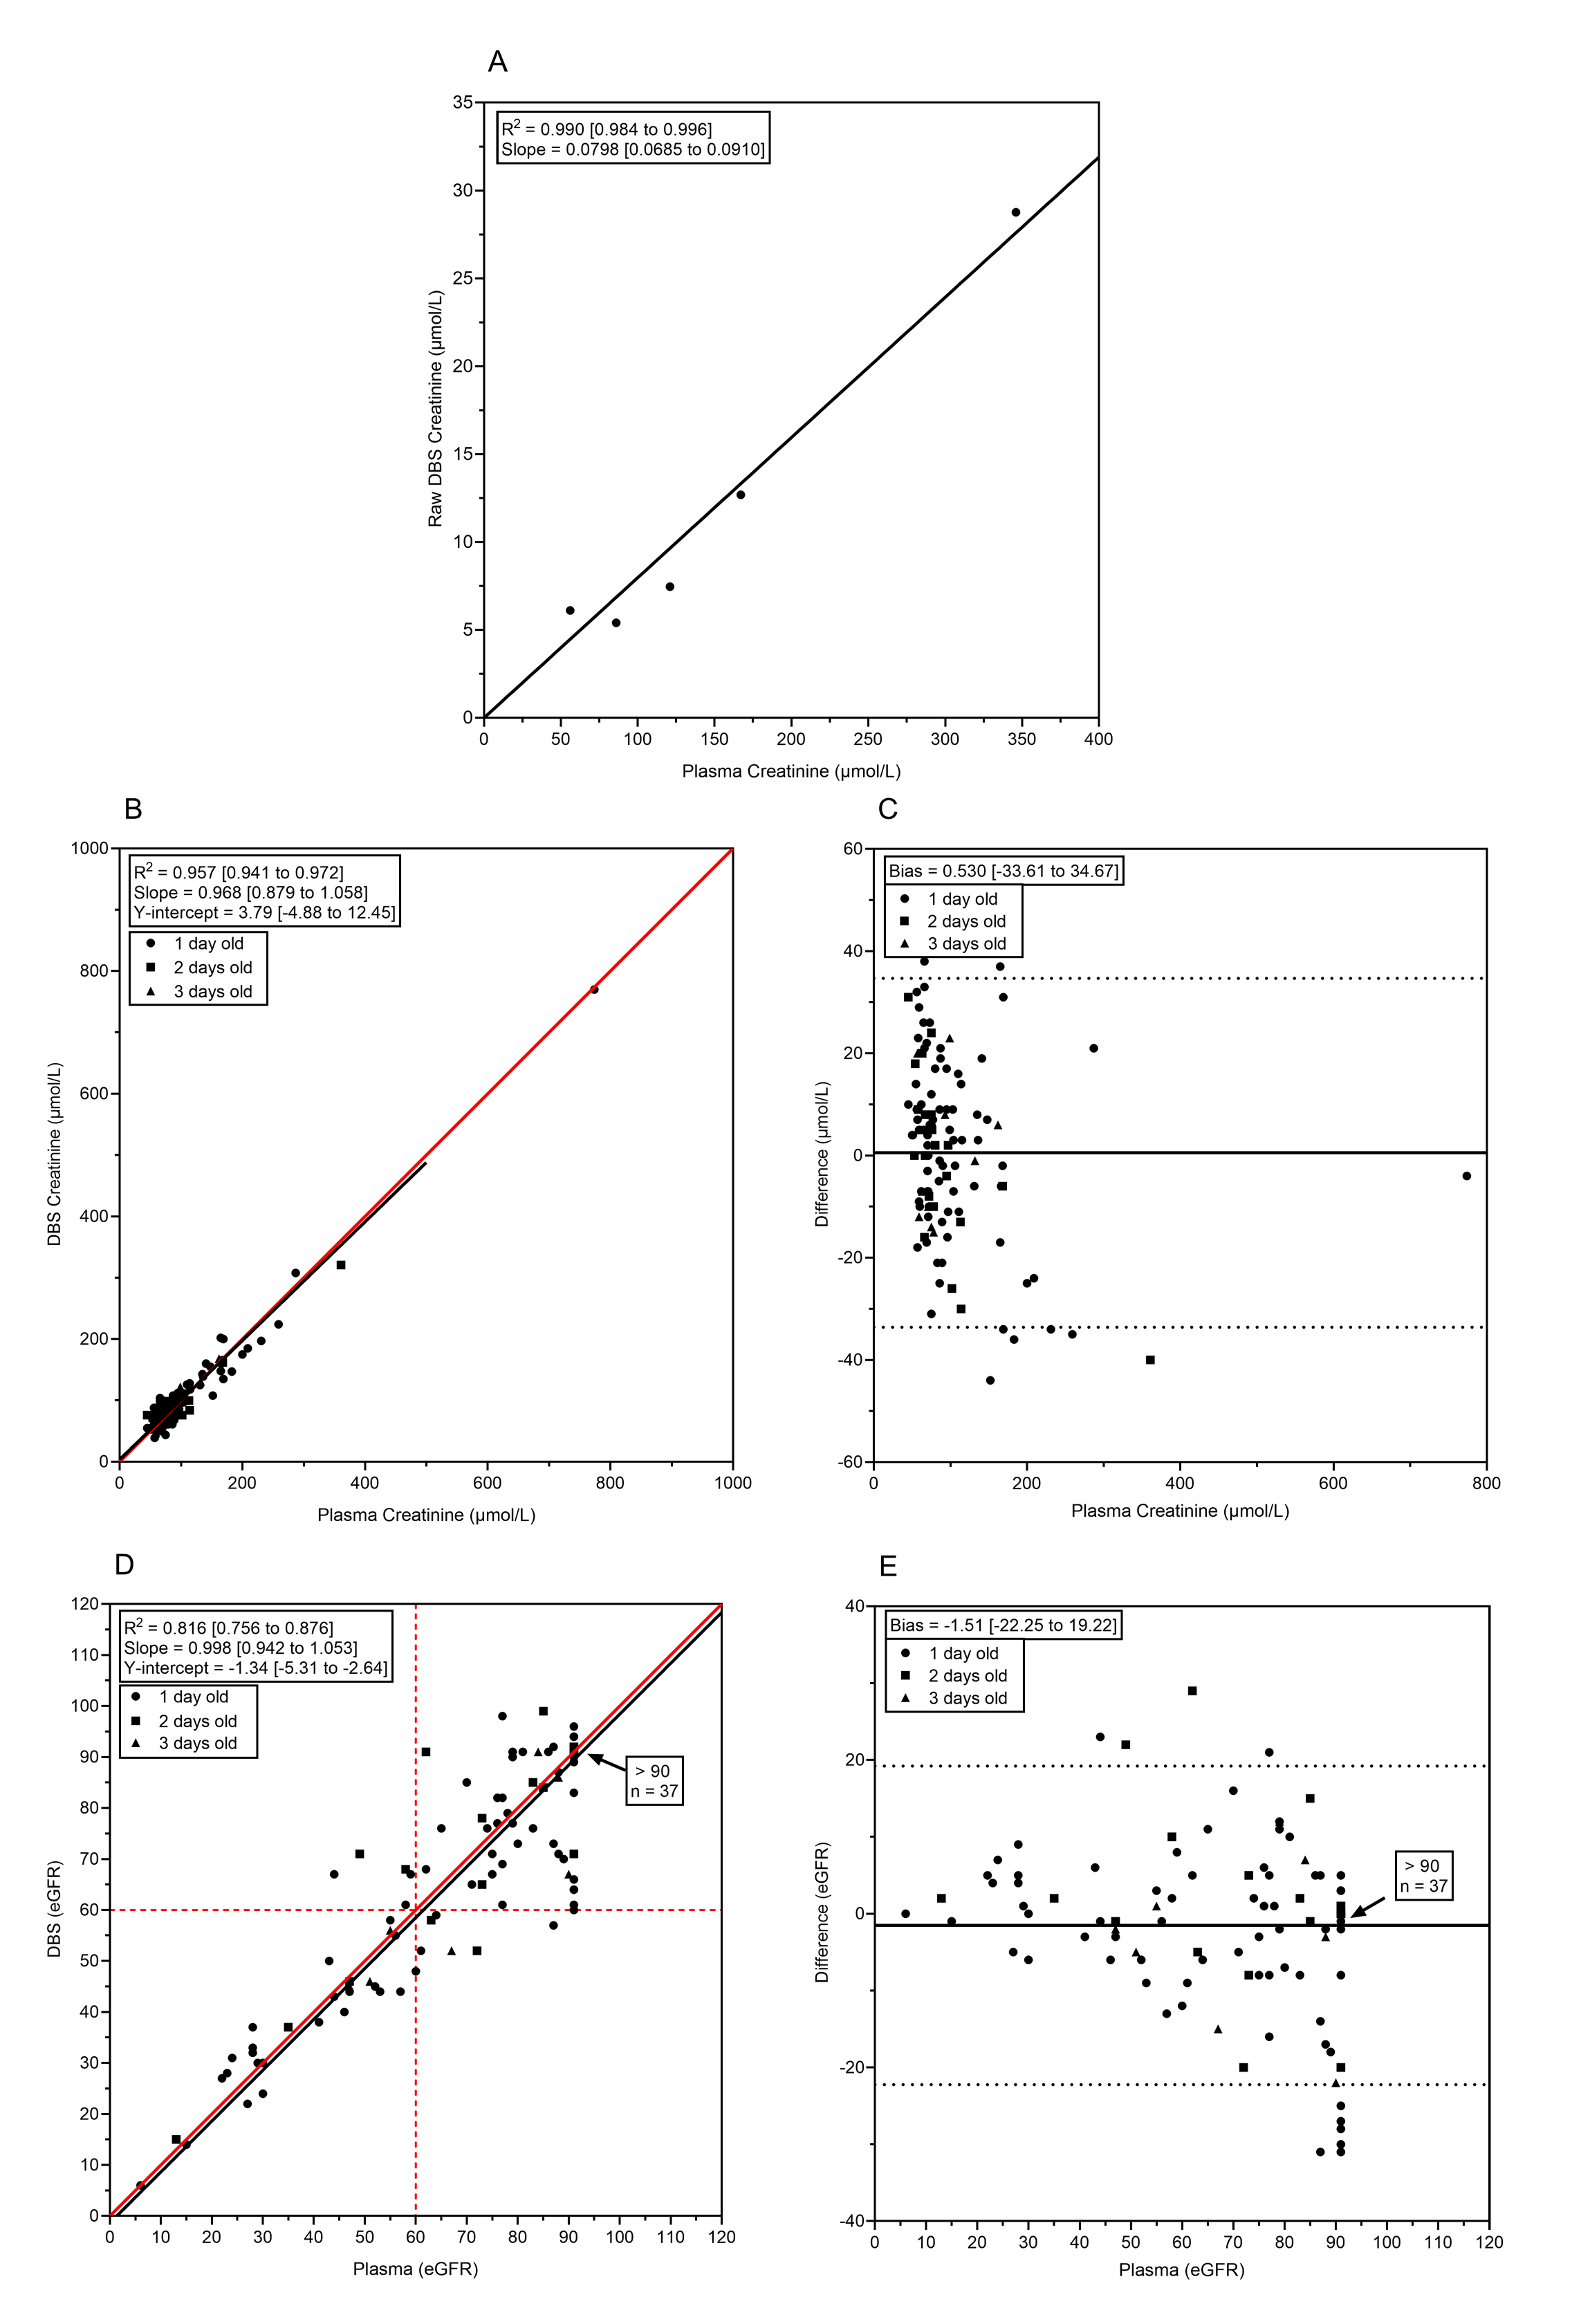
Subsequently, creatinine levels in finger stick DBS extracts were compared to venous heparin plasma of 122 patients (including 5 patients for the calibration curve, see Table 3 for patient characteristics). One sample was removed from further analysis because of a spotting failure. To convert creatinine concentrations from DBS to plasma-equivalent concentrations, a linear calibration line with samples across the creatinine range was created (R2>0.997) (Figure 2A). The method comparison showed R2 [95 % CI] 0.967 [0.955–0.978], slope 1,014 [0.885–1.143], and intercept −4.32 [−16.52–7.89] (Figure 2B). Moreover, the absolute bias [95 % CI] of 2.878 [−32.44–26.69] was not significant between the compared methods (Figure 2C).
Overview of the study population characteristics.
| n | 120 |
|---|---|
| Sex n (%) | |
| Male | 64 (52 %) |
| Female | 57 (48 %) |
| Age, years | |
| Mean | 58 |
| Median | 59 |
| Min | 23 |
| Max | 88 |
![Figure 2:
Method comparison of venous lithium heparin (LH) plasma and capillary finger stick DBS. (A) calibration line for DBS creatinine was calculated with linear regression. Range of plasma creatinine: 56–346 μmol/L; n=5. (B) Method comparison for DBS creatinine with the line of identity (red) and deming linear regression (black). Storage time of DBS cards is displayed in ⚫ (1 day, n=82), ◼ (2 days, n=20), ▲ (3 days, n=13), total n=115. Average plasma creatinine [stdev]=112 [112] μmol/L. The highest point (creatinine level of 947 and 1,061 μmol/L in plasma and DBS respectively) is not shown. (C) Bias plot from method comparison of panel B. (D) Method comparison for DBS eGFR with the line of identity (red) and deming linear regression (black). Average eGFR [stdev]=70 [24] L/min/1.73 m2; n=115. Dotted lines show the reference interval. (E) Bias plot from method comparison of panel D. All 95 % confidence intervals are shown in between brackets. DBS, dried blood spot; eGFR, estimated glomerular filtration rate.](/document/doi/10.1515/cclm-2025-0979/asset/graphic/j_cclm-2025-0979_fig_002.jpg)
Method comparison of venous lithium heparin (LH) plasma and capillary finger stick DBS. (A) calibration line for DBS creatinine was calculated with linear regression. Range of plasma creatinine: 56–346 μmol/L; n=5. (B) Method comparison for DBS creatinine with the line of identity (red) and deming linear regression (black). Storage time of DBS cards is displayed in ⚫ (1 day, n=82), ◼ (2 days, n=20), ▲ (3 days, n=13), total n=115. Average plasma creatinine [stdev]=112 [112] μmol/L. The highest point (creatinine level of 947 and 1,061 μmol/L in plasma and DBS respectively) is not shown. (C) Bias plot from method comparison of panel B. (D) Method comparison for DBS eGFR with the line of identity (red) and deming linear regression (black). Average eGFR [stdev]=70 [24] L/min/1.73 m2; n=115. Dotted lines show the reference interval. (E) Bias plot from method comparison of panel D. All 95 % confidence intervals are shown in between brackets. DBS, dried blood spot; eGFR, estimated glomerular filtration rate.
We found high correlation with R2 [95 % CI] 0.858 [0.80–0.91] and low absolute bias of 0.31 for eGFR [95 % CI] [−15.05–15.67] (Figure 2D and E). In 97.0 and 49.3 % of the DBS, eGFR was within the 30 % (P30) and 10 % (P10) range of plasma eGFR, respectively. Using the clinical cut-off value of 60 mL/min/1.73 m2 for eGFR, sensitivity was 91 %, and specificity was 96 % The data used for this calculation are shown in Supplementary Table S1. Similarly, positive predictive value and negative predictive values were 91 and 96 %, respectively. This indicates good correlation between DBS and plasma creatinine and accurate qualification based on the clinical cut-off.
Without Hct correction, sensitivity and specificity were lower, 85 and 93 % respectively. Similarly, R2 for creatinine and eGFR were lower without Hct correction (0.96 and 0.82 respectively, see Supplementary Figure S1). Regression analyses of the venous calibration line (n=20) and method comparison (n=60) of venous heparin plasma vs. venous EDTA whole blood DBS extract yielded similar results (Supplementary Figure S2). Thus, creatinine levels and eGFR were predicted with high accuracy using DBS.
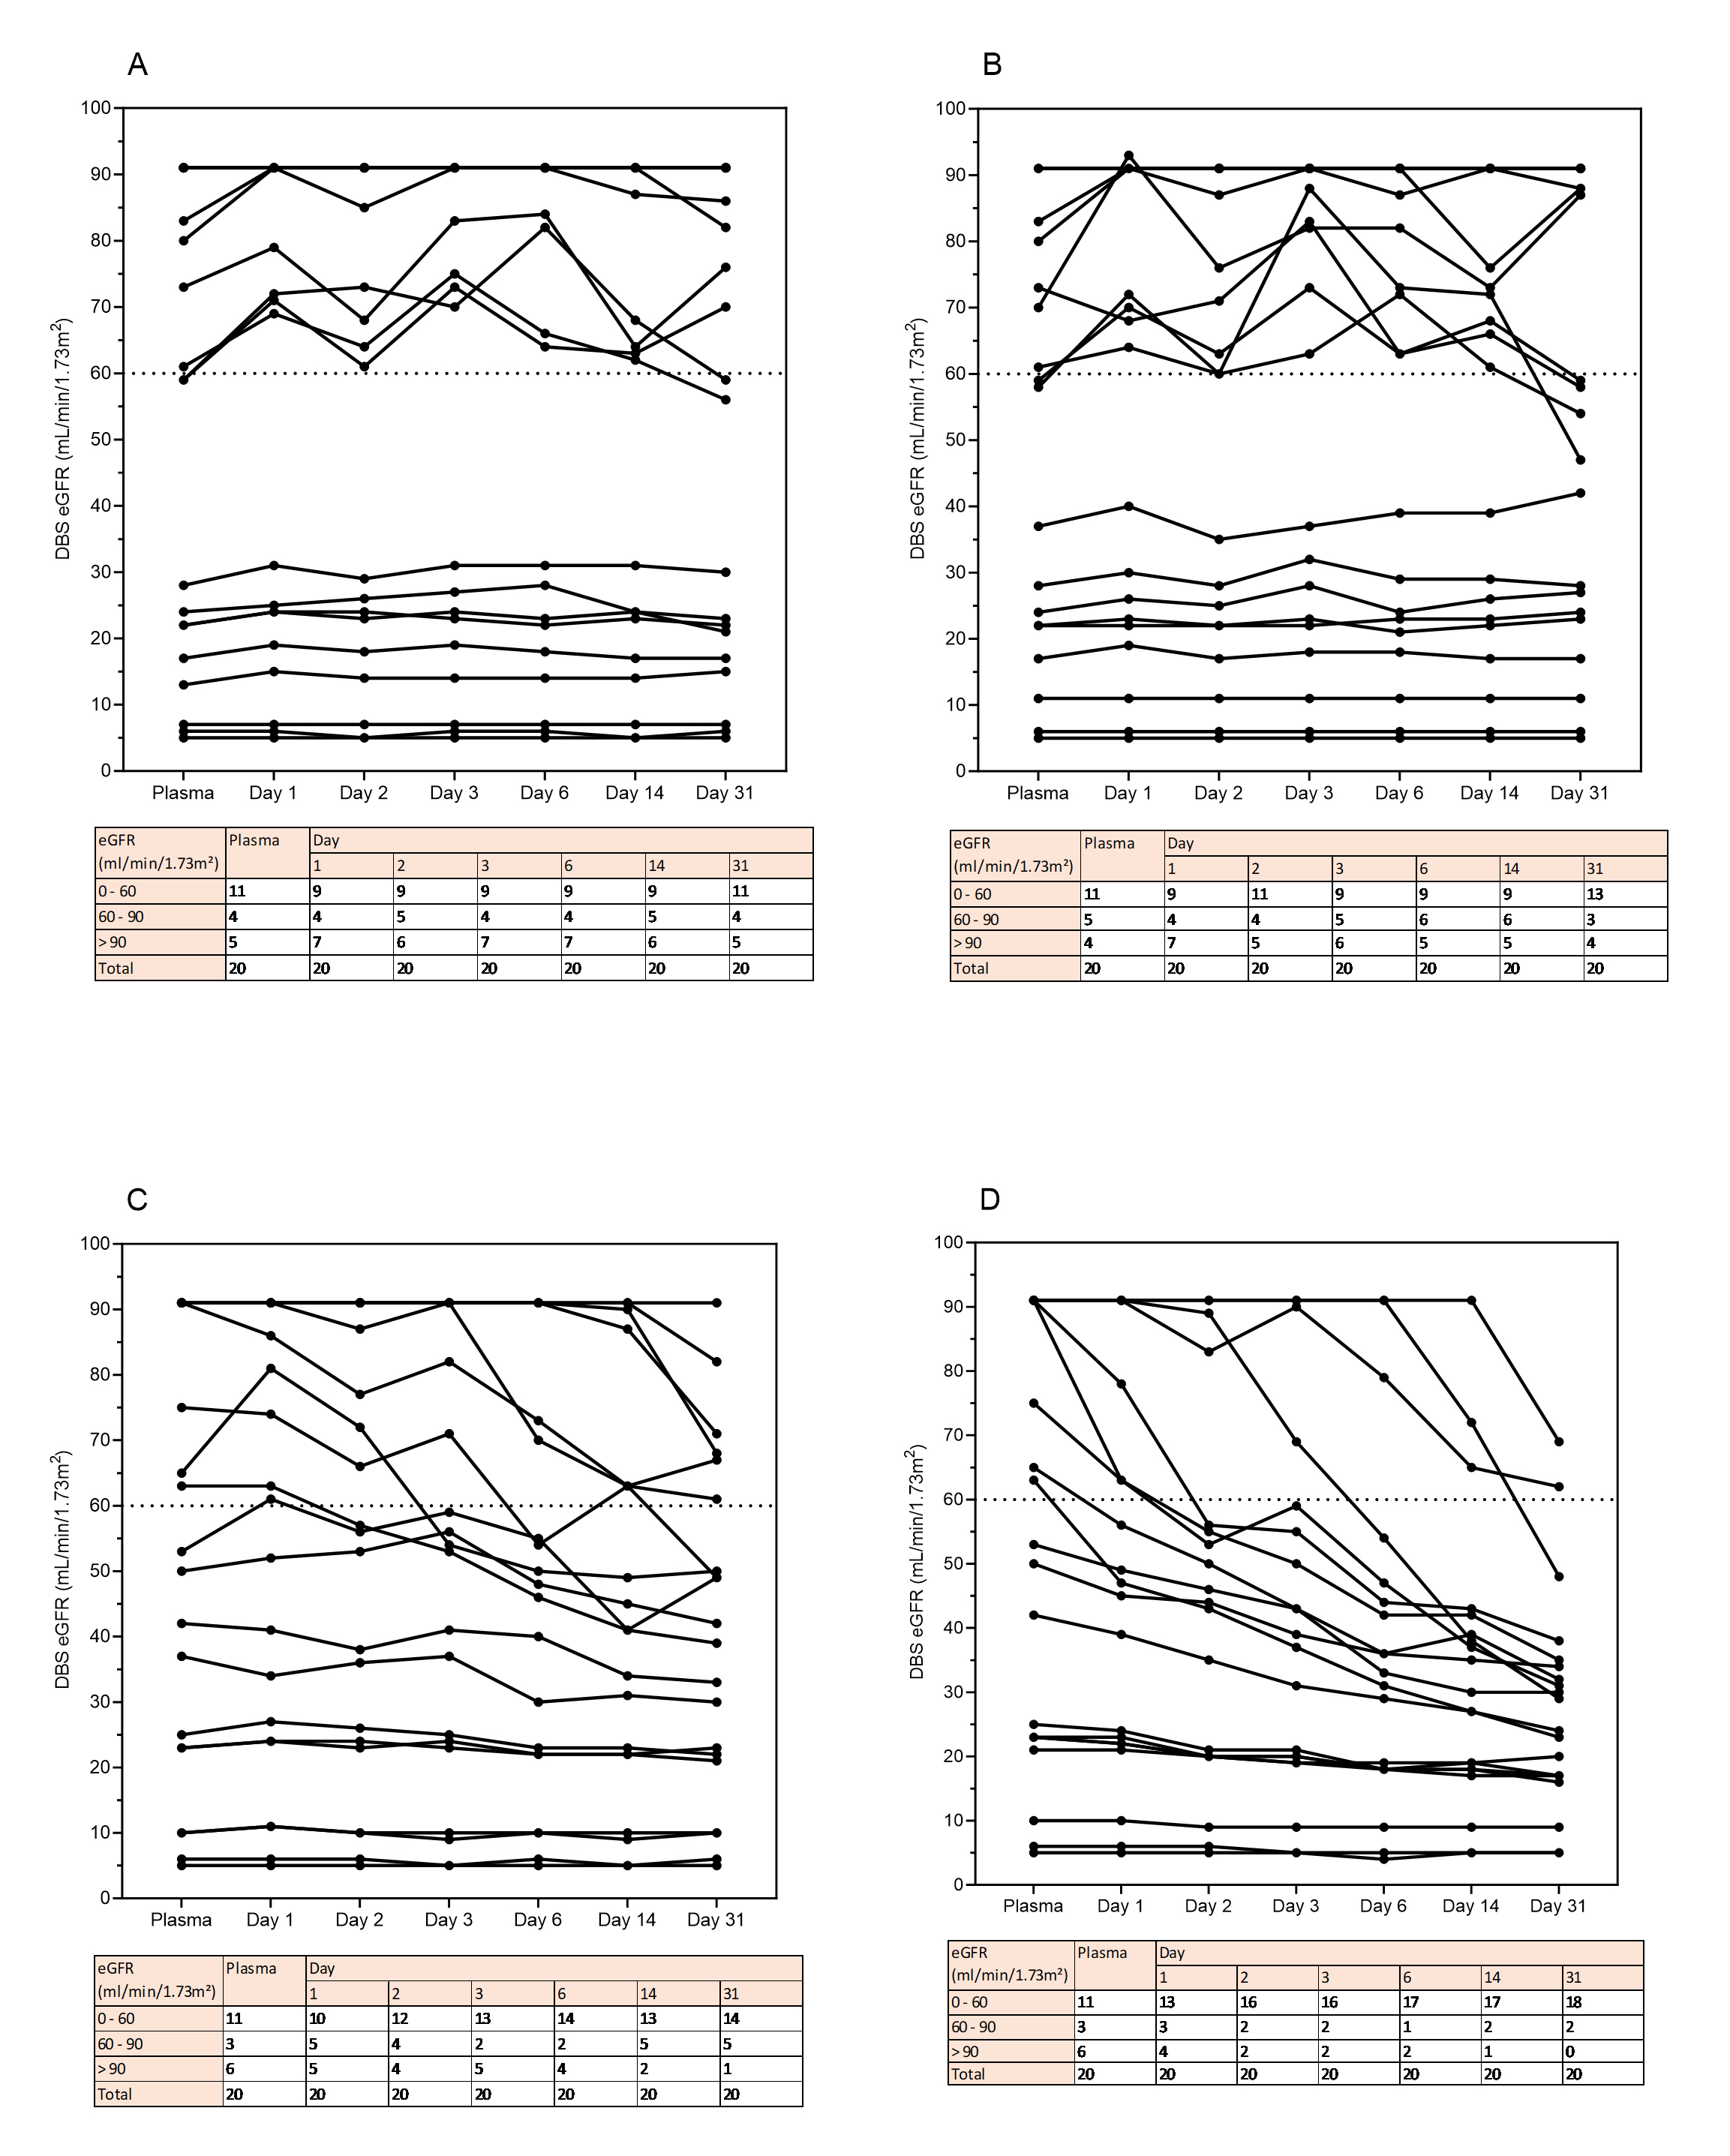
Variations in DBS spotting or storage are compatible with spotting at home
Since telediagnostics deal with different storage conditions and inaccuracies with blood spotting by patients, we investigated how these affect creatinine and eGFR measurement from DBS. Creatinine levels appeared stable up to 30 days when stored at −20 °C and 4 °C. In addition, creatinine showed acceptable stability up to 6 days at 20 °C, and up to one day at 37 °C (Figure 3). Interestingly, creatinine levels tended to increase when DBS-cards were stored at 20 °C and 37 °C (Figure 3C and D). This resulted in a decrease in eGFR over time when DBS were stored at higher temperatures. Overall, eGFR stability was comparable to creatinine stability (Supplementary Figure S3). To study the effect of double spotting, blood from five patients with a range of creatinine concentrations was spotted twice with an interval of 30 and 60 s. After double spotting, samples were within CLIA acceptance limits except for non-relevant aberrations at the highest and lowest creatinine levels (Figure 4A). In addition, the effect of spotted blood volume was studied. Notably, all volumes were within CLIA limits except for 25 μL at level 2 and 20 and 25 μL at level 3 (Figure 4B). Finally, creatinine levels remained consistent regardless of the number of DBS spots used (Figure 4C). Thus, spotting effects did not affect creatinine measurement from DBS except for double spotting at a high or low creatinine level and for 20–25 µL spots at median and low creatinine levels.
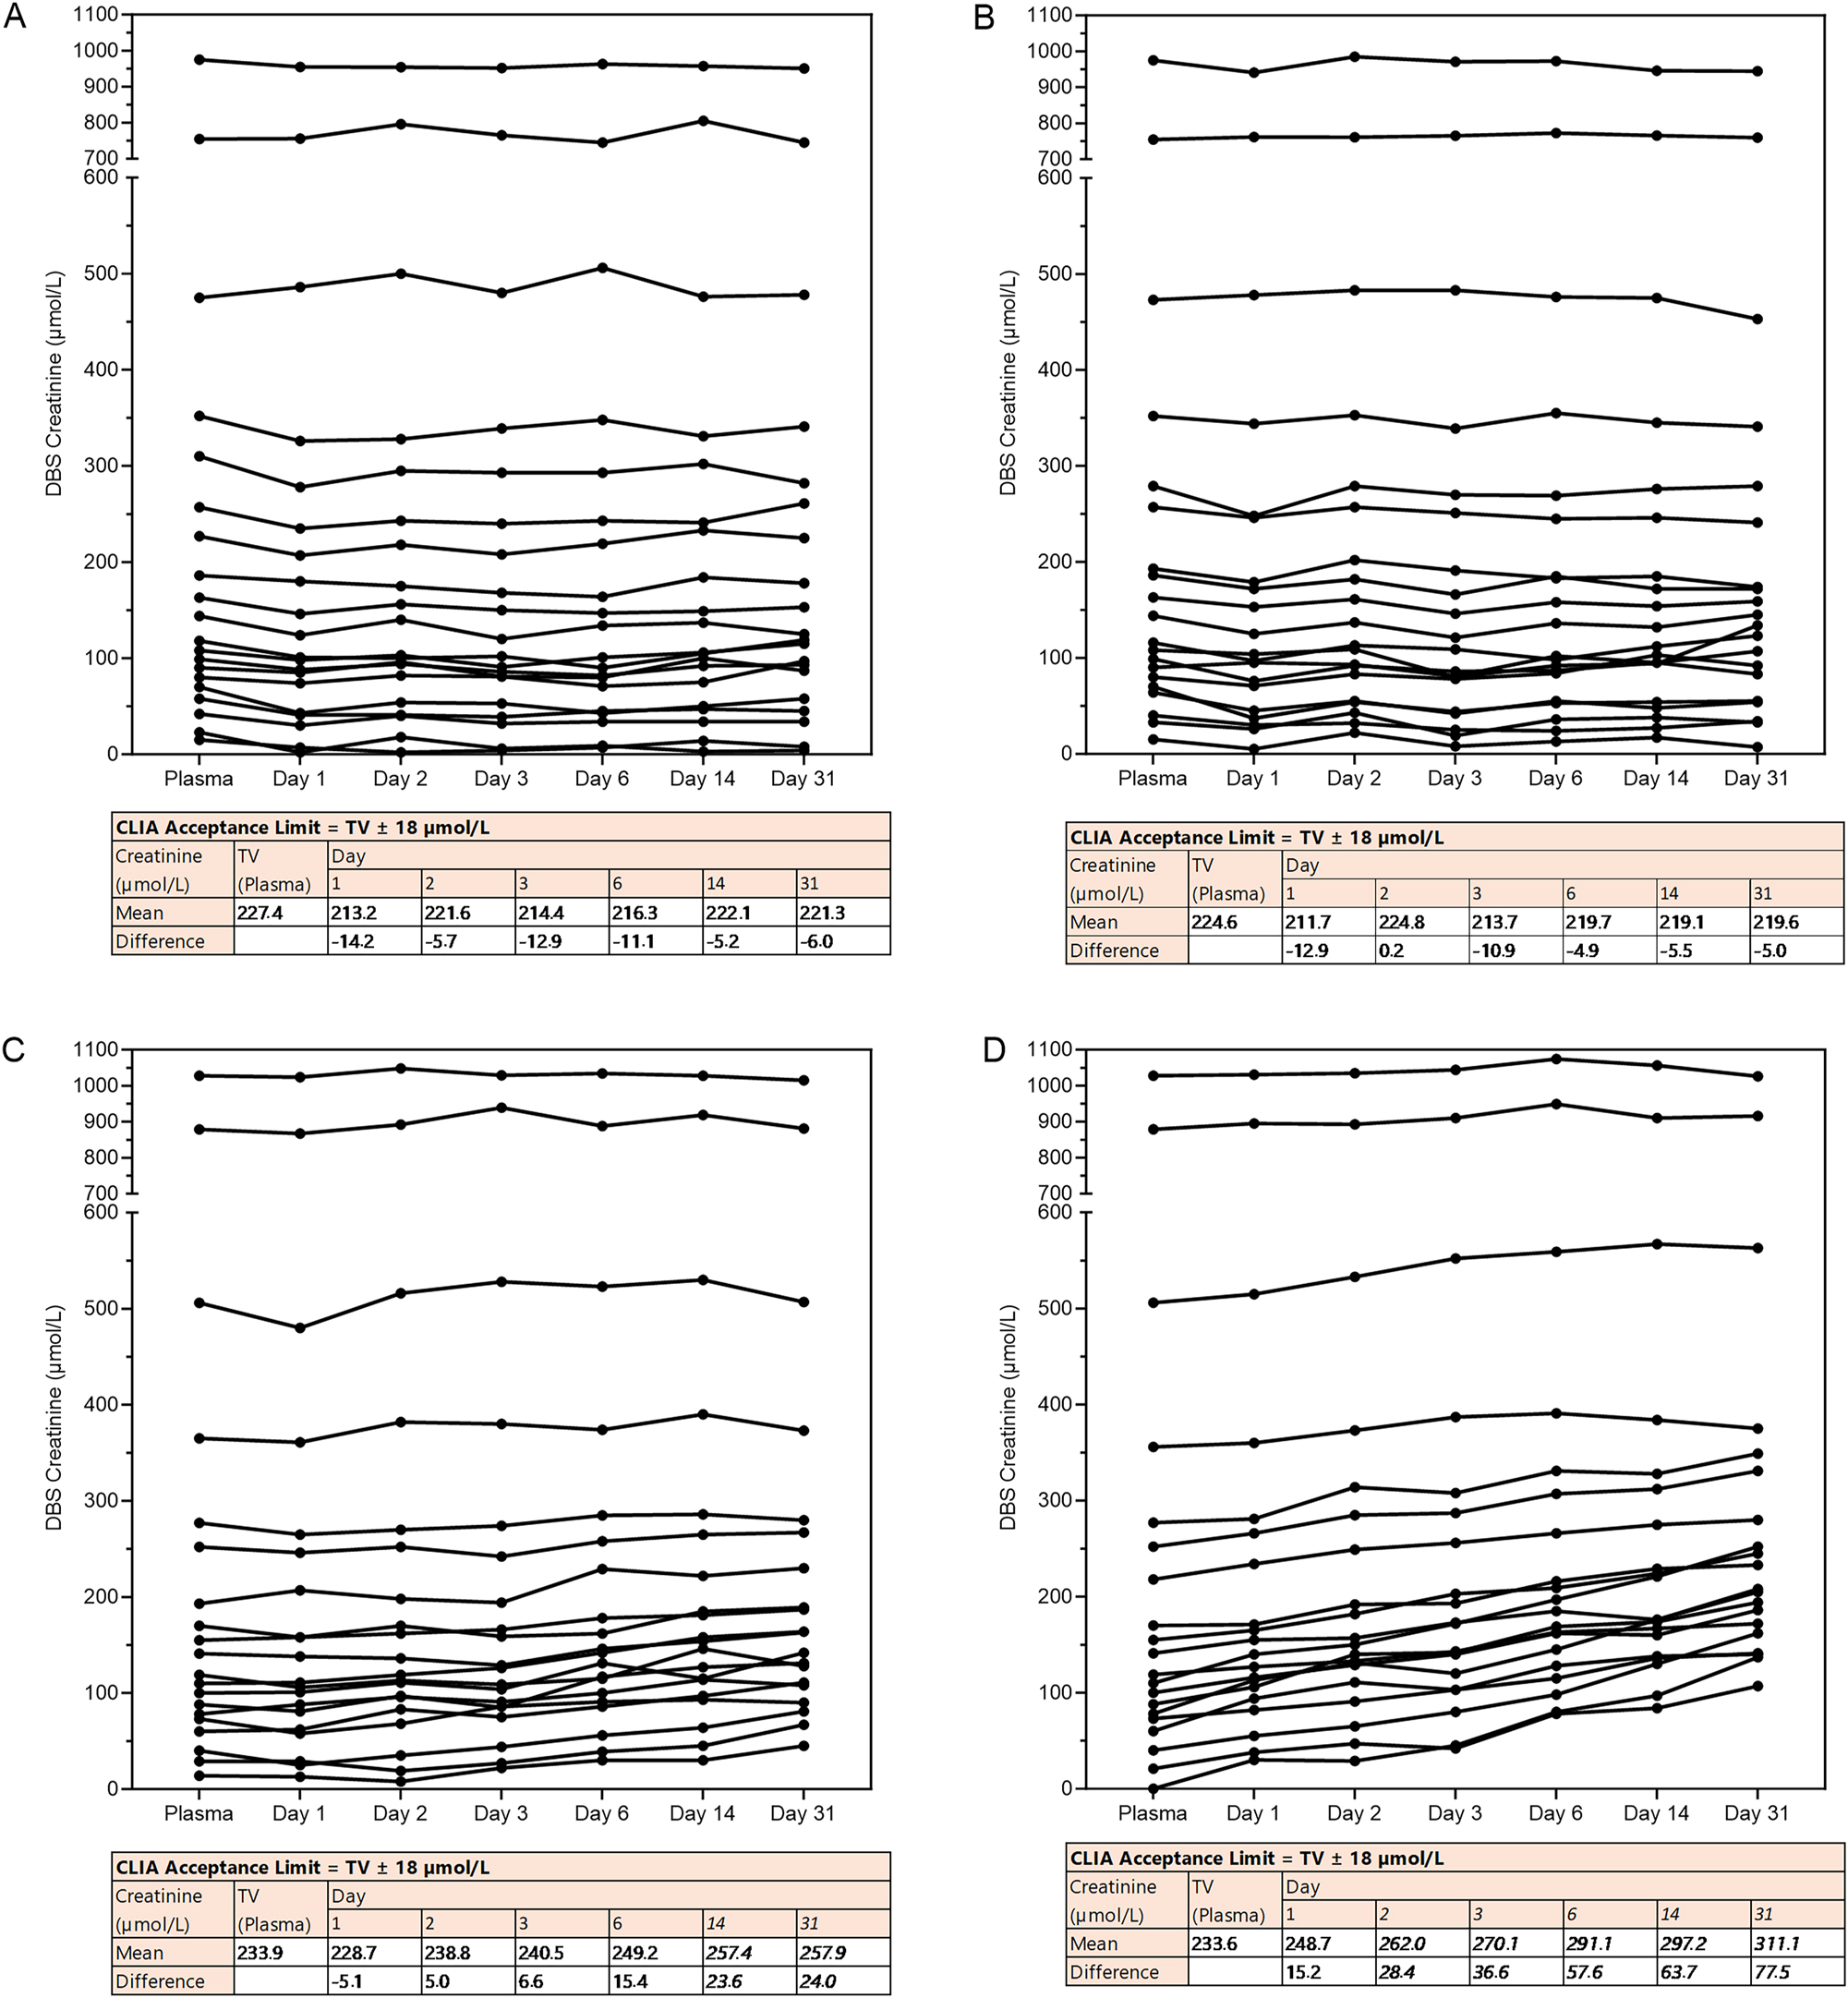
Stability of creatinine from DBS. DBS cards with venous EDTA whole blood were stored for a varying number of days (0–31 days, x-axis) under varying storage temperatures. (A) −20 °C, (B) 4 °C, (C) 20 °C and (D) +37 °C per condition n=20. Under each graph, a table testing the results against the acceptance limit of CLIA for proficiency testing is shown (levels exceeding the limit are shown in italics). TV; target value.
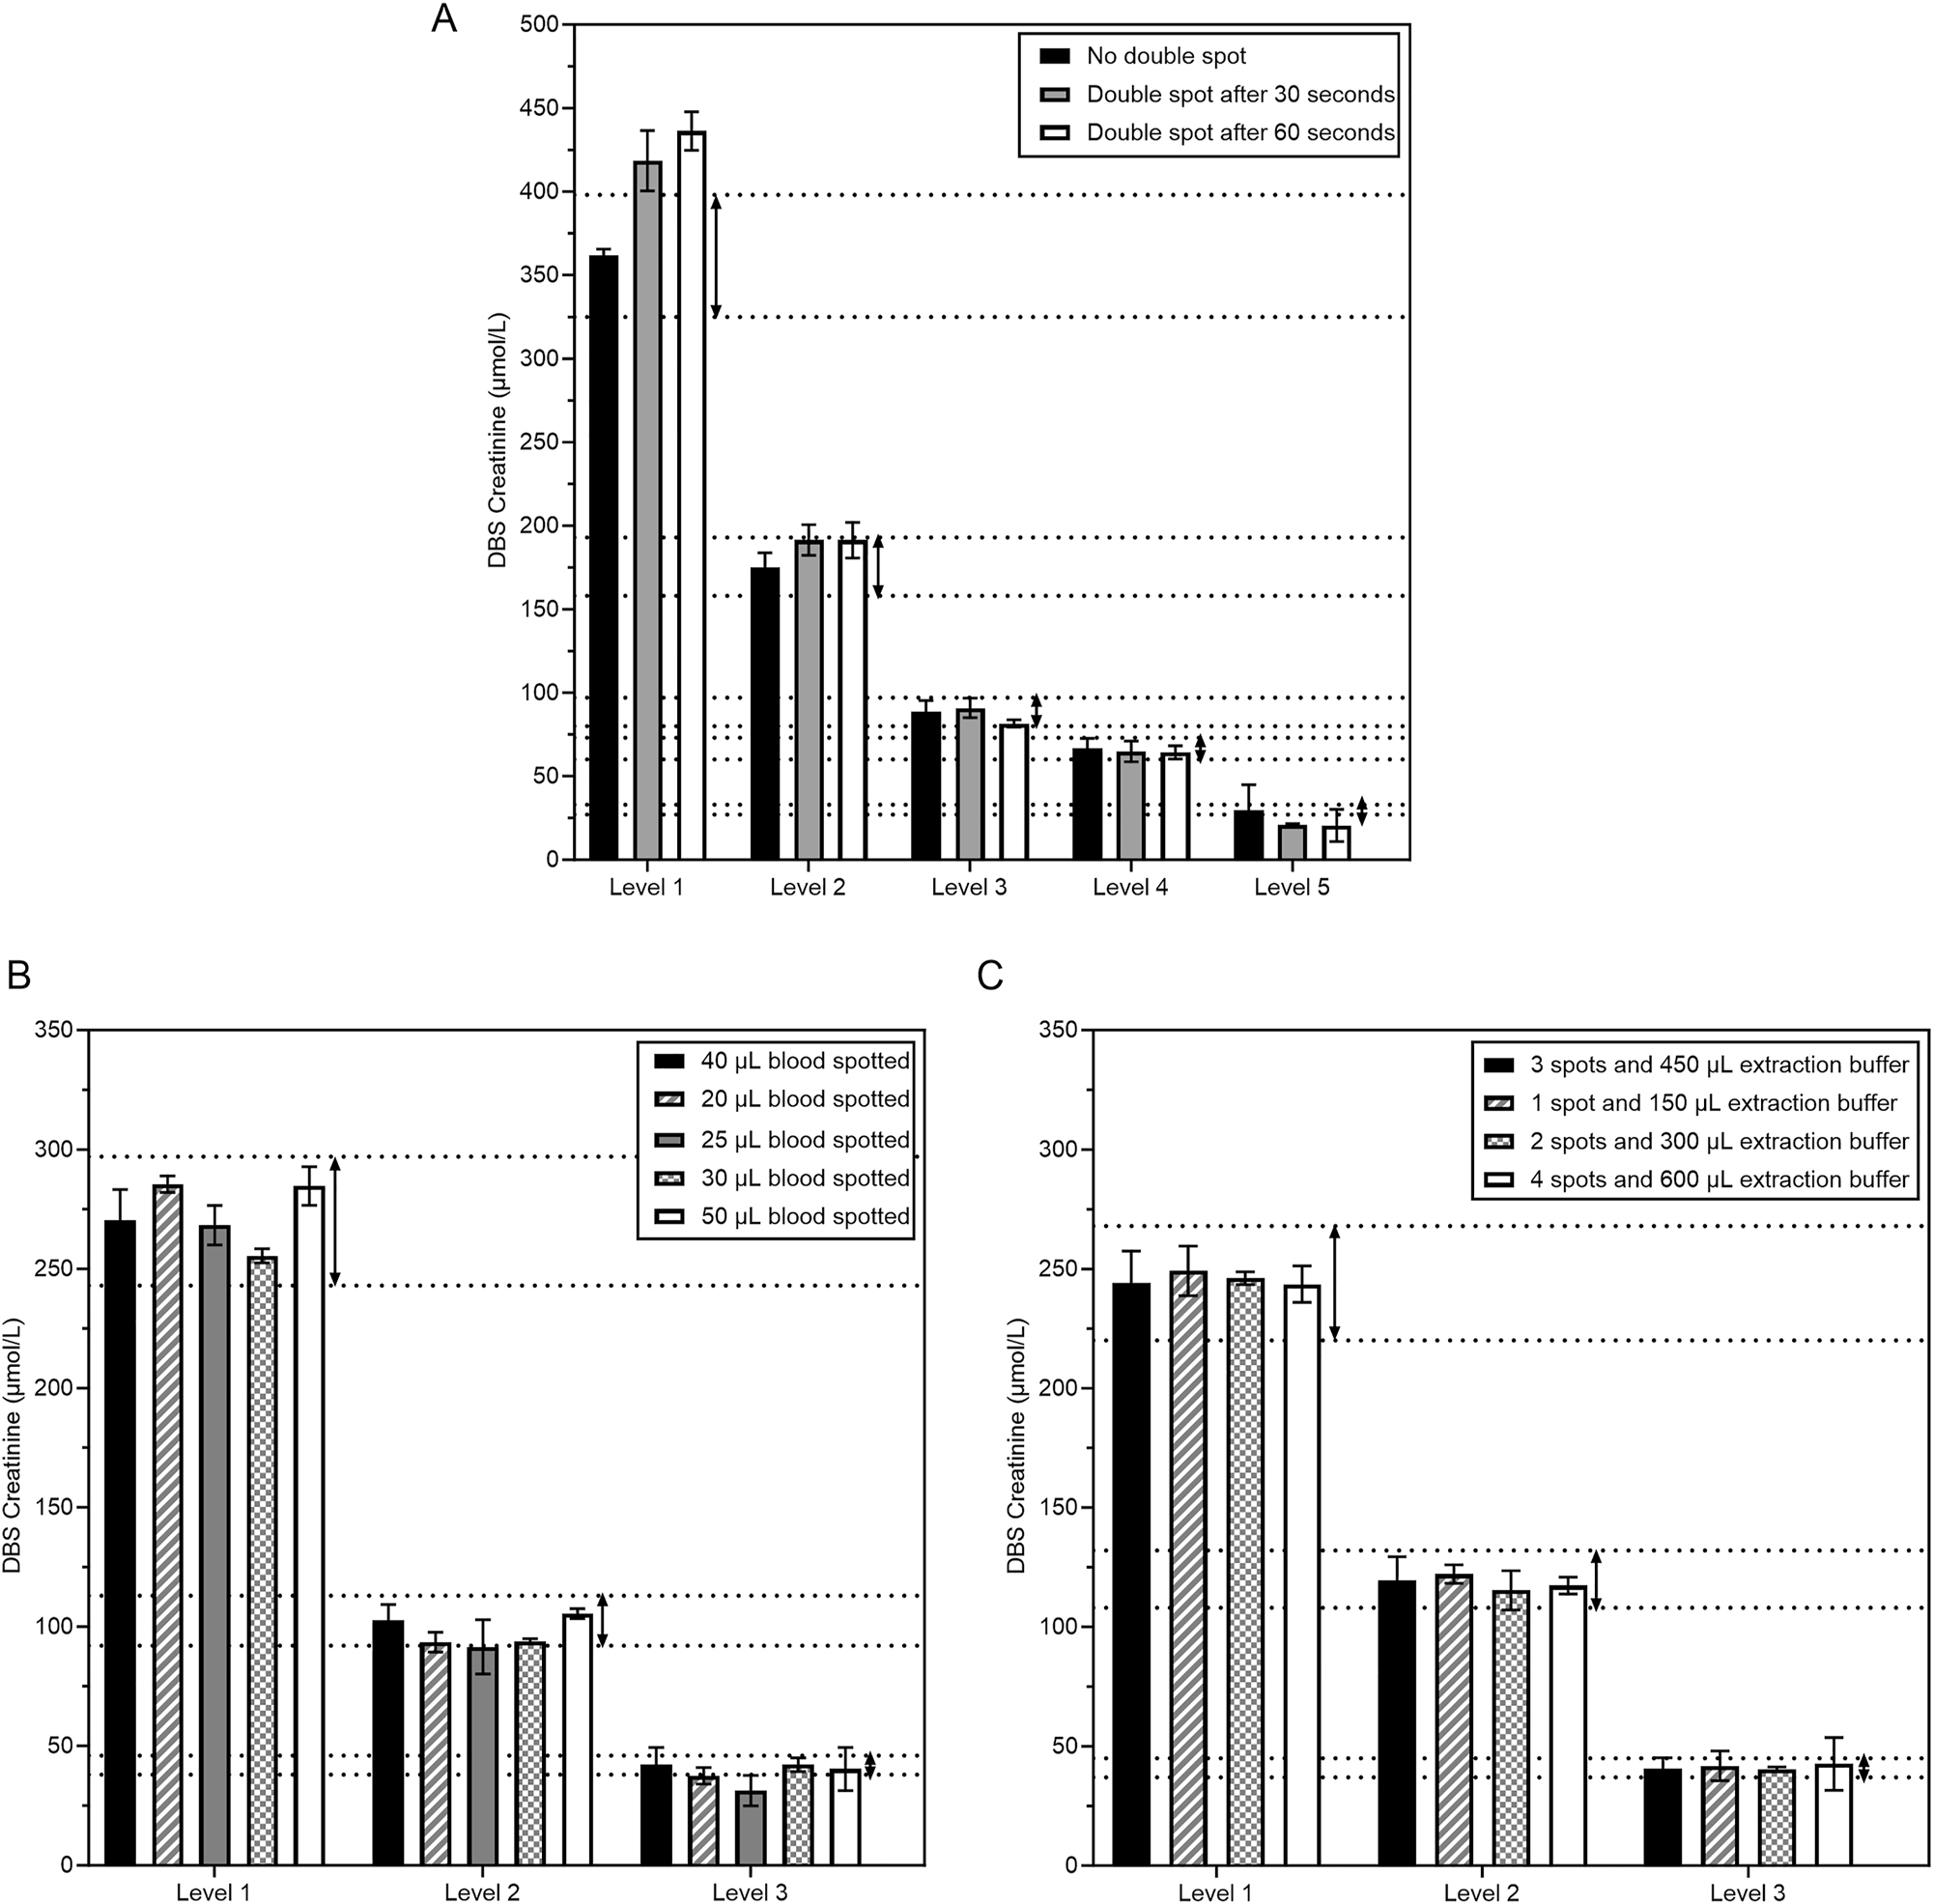
Spot effects on the concentration of creatinine from DBS. (A) Effect of double spotting. Dotted lines show the CLIA criterium of 10 % compared to the target value of the regular conditions (black bars). (B) Effect of volume of blood spotted. Five different blood volumes (20–50 µL) were spotted for three patients across the creatinine spectrum. (C) Effect of the number of spots with proportionate extraction buffer volume. 1, 2, 3, or 4 spots with 150 µL extraction buffer (PBS) per spot were extracted from three patient samples.
Discussion
Here we report the detection of creatinine from DBS using a high-throughput chemistry analyzer. Method comparison between DBS and plasma revealed good correlation for creatinine and eGFR and high positive and negative predictive values.
Since DBS measurements can be influenced by hematocrit [15], 16], we used Hct to correct creatinine concentrations measured from DBS. Lower plasma volume (i.e. higher Hct) appeared to result in lower creatinine concentrations, likely because creatinine is confined the plasma fraction. For correction, the formula based on creatinine levels within the reference range was used. While one could argue that a sigmoidal correction formula might enhance accuracy, the additional impact on results was clinically negligible. In the method comparison, Hct correction improved correlation between DBS and plasma creatinine with increased specificity.
To investigate stability of creatinine over time, we stored DBS cards for several days at various temperatures. Overall, we show that eGFR is stable within the 2–3 days that postcards should arrive in the laboratory. However, exposure to elevated temperatures during sample transport may result in falsely increased eGFR values. This possibility should be taken into account both during specimen transport and when interpreting results. Moreover, the use of a desiccant has been suggested to further enhance DBS stability [17].
This study has several limitations, the most significant being the limited evaluation of capillary calibration curve stability, which is essential for determining plasma-equivalent concentrations. Different creatinine reagent lots were used and each was calibrated to an isotope dilution mass spectrometry reference standard, according to the manufacturer’s instructions. QC was frequently performed for plasma creatinine, DBS creatinine, and DBS Hct. However, the commutability of DBS creatinine QC still requires improvement. The study period spanned several weeks, during which these assessments were consistently carried out. For future studies and diagnostic applications, QC from capillary finger-stick dried blood samples is recommended, as these are commutable, better ensure calibration stability, indicate when recalibration is needed, and maintain the integrity of the analysis.
It has to be noted that the calibration curves and sample types used in the precision and other validation experiments differ from those used in the method comparison study. As such, these experiments are not directly comparable, and this should be considered when interpreting the results.
Another limitation of this study is that markers such as inulin or iohexol correlate better with kidney function. Serum creatinine measurements to estimate GFR are therefore under debate [18]. However, no alternatives that circumvent the lengthy procedure with high costs and multiple measurements exist today. Therefore, eGFR based on serum creatinine, which is the clinical standard with a cheap and robust detection protocol, is a more valid approach.
Other DBS methods have been applied to creatinine with variable precision and scalability. When it comes to measuring creatinine in blood, three options are available: liquid chromatography-mass-spectrometry/mass spectrometry (LC-MS/MS), automated chemistry analyzer, and point of care (POC) devices. LC-MS/MS is more precise (with CVs ranging from below 4.4–14 %) [5], [6], [7], [8], but requires handling by highly trained technicians and is expensive. POC measurements are cheaper and easier to handle compared to LC-MS/MS. POC devices stand out for their quick results and are therefore suitable for emergency departments. Three different point-of-care (POC) creatinine analyzers demonstrated coefficients of determination (R2) ranging from 0.83 to 0.98. The 95 % limits of agreement for the absolute bias varied between −99 and 98 μmol/L with a mean bias of 0.3 μmol/L for the StatSensor to −43 to 43 μmol/L with a mean bias of 0.7 μmol/L for the epoc method [19], 20]. In comparison, our method achieved an R2 of 0.97 with 95 % limits of agreement for absolute bias ranging from −32 to 27 μmol/L, indicating similar performance and agreement. Overall, LC-MS/MS methods for measuring creatinine from DBS tended to exhibit narrower 95 % confidence intervals [5], [6], [7], [8].
A further limitation of this study is that imprecision is relatively high at low creatinine levels and imprecision exceeds CLIA thresholds at low concentration ranges. The lower limit of the DBS assay’s measuring range may need to be adjusted upward to meet CLIA performance criteria. Moreover, TEa is influenced by both imprecision and bias, and the poor performance at low concentrations is directly related to uncorrected (raw) creatinine results being at or below the original assay’s limit of quantitation. Therefore, this assay may have limited suitability for the precise quantification of low and low-normal creatinine concentrations. However, this limitation is unlikely to affect its clinical utility when applied to the detection or monitoring of impaired renal function, where creatinine levels are typically elevated. Finally, additional studies are warranted to evaluate robustness and stability under conditions involving self-sampling and postal transport.
Thus, we present a method that adds to the existing approaches of measuring creatinine in dried blood spots (DBS) by LC-MS/MS and measuring creatinine via POC testing, by offering a scalable and low-cost alternative with promising analytical performance under the tested conditions. An additional advantage of this method is its applicability in settings where LC-MS/MS is not available, thereby expanding access to creatinine testing in resource-limited environments. Previously, we established accurate measurements of thyroid stimulating hormone as well as C-reactive peptide [9], 10]. Moreover, excellent correlation between capillary and venous samples for over 30 analytes suggests many more potential targets for DBS extraction and measurement [21]. A single postcard with three to five blood droplets, requiring only a small sample volume, could enable minimally invasive, automated telediagnostic testing of multiple blood markers.
In conclusion, we showed that creatinine can be measured from DBS on an automated high-throughput chemistry analyzer, enabling correct classification of eGFR. This method may facilitate people to engage in sampling of blood (at home) on DBS for screening programs, patient follow-up, and medication management.
Funding source: Siemens Healthineers
-
Research ethics: This study was conducted according to the guidelines for Good Clinical Practice (GCP) and Declaration of Helsinki (2013, revised version). The study protocol was approved by the Institutional Review Board at our hospital (20–676/C-22-800/D-23U-0136).
-
Informed consent: Informed consent was obtained from all individuals included in this study.
-
Author contributions: The authors have accepted responsibility for the entire content of this manuscript and approved its submission.
-
Use of Large Language Models, AI and Machine Learning Tools: None declared.
-
Conflict of interest: The authors state no conflict of interest.
-
Research funding: None declared.
-
Data availability: The raw data can be obtained on request from the corresponding author.
References
1. Kashani, K, Rosner, MH, Ostermann, M. Creatinine: from physiology to clinical application. Eur J Intern Med 2020;72:9–14. https://doi.org/10.1016/j.ejim.2019.10.025.Suche in Google Scholar PubMed
2. Neto, R, Gooley, A, Breadmore, MC, Hilder, EF, Lapierre, F. Precise, accurate and user-independent blood collection system for dried blood spot sample preparation. Anal Bioanal Chem 2018;410:3315–23. https://doi.org/10.1007/s00216-018-0993-y.Suche in Google Scholar PubMed
3. Malsagova, K, Kopylow, A, Stepanov, A, Butkova, T, Izotov, A, Kaysheva, A. Dried blood spot in laboratory: directions and prospects. Diagnostics (Basel) 2020;10. https://doi.org/10.3390/diagnostics10040248.Suche in Google Scholar PubMed PubMed Central
4. Hill, NR, Fatoba, ST, Oke, JL, Hirst, JA, O’Callaghan, CA, Lasserson, DS, et al.. Global prevalence of chronic kidney disease – a systematic review and meta-analysis. PLoS One 2016;11. https://doi.org/10.1371/journal.pone.0158765.Suche in Google Scholar PubMed PubMed Central
5. Deprez, S, Van Uytfanghe, K, Stove, CP. Liquid chromatography-tandem mass spectrometry for therapeutic drug monitoring of immunosuppressants and creatinine from a single dried blood spot using the capitainer® qDBS device. Anal Chim Acta 2023;1242. https://doi.org/10.1016/j.aca.2023.340797.Suche in Google Scholar PubMed
6. Koster, RA, Greijdanus, B, Alffenaar, JWC, Touw, DJ. Dried blood spot analysis of creatinine with LC-MS/MS in addition to immunosuppressants analysis. Anal Bioanal Chem 2015;407:1585–94. https://doi.org/10.1007/s00216-014-8415-2.Suche in Google Scholar PubMed
7. Mathew, BS, Mathew, SK, Aruldhas, BW, Prabha, R, Gangadharan, N, David, VG, et al.. Analytical and clinical validation of dried blood spot and volumetric absorptive microsampling for measurement of tacrolimus and creatinine after renal transplantation. Clin Biochem 2022;105–106:25–34. https://doi.org/10.1016/j.clinbiochem.2022.04.014.Suche in Google Scholar PubMed
8. Torres, C, Muldrow, RA, Naranjo, AR, Cotton, SW, Pierre, CC, Greene, DN. Development and validation of an LC-MSMS method to quantify creatinine from dried blood spots. J of Mass Spec and Adv in the Clin Lab 2024;32:50–9. https://doi.org/10.1016/j.jmsacl.2024.03.001.Suche in Google Scholar PubMed PubMed Central
9. Schakelaar, MY, Lentjes, EGWM, Visser, TSQ, Schoneveld, AH, Hoefer, IE, Tiel Groenestege, WM. A preliminary analysis of thyrotropin measurement from finger stick dried blood spot with an automated high-throughput immunoassay analyzer. Thyroid 2023;33:449–55. https://doi.org/10.1089/thy.2022.0453.Suche in Google Scholar PubMed
10. Schakelaar, MY, Kemperman, H, Schoneveld, AH, Hoefer, IE, Tiel Groenestege, WM. Analysis of C-reactive protein from finger stick dried blood spot to predict high risk of cardiovascular disease. Sci Rep 2023;13. https://doi.org/10.1038/s41598-023-27522-6.Suche in Google Scholar PubMed PubMed Central
11. Oostendorp, M, El Amrani, M, Diemel, EC, Hekman, D, Van Maarseveen, EM. Measurement of hematocrit in dried blood spots using near-infrared spectroscopy: robust, fast, and nondestructive. Clin Chem 2016;62:1534–6. https://doi.org/10.1373/clinchem.2016.263053.Suche in Google Scholar PubMed
12. Levey, AS, Stevens, LA, Schmid, CH, Zhang, Y, Castro, AF, Feldman, HI, et al.. A new equation to estimate glomerular filtration rate. Ann Intern Med 2009;150:604–12. https://doi.org/10.7326/0003-4819-150-9-200905050-00006.Suche in Google Scholar PubMed PubMed Central
13. Delanaye, P, Schaeffner, E, Cozzolino, M, Langlois, M, Plebani, M, Ozben, T, et al.. The new, race-free, chronic kidney disease epidemiology consortium (CKD-EPI) equation to estimate glomerular filtration rate: is it applicable in Europe? A position statement by the European federation of clinical chemistry and laboratory medicine (EFLM). Clin Chem Lab 2023;61:44–7. https://doi.org/10.1515/cclm-2022-0928.Suche in Google Scholar PubMed
14. Lemoine, S, Rouveure, AC, Dubourg, L, Pelletier, S, Marolho, C, Decullier, E, et al.. Point of care creatinine derived eGFR measurement in capillary blood for identifying patients at risk. Pract Lab Med 2022;31. https://doi.org/10.1016/j.plabm.2022.e00296.Suche in Google Scholar PubMed PubMed Central
15. Velghe, S, Delahaye, L, Stove, CP. Is the hematocrit still an issue in quantitative dried blood spot analysis? J Pharm Biomed Anal 2019;163:188–96. https://doi.org/10.1016/j.jpba.2018.10.010.Suche in Google Scholar PubMed
16. McClendon-Weary, B, Putnick, DL, Robinson, S, Yeung, E, Little to Give. Much to gain–what can you do with a dried blood spot? Curr Environ Health Rep 2020;7:211–21. https://doi.org/10.1007/s40572-020-00289-y.Suche in Google Scholar PubMed PubMed Central
17. Flores, SR, Hall, EM, De Jesús, VR. Glucose-6-phosphate dehydrogenase enzyme stability in filter paper dried blood spots. Clin Biochem 2017;50:878–81. https://doi.org/10.1016/j.clinbiochem.2017.05.003.Suche in Google Scholar PubMed PubMed Central
18. Delanaye, P, Ebert, N, Melsom, T, Gaspari, F, Mariat, C, Cavalier, E, et al.. Iohexol plasma clearance for measuring glomerular filtration rate in clinical practice and research: a review. Part 1: how to measure glomerular filtration rate with iohexol? Clin Kidney J 2016;9:682–99. https://doi.org/10.1093/ckj/sfw070.Suche in Google Scholar PubMed PubMed Central
19. Nataatmadja, M, Fung, AWS, Jacobson, B, Ferera, J, Bernstein, E, Komenda, P, et al.. Performance of StatSensor point-of-care device for measuring creatinine in patients with chronic kidney disease and postkidney transplantation. Can J Kidney Health Dis2020;7:1–10.https://doi.org/10.1177/2054358120970716.Suche in Google Scholar PubMed PubMed Central
20. Van der Heijden, C, Roosens, L, Cluckers, H, Van Craenenbroeck, AH, Peeters, B. Analytical and clinical performance of three hand-held point-of-care creatinine analyzers for renal function measurements prior to contrast-enhanced imaging. Clin Chim Acta 2019;497:13–9. https://doi.org/10.1016/j.cca.2019.06.025.Suche in Google Scholar PubMed
21. Doeleman, MJH, Koster, AF, Esseveld, A, Kemperman, H, Swart, JF, De, RS, et al.. Comparison of capillary finger stick and venous blood sampling for 34 routine chemistry analytes: potential for in hospital and remote blood sampling. Clin Chem Lab Med 2025;63:747–52. https://doi.org/10.1515/cclm-2024-0812.Suche in Google Scholar PubMed
Supplementary Material
This article contains supplementary material (https://doi.org/10.1515/cclm-2025-0979).
© 2025 the author(s), published by De Gruyter, Berlin/Boston
This work is licensed under the Creative Commons Attribution 4.0 International License.