Confirmatory factor analysis of 2 versions of the Brief Pain Inventory in an ambulatory population indicates that sleep interference should be interpreted separately
-
David M. Walton
 ,
Joseph Putos
,
Joseph Putos

Abstract
Background
The Brief Pain Inventory (BPI-SF) is a widely-used generic pain interference scale, however its factor structure remains unclear. An expanded 10-item version of the Interference subscale has been proposed, but the additional value of the 3 extra items has not been rigorously evaluated. The purpose of this study was to evaluate and contrast the factorial and concurrent validity of the original 7-item and 10-item versions of the BPI-SF in a large heterogeneous sample of patients with chronic pain.
Methods
Exploratory and confirmatory factor analyses were conducted on independent subsets of the sample, and concurrent correlations with scales capturing similar constructs were evaluated.
Results
Two independent exploratory factor analyses (n = 500 each) supported a single interference factor in both the 7- and 10-item versions, while confirmatory factor analysis (N =1000) suggested that a 2-factor structure (Physical and Affective) provided better fit. A 3-factor model, where sleep interference was the third factor, improved in model fit further. There was no significant difference in model fit between the 7- and 10-item versions. Concurrent associations with measures of general health, pain intensity and pain-related cognitions were all in the anticipated direction and magnitude and were not different by version of the BPI-SF.
Conclusions and implications
The addition of 3 extra items to the original 7-item Interference subscale of the BPI-SF did not improve psychometric properties. The combined results lead us to endorse a 3-factor structure (Physical, Affective, and Sleep Interference) as the more statistically and conceptually sound option.
1 Introduction
Recent years have seen a rapid development in the number of Patient-Reported Outcome (PRO) instruments. Understanding the conceptual domain and integrity of PROs is fundamental to their validity. Some musculoskeletal PROs are designed to focus on symptoms and function related to health conditions affecting specific body regions, examples include the Neck Disability Index [1] or Roland Morris Low Back Disability Questionnaire [2]. Others are generic PROs that focus on a particular symptom regardless of the region or condition. Examples of generic scales include the Brief Pain Inventory [3] or Pain Disability Index [4]. It is generally assumed that region-specific scales offer better sensitivity to change in a particular region, but being only relevant to that specific body region prevents the ability to compare function or interference across regions.
The short-form Brief Pain Inventory (BPI-SF) was developed by the World Health Organization’s Cancer Pain Working Group [3].lt is a 9-item questionnaire that includes measures of self-perceived intensity of cancer-related pain symptoms (4 items), 4 qualitative questions including pain location, medication usage and magnitude of relief, and a 9th item divided into 7 sub-domains of resultant interference across 7 domains of function including normal work, sleep, and walking ability. Its simplicity and broad applicability has led to translation into several languages and application across a variety of conditions including neuromuscular [5,6] and musculoskeletal disorders [7,8]. Despite its ubiquity, some measurement properties of the BPl-SF remain unclear, primarily with respect to its factor structure. There is general consensus that the Severity subscale and the Interference subscales are unique domains. However, the unidimensional nature of the lnterference subscale remains debated, with some author groups endorsing a single Interference factor [9,10] while others endorse a 2-factor (Physical and Affective) Interference structure [9,11,12]. The axioms of quantitative measurement as proposed by Luce and Tukey [13] require that a tool measure a single construct in order to make scale scores interpretable. lf the BPl-SF does include a multifactor lnterference subscale than summative scoring may be inappropriate or may mask important changes in one domain when others are stable.
The majority of work on the properties of the BPI-SF has been conducted using the original 7-item version of the interference subscale in samples including palliative care patients with HIV/AIDS [14], cerebral palsy [15], and post-surgical populations [16. Tyler et al. [15] proposed an expansion that added 3 items to the interference subscale (social activities, recreational activities, self-care). The additional items were intended to prevent floor effects, enhance content validity, and provide a more holistic evaluation of pain-related interference in patients with a wide variety of pain conditions. The expanded 10-item version of the BPl-SF lnterference subscale has yet to undergo rigorous scrutiny of its psychometric properties despite its use in some large-scale population-based cohort studies such as the N = 5000 + Quebec Pain Registry (QPR, www.quebecpainregistry.com). This has offered a unique opportunity to explore the properties of the expanded tool, and to conduct independent analyses of the 7-item version in a large sample of ambulatory, community-dwelling patients with mixed chronic pain conditions. The purposes of this study were to explore and contrast the factor structure and concurrent validity of the original 7-item BPl-SF lnterference subscale and the 10-item version using the large, heterogeneous QPR patient database.
2 Methods
Data were obtained from the Quebec Pain Registry (QPR) database project. The QPR is a province-wide administrative and research database which provides standardize data on a large cohort of chronic pain patients referred to tertiary care pain clinics. Participants’ phenotypes are described using a set of common demographic and clinical measures based on uniform and validated measurement tools. Data were provided for 5654 participants recruited from 5 tertiary-care speciality pain clinics between October 2008 and December 2013. The QPR project was jointly funded by the Quebec Pain Research Network and the Quebec Ministry of Health. Patients were referred to the clinics from their primary care physician after failing conservative treatment such as standard pharmaceutical or non-medical rehabilitation approaches. All participants completed a battery of self-report questionnaires administered by a trained research nurse at intake. Participants in the database were at least eighteen years of age and could speak and understand conversational French or English. All data were de-identified prior to being stored in the database. Access to the database was granted following review by the Quebec Pain Research Network and the Institutional Review Board at Western University (London, Ontario).
The following tools were collected at intake and 6-month follow up. All tools were available in both English and French-Canadian versions using the appropriately validated versions of each:
A demographics questionnaire that captured data including sex, age, cause and duration of symptoms, medicolegal and compensation status, work status, ethnicity, educational attainment, marital status, medication use, and household income.
The 10-item Brief Pain Inventory Interference subscale [3], a self-report questionnaire that captures pain related interference across 10 generic domains including recreational activity, work and enjoyment of life.
The Medical outcomes survey short form-12 (SF-12), a 12- item generic health status measure that provides a variety of subscales including bodily pain, vitality, and general health. It provides two component summary health scales, a physical component (PCS) and a mental component (MCS) score. It is one of the most widely used health status measures and enjoys considerable support as a psychometrically sound measurement tool [17].
The Pain Catastrophizing Scale (PCat), a 13-item self-report tool that captures the construct of exaggerated negative cognitive orientation towards pain [18]. It has demonstrated consistent ability to predict pain related outcomes following medical or nonmedical intervention [19,20]. Rasch analysis has shown that it also functions well as a linear indication of pain catastrophizing in musculoskeletal pain [21].
The Beck Depression Inventory-Il (BDI-II), a revised version ofthe original BDl intended to be concordant with the new diagnostic criteria of major depression in the DSM-IV. It has been studied extensively, with Wang and Gorenstein recently synthesizing data from 70 unique evaluations [22]. Overall it demonstrates strong evidence of reliability and validity across a wide range of medical conditions.
Three numeric rating scales for pain intensity; one for current pain, one for average pain and one for worst pain over the past 7 days. The numeric rating scale has demonstrated adequate reliability and sensitivity to change in many different pain conditions [23].
Treatment decisions were made at the discretion of the clinician and were not influenced by the Quebec pain network.
3 Analysis
The data were checked for fidelity by a QPR-associated research nurse before being sent to our group. The database was subsequently explored for missing or extreme values that required checking. Missing values were replaced by the mean of the scale when ≤10% (1 item) of values were missing. Scale scores with >10% of missing values were removed. In pre-analysis data normality was checked using the Kolmogorov-Smirnov test and visual inspection of response frequency histograms. Three items showed stronger than expected bimodal response frequencies with >20% zero responses that could not be easily reconciled. To avoid spurious findings due to this unexpected response distribution that would not have otherwise lent itself to CFA we constructed regression equations for each of the 3 items, using the remaining items to mathematically predict their response. Cases were removed when the regression equation predicted a score at least 4/10 or greater on that item despite an observed score of 0. Doing so led to removal of 1658 cases and resolved the strong bimodality. Remaining responses showed statistically significant but not visually severe negative skew that deviated from normality on all BPl-SF items that could not be corrected through square-root or logit transformation. Non-parametric tests of association were therefore used as appropriate.
lnter-item correlations were evaluated using Spearman’s rho statistic. lnter-item correlations >0.9 were ear-marked for possible redundancy or multicollinearity. Response distribution to each item on the BPl-SF was calculated descriptively (mean, standard deviation, range). Randomly drawn subsamples of the full database were used to avoid incorrect attributions of statistical associations or differences by virtue of sample size. Where needed, random sub-samples were drawn using the SPSS random sample function. One random draw of 500 subjects was extracted for exploratory factor analysis (EFA). EFA was conducted using maximum likelihood estimation, first without rotation, and second allowing oblique rotation (assuming some covariance between factors). Horn’s parallel analysis technique [24] determined the number of factors extracted based on eigenvalues. Internal consistency for identified factors was calculated using Cronbach’s a, where a value >0.7 was considered acceptable [25]. This process was repeated in a second independent random sample of 500 responses for verification.
Confirmatory factor analysis was then undertaken using a third independent random sample of N =1000 responses using MPlus software (v6.12, Muthen & Muthen). Four separate models were tested: (1) The base model (10-item interference subscale with a single factor); (2) the 10-item interference subscale with 2 factors: Affective (items 2, 5, 6, 7, and 8) and Physical (items 1, 3, 4, 9 and 10) interference; (3) the original 7-item interference subscale with a single factor; (4) the 7-item interference subscale with 2 factors. Model fit was evaluated through interpretation of the following goodness-of-fit indicators (with thresholds of acceptability in parentheses): comparative fit index (CFl, ≥0.90), Tucker-Lewis index (TLl, ≥0.90), Root mean square error of approximation (RMSEA, < 0.10). The X2 value and associated significance level was calculated but was a priori expected to be inflated by virtue of a large sample size. Change in X2 by change in degrees of freedom (ΔX2/Δ) was used to determine the significance of change in model fit for each model in comparison to its base, as described by Atkinson et al. [11].
Concurrent validity (with hypotheses in parentheses) for the base model and subscales was tested through cross sectional correlations with the SF-12 physical (PCS) and mental (MCS) component scores (moderate negative correlation), the PCat (moderate positive correlation), the BDl-ll (weak positive correlation) and mean Pain intensity NRS (strong positive correlation). Bootstrapping (n = 1000 samples randomly drawn with replacement) with calculation of 95% confidence interval was conducted where required for statistical comparison of correlation coefficients with the criterion measures between the 10- and 7-item versions of the scale. For all analyses, a p value < 0.05 was considered statistically significant for purposes of this exploratory study, accepting an increased risk of alpha error in favour of avoiding beta error. Unless otherwise specified, analyses were conducted in SPSS v. 21 (lBM Corp.).
4 Results
The initial database for this analysis included 3996 subjects, of which 63 had 2 or more missing responses and were removed. A further 27 had a single missing response replaced by the mean. The remaining database therefore included 3933 subjects with complete baseline data and reasonably Gaussian response distributions. Table 1 provides the descriptive statistics of the sample as a whole, and the 2 random draws (1 × n = 1000 for EFA, 1 × n = 1000 for CFA) used for the factor analytic procedures. Table 2 provides the distribution of sample responses for all subjects. Inter-item correlations revealed no concerns with redundancy. The strongest correlation was between item 9 (recreational activities) and item 10 (social activities) at ρ = 0.79.
Both random draws of n = 500 provided strong confidence in sampling adequacy (Keiser-Meier-Olkin statistic = 0.93) and deviation from sphericity (Bartlett’s test p <0.01). In both random draws, a single factor was extracted with similar factor loadings for each item, all =0.32. The single factor explained 67.1% and 65.1% of variance, respectively. Cronbach’s alpha in both cases was α = 0.94.
Table 3 provides the goodness of fit indices for the CFA analyses. The base model (10 items, single factor) showed generally poor fit indicators, none of which met a priori criteria for acceptability. The 2-factor physical and affective interference model of the 10-item interference scale showed significant improvement in model fit, with CFI (0.94) and TLI (0.92) surpassing the acceptability threshold, but the RMSEA (0.12) remaining in the unacceptable range. As anticipated given the large sample, all x2 values were statistically significant. Of the three additional items of the expanded version, two loaded on the Physical Interference subscale (recreational activities and social activities) and one loaded on the Affective Interference subscale (self-care).
Characteristics of the overall sample and the subsamples drawn at random for two independent CFAs. The 2 CFA cohorts are fully independent random samples of the overall database. CFA, cohorts drawn for the Confirmatory Factor Analysis.
| Sample | Overall | Factor analysis | |
|---|---|---|---|
| N = 3933 | N = 1000(for EFA) | N = 1000(for CFA) | |
| Sex (%F) | 57% | 56 | 58 |
| Age (range, SD) | 54(18-95,14) | 54(20-94,14) | 54(18-95,14.5) |
| Work status | |||
| Currently working | 55.9% | 56.6% | 55.9% |
| Not currently working | 44.1% | 43.4% | 44.1% |
| Median duration of symptoms in months (range, SD) | 42(0-780, 104.5) | 42(0-720,111.5) | 48(0-648, 106.0) |
| Illness incl. cancer | 24.3% | 26.0% | 25.1% |
| Trauma/injury | 38.0% | 35.0% | 37.0% |
| Surgery/procedural | 10.4% | 10.7% | 9.6% |
| Other | 27.0% | 28.1% | 28.8% |
Descriptive statistics of sample responses to the 10 BPl-SF Interference items for all subjects in the database.
| Item | Mean | Median | SD | Range |
|---|---|---|---|---|
| 1. General activit | 6.6 | 7.0 | 2.6 | 0–10 |
| 2. Mood | 5.9 | 6.0 | 2.8 | 0–10 |
| 3. Walking ability | 5.9 | 6.0 | 3 | 0–10 |
| 4. Normal work | 6.8 | 7.0 | 2.8 | 0–10 |
| 5. Relations with people | 5.2 | 5.0 | 3.0 | 0–10 |
| 6. Sleep | 6.2 | 7.0 | 3.0 | 0–10 |
| 7. Enjoyment of life | 5.4 | 6.0 | 3.2 | 0–10 |
| 8. Self-care | 4.6 | 5.0 | 3.0 | 0–10 |
| 9. Recreational activities | 6.9 | 8.0 | 3.0 | 0–10 |
| 10. Social activities | 6.1 | 7.0 | 3.2 | 0–10 |
Goodness of fit indicators of the 6 different confirmatory factor analysis models. Ratio is calculated as Δχ2/Δdf; CFI, Comparative Fit Index; TLI, Tucker Lewis Index; RMSEA, Root Mean Square Error of Approximation; df, degrees of freedom; Δχ2/Δdf, change in chi square by change in degrees of freedom.
| Model | CFI | TLI | RMSEA (95%CI) | χ2(p) | df | Ratio (df) | p |
|---|---|---|---|---|---|---|---|
| 10-item subscale | |||||||
| Base 1-factor | 0.89 | 0.86 | 0.15(0.14, 0.16) | 841.5 (<0.01) | 35 | N/A | N/A |
| 2-Factor | 0.94 | 0.92 | 0.12(0.11,0.13) | 508.3 (<0.01) | 34 | 333.2(1) | <0.011 |
| 2-Factor without sleep | 0.94 | 0.92 | 0.12(0.11,0.13) | 494.7 (<0.01) | 33 | 13.6(1) | <0.012 |
| 7-item subscale | |||||||
| Base 1-factor | 0.92 | 0.88 | 0.17(0.15, 0.18) | 403.4 (<0.01) | 14 | 20.9(21) | 0.471 |
| 2-Factor | 0.99 | 0.98 | 0.07 (0.05, 0.09) | 78.8 (<0.01) | 13 | 324.6(1) | <0.013 |
| 20.5 (21) | 0.494 | ||||||
| 2-Factor without sleep | 0.99 | 0.98 | 0.06 (0.05, 0.08) | 56.7(<0.01) | 12 | 22.1 (1) | <0.015 |
| 20.9(21) | 0.476 |
-
The numbers in bold are significance (p) relates to the comparison of fit indicators for the current(k clusters) model compared to the k–1 model.
-
1 p value calculated in comparison to the base 10-item, 1-factor model.
-
2 p value calculated in comparison to the 10-item, 2-factor model.
-
3 p value calculated in comparison to the base 7-item, 1-factor model.
-
4 p value calculated in comparison to the 10-item, 2-factor model.
-
5 p value calculated in comparison to the 7-item, 2-factor model.
-
6 p value calculated in comparison to the 10-item, 2-factor without sleep model.
Model fit of the expanded 10-item scale was compared against that of the original 7-item interference scale. The fit indicators of the base (single-factor) model were statistically similar (χ2/df=20.9 (21 df), p = 0.47). As with the 10-item subscale, the 2-factor model of the 7-item scale showed significant improvement over the base model (χ2/df= 324.6 (1 df), p <0.01) and was not significantly different from the same 2-factor model using all 10 items. The 2-factor structure of the 7-item subscale was the first model to satisfy all a priori criteria for goodness-of-fit (CFI = 0.99, TLI = 0.98, RMSEA = 0.07). Fig. 1 shows the path coefficients for the 2-factor solutions of the 10- and 7-item CFA models. In both models, the sleep interference item had the lowest path coefficient and highest error (residual) term. Using theoretical rationale (that sleep is conceptually distinct from waking activity), a third model was tested in which the sleep interference item was considered to represent a third latent construct unto itself. This required constraining the path coefficient to 1.0 and error variance to 0 for this single item to allow model identification to occur. In both the 10- and 7-item versions this 3-factor structure led to additional significant improvement in model fit (χ2/df (df) < 0.01 in both) over the respective 2-factor model, while not being significantly different between the two versions. In terms of absolute goodness-of-fit indices, only the 7-item 3-factor version satisfied our a priori criteria for acceptability (CFI = 0.99, TLI = 0.98, RMSEA=0.06).
Table 4 provides the results of the cross-sectional convergent and divergent validity testing using the full sample of 3933 responses including 95% confidence intervals through bootstrapping. The magnitude and direction of each association were congruent with our a priori hypotheses, and were congruent with the nature of each subscale. For example, the association between the BPI-SF Affective Interference subscale and the SF-12 Mental Component Score was moderate in magnitude and negative in direction (r = –0.61, 95%CI –0.59 to –0.63) and significantly stronger than the association between the same SF-12 Mental Component Score and the Physical Interference BPI-SF subscale (r = –0.50, 95%CI –0.48 to –0.53). As would be anticipated, the opposite association was found for the SF-12 Physical Component Score subscale. Similarly, the associations between the BPI-SF Affective Interference subscale and both of the cognitively-oriented PCat and the BDI- II were positive and moderate, stronger than the associations of the same criterion measures with the BPI-SF Physical Interference subscale.
Table 4 also provides the same estimates of association with each of the criterion measures and the BPI-SF-7 item version. In each case, the estimates of association between the criterion and the full 7-item scale are nearly identical to those ofthe 10-item scale and did not fall outside of the respective 95% confidence intervals of its 10-item analog. No criterion-related association was different by greater than r = 0.05 points for the 7-item scale compared to its 10-item analog.
Cross-sectional correlations between the two versions of the BPI-SF Interference scale (10- and 7-item) and its subscales (Physical, Affective and Sleep Interference). All values are Spearman's rho correlation coefficients.
| BPI-10 Full | BPI-10 Physical | BPI-10 Affective | BPI-7 Full | BPI-7 Physical | BPI-7 Affective | Sleep | |
|---|---|---|---|---|---|---|---|
| SF12-PCS | –0.50** | –0.51** | –0.43** | –0.49** | –0.49** | –0.43** | –0.33** |
| (–0.47 to | (–0.49 to | (–0.41 to | (–0.46 to | (–0.47 to | (–0.40 to | (–0.30 to | |
| –0.53) | –0.55) | –0.47) | –0.52) | –0.53) | –0.46) | –0.37) | |
| SF12-MCS | –0.58** | –0.50** | –0.61** | –0.58** | –0.45** | –0.61** | –0.40** |
| (–0.57 to | (–0.48 to | (–0.59 to | (–0.56 to | (–0.43 to | (–0.59 to | (–0.37 to | |
| –0.61) | –0.53) | –0.63) | –0.60) | –0.48) | –0.63) | –0.43) | |
| PCS | 0.56** | 0.49** | 0.58** | 0.57** | 0.48** | 0.57** | 0.37** |
| (0.54–0.59) | (0.47–0.52) | (0.56–0.60) | (0.54–0.59) | (0.45–0.50) | (0.54–0.59) | (0.34–0.40) | |
| NRS | 0.67** | 0.64** | 0.64** | 0.69** | 0.66** | 0.63** | 0.54** |
| 0.65–0.69) | (0.62–0.66) | 0.62–0.66) | (0.67–0.71) | (0.64–0.68) | (0.61–0.65) | (0.52–0.57) | |
| BDI-II | 0.59** | 0.51** | 0.62** | 0.59** | 0.46** | 0.61** | 0.44** |
| (0.57–0.61) | (0.49–0.53) | (0.60–0.64) | (0.57–0.61) | (0.44–0.49) | (0.59–0.63) | (0.41–0.46) |
-
** p < 0.01
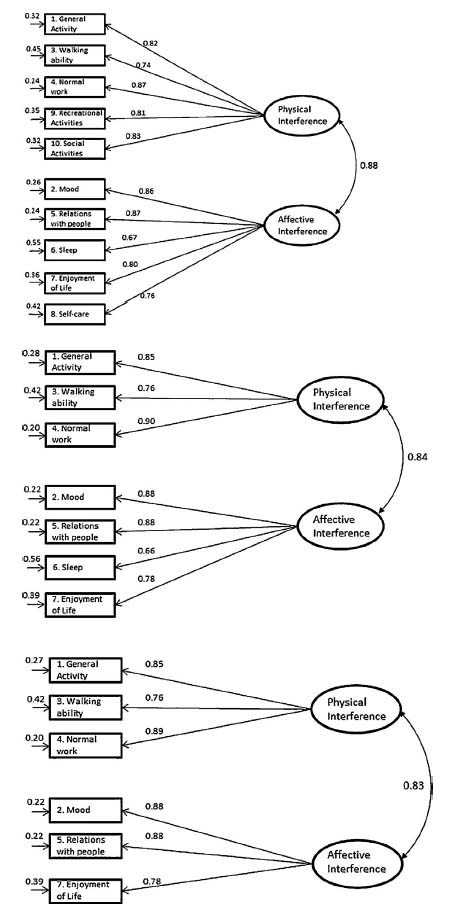
Path coefficients of 3 best-fit confirmatory factor analysis models. Top: 2- factor solution of 10-item Interference subscale: middle: 2-factor solution of 7-item Interference subscale: bottom: 3-factor solution of 7-item Interference subscale.
5 Discussion
The results of this study provide no statistical evidence for superiority of the expanded 10-item version over the original 7-item version of the Interference subscale of the BPI-SF. In contrast, the 7-item version appears to be more robust than that of the 10-item version based on the results of confirmatory factor analysis. The nearly identical cross-sectional correlations further indicate that the additional burden associated with answering 3 more items is not balanced by additional information gained.
There is little agreement in the clinical and empirical literature regarding the factor structure of the Interference subscale. Tan et al. [10] used exploratory factor analysis in a sample of 440 subjects with chronic noncancer pain to find support for a single factor. Using CFA, Lapane et al. [9] evaluated the factor structure of the 7-item version of the BPI-SF in 687 subjects with noncancer pain,and found adequate fit when the lnterference subscale was considered either a single factor or as separate Physical and Affective subscales. Atkinson et al. [11] similarly used CFA in a sample of 364 people with HlV/AlDS or cancer pain. They also found that the lnterference subscale of the BPl-SF provided adequate model fit when considered either a single factor or two factors. While Lapane et al. endorsed the single factor model for reasons of parsimony, Atkinson et al. endorsed the 2-factor model for statistical and conceptual reasons. Decisions regarding the most appropriate factor structure should be based on more than just statistics; conceptual and pragmatic reasons are salient considerations. Conceptually, it appears reasonable to consider mood, relations with other people, and enjoyment of life as distinct from general activity, walking ability, and normal work, with sleep interference representing a domain unto itself. As such we endorse a 3-factor model as the most statistically and conceptually sound.
The structural ambiguity highlights challenges inherent in psychometric analyses using approaches drawn from Classical Test Theory. Critics of CTT point to the necessary inclusion of an unobservable random error term that can be neither proven nor refuted as a notable weakness of such approaches [26,27]. From a pragmatic perspective, the structural ambiguity may have some benefit - users can arguably interpret either the full composite score when granularity is not necessary or can interpret the subscales individually for greater depth of understanding. However, it does pose statistical problems. While composite scores or ‘indices’ from multidimensional tools may be useful when purely descriptive statistics are desired, the application of inferential statistics may not be appropriate. Such conflation violates one of the primary axioms of quantitative measurement [13], that measurement tools should quantify only a single construct. While the degree to which this violation leads to spurious findings is debatable, it is problematic from a conceptual perspective. That is, inclusion of two or more constructs in a single scale risks masking improvement in one subscale if the other is stable or worsens. As a concrete example, it is conceivable that physical rehabilitation would improve Physical Interference scores at a faster rate than Affective Interference. By including both in the same summative score, the relatively greater improvement in one is buffered by stability in the other, potentially limiting overall scale responsiveness.
Detailed comparison of our results with those of previous findings from CFA reveals similarities and differences in path coefficients. Atkinson et al. [11] found identical path coefficients amongst their sample of ambulatory people for the items ‘interference with general activity’ (β = 0.85), ‘sleep’ (β = 0.66) and ‘enjoyment of life’ (β = 0.78), offering evidence of condition invariance forthose items. Lapane et al. [9] presented the path coefficients for the single factor lnterference subscale only, which were generally in agreement with our findings with the exception of the sleep item (β = 0.67 here vs. 0.85). This group also found evidence of variance across patient conditions for the sleep, relations with other people, and work items. ln the current analysis we did not consider clinical subgroups, but recognize the need for consideration of differential item functioning in future using Rasch-based modelling. This analysis has been reported in a companion paper [28] that similarly identified the sleep item as statistically misfitting while the remaining 6 items were best interpreted as 2 separate subscales. Similar results coming from two very different statistical approaches in independent samples strengthen our confidence in the validity of these findings.
While the BPl-SF is considered a generic pain interference scale, it does include items that may pose conceptual challenges in more specific contexts. Mendoza and colleagues [7] found that missing data on the interference scale was common, in particular the ‘enjoyment of life’ and ‘relations with others’, in their sample of people immediately following median sternotomy. Radbruch et al. [29] found that elderly cancer patients most frequently omitted questions about work and walking ability. Raichle and colleagues [5] substituted the word ‘mobility’ for ‘walking ability’ when evaluating pain interference in a sample of patients with spinal cord injury, as did Osborne et al. [5] when evaluating the tool in persons with multiple sclerosis and Tyler et al. [15] in persons with cerebral palsy. As a sensitivity analysis, we conducted a CFA with the walking item removed (not shown) that did not improve model fit. Item 4 ‘Normal Work’ has also been challenged for its universal applicability, having been removed by Darnall and Sazie [30] when exploring the nature of pain interference in incarcerated women, and Atkinson et al. [11] in their cohort of palliative patients with end-stage cancer or HIV/AIDS. Model fit worsened slightly in our sample of ambulatory outpatients when we conducted a sensitivity analysis without the Normal Work item (analysis not shown). Work is an important participation domain and, conceptually, interference in this domain is an important concern, particularly if unpaid work is included in the definition of work. Future users of the BPI-SF are encouraged to consider relevance of each item for their population, but be aware that ad hoc removal of items may adversely affect properties of the tool.
The magnitude of associations and score distributions for both the 7- and 10-item versions of the interference scale are also in keeping with previous reports, offering converging evidence for scale validity. Darnall and Sazie [30] found a correlation of r= 0.60 between the BPI-SF-7 Interference subscale and the Pain Catastrophizing Scale (cf. r =0.57 herein). Ferreira-Valente et al. [31] reported correlations of r = –0.63 and –0.61 between the full interference subscale and SF-12 MCS and PCS, respectively (cf. –0.58 and –0.49 herein), and r =0.57 with average NRS (cf. r = 0.69 herein). Tan et al. [10] reported overall higher mean response scores and similar standard deviations across all items in comparison to the QPR sample, while Ferreira-Valente et al. [31] reported overall lower mean scores in their sample of 214 respondents to the Portuguese version of the BPI-SF. The heterogeneity of conditions in our sample may explain the differences from Ferreira-Valente et al., but they do raise the possibility of cultural bias in responses.
Strengths of our study include a large sample size which allowed for replication, broad sampling that represents a diverse chronic pain population and the availability of multiple comparison measures. However, our findings should be interpreted considering some limitations. The diversity of clinical approaches and settings is likely to increase external validity (generalizability) but may have adversely affected internal validity if systematic biases in data collection existed. The non-normally distributed data open the possibility of biased findings, however the techniques we have used have demonstrated robustness to minor deviations from normality [32,33]. These data were not collected by our group, so we had little control over the procedures and were unable to go back to original data files to check for data errors. Our regression-based approach to data cleaning was the best option available, leading to removal of over 1600 subjects from an original database of 5654. We are confident that the data in our final database provide more accurate indications of psychometric properties than had we used the full database. The size of the database and findings consistent with previous author groups offer considerable protection against the likelihood that our findings are systematically biased, but the possibility remains. Finally, we wish to note that the optimal clinical measurement tool can only be identified through multiple types of analyses and considering different purposes (discrimination, prediction or evaluation of change) at multiple time points which will reveal important considerations not assessed in this study e.g. responsiveness. These are reasonable directions for future research to further explore measurement dimensions of the 10 or 7 item versions.
In summary, the purpose of this study was to revisit the factor structure of the interference subscale of the BPI-SF in a large cohort of adult patients with chronic pain, and to determine whether the 3 additional items proposed by Tyler et al. [15] offered any additional robustness in this analysis. The results suggest continued structural ambiguity but greater overall support for a 2-factor over single-factor structure, and for the first time to our knowledge, support for a novel 3-factor structure. This may suggest that the BPI-SF Interference scale possesses an uncommon property, that it can arguably be interpreted as either a full composite score or as independent subscores, the relative advantages and disadvantages of which have been discussed. Regardless, the additional 3 items offered no structural benefit over the original 7 items, suggesting they may add unnecessary burden for those wishing to use the BPI-SF. Additional analyses should be considered, specifically responsiveness and sensitivity to change, before definitive state-ments are made regarding the clinical utility of the 10- compared to the 7-item versions.
Author contributions
David Walton conceived of and coordinated the project, was responsible for acquiring the data and ensuring rigour of results, and completed the first draft of the manuscript.
Tyler Beattie was responsible for cleaning the data, conducting the analyses, and reviewing the final draft of the manuscript.
Joe Putos was responsible for reviewing the manuscript for accuracy and completeness, ensuring appropriate interpretation of results.
Joy MacDermid was co-lead and senior author on the paper, acquired funding to obtain the database, and reviewed the paper for accuracy and completeness.
Highlights
A large confirmatory exploration of the BPI Interference scale was conducted.
The 7- and 10-item versions of the BPI Interference scale are statistically similar.
The Interference subscale is composed of at least 2 subscales.
The sleep item should be interpreted separately.
DOI of refers to article: http://dx.doi.org/10.1016/j.sjpain.2016.04.003
-
Conflict of interest The authors declare no conflict of interest with any of the material described herein.
Acknowledgments
Joy C. MacDermid was supported by a Chair in Gender, Work and Health by the Canadian Institutes of Health Research and by the James Roth Chair in Musculoskeletal Measurement and Knowledge Translation. Operating funds were provided by a CIHRgrant toJCM and DMW.
This study used data from the Quebec Pain Registry (QPR: http://quebecpainregistry.com), a program supported by the Quebec Pain Research Network (QPRN: http://qprn.com) and funded by the Fonds de la recherche du Quebec - Santé (FRQ-S) in partnership with the Quebec Ministry of Health, Pfizer Canada Inc., and AstraZeneca Inc.
References
[1] Vernon H, Mior S. The Neck Disability Index: a study of reliability and validity. J Manip Physiol Ther 1991;14:409-15.Search in Google Scholar
[2] Roland M, Morris R.A study of the natural history ofback pain. Part I: development of a reliable and sensitive measure of disability in low-back pain. Spine (Phila Pa 1976) 1983;8:141-4.Search in Google Scholar
[3] Cleeland CS, Ryan KM. Pain assessment: global use ofthe BriefPain Inventory. AnnAcad Med Singap 1994;23:129-38.Search in Google Scholar
[4] Tait RC, Pollard CA, Margolis RB, Duckro PN, Krause SJ. The Pain Disability Index: psychometric and validity data. Arch Phys Med Rehabil 1987;68:438-41.Search in Google Scholar
[5] Osborne TL, Raichle KA, Jensen MP, Ehde DM, Kraft G. The reliability and validity of pain interference measures in persons with multiple sclerosis. J Pain Symptom Manag 2006;32:217-29, http://dx.doi.org/10.1016/ j.jpainsymman. 2006. 03. 008.Search in Google Scholar
[6] Raichle KA, Osborne TL, Jensen MP, Cardenas D. The reliability and validity of pain interference measures in persons with spinal cord injury. J Pain 2006;7:179-86, http://dx.doi.org/10.1016/jjpain.2005.10.007.Search in Google Scholar
[7] Keller S, Bann CM, Dodd SL, Schein J, Mendoza TR, Cleeland CS. Validity of the brief pain inventory for use in documenting the outcomes of patients with noncancerpain. ClinJ Pain 2004;20:309-18.Search in Google Scholar
[8] Mendoza T, Mayne T, Rublee D, Cleeland C. Reliability and validity of a modified Brief Pain Inventory short form in patients with osteoarthritis. EurJ Pain 2006;10:353-61, http://dx.doi.org/10.1016Zj.ejpain.2005.06.002.Search in Google Scholar
[9] Lapane KL, Quilliam BJ, Benson C, Chow W, Kim M. One, two, or three? Constructs of the brief pain inventory among patients with non-cancer pain in the outpatient setting. J Pain Symptom Manag 2014;47:325-33, http://dx.doi.org/10.1016/jjpainsymman.2013.03.023.Search in Google Scholar
[10] Tan G, Jensen MP, Thornby JI, Shanti BF. Validation of the Brief Pain Inventory for chronic nonmalignant pain. J Pain 2004;5:133-7, http://dx.doi.org/10.1016/jjpain.2003.12.005.Search in Google Scholar
[11] Atkinson TM, Rosenfeld BD, Sit L, MendozaTR, Fruscione M, Lavene D, Shaw M, Li Y, Hay J, Cleeland CS, Scher HI. Using confirmatory factor analysis to evaluate construct validity of the Brief Pain Inventory (BPI). J Pain Symptom Manag 2011;41:558-65, http:// dx.doi.org/10.1016/j. jpainsymman. 2010. 05. 008.Search in Google Scholar
[12] Erdemoglu AK, Koc R. Brief Pain Inventory score identifying and discriminating neuropathic and nociceptive pain. Acta Neurol Scand 2013;128:351-8, http://dx.doi.org/10.1111/ane.12131.Search in Google Scholar
[13] Luce RD, TukeyJW. Simultaneous conjoint measurement: a new scale type of fundamental measurement. J Math Psychol 1964;1:1-27.Search in Google Scholar
[14] Atkinson TM, Halabi S, Bennett AV, Rogak L, Sit L, Li Y, Kaplan E, Basch E, Cancer and Leukemia Group B. Measurement of affective and activity pain interference using the Brief Pain Inventory (BPI): Cancer and Leukemia Group B 70903. Pain Med 2012;13:1417-24.Search in Google Scholar
[15] Tyler EJ, Jensen MP, Engel JM, Schwartz L. The reliability and validity of pain interference measures in persons with cerebral palsy. Arch Phys Med Rehabil 2002;83:236-9.Search in Google Scholar
[16] Gjeilo KH, Stenseth R, Wahba A, Lydersen S, Klepstad P. Validation of the brief pain inventory in patients six months after cardiac surgery. J Pain Symptom Manag 2007;34:648-56, http:// dx.doi.org/10.1016/j. jpainsymman. 2007. 01.010.Search in Google Scholar
[17] Deyo RA, Battie M, Beurskens AJ, Bombardier C, Croft P, Koes B, Malmi- vaara A, Roland M, Von Korff M, Waddell G. Outcome measures for low back pain research. A proposal for standardized use. Spine (Phila Pa 1976) 1998;23:2003-13.Search in Google Scholar
[18] Sullivan MJL, Bishop SR, Pivik J. The Pain Catastrophizing Scale: development and validation. Psychol Assess 1995;7:524-32.Search in Google Scholar
[19] Khan RS, Ahmed K, Blakeway E, Skapinakis P, Nihoyannopoulos L, Macleod K, Sevdalis N, Ashrafian H, Platt M, Darzi A, Athanasiou T. Catastrophizing: a predictive factor for postoperative pain. Am J Surg 2011;201:122-31, http://dx.doi.org/10.1016/j.amjsurg.2010.02.007.Search in Google Scholar
[20] Wideman TH, Sullivan MJ. Differential predictors of the long-term levels of pain intensity, work disability, healthcare use, and medication use in a sample of workers’ compensation claimants. Pain 2011;152:376-83, http://dx.doi.org/10.1016/j.pain.2010.10.044.Search in Google Scholar
[21] Walton DM, Wideman TH, Sullivan MJ. A Rasch analysis of the pain catastrophizing scale supports its use as an interval-level measure. Clin J Pain 2013;29:499-506, http://dx.doi.org/10.1097/AJP.0b013e318269569c.Search in Google Scholar
[22] Wang YP, Gorenstein C. Assessment of depression in medical patients: a systematic review of the utility of the Beck Depression Inventory-II. Clinics (Sao Paulo) 2013;68:1274-87, http://dx.doi.org/10.6061/clinics/2013(09)15.Search in Google Scholar
[23] Jensen MP, Miller L, Fisher LD. Assessment of pain during medical procedures: a comparison of three scales. ClinJ Pain 1998;14:343-9.Search in Google Scholar
[24] Horn JL. A rationale and test for the number of factors in factor analysis. Psy- chometrika 1965;32:179-85.Search in Google Scholar
[25] Bland JM, Altman DG. Statistics notes: Cronbach’s alpha. BrMedJ 1997;314:572.Search in Google Scholar
[26] Cano SJ, Barrett LE, Zajicek JP, Hobart JC. Beyond the reach of traditional analyses: using Rasch to evaluate the DASH in people with multiple sclerosis. Mult Scler 2011;17:214-22, http://dx.doi.org/10.1177/1352458510385269.Search in Google Scholar
[27] Hobart J, Cano S. Improving the evaluation of therapeutic interventions in multiple sclerosis: the role of new psychometric methods. Health Technol Assess 2009;13:1-177, http://dx.doi.org/10.3310/hta13120.Search in Google Scholar
[28] Walton DM, Beattie T, PutosJ, MacDermidJC. A Rasch analysis of the Brief Pain Inventory Interference subscale reveals three dimensions and an age bias. J Clin Epidemiol 2016, http://dx.doi.org/10.1016/jjclinepi.2015.10.022.Search in Google Scholar
[29] Radbruch L, Loick G, Kiencke P, Lindena G, Sabatowski R, Grond S, Lehmann KA, Cleeland CS. Validation ofthe German version ofthe BriefPain Inventory. J Pain Symptom Manag 1999;18:180-7.Search in Google Scholar
[30] Darnall BD, Sazie E. Pain characteristics and pain catastrophizing in incarcerated women with chronic pain. J Health Care Poor Underserved 2012;23:543-56, http://dx.doi.org/10.1353/hpu.2012.0042.Search in Google Scholar
[31] Ferreira-Valente MA, Ribeiro JLP, Jensen MP. Further validation of a portuguese version of the brief pain inventory interference scale. Clin Salud 2012;23:89-96.Search in Google Scholar
[32] Benson J, Fleishman JA. The robustness of maximum likelihood and distribution-free estimators to non-normality in confirmatory factor analysis. Qual Quant 1994;28:117-36.Search in Google Scholar
[33] Muthen BO, Kaplan D. A comparison of some methodologies for factor analysis of non-normal Likert variables: a note on the size of the model. Br J Math Stat Psychol 1985;38:171-89.Search in Google Scholar
© 2016 Scandinavian Association for the Study of Pain
Articles in the same Issue
- Scandinavian Journal of Pain
- Editorial comment
- Depressive symptoms associated with poor outcome after lumbar spine surgery: Pain and depression impact on each other and aggravate the burden of the sufferer
- Clinical pain research
- Depressive symptoms are associated with poor outcome for lumbar spine surgery
- Editorial comment
- Chronic compartment syndrome is an under-recognized cause of leg-pain
- Observational study
- Prevalence of chronic compartment syndrome of the legs: Implications for clinical diagnostic criteria and therapy
- Editorial comment
- Genetic susceptibility to postherniotomy pain. The influence of polymorphisms in the Mu opioid receptor, TNF-α, GRIK3, GCH1, BDNF and CACNA2D2 genes
- Clinical pain research
- Genetic susceptibility to postherniotomy pain. The influence of polymorphisms in the Mu opioid receptor, TNF-α, GRIK3, GCH1, BDNF and CACNA2D2 genes
- Editorial comment
- Important development: Extended Acute Pain Service for patients at high risk of chronic pain after surgery
- Observational study
- New approach for treatment of prolonged postoperative pain: APS Out-Patient Clinic
- Editorial comment
- Working memory, optimism and pain: An elusive link
- Original experimental
- The effects of experimental pain and induced optimism on working memory task performance
- Editorial comment
- A surgical treatment for chronic neck pain after whiplash injury?
- Clinical pain research
- A small group Whiplash-Associated-Disorders (WAD) patients with central neck pain and movement induced stabbing pain, the painful segment determined by mechanical provocation: Fusion surgery was superior to multimodal rehabilitation in a randomized trial
- Editorial comment
- Social anxiety and pain-related fear impact each other and aggravate the burden of chronic pain patients: More individually tailored rehabilitation need
- Clinical pain research
- Characteristics and consequences of the co-occurrence between social anxiety and pain-related fear in chronic pain patients receiving multimodal pain rehabilitation treatment
- Editorial comment
- Transcranial magnetic stimulation, paravertebral muscles training, and postural control in chronic low back pain
- Original experimental
- Influence of paravertebral muscles training on brain plasticity and postural control in chronic low back pain
- Editorial comment
- Is there a place for pulsed radiofrequency in the treatment of chronic pain?
- Clinical pain research
- Pulsed radiofrequency in clinical practice – A retrospective analysis of 238 patients with chronic non-cancer pain treated at an academic tertiary pain centre
- Editorial comment
- More postoperative pain reported by women than by men – Again
- Observational study
- Females report higher postoperative pain scores than males after ankle surgery
- Editorial comment
- The relationship between pain and perceived stress in a population-based sample of adolescents – Is the relationship gender specific?
- Observational study
- Pain is prevalent among adolescents and equally related to stress across genders
- Editorial comment
- The Brief Pain Inventory (BPI) – Revisited and rejuvenated?
- Clinical pain research
- Confirmatory factor analysis of 2 versions of the Brief Pain Inventory in an ambulatory population indicates that sleep interference should be interpreted separately
- Editorial comment
- Pain research reported at the 40th scientific meeting of the Scandinavian Association for the Study of Pain in Reykjavik, Iceland May 26–27, 2016
- Abstracts
- Pain management strategies for effective coping with Sickle Cell Disease: The perspective of patients in Ghana
- Abstracts
- PEARL – Pain in early life. A new network for research and education
- Abstracts
- Searching for protein biomarkers in pain medicine – Mindless dredging or rational fishing?
- Abstracts
- Effectiveness of smart tablets as a distraction during needle insertion amongst children with port catheter: Pre-research with pre-post test design
- Abstracts
- Postoperative oxycodone in breast cancer surgery: What factors associate with analgesic plasma concentrations?
- Abstracts
- Sport participation and physical activity level in relation to musculoskeletal pain in a population-based sample of adolescents: The Young-HUNT Study
- Abstracts
- “Tears are also included” - women’s experience of treatment for painful endometriosis at a pain clinic
- Abstracts
- Predictors of long-term opioid use among chronic nonmalignant pain patients: A register-based national open cohort study
- Abstracts
- Coupled cell networks of astrocytes and chondrocytes are target cells of inflammation
- Abstracts
- Changes in opioid prescribing behaviour in Denmark, Sweden and Norway - 2006-2014
- Abstracts
- Opioid usage in Denmark, Norway and Sweden - 2006-2014 and regulatory factors in the society that might influence it
- Abstracts
- ADRB2, pain and opioids in mice and man
- Abstracts
- Retrospective analysis of pediatric patients with CRPS
- Abstracts
- Activation of epidermal growth factor receptors (EGFRs) following disc herniation induces hyperexcitability in the pain pathways
- Abstracts
- Pain rehabilitation with language interpreter, a multicenter development project
- Abstracts
- Trait-anxiety and pain intensity predict symptoms related to dysfunctional breathing (DB) in patients with chronic pain
- Abstracts
- Emla®-cream as pain relief during pneumococcal vaccination
- Abstracts
- Use of Complimentary/Alternative therapy for chronic pain
- Abstracts
- Effect of conditioned pain modulation on long-term potentiation-like pain amplification in humans
- Abstracts
- Biomarkers for neuropathic pain – Is the old alpha-1-antitrypsin any good?
- Abstracts
- Acute bilateral experimental neck pain: Reorganise axioscapular and trunk muscle activity during slow resisted arm movements
- Abstracts
- Mast cell proteases protect against histaminergic itch and attenuate tissue injury pain responses
- Abstracts
- The impact of opioid treatment on regional gastrointestinal transit
- Abstracts
- Genetic variation in P2RX7 and pain
- Abstracts
- Reversal of thermal and mechanical allodynia with pregabalin in a mouse model of oxaliplatin-induced peripheral neuropathy
- Clinical pain research
- Pain-related distress and clinical depression in chronic pain: A comparison between two measures