Evaluation of texture in jelly gums incorporating berries and aromatic plants
-
Raquel P. F. Guiné
 ,
Paula M. R. Correia
,
Paula M. R. Correia

Abstract
In the confectionery market, jelly gums are one of the most relevant sectors, being frequently consumed by many people, from children to adults. The present work intended to evaluate the textural properties in newly developed jelly gums made with berry fruits and herbs, given the critical role of texture in products with a gel-like structure. Four types of gums were developed (Strawberry & Anise, Strawberry & Mint, Raspberry & Mint, Blueberry & Mint) and their texture was evaluated through two types of tests (compression with a 75 mm probe and puncture with a 2 mm probe) allowing to calculate several textural properties. The results showed some differences between the two faces of the jelly gums analysed, i.e. on the top and on the bottom. As for the compression test, the Strawberry & Anise gums were among the softer (25.6 N) and with lower resilience (36.3%) and chewiness (16.9 N), despite being more adhesive (−0.5 N s). As for the puncture test, the sample Strawberry & Mint had the highest adhesiveness (−2.0 N s) but the lowest stickiness (−0.38 N). Additionally, very strong correlations were encountered between some of the properties studied (r = 0.861 or r = 0.822), and the factor analysis allowed defining three factors, the first clearly associated with the puncture properties while the other two were related to the compression properties. This work allowed concluding that the jelly gums presented different textural properties, particularly when assessed through different types of measurements. Hence, the use of different types of tests for texture analysis is recommended, since the results are complementary. This is relevant when developing food products intended for industrial production and commercialization.
1 Introduction
Jelly gums, also known as fruit candies or jelly sweets, are systems with a gel-like structure, made with a minimum of 45 g/100 g of fruits, and then they contain sugars, in concentrations of about 55 g/100 g, and gelling agents like pectin and organic acids (Cappa et al. 2015). These products can be very diverse in their properties, like for example form, composition and most especially colour or texture. They are highly appreciated due to their appearance, flavour and textural properties. They represent an important sector of the confectionery market and they are consumed by varied groups of people, including young children or on the opposite side, the elderly. Hence, their composition and nutritional value are much relevant, especially having in mind the high sugar content normally present in the formulations (Cappa et al. 2015).
Kushner and Kahan (2018) in their report The State of Obesity in 2017 alert for the need to redesign the public health environment, so as to offer highly effective and efficient obesity prevention, in a world where obesity is considered one of the global noncommunicable diseases recognized by the World Health Organization (WHO). Factors such as diet, physical activity or genetic influences critically contribute to obesity both in children and adults. However, dietary behaviours like dietary intake pattern, and most particularly sugar consumption, are unquestionably related with a potential impact on a fast gain of weight, thus contributing to overweight and obesity (Regev-Tobias et al. 2012; Song et al. 2012). Furthermore, the high sugar intake also contributes to a number of other problems, like type 2 diabetes. Diabetes is included in the metabolic disorders, which are a major cause of morbidity and mortality all over the world. Diabetes comprises hyperglycaemia that develops from abnormalities in insulin secretion or action, or both. About 90% of the patients with diabetes suffer from type 2 diabetes, which is linked with insulin resistance and a low tolerance to glucose, being closely associated with obesity. The rest of the cases, which represent about 10%, are type 1 diabetes, and they result from insulin deficiency owing to the autoimmune destruction of β cells in the pancreas (Codella et al. 2017; Villa et al. 2018).
It has been observed that there is an increasing interest in the design of new food products with a more balanced nutritive composition, including low sugar content, and that provide additional health benefits by incorporating bioactive compounds (Cappa et al. 2015). Phenolic compounds are known to have very high antioxidant activity and constitute an effective means of providing beneficial compounds for the human body. They are secondary metabolites in plants, and possess high antioxidant activity, having been associated with multiple health benefits, such as reducing dyslipidaemia or atherosclerosis as well as many inflammatory processes associated with cardiovascular diseases, and prevention of cancer, diabetes and obesity. Besides, they have been successfully applied as food functional ingredients owing to their capacity to prevent lipid oxidation as well as moulds and bacterial growth (Rossi et al. 2018; Verardo et al. 2018; Vu et al. 2018). Anthocyanins are natural pigments found in a wide variety of small fruits and berries. In the work of Maier et al. (2009), anthocyanin extracts were added into gelatin and pectin gels, and these extracts proved to be an encouraging alternative to the use of traditional synthetic colourants. Besides, they also have the advantage of bearing additional beneficial health effects for those who consumed the products (McCann et al. 2007; Fang 2015; Teng et al. 2017; Xie et al. 2018).
Presently, the market of fruit gums or jelly candies is dominated by products with a high sugar content, although some attempts have been done to try to improve their formulation, like for example replacing the added sugars by honey, in an attempt to provide healthier ingredients, still the content of sugars is high (Mutlu et al. 2018). Hence, the development of jelly gums with improved nutritional characteristics while at the same time maintaining the desired textural characteristics is an opportunity targeted by our research group. In a previous work, Guiné et al. (2018a) tested 16 different formulations and a sensory evaluation allowed to select the best four, which were those used in this later phase of the work. These formulations were based on fruits and herbs, in an attempt to introduce flavour derived from these ingredients as well as colour, derived from natural colourants. Anthocyanins are natural colourants which are present in berry fruits in high amounts, including strawberry, raspberry and blueberry, apart from other phenolic compounds with antioxidant activity (Soutinho et al. 2013; Gonçalves et al. 2015; Guiné et al. 2018b; Dzhanfezova et al. 2020). Herbs such as anise and mint are natural flavour enhancers containing beneficial components with bioactive activity (Guiné and Gonçalves 2015, 2016).
The objective of the present work was to evaluate the textural characteristics in four newly developed jelly gums made with berry fruits and herbs and no addition of sugar, given the pivotal role of texture for this particular type of product. Furthermore, to explore more deeply the textural characteristics, two types of instrumental tests were performed, allowing determining different textural attributes. Finally, the intercorrelations between different textural properties and some agglomeration structure were also assessed.
2 Material and methods
2.1 Samples
This work is in sequence of a previous work by the same research team (Guiné et al. 2018a), in which 16 formulations of jelly gums with fruits and herbs, in different combinations, were tested and evaluated for selection of the best formulations. This previous work included a sensory analysis, which allowed to select four variations of the product as the most promising, and those were the ones that were produced on this phase for the texture analysis. These four variations of the jelly gum products were established using small fruits, berries, plus some aromatic herbs, specifically: Blueberry & Mint, Raspberry & Mint, Strawberry & Mint, and finally Strawberry & Anise. The formulation was identical for all varieties, as follows: a base of apple puree (48%) with the small fruits (35%, strawberry, raspberry or blueberry), plus gelling agents (pectin (7%) and agar–agar (5%)) and finally aromatic herbs (6%, mint or anise).
To prepare the gums, first the apple was peeled and cut into small pieces and after addition of the berry fruit, the mixture was triturated to obtain a puree and then boiled for 20 min. During ebullition, after approximately 15 min, the mass of aromatic herb was carefully added and in the end the mass was poured into the forms (cuvettes) and left in the refrigerator to cool (Guiné et al. 2018a).
2.2 Evaluation of textural properties
A texturometer model TA-XT2 from Stable Micro Systems was used for the measurement of textural parameters. For this, two different texture measurements were performed: a test by compression and another by puncture. For all textural evaluations, 20 jelly gums were used for each variety and the measurements were performed on both faces of the gum: top side and bottom side. The results were processed using Exponent software TEE from Stable Micro Systems.
2.2.1 Compression test
The texture profile analysis (TPA) was obtained through two consecutive compression cycles, made on the sample between parallel plates. For this was used a flat compression probe with 75 mm in diameter (P/75). The time elapsed between cycles was 5 s. The test conditions were as follows: a load cell of 30 kg, all speeds equal to 1.0 mm/s (pre-test, test, post-test), the compressing distance was 5 mm and the trigger force considered was 0.1 N. The obtained graphs allowed calculating the textural properties: hardness, adhesiveness, resilience, springiness, cohesiveness and chewiness by the following parameters (see Figure 1):
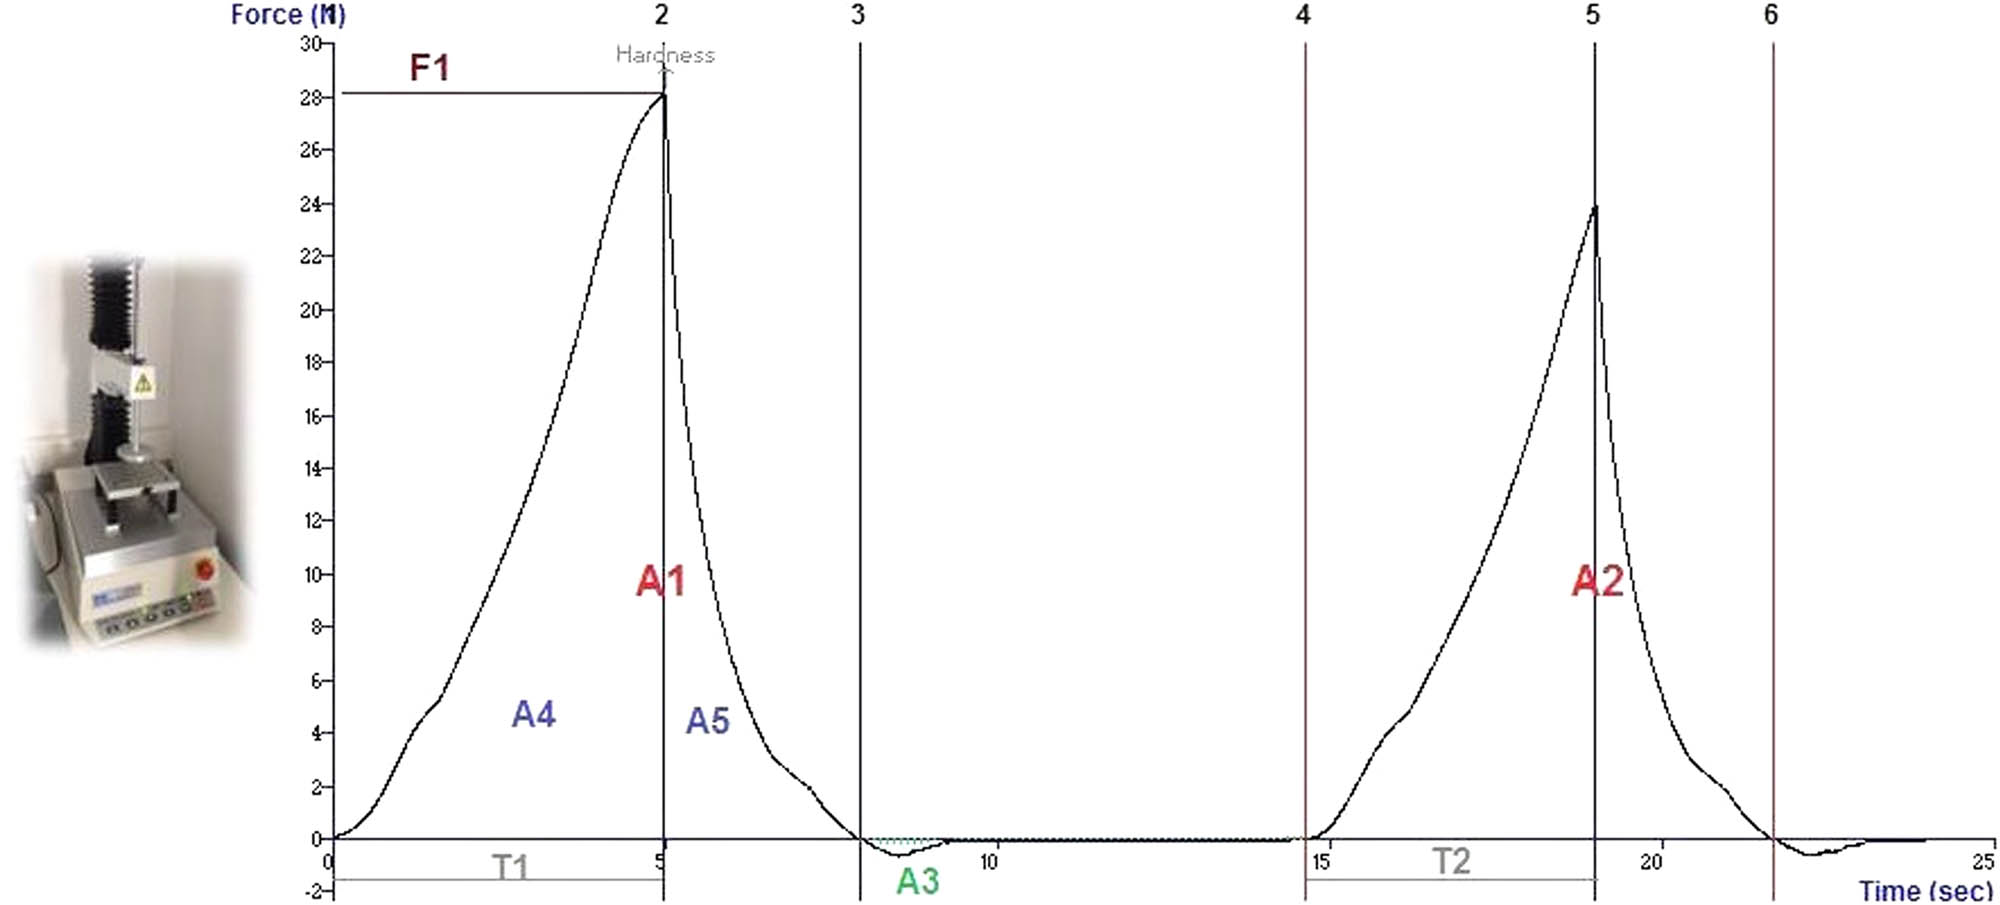
Example of a TPA obtained for the sample Strawberry & Anise, making the compression test with the P/75 probe.
2.2.2 Puncture test
The puncture test was obtained using a 2 mm diameter drilling rig. The pre-test was performed at 2 mm/s rate while the test and post-test rates were made at 1 mm/s. The perforating distance considered in the test was 10 mm and the trigger force was set at 0.05 N. The textural parameters analysed in this case were: crust firmness, flesh firmness, adhesiveness and stickiness. These parameters were obtained by the following equations (see Figure 2):
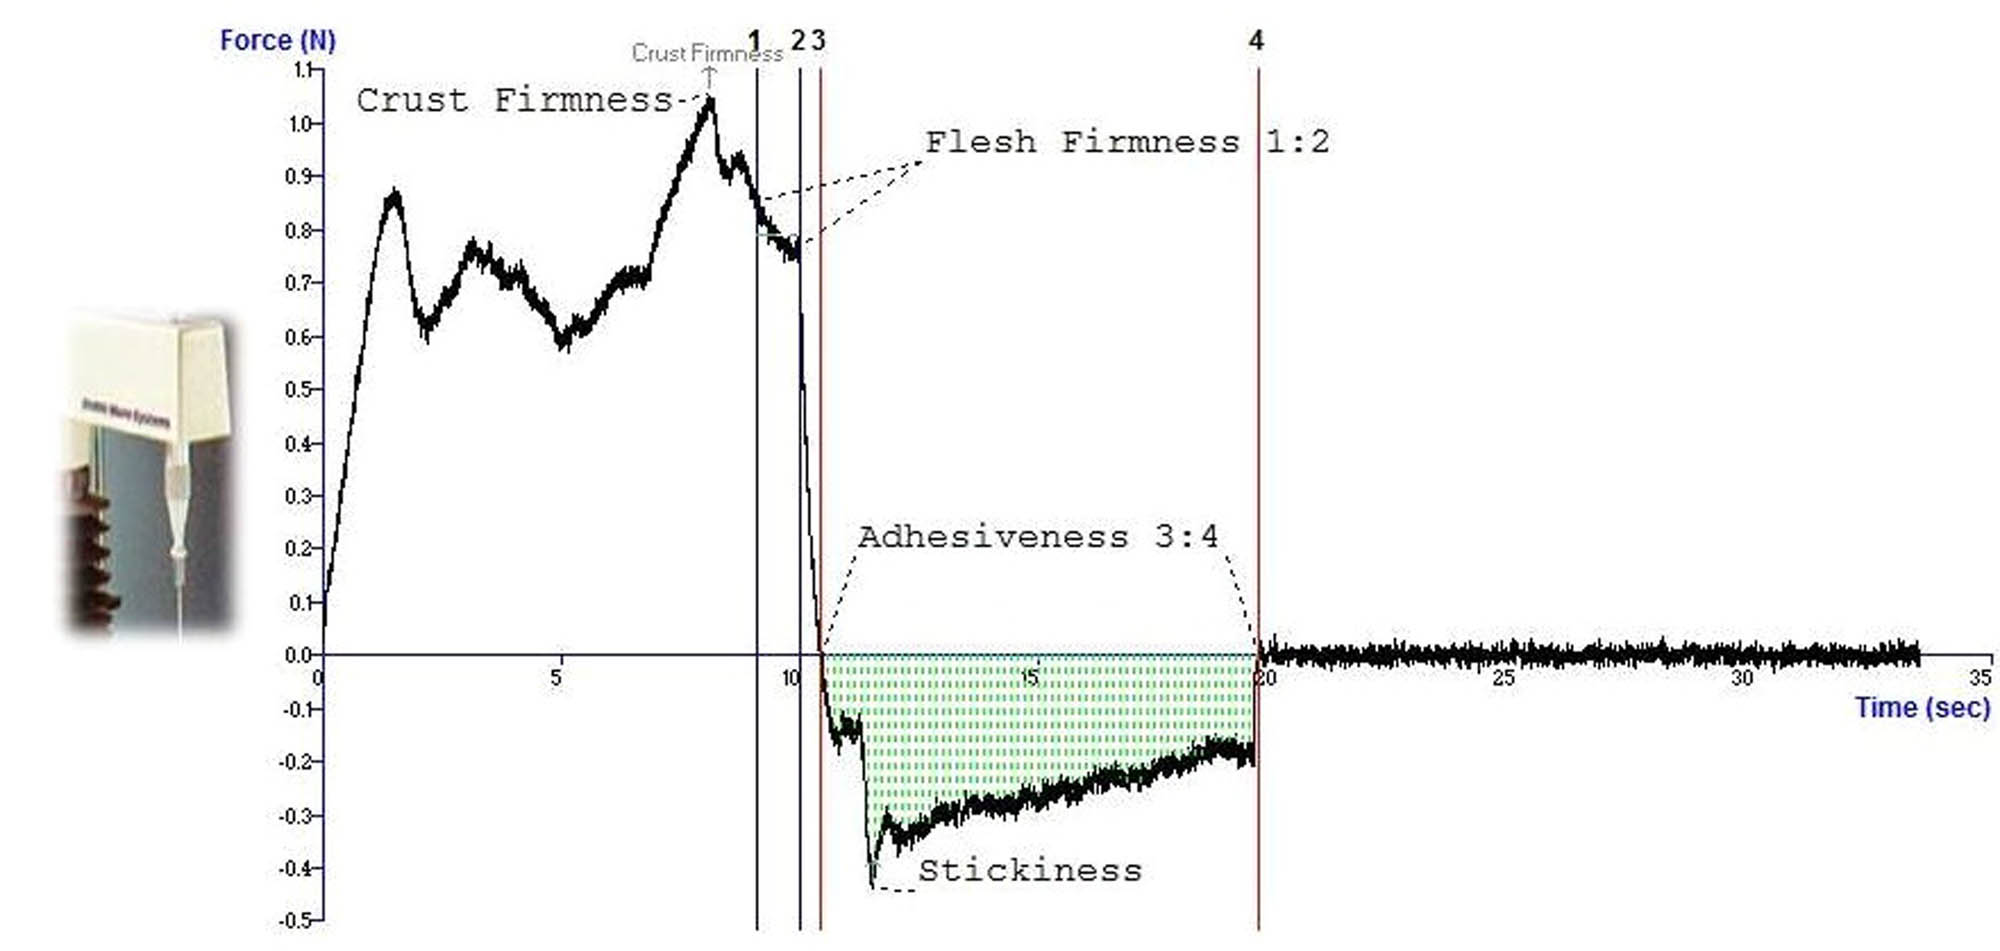
Example of a texture analysis obtained for sample Raspberry & Mint, making the puncture test with the P/2 probe.
2.3 Statistical analysis
In order to confirm if the results obtained for mean values of the analysed parameters were statistically different between samples, the statistical treatment of the results was performed. An ANOVA was carried out when the comparisons were made between three or more groups. This procedure was complemented with the Tukey Honestly Significant Difference post hoc test, which allows identifying where the differences are situated.
Additionally, the Pearson correlations (r) were calculated to analyse the degree of association between all textural properties. For interpretation of the correlations, the following limits were considered: if r = 0 there is no correlation, if r ∈ [0.0, 0.2] the correlation is very weak, if r ∈ [0.2, 0.4] the correlation is weak, if r ∈ [0.4, 0.6] the correlation is moderate, if r ∈ [0.6, 0.8] the correlation is strong, if r ∈ [0.8, 1.0] the correlation is very strong and in the case of r = 1 the correlation is perfect (Maroco 2012; Pestana and Gageiro 2014).
Finally, the results obtained were subjected to a factor analysis (FA). Firstly, the correlation matrix between all variables was evaluated to see if there were any correlations between them. The, the Kaiser–Meyer–Olkin (KMO) measure of adequacy of the sample and the Bartlett’s test were considered to identify the level of intercorrelation between the considered variables (Broen et al. 2015). Following these initial procedures aimed at confirming if the data would be suitable to apply FA, the FA was applied by principal component analysis (PCA) extraction with Varimax rotation. The number of extracted factors was established with the Kaiser criterion, which considers eigenvalues equal to or higher than 1. The communalities, which indicate the percentage of variance explained by the factors extracted, were also calculated (Broen et al. 2015). In the analysis, factor loadings with absolute value lower than 0.4 were excluded (Rohm and Swaminathan 2004; Stevens 2009).
The software SPSS version 24 (IBM, Inc.) was used for all statistical analyses, and the level of significance considered was 5% (p < 0.05).
3 Results and discussion
3.1 Textural properties
3.1.1 Compression test
Figure 3(a) presents the textural properties obtained by the compression test separately on both sides of the jelly gum samples (top and bottom faces). Hardness corresponds to the force necessary to compress a food between the teeth or alternatively between the tongue and the upper part of the mouth, and represents the force necessary to produce a deformation (Cruz et al. 2015). The results obtained for hardness were statistically different among samples (ANOVA, F = 6.643, p < 0.0005), with the top face of the Raspberry & Mint gum being the softest (22.8 N) and the bottom of the Strawberry & Mint gum being the hardest (30.3 N). In general, for the four varieties analysed, the bottom face was recurrently harder when compared with the top face (ranges 26.7–30.3 and 22.8–26.7 N, respectively).
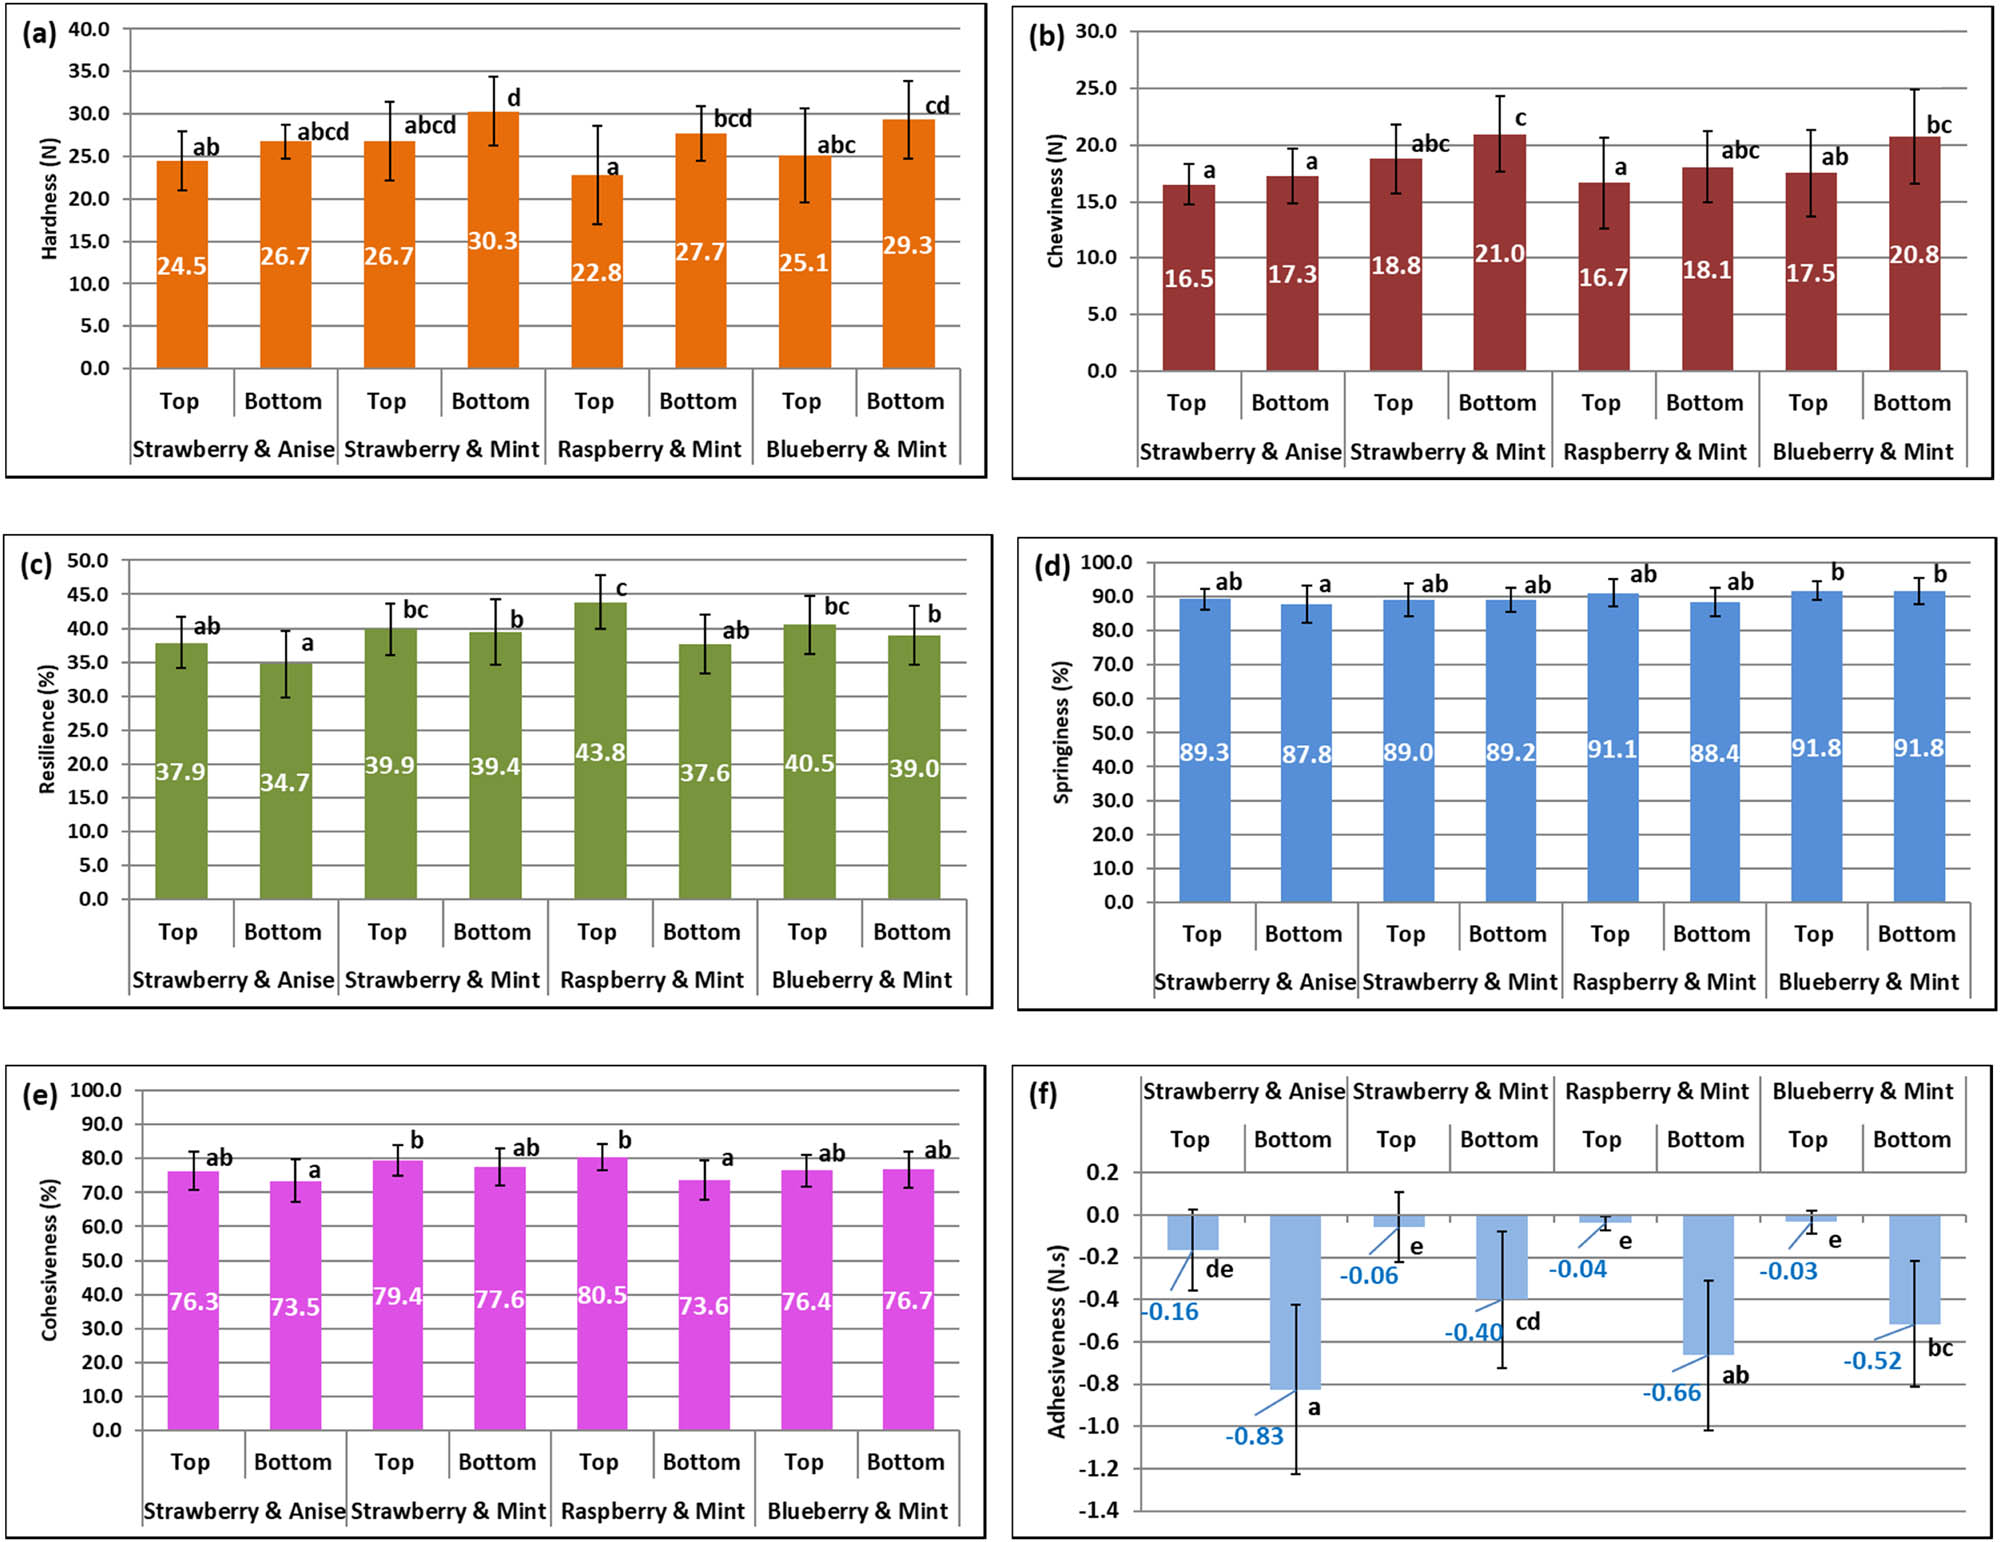
Textural properties on top and bottom faces of the jelly gums, obtained by the compression test: (a) hardness, (b) chewiness, (c) resilience, (d) springiness, (e) cohesiveness and (f) adhesiveness (bars with the same letter are not statistically different at 5% significance level – ANOVA with Tukey test).
Chewiness corresponds to the energy required to disintegrate a food into a state that makes it suitable to swallow (Cruz et al. 2015). This textural property is very closely related to hardness, and therefore it is expected that the trend observed would be similar (Figure 3(b)). Also, for this property significant differences were encountered (ANOVA, F = 5.469, p < 0.0005) and the highest chewiness corresponded to the bottom faces (range 17.3–21.0 N), as it was previously observed for hardness.
Resilience represents the energy used by the application of a force to a material without producing rupture, regardless of any residual strain. This textural property is equivalent to an instant springiness (Cruz et al. 2015). The results obtained for resilience (Figure 3(c)) show significant differences between samples (ANOVA, F = 7.418, p < 0.0005) and reveal a trend for a higher resilience in the top faces of all gums, with values in the ranges 37.9–43.8% and 34.7–39.4%, respectively, for top and bottom faces.
Springiness represents the ability to recuperate shape after a compression and corresponds to the rate at which the product returns to the initial state after the force was removed (Cruz et al. 2015). The values obtained for springiness were very similar (Figure 3(d)) in general, but with statistical differences encountered for the Blueberry & Mint sample (ANOVA, F = 2.907, p = 0.007). The values are very high, around 90% ranging from 88.4% to 91.8%, indicating that the gums are elastic, which is an expected characteristic for this type of product with a gel-like texture. Furthermore, no considerable differences were encountered between the top and bottom faces of the gums.
Cohesiveness accounts for the forces inside the food that keep the mass cohesive and stop it from disintegrating (Cruz et al. 2015). Figure 3(e) shows that cohesiveness was relatively high, with values between 70% and 80%, but still with significant differences between samples (ANOVA, F = 4.451, p < 0.0005). For the Blueberry & Mint sample, cohesiveness on the top and bottom faces was similar (76.4% and 76.7%, respectively), with no significant differences. However, for all other samples, the top face showed a higher cohesiveness when compared with the bottom face, with values in the ranges 76.3–80.5% and 73.5–77.6%, respectively.
Adhesiveness corresponds to the force needed to remove the material that adheres to a surface, such as for example the mouth or teeth (Cruz et al. 2015). In the evaluated samples, the adhesiveness was very low, with absolute values under 1 N, being practically zero on the top faces of all the varieties of gums analysed (Figure 3(f)). The top faces showed negligible adhesiveness (absolute values in the range 0.03–0.16 N) most likely due to the dehydrating effect of the surrounding air on the exposed parts of the gums. The results of the statistical analysis revealed significant differences (ANOVA, F = 28.029, p < 0.0005) for the adhesiveness on the bottom faces, with sample Strawberry & Anise showing the highest adhesiveness on the bottom face (absolute value 0.83 N).
The graphs (a) to (e) in Figure 4 present the textural properties of the jelly gums considered as global, i.e. calculated as a mean of the measurements made on the top and bottom faces, for easier comparison between varieties. In all cases, the statistical results revealed that the differences were significant, meaning that at least one of the samples was distinguishable from the others. The results of ANOVA were, respectively, for hardness, adhesiveness, resilience, springiness, chewiness and cohesiveness: F = 4.241, p = 0.007; F = 3.807, p = 0.011; F = 6.992, p < 0.0005; F = 4.847, p = 0.003; F = 6.883, p < 0.0005; F = 2.895, p = 0.037. The results in the graphs of Figure 4 demonstrate that the Strawberry & Anise and the Raspberry & Mint gums were softer (25.6 and 25.2 N, respectively) and, consequently, had lower chewiness (16.9 and 17.4 N, respectively). Additionally, it was found that sample Strawberry & Anise had the lowest resilience (36.3%), lowest springiness (88.5%), lowest cohesiveness (74.9%) but the highest adhesiveness (absolute value of 0.5 N s).
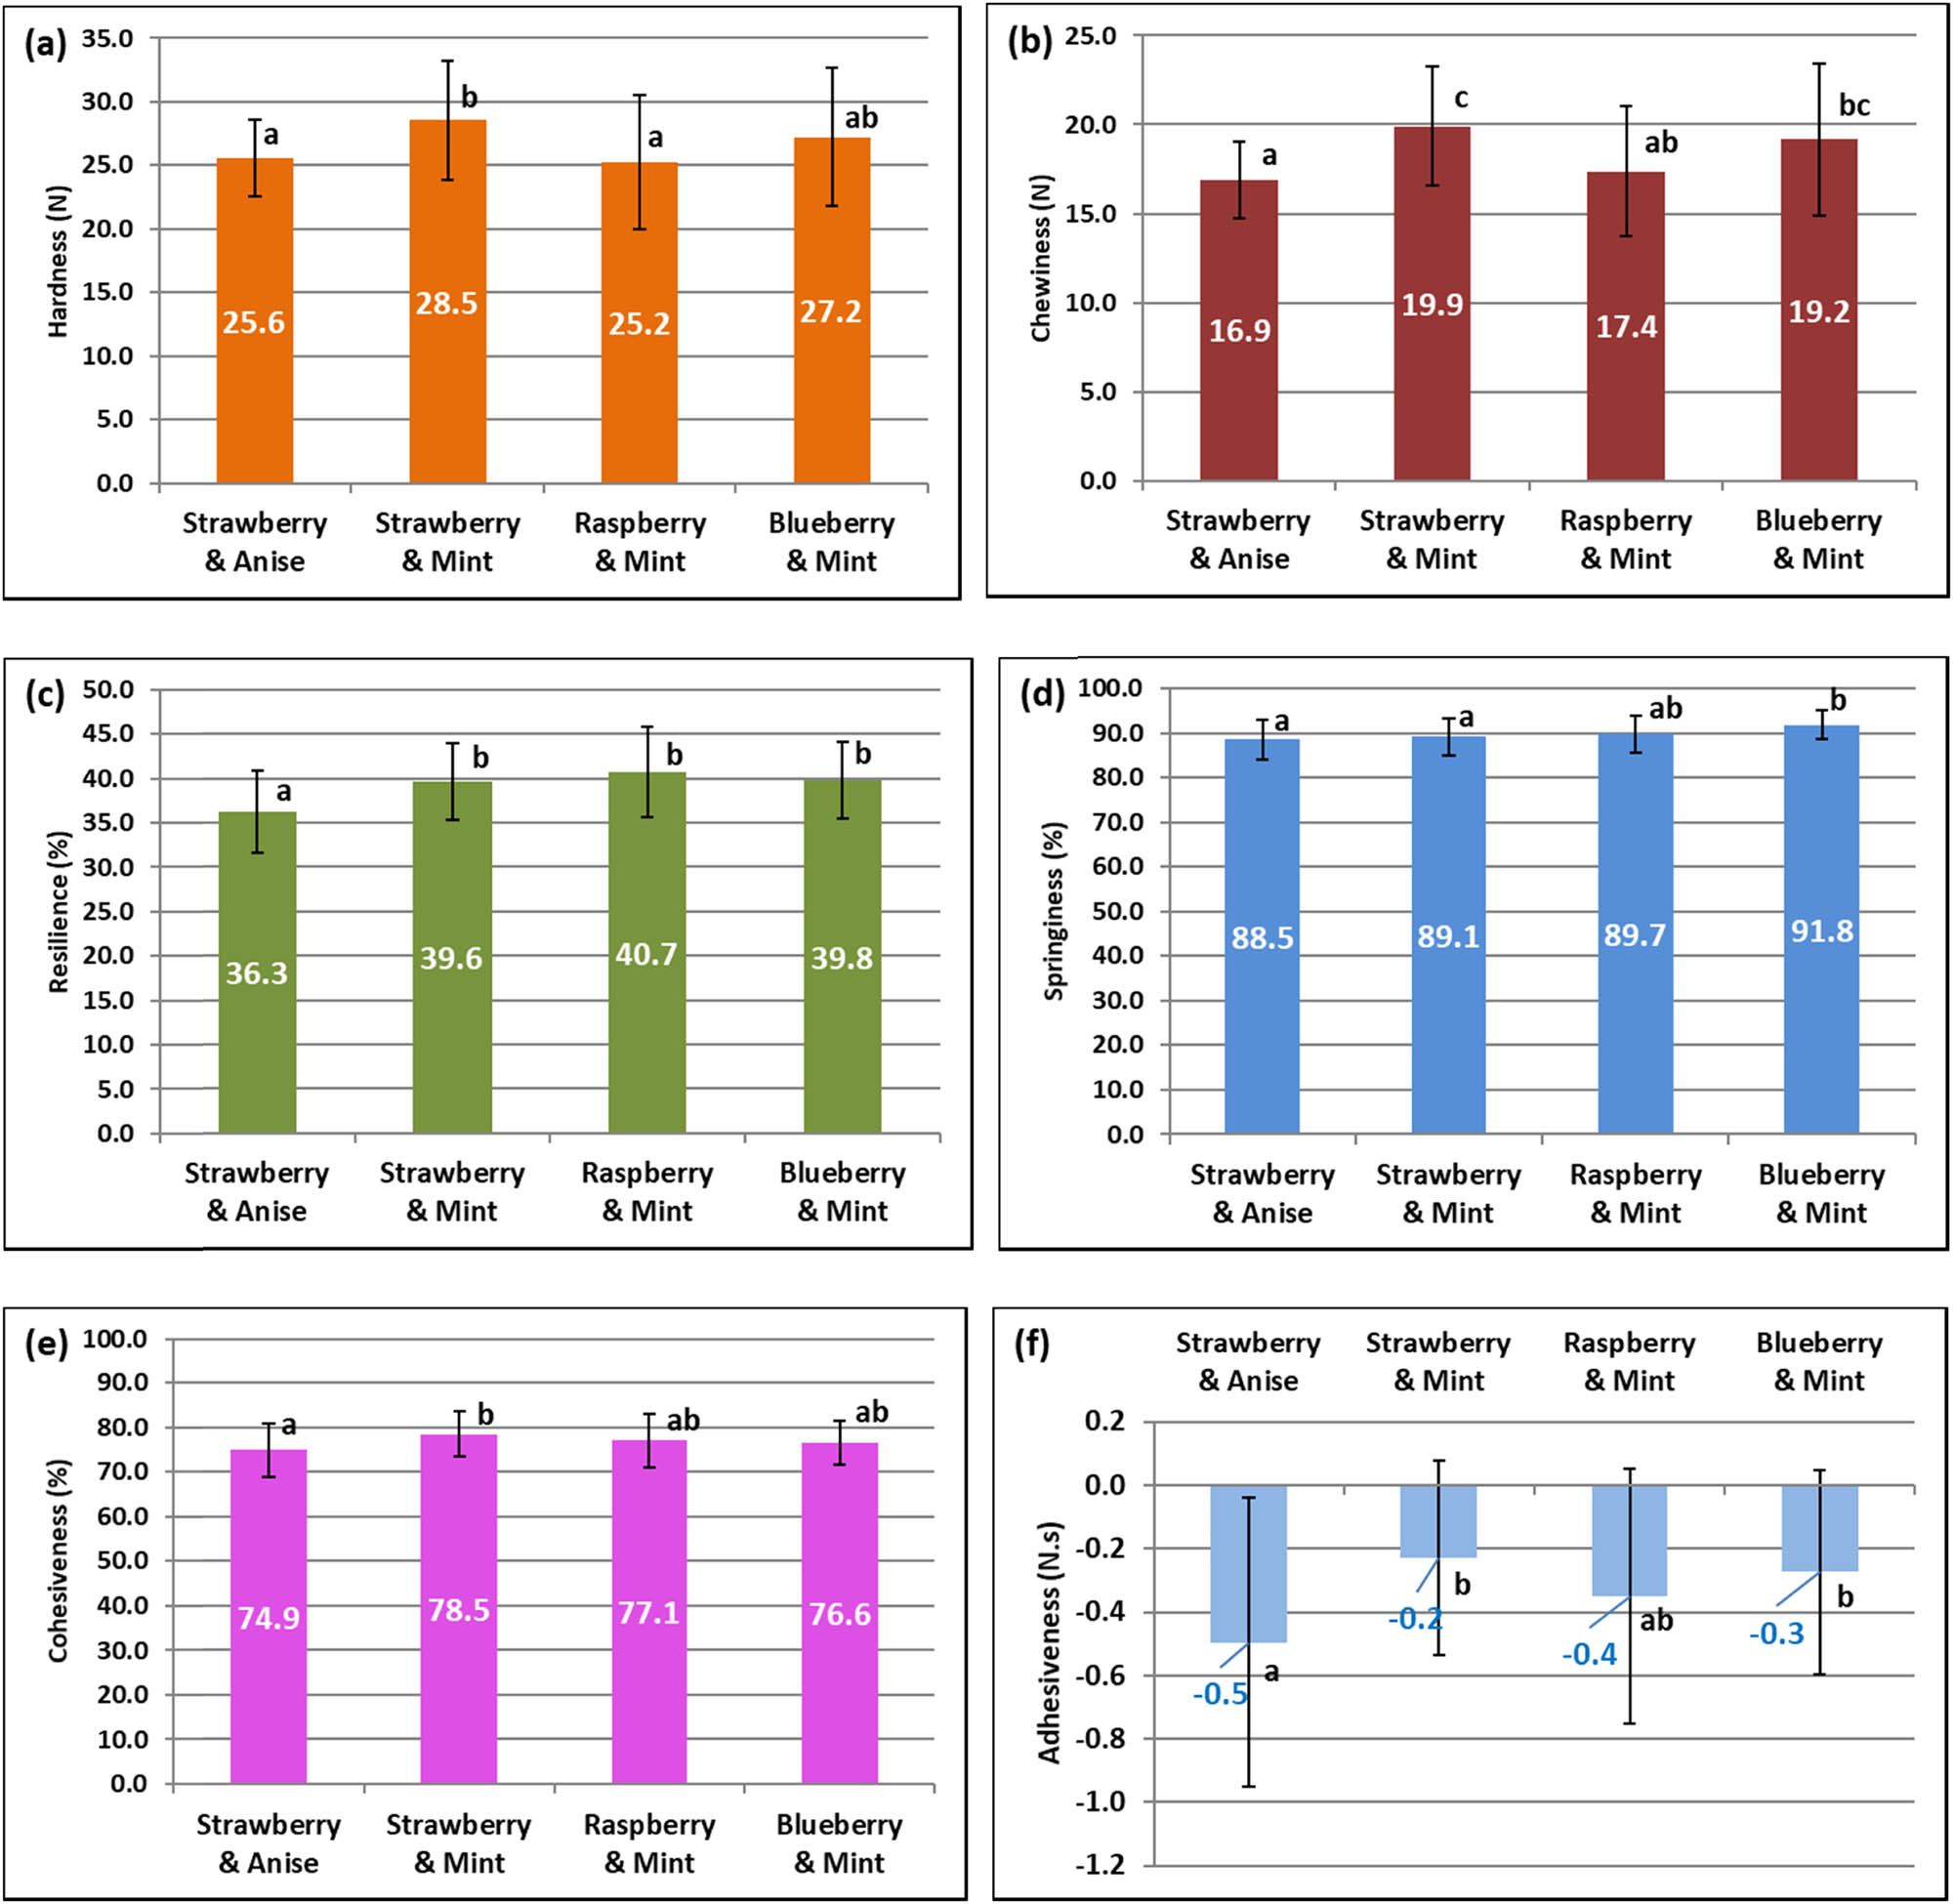
Textural properties of the jelly gums as a whole, obtained by the compression test: (a) hardness, (b) chewiness, (c) resilience, (d) springiness, (e) cohesiveness and (f) adhesiveness (bars with the same letter are not statistically different at 5% significance level – ANOVA with Tukey test).
In a previous work by the same authors (Guiné et al. 2018a), these gums, among others tested, were submitted to a sensory evaluation, which revealed that the Raspberry & Mint gum was scored as more elastic, although the instrumental measurements of texture revealed a slightly different result, with this sample presenting the second highest springiness, which is a measure of the sample elasticity. The same work (Guiné et al. 2018a) also revealed that the Strawberry & Anise was considered by the sensorial panel as having the highest consistency, but again, instrumental measurement of texture did not confirm that result, with this sample being one of the softest. These differences might be due to low sensitivity of the panel members to evaluate the specific textural characteristics of this particular type of product.
In a work by Avelar and Efraim (2020), 18 formulations of jelly candies were developed and tested, fixing a final soluble solid content of 71°Brix, but varying the type of sugars and hydrocolloids in the formulation. They evaluated the texture, but measured only the hardness of the samples and found values varying between 37 and 79 N. Our work proposed jelly gums without sugar, which is a very important attribute not only from the point of view of the consumer worried with nutrition and health, but also brings challenges in finding the suitable textural properties. In our products, the hardness varied between 25.2 and 28.5 N and therefore was lower than the samples from the work by Avelar and Efraim (2020), but this results from different formulations and absence of added sugars. Additionally, those authors observed that hardness increased with the concentration of hydrocolloids and that adherence properties and cohesion (not measured but only observed by the authors) varied according to the sugars used. Since our formulations were similar, i.e. with the same amount and type of hydrocolloids and without added sugars, just varying the type of fruit and herb, it is expected that springiness and cohesiveness are similar among the samples, as observed.
A work by Mutlu et al. (2018) reported some properties, including also texture analysis through the compression test, of some jelly candies formulated with gelatine and fruit juices, and honey as a sweetener. They measured several textural properties and found values varying according to the gelatine dose, type of fruit and processing, in the ranges 8.07–7.30 N for hardness, 0.03–0.16 N.s for adhesiveness, 0.90–0.94 for cohesiveness, 0.93–1.07 for springiness, 754–1,593 for chewiness and 769.53–1,604 for gumminess. The gums developed in our work are more adhesive, more firm but less cohesive and a little less elastic. These characteristics are highly dependent on the presence of sugars, which is restricted to only natural sugars present in the fruit in our gums but in the case of the honey gums, the addition of honey substantially increases the sugar content due to the natural sugars present in honey in very high amounts.
3.1.2 Puncture test
Figure 5 presents the results for the crust (Figure 5(a)) and inner firmness (Figure 5(b)), i.e. the firmness of the outer layer and that of the inner mass, and that have similar meaning as the hardness previously described for the compression test. The statistical test ANOVA evidenced that the small differences observed for the crust or inner firmness were not significant either among samples or when comparing the top and bottom faces (crust firmness: F = 1.449, p = 0.190; inner firmness: F = 0.540, p = 0.803). The Strawberry & Anise gum was softer, with lower values of crust firmness (0.86 and 0.80 N for top and bottom faces, respectively) and inner firmness (0.63 and 0.65 N for top and bottom faces, respectively).
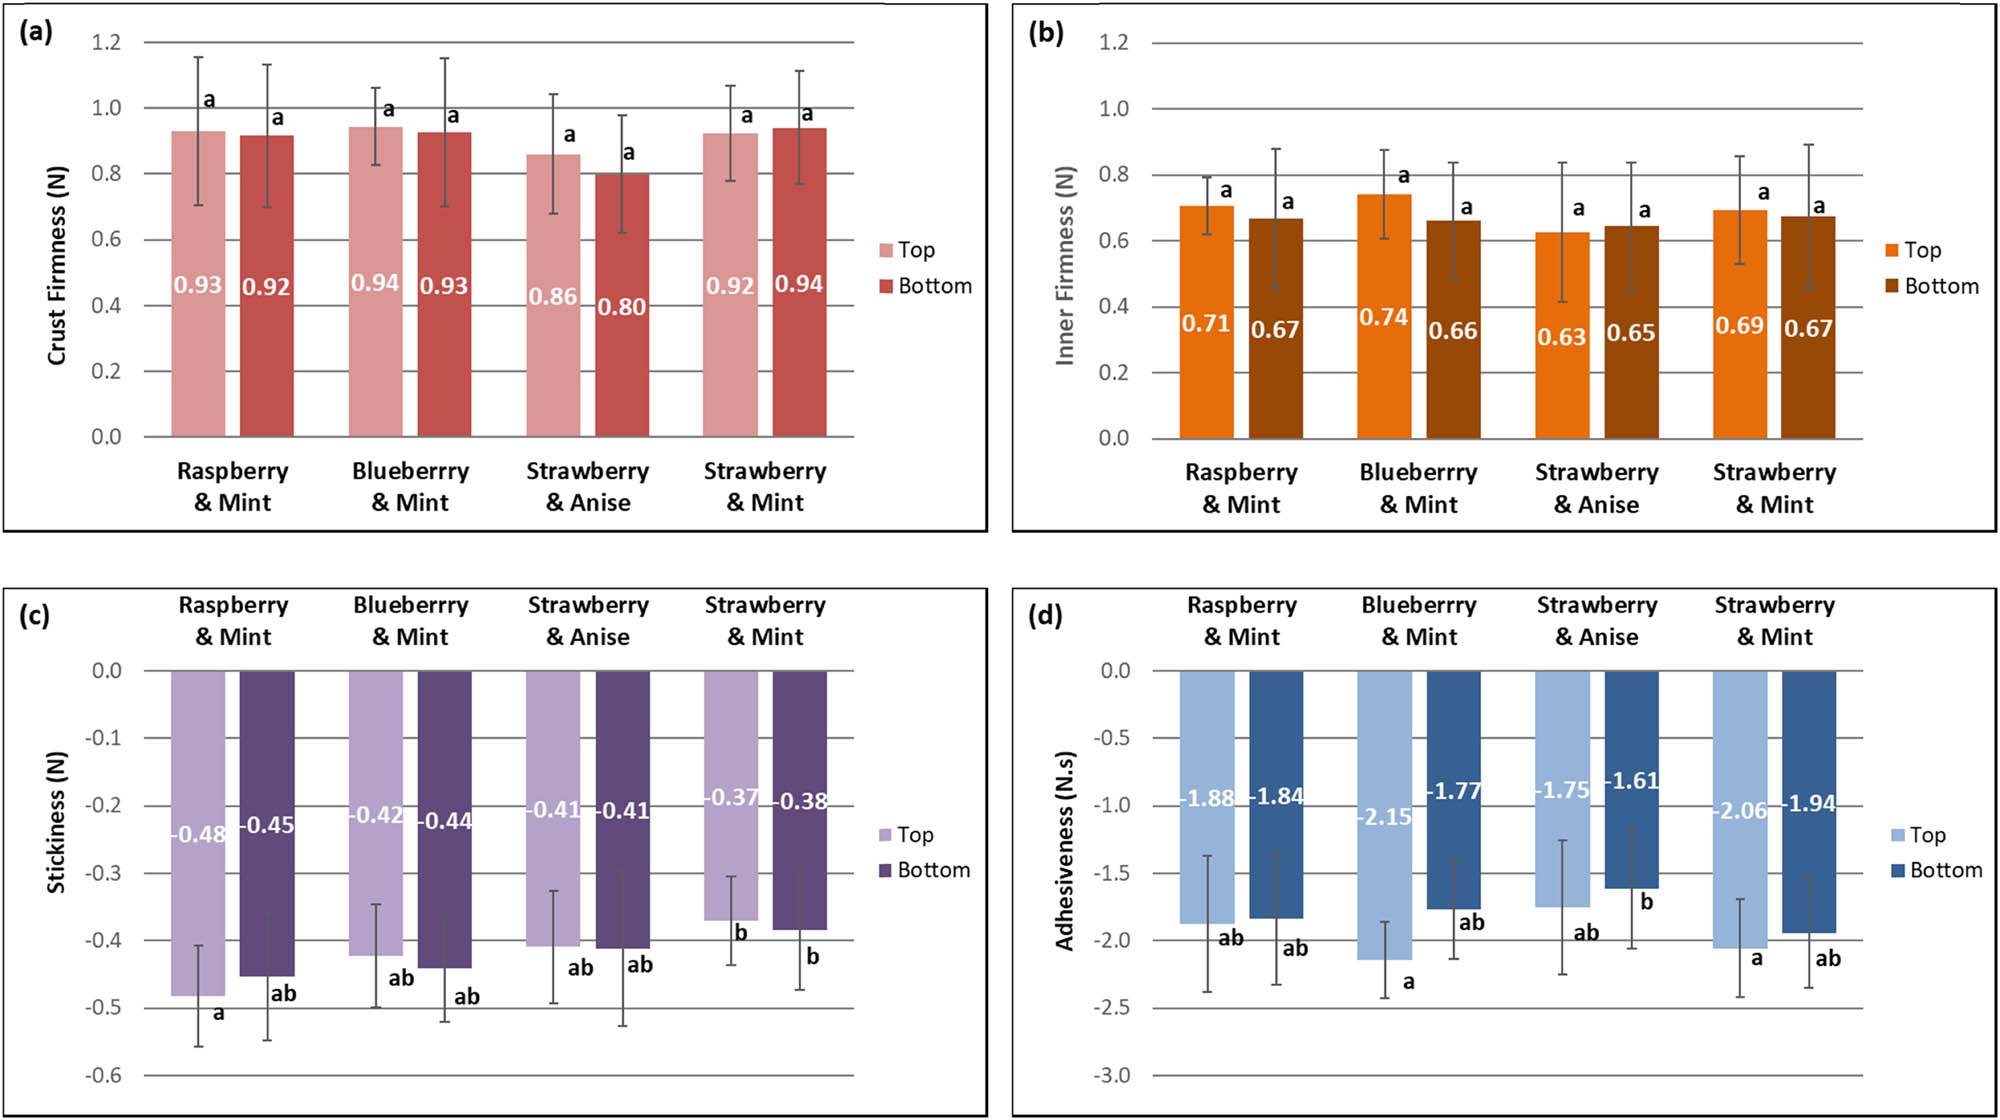
Textural properties on top and bottom faces of the jelly gums, obtained by the puncture test: (a) crust firmness, (b) inner firmness, (c) stickiness and (d) adhesiveness (bars with the same letter are not statistically different at 5% significance level – ANOVA with Tukey test).
Figure 5 also shows the results for adhesiveness (Figure 5(c)) as measured by the puncture test and stickiness (Figure 5(d)), which corresponds to the lowest value of force (negative). Adhesiveness was higher for the top faces of the varieties Blueberry & Mint and Strawberry & Mint, and lower for the bottom face of sample Strawberry & Anise, being these differences statistically significant (ANOVA, F = 3.599, p = 0.001). These results are different from those obtained with the compression test, because in the case of the compression test all measurements are made with the probe on the surface, while with the puncture test the probe actually penetrates inside the sample mass. Finally, stickiness was highest for the Raspberry & Mint gum (absolute values of 0.48 and 0.45 N, respectively, for top and bottom faces) and lowest for sample Strawberry & Anise (absolute value of 0.41 N for both faces), with statistically significant differences (ANOVA, F = 3.258, p = 0.003), being this last sample the one also with the lowest adhesiveness (absolute values of 1.75 and 1.61 N, respectively, for top and bottom faces).
Figure 6 (graphs (a) to (d)) also shows the results for the textural attributes calculated from the puncture test, but considering both faces jointly. The results of statistical analysis revealed that the differences for crust firmness and inner firmness were not significant (ANOVA results, respectively: F = 3.010, p = 0.052; F = 0.547, p = 0.633), while those for adhesiveness and stickiness were significant (ANOVA results, respectively: F = 7.916, p < 0.0005; F = 4.237, p = 0.007). The sample Strawberry & Anise was softer on the outside and inside (0.83 and 0.64 N, respectively), with a low stickiness (absolute value of 0.41 N) and also a low adhesiveness (absolute value 1.68 N s).
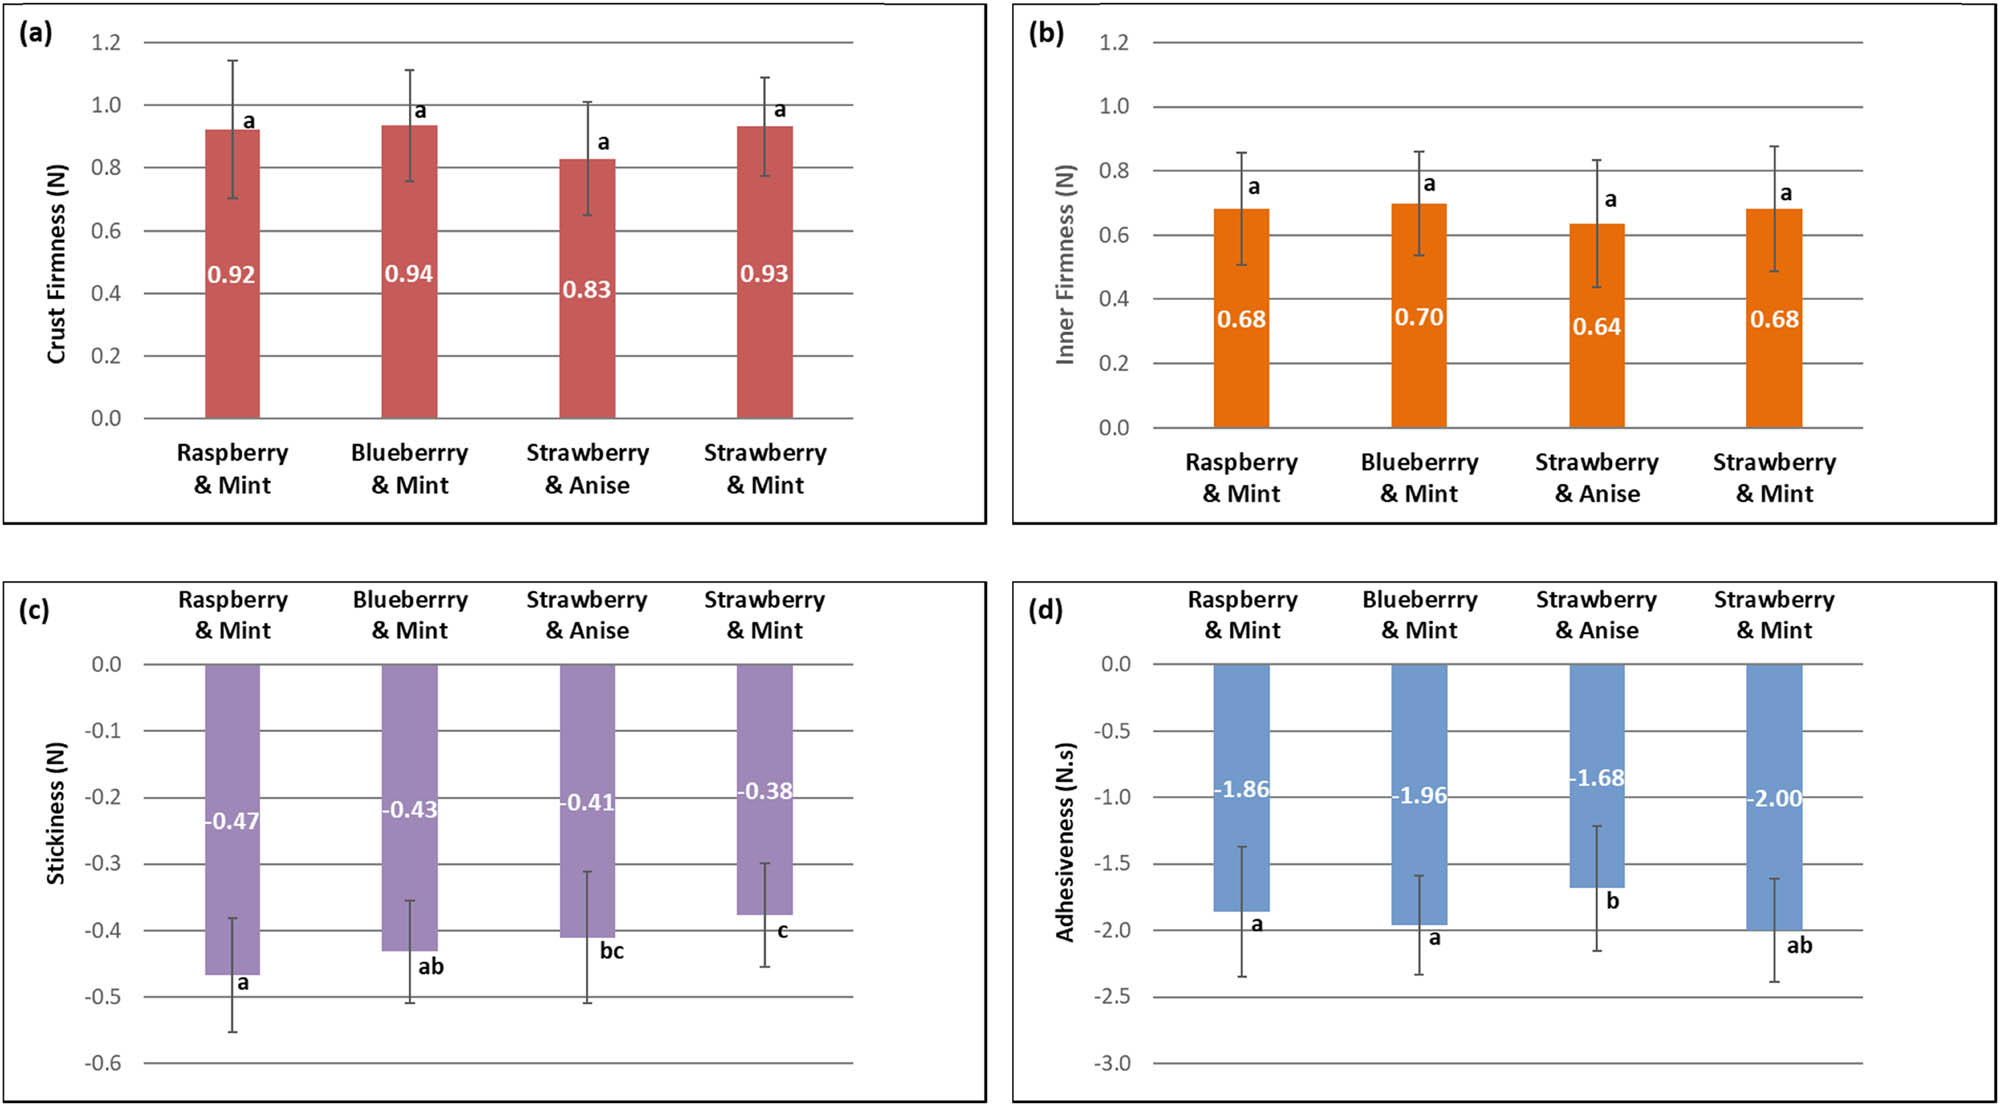
Textural properties of the jelly gums as a whole, obtained by the puncture test: (a) crust firmness, (b) inner firmness, (c) stickiness and (d) adhesiveness (bars with the same letter are not statistically different at 5% significance level – ANOVA with Tukey test).
Our results of the puncture test are a very important complement for the evaluation of the textural attributes of the products developed, although it was not possible to compare our results with similar work in the literature, because the few studies found in the literature only evaluated texture through the compression test. Nevertheless, the fact that there is nothing in the literature about this type of test also confirms the innovativeness of our approach to a more detailed analysis of the textural properties. This is important from the point of view of obtaining products with less additives and no added sugar that still have interesting properties to be marketed in this segment of food products.
3.2 Correlations
Table 1 presents the values of the Pearson correlations obtained for all the variables studied, i.e. the textural properties obtained with both tests. It is interesting to observe that, in general terms, the properties obtained with the compression test are not correlated with those obtained with the puncture test, which is explained by the highly different natures of both tests: while one test involves the compression of the sample on its surface, the other test involves the perforation into the sample inside. However, for each of the tests independently, there are expressive correlations, as demonstrated for example by the correlations between chewiness and hardness (r = 0.861) and between Cohesiveness and resilience (r = 0.822) in the compression test, which are considered very strong. In the first case, this is expected, given that chewiness is directly related to hardness, as demonstrated by equation (6). In the second case, it is also expected that the sample having the highest cohesiveness also shows a higher capacity in terms of resilience. As for the properties of the puncture test, there are not so strong correlations but there are four cases in which the values are considered moderate (0.4 ≤ r < 0.6): crust firmness with inner firmness with adhesiveness and with stickiness (r = 0.459, r = −0.447, r = −0.458, respectively), and inner firmness with adhesiveness (r = −0.502). In some of these cases, the correlations are negative, which means that the variables are inversely correlated, meaning that by increasing one variable the other decreases accordingly. For example, the harder is a sample the less tendency it has to adhere to the surfaces it contacts with, so less adhesive it is. The same was verified for chewiness and adhesives, which are inversely correlated, like for hardness, which is expected considering that hardness and chewiness are directly linked (equation (6)).
Pearson correlations between the textural properties
| Propertyb | Compression test | Puncture test | |||||||||
|---|---|---|---|---|---|---|---|---|---|---|---|
| HAR | ADH | RES | SPR | CHE | COH | CRFIR | INFIR | ADHES | STI | ||
| Compression | HAR | 1 | |||||||||
| ADH | −0.226b | 1 | |||||||||
| RES | −0.266b | 0.497b | 1 | ||||||||
| SPR | 0.007 | 0.217b | 0.453b | 1 | |||||||
| CHE | 0.861b | −0.039 | 0.145 | 0.396b | 1 | ||||||
| COH | −0.267b | 0.359b | 0.822b | 0.440b | 0.214b | 1 | |||||
| Puncture | CRFIR | 0.031 | 0.034 | −0.020 | −0.118 | −0.018 | −0.021 | 1 | |||
| INFIR | −0.118 | 0.084 | 0.066 | 0.056 | −0.107 | 0.013 | 0.459b | 1 | |||
| ADHES | −0.020 | 0.029 | −0.010 | −0.064 | 0.022 | 0.135 | −0.447b | −0.502b | 1 | ||
| STI | 0.045 | −0.247b | −0.087 | −0.046 | 0.052 | 0.016 | −0.458b | −0.336b | 0.218b | 1 | |
- a
HAR = hardness, ADH = adhesiveness, RES = resilience, SPR = springiness, CHE = chewiness, COH = cohesiveness, CRFIR = crust firmness, INFIR = inner firmness, ADHES = adhesiveness (puncture), STI = stickiness.
- b
Correlation is significant at the 0.01 level.
3.3 Factor analysis
From the analysis of the correlation matrix, it was possible to observe that there were some correlations between the variables. From these, nine values were higher than 0.4, being the two highest of them over 0.8 (0.861 and 0.822). The values reflect some relevant correlations between the variables, which is indicative of the possibility to apply FA. The value found for the KMO in this case was poor (0.396) following the classification of Kaiser and Rice (Kaiser and Rice 1974), but, on the other hand, the results of the Bartlett’s confirmed that FA could successfully be applied since the p-value was highly significant (p < 0.0005), which means that the null hypothesis “H0: The correlation matrix was equal to the identity matrix” is rejected. Analysis of the anti-image matrix revealed that most values of Measure of Sampling Adequacy (MSA) were higher than 0.5, meaning that in general the variables were adequate to include in the analysis (values of MSA for the variables: HAR = 0.262, ADH = 0.741, RES = 0.764, SPR = 0.216, CHE = 0.276, COH = 0.317, CRFIR = 0.599, INFIR = 0.744, ADHES = 0.618, STI = 0.579).
The solution obtained by the rotation of FA with PCA produced three components, based on the Kaiser criterion (eigenvalues ≥1). The solution explained 68.8% of the total variance, distributed by the different factors extracted as follows: F1 – 26.5%, F2 – 22.3% and F3 – 20.0%.
The largest fraction of variance explained by the FA solution was 98.6% for variable chewiness, followed closely by hardness (93.9%). The variable with the lowest communality was adhesiveness-puncture (0.441), and thus all variables had communalities higher than 0.400 (communalities for the extracted variables: HAR = 0.939, ADH = 0.533, RES = 0.831, SPR = 0.528, CHE = 0.986, COH = 0.778, CRFIR = 0.668, INFIR = 0.616, ADHES = 0.557, STI = 0.441).
The rotation procedure achieved convergence in four iterations and allowed extracting the three factors aforementioned, which group the variables as shown in Table 2.
Component matrix obtained by FA with Varimax rotation
| Propertya | Factor 1 | Factor 2 | Factor 3 | |
|---|---|---|---|---|
| Compression | HAR | (*) | (*) | 0.939 |
| ADH | 0.694 | (*) | (*) | |
| RES | 0.911 | (*) | (*) | |
| SPR | 0.639 | (*) | (*) | |
| CHE | (*) | (*) | 0.970 | |
| COH | (*) | (*) | (*) | |
| Puncture | CRFIR | (*) | 0.814 | (*) |
| INFIR | (*) | 0.777 | (*) | |
| ADHES | (*) | −0.734 | (*) | |
| STI | (*) | −0.646 | (*) |
(*) Loading under 0.4 was excluded.
- a
HAR = hardness, ADH = adhesiveness, RES = resilience, SPR = springiness, CHE = chewiness, COH = cohesiveness, CRFIR = crust firmness, INFIR = inner firmness, ADHES = adhesiveness (puncture), STI = stickiness.
The Factor 2 was evidently linked to textural properties which were obtained by the puncture test, clearly distinguishing from the properties obtained by the compression test, included in Factors 1 and 3. Furthermore, variable loadings in factor 2 were considerably high, the lowest being in absolute value equal to 0.646, which is indicative that all the input variables for this factor had important contributions for the definition of factor F2. In contrast, the properties of the compression test were divided, so that hardness and chewiness constituted a separate actor (Factor 3), with very high loading for both variables. These two textural attributes are tightly related through or as seen by equation (6). Finally, adhesiveness, resilience and springiness defined Factor 1, also with high loadings, particularly for resilience. The variable cohesiveness showed an irrelevant loading (under 0.4) in any of the three factors considered.
4 Conclusions
The results of the present study confirmed the interest in recurring to more than one type of test when performing analysis of the textural characteristics, since the obtained results complement each other. Regarding the texture of the jelly gums analysed, some differences were observed when comparing the top and bottom faces. The results of the compression test indicated that the Strawberry & Anise gums were among the softer and with lower resilience and chewiness, although being more adhesive. The puncture test revealed that the sample Strawberry & Mint presented the highest adhesiveness and the lowest stickiness. Furthermore, some of the properties determined by the compression test showed very strong correlations, while for most of the properties determined by the puncture test moderate correlations were found. Finally, FA extracted three factors, one clearly associated with the puncture properties and the other two related to the compression properties, in which case the hardness and chewiness constituted a separate factor by themselves.
These results indicated some textural properties of the jelly gums developed, which are in line with desired attributes for this kind of product. However, the role of the consumer is fundamental to achieve success in the marketing of this product, and therefore additional studies about consumer acceptance are recommended.
Acknowledgments
This work is funded by National Funds through the FCT – Foundation for Science and Technology, I.P., within the scope of the project Refª UIDB/00681/2020. Furthermore, we would like to thank the CERNAS Research Centre and the Polytechnic Institute of Viseu for their support.
Conflict of interest: Authors declare no conflict of interest.
References
[1] Avelar MHM, Efraim P. Alginate/pectin cold-set gelation as a potential sustainable method for jelly candy production. LWT. 2020;123:109119. 10.1016/j.lwt.2020.109119.Search in Google Scholar
[2] Broen MPG, Moonen AJH, Kuijf ML, Dujardin K, Marsh L, Richard IH, et al. Factor analysis of the Hamilton depression rating scale in Parkinson’s disease. Parkinson Relat Disord. 2015;21:142–6. 10.1016/j.parkreldis.2014.11.016.Search in Google Scholar PubMed
[3] Cappa C, Lavelli V, Mariotti M. Fruit candies enriched with grape skin powders: physicochemical properties. LWT Food Sci Technol. 2015;62:569–75. 10.1016/j.lwt.2014.07.039.Search in Google Scholar
[4] Codella R, Terruzzi I, Luzi L. Sugars, exercise and health. J Affect Disord Nutr Exercise Affect Disord 2017;224:76–86. 10.1016/j.jad.2016.10.035.Search in Google Scholar PubMed
[5] Cruz AC, Guiné RPF, Gonçalves JC. Drying kinetics and product quality for convective drying of apples (cvs. golden delicious and Granny Smith). Int J Fruit Sci. 2015;15:54–78. 10.1080/15538362.2014.931166.Search in Google Scholar
[6] Dzhanfezova T, Barba-Espín G, Müller R, Joernsgaard B, Hegelund JN, Madsen B, et al. Anthocyanin profile, antioxidant activity and total phenolic content of a strawberry (Fragaria × ananassa Duch) genetic resource collection. Food Biosci. 2020;36:100620. 10.1016/j.fbio.2020.100620.Search in Google Scholar
[7] Fang J. Classification of fruits based on anthocyanin types and relevance to their health effects. Nutrition. 2015;31:1301–6. 10.1016/j.nut.2015.04.015.Search in Google Scholar PubMed
[8] Gonçalves C, Guiné RPF, Costa DVTA, Gonçalves FJ. Evaluation of bioactive phenols in blueberries from different cultivars. Int J Biol Food Vet Agric Eng. 2015;9:281–4.Search in Google Scholar
[9] Guiné R, Gonçalves F. Bioactive compounds in some culinary aromatic herbs and their effects on human health. Mini-Rev Med Chem. 2016;16:855–66.10.2174/1389557516666160211120540Search in Google Scholar PubMed
[10] Guiné R, Gonçalves F. Chemistry and health effects of bioactive compounds in selected culinary aromatic herbs. Curr Nutr Food Sci. 2015;12:145–64.10.2174/1573401311666150327001113Search in Google Scholar
[11] Guiné R, Correia P, Florença S. Development of Jelly gums with fruits and herbs: colour and sensory evaluation. J Int Sci Publ. 2018a;6:340–9.Search in Google Scholar
[12] Guiné R, Gonçalves C, Matos S, Gonçalves F, Costa DVTA, Mendes M. Modeling through artificial neural networks of the phenolic compounds and antioxidant activity of blueberries. Iranian J Chem Chem Eng. 2018b;37:193–212.Search in Google Scholar
[13] Kaiser HF, Rice J. Little Jiffy, Mark IV. Educ Psychol Meas. 1974;34:111–7. 10.1177/001316447403400115.Search in Google Scholar
[14] Kushner RF, Kahan S. Introduction: the state of obesity in 2017. Medical Clinics of North America. Obes Med. 2018;102:1–11. 10.1016/j.mcna.2017.08.003.Search in Google Scholar
[15] Maier T, Schieber A, Kammerer DR, Carle R. Residues of grape (Vitis vinifera L.) seed oil production as a valuable source of phenolic antioxidants. Food Chem. 2009;112:551–9. 10.1016/j.foodchem.2008.06.005.Search in Google Scholar
[16] Maroco J. Análise Estatística com o SPSS Statistics, 5th ed. Report number, Brazil, 2012.Search in Google Scholar
[17] McCann MJ, Gill CIR, O’Brien G, Rao JR, McRoberts WC, Hughes P, et al. Anti-cancer properties of phenolics from apple waste on colon carcinogenesis in vitro. Food Chem Toxicol. 2007;45:1224–30. 10.1016/j.fct.2007.01.003.Search in Google Scholar
[18] Mutlu C, Tontul SA, Erbaş M. Production of a minimally processed jelly candy for children using honey instead of sugar. LWT. 2018;93:499–505. 10.1016/j.lwt.2018.03.064.Search in Google Scholar
[19] Pestana MH, Gageiro JN. Análise de Dados para Ciências Sociais – a complementaridade do SPSS, 6a ed. ed. Edições Sílabo, Brasil, 2014.Search in Google Scholar
[20] Regev-Tobias H, Reifen R, Endevelt R, Havkin O, Cohen E, Stern G, et al. Dietary acculturation and increasing rates of obesity in Ethiopian women living in Israel. Nutrition. 2012;28:30–4. 10.1016/j.nut.2011.02.010.Search in Google Scholar
[21] Rohm AJ, Swaminathan V. A typology of online shoppers based on shopping motivations. J Bus Res Market Web Behav Strat Pract Publ Pol. 2004;57:748–57. 10.1016/S0148-2963(02)00351-X.Search in Google Scholar
[22] Rossi MC, Bassett MN, Sammán NC. Dietary nutritional profile and phenolic compounds consumption in school children of highlands of Argentine Northwest. Food Chem. 2018;238:111–6. 10.1016/j.foodchem.2016.12.065.Search in Google Scholar PubMed
[23] Song WO, Wang Y, Chung CE, Song B, Lee W, Chun OK. Is obesity development associated with dietary sugar intake in the US? Nutrition 2012;28:1137–41. 10.1016/j.nut.2012.03.008.Search in Google Scholar PubMed
[24] Soutinho S, Guiné RPF, Jordão A, Gonçalves F. Phenolic compounds in red fruits produced in organic farming at maturation stage. J Biol Vet Agric Food Eng. 2013;7:535–8.Search in Google Scholar
[25] Stevens JP. Applied multivariate statistics for the social sciences, 5th edn. New York: Routledge; 2009.Search in Google Scholar
[26] Teng H, Fang T, Lin Q, Song H, Liu B, Chen L. Red raspberry and its anthocyanins: bioactivity beyond antioxidant capacity. Trends Food Sci Technol. 2017;66:153–65. 10.1016/j.tifs.2017.05.015.Search in Google Scholar
[27] Verardo V, Glicerina V, Cocci E, Frenich AG, Romani S, Caboni MF. Determination of free and bound phenolic compounds and their antioxidant activity in buckwheat bread loaf, crust and crumb. LWT Food Sci Technol. 2018;87:217–24. 10.1016/j.lwt.2017.08.063.Search in Google Scholar
[28] Villa M, Qiu J, Pearce EL. A sweet deal for diabetes. Trends Endocrinol Metabol. 2018;29:1–2. 10.1016/j.tem.2017.10.006.Search in Google Scholar PubMed
[29] Vu HT, Scarlett CJ, Vuong QV. Phenolic compounds within banana peel and their potential uses: a review. J Funct Foods. 2018;40:238–48. 10.1016/j.jff.2017.11.006.Search in Google Scholar
[30] Xie L, Su H, Sun C, Zheng X, Chen W. Recent advances in understanding the anti-obesity activity of anthocyanins and their biosynthesis in microorganisms. Trends Food Sci Technol. 2018;72:13–24. 10.1016/j.tifs.2017.12.002.Search in Google Scholar
© 2020 Raquel P. F. Guiné et al., published by De Gruyter
This work is licensed under the Creative Commons Attribution 4.0 International License.
Articles in the same Issue
- Regular Articles
- Synergistic and antagonistic effects of soil applied P and Zn fertilizers on the performance, minerals and heavy metal composition of groundnut
- The Analysis of Nutritional Habits of the Third Age Students in Poznań
- Biochar, poultry manure and NPK fertilizer: sole and combine application effects on soil properties and ginger (Zingiber officinale Roscoe) performance in a tropical Alfisol
- Nutritional and functional properties of maize-oyster mushroom (Zea mays-Pleurotus ostreatus) based composite flour and its storage stability
- Rural Folks Perception of Suicide Drivers in rural communities of Delta State, Nigeria: Implications for Societal and Agricultural Security
- Evaluation of Potato (Solanum tuberosum L.) Varieties for Yield and Some Agronomic Traits
- Micropropagation, Callus Induction and Regeneration of Ginger (Zingiber officinale Rosc.)
- The impact of foliar feeding on the yield components of three winter rape morphotypes (Brassica napus L.)
- The effect of soil water content and biochar on rice cultivation in polybag
- Influence of Azospirillum brasilense associated with silicon and nitrogen fertilization on macronutrient contents in corn
- Effect of Christmas Island rock phosphate and rice straw compost application on soil phosphorus availability and maize (Zea mays L.) growth in a tropical acid soil of Kelantan, Malaysia
- The evolution of Romanian agritourism and the role of European Union subsidies in rural areas
- Assessment of crop farmers coping strategies to pastoralism/nomad activities in Nigeria
- Assessing yield stability in African yam bean (Sphenostylis stenocarpa) performance using year effect
- Walnut leaf extract-based green synthesis of selenium nanoparticles via microwave irradiation and their characteristics assessment
- Evaluating the water productivity by Aquacrop model of wheat under irrigation systems and algae
- Micronutrients status of mango (Mangifera indica) orchards in Multan region, Punjab, Pakistan, and relationship with soil properties
- Molecular studies for drought tolerance in some Egyptian wheat genotypes under different irrigation systems
- Biosynthesized silver nanoparticles using Ulva lactuca as a safe synthetic pesticide (in vitro)
- Development of SPE clean-up procedure for acrylamide determination from potato-based products by GC-MS/MS
- Insulative effect of plastic mulch systems and comparison between the effects of different plant types
- Trends and constraints in the production and utilization of cowpea leaves in the arid and semi-arid lands of Kenya
- Microbiome of abandoned agricultural and mature tundra soils in southern Yamal region, Russian Arctic
- Method of biochar application affects growth, yield and nutrient uptake of cowpea
- Identity gaps and negotiations among layers of young farmers: Case study in Indonesia
- Genetically modified crops in India: Experiments with Bt Cotton to explore the road ahead
- Effect of phyto-extracts of neem (Azadirachta indica) and garlic (Allium sativum) on leaf spot disease of groundnut (Arachis hypogaea L.)
- Influence of cellulose fibers on physicochemical properties of biodegradable films based on polysaccharide derivatives
- Do the determinants of food security differ in improved rice variety adoption? Evidence from Sierra Leone
- Assessment of yield components of some cassava (Manihot esculenta Crantz) genotypes using multivariate analysis such as path coefficients
- Microbiome of post-technogenic soils of quarries in the Republic of Bashkortostan (Russia)
- Occurrence of arbuscular mycorrhizal fungi spores in soils of some legumes and their response to varying concentrations of phosphorus application
- Baseline fertility status of a gravelly Alfisol in a derived savannah agro-ecological zone of Nigeria
- Effect of strain, sex and slaughter weight on growth performance, carcass yield and quality of broiler meat
- Palm oil plantation and cultivation: Prosperity and productivity of smallholders
- Seasonal normalized difference vegetation index responses to air temperature and precipitation in Baghdad
- Classification and geovisualization process of soil data using a web-based spatial information system
- Assessment of stakeholders’ contributions to livestock development in Delta State, Nigeria: Rural infrastructure intervention
- Linear and structural changes in rural space – the positive and problematic aspects (case of Latvia)
- Farmers’ responses to organic rice farming in Indonesia: Findings from central Java and south Sulawesi
- Interactive effects of Potato virus Y and Potato leafroll virus infection on potato yields in Uganda
- Adoption of agricultural practices with climate smart agriculture potentials and food security among farm households in northern Nigeria
- Green approach in gold, silver and selenium nanoparticles using coffee bean extract
- Value chain for agritourism products
- Trichoderma asperellum affects Meloidogyne incognita infestation and development in Celosia argentea
- Growth, chlorophyll content and productivity responses of maize to magnesium sulphate application in calcareous soil
- Gene action in low nitrogen tolerance and implication on maize grain yield and associated traits of some tropical maize populations
- Zambian farm blocks: A vehicle for increased private sector investments
- Farm size and its impact on land use: The case of the South African private wildlife industry
- Characterizing macropore structure of agrosoddy-podzolic soil using computed tomography
- Influence of priming on germination, development, and yield of soybean varieties
- Review Articles
- Zinc biofortification as an innovative technology to alleviate the zinc deficiency in human health: a review
- Biological management of allelopathic plant Parthenium sp.
- Microbial antagonists against plant pathogens in Iran: A review
- Communication
- Risk assessment of Ni, Cr, and Si release from alkaline minerals during enhanced weathering
- Phylogenetic relationships among accessions in Citrus and related genera based on the insertion polymorphism of the CIRE1 retrotransposon
- Gamma radiosensitivity study on wheat (Triticum turgidum ssp. durum)
- Special Issue on the 10th Circumpolar Agriculture Conference 2019
- Preface to the Special Issue on the 10th Circumpolar Agriculture Conference 2019
- Rumen bacterial community of young and adult of reindeer (Rangifer tarandus) from Yamalo-Nenets Autonomous District of Russia
- Carcass weight of Greenlandic lambs in relation to grazing area biomass
- Transnational cooperation to develop local barley to beer value chains
- Addition of biochar to acidic boreal podzolic soils enhances micronutrient availability and crop productivity
- Digitalisation in a local food system: Emphasis on Finnish Lapland
- Abandoned agricultural soils from the central part of the Yamal region of Russia: morphology, diversity, and chemical properties
- Fishing as an important source of food in the Arctic and subarctic zones of Yakutia
- Special Issue on the APA 2019 - 11th Triennial Conference
- Yield potential of sandponically produced sweetpotato (Ipomoea batatas (L.) Lam) pre-basic seed for selected genotypes
- Monitoring with social media: Experiences from “integrating” WhatsApp in the M&E system under sweet potato value chain
- Breeding farmer and consumer preferred sweetpotatoes using accelerated breeding scheme and mother–baby trials
- Decentralised sweetpotato (Ipomoea batatas) vine multiplication in Lake Zone, Tanzania: Five years later
- Mineral fertilizer use in land-scarce conditions: Case of Rwanda
- Assessment of the roles and farmer-preferred traits of sweetpotato in a crop-livestock farming system in Rwanda: implications for breeding dual-purpose varieties
- A public–private partnership to speed up potato breeding
- Dietary acrylamide intake by potato crisps consumers: A case of Nairobi County
- Special Issue on ICESAT 2019
- Biochemical activity and bioassay on maize seedling of selected indigenous phosphate-solubilizing bacteria isolated from the acid soil ecosystem
- Identifying best parameters of particleboard bonded with dextrin-based adhesives
- Performance of rice paddy varieties under various organic soil fertility strategies
- Improved strength properties of LVL glued using PVAc adhesives with physical treatment-based Rubberwood (Hevea brasiliensis)
- Evaluation and possible mechanism of beet armyworm (Spodoptera exigua Hubner) resistance to chlorpyrifos and their sensitivity to neem oil insecticides
- Fermented compost and N-fertilizer for enhancing the growth and productivity of purple eggplant on vertisols
- Bioactive peptide effect on brain activity identified by 2D brain mapping
- Shifting of microbial biodiversity and soil health in rhizomicrobiome of natural forest and agricultural soil
- Special Issue on CERNAS 2020
- Evaluation of consumer habits and knowledge about dietary fibre and fibre-rich products in Turkish population
- Evaluation of texture in jelly gums incorporating berries and aromatic plants
- Food choice motivations and perception of a healthy diet in a developing Mediterranean country
- The evolution of the milk sector in Portugal: Implications from the Common Agricultural Policy
- Energetic and exergetic analysis of a convective drier: A case study of potato drying process
- Cluster analysis to the factors related to information about food fibers: A multinational study
- Study of the drying kinetics and calculation of mass transfer properties in hot air drying of Cynara cardunculus
- Short food supply chains – a growing movement. The case study of the Viseu Dão Lafões Region
- Evaluation of phenolic compounds and antioxidant activity in some edible flowers
- Chemical composition and study on liquefaction optimization of chestnut shells
- Is organic agriculture a potential public health indicator? Evidence from literature