Ultra-sensitive and rapid response H2S microsensor based on Co–ZnO with ppm level detection
-
Cui Chen
 ,
Yang Zhao
,
Yang Zhao

Abstract
In this research, a novel microsensor specifically engineered for detecting hydrogen sulfide (H2S) gas is introduced. Through chemical precipitation, Co x Zn1−x O (x = 0, 0.05, 0.1, 0.15, 0.2) materials with a flaky structure were produced, and the resulting composite film’s structural, compositional, and morphological properties were examined using XRD, XPS, and SEM analyses. The Co x Zn1−x O material was confirmed through XRD and XPS analyses. SEM images demonstrated that the material exhibits a porous structure and forms a uniform layer across the microsensor device. Co0.1Zn0.9O demonstrated the best gas-sensing performance. When applied on the micro-hotplate, it shows strong sensitivity and selectivity. The results of the experiments revealed that the sensor’s sensitivity is 0.02565 mA ppm−1 (95 % confidence intervals, CI: 0.0255 to 0.0258), demonstrating strong linear correlation 0.99506 (95 % CI: 0.9986 to 0.9977), and offering quick response and recovery intervals between 7.9 s (95 % CI: 7.757 to 8.043) and 6.5 s (95 % CI: 6.357 to 6.643). This gas sensor offers broad application prospects in environmental H2S monitoring.
1 Introduction
Hydrogen sulfide (H2S) is a hazardous, flammable, and corrosive gas, characterized by its distinctive rotten egg-like odor. 1 Exposure to concentrations as low as 20 ppm 2 can cause eye irritation, and levels exceeding 50 ppm 3 can lead to acute poisoning within 1 h, posing significant risks to human health and environmental safety.
Traditional H2S sensors, 4 , 5 based on electrochemical, optical, and catalytic combustion principles, face challenges including large size, high energy consumption, slow response, and instability. In contrast, microsensor-based 6 , 7 H2S sensors have gained attention for their compact size, low cost, rapid response, and high sensitivity.
ZnO 8 is a widely used n-type semiconductor known for its adjustable electronic properties, high surface area, and excellent catalytic performance. It is commonly employed in gas sensors and optoelectronic devices due to its sensitivity, low cost, and ease of synthesis.
However, single-metal oxide gas sensors often exhibit limited sensitivity. 9 A promising approach to enhancing sensor performance is doping with elements like platinum, palladium, aluminum, or copper. These dopants improve gas detection sensitivity and specificity by modifying the band structure, 10 surface morphology, and creating additional active sites for gas interaction.
Research 11 , 12 on cobalt clusters has primarily focused on their magnetic and catalytic properties, with limited attention given to their sensing performance. Recent studies have shown that cobalt-based coordination polymers provide optimal sites for oxygen adsorption, potentially enhancing gas sensitivity. Furthermore, the stability of cobalt clusters at 300 °C makes them promising candidates for durable gas-sensing applications.
Only a few studies have reported the use of Co x Zn1−x O 13 materials for gas sensing. In this work, we synthesized ZnO powder via precursor decomposition method, followed by chemical co-precipitation method to form Co x Zn1−x O. The Co x Zn1−x O nanoflakes were spin-coated onto a micro-hotplate to fabricate a micro-gas sensor. H2S gas concentrations were effectively monitored by analyzing current-time curve variations on the electrochemical workstation.
2 Experimental section
2.1 Preparation of the sensing material Co x Zn1−x O (x = 0, 0.05, 0.1, 0.15, 0.2)
Every reagent employed in this research was of analytical grade quality. To prepare pure ZnO, a solution of oxalic acid dihydrate (COOH)2·2H2O was prepared by dissolving 3.78 g of dehydrated oxalic acid (COOH)2·2H2O in 50 mL of deionized water. Another solution was prepared by dissolving 3.38 g of zinc acetate dihydrate [Zn(CH3COO)2·2H2O, ≈ 0.0154 mol]. The two solutions were mixed and stirred at 60 °C for 5 h. The precipitated zinc oxalate was filtered, washed, and dried at 100 °C for 12 h. Finally, the dried zinc oxalate was calcined at 450 °C for 2 h with a heating rate of 5 K min−1, yielding ZnO powder. 14 Cobalt-doped zinc oxide was synthesized via a chemical co-precipitation method. Zinc acetate dihydrate [Zn(CH3COO)2·2H2O] (0.0022 mol, 0.483 g) of was dissolved in 50 mL of deionized water, and 0.00022 mol (0.064 g) of cobalt nitrate hexahydrate [Co(NO3)2·6H2O] was dissolved in 30 mL of deionized water. The two solutions were mixed under stirring, and a 2 m NaOH solution (∼25 mL) was slowly added dropwise until the pH reached 10. The mixture was stirred continuously for 2 h at room temperature. The resulting precipitate was filtered, washed several times with deionized water and ethanol, and then dried at 100 °C for 12 h. Finally, the dried powder was annealed at 450 °C for 2 h in air (heating rate: 5 K min−1) to obtain Co0.1Zn0.9O. 14 The same procedure was used for the preparation of Co0.05Zn0.95O, Co0.15Zn0.85O and Co0.2Zn0.8O.
2.2 Characterization
A Bruker D8 ADVANCE X-ray diffractometer, running at 40 mA and 40 kV, was employed to examine the crystal structure of the sample. The wavelengths were adjusted to 1.5406 Å for the Cu target and 1.79026 Å for the Co target. The elemental composition of the powder was assessed, and the element content was validated through XPS analysis, carried out with the Thermo Scientific Escalab 250XI device. A monochromatic AlKα source with 1,486.6 eV photon energy was employed for the analysis, operating at 150 W. The spot size was adjusted to 650 μm, with settings of 14.8 kV for voltage and 1.6 A for current. Calibration of the charge was based on the C1s peak of contaminant carbon at 284.8 eV. Full spectra were measured with a 100 eV pass energy and 1 eV step size, while narrow spectra were gathered with a pass energy of 20 eV and a step size of 0.1 eV. To analyze the surface morphology of the samples, a HITACHI S-4800 field-emission scanning electron microscope (SEM) was employed. EDS analysis, conducted with a HORIBA EMAX mics2, employed accelerating voltages of 3 kV or 5 kV and reached a resolution of 50 nm. Measurements were taken under normal indoor temperature settings.
2.3 The gas sensing characteristics of the microsensors
The sensitive material and deionized water were blended in a ratio of 3 : 1 by weight and ground into a fine paste using an agate mortar. This paste was applied onto a micro-hotplate using a micropipette for drop-casting. After drying at room temperature, the material was aged for 48 h in a vacuum oven at 300 °C. The sensing elements then underwent a two-hour heat treatment at 450 °C, which evaporated any bound water and produced a dense oxide layer on the surface of the gas sensor. After cooling, the electrodes were powered using a CNC power supply to provide adequate reaction temperature for the micro-hotplate. An electrical evaluation of the sensor was performed using a gas analysis system (CHI760E, Shanghai Chenhua). For the experiment, the apparatus was situated within a fume hood, and a measured quantity of the target gas, blended with dry air, was introduced into the chamber to engage with the sensitive chip over a set time. Testing of the I-T curve commenced once the CHI760E software was launched.
As illustrated in Figure 1, the experimental setup of the hydrogen sulfide gas sensor designed in this paper comprises a numerical control power supply (DP 100), an electrochemical workstation (CH Instruments), a microsensor chip, a gas chamber, and the reactive gases (hydrogen sulfide gas and gas reaction gases), forming a micro-gas sensing system. One end of the chip is connected to the CNC power supply (DP 100), while the other end is linked to the CHI760E electrochemical workstation (CH Instruments) for real-time monitoring of electrical signals.
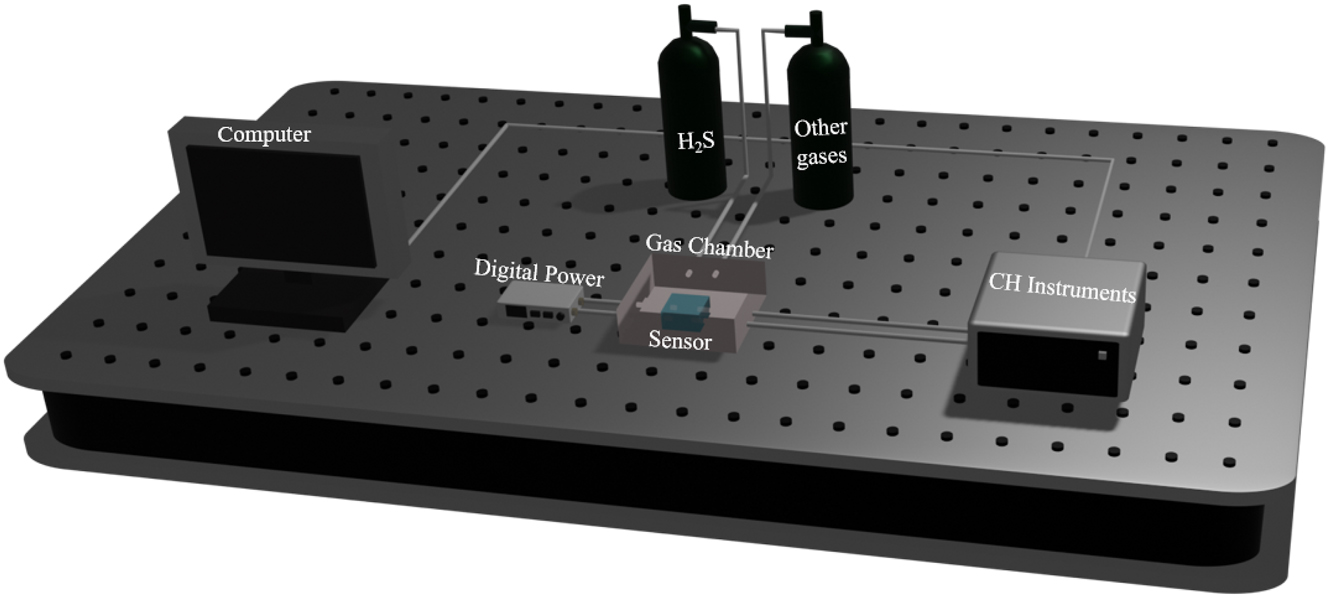
Diagram of the experimental setup for H2S monitoring using a microsensor.
The micro-gas sensor device is shown in Figure 2(a). The internal structure of the chip used in this experiment has a support layer, a sensitive film, two sets of electrodes, one set of heating electrodes and one set of test electrodes. The internal structure of the microsensor chip is shown in Figure 2(b). The size of the chip is 1 × 1 mm2. The gas chamber of the gas sensor is made of 2 mm thick acrylic material, and the internal size is 10 × 5 × 5 cm3, as shown in Figure 2(c). The gas sensor is depicted in Figure 2(d).
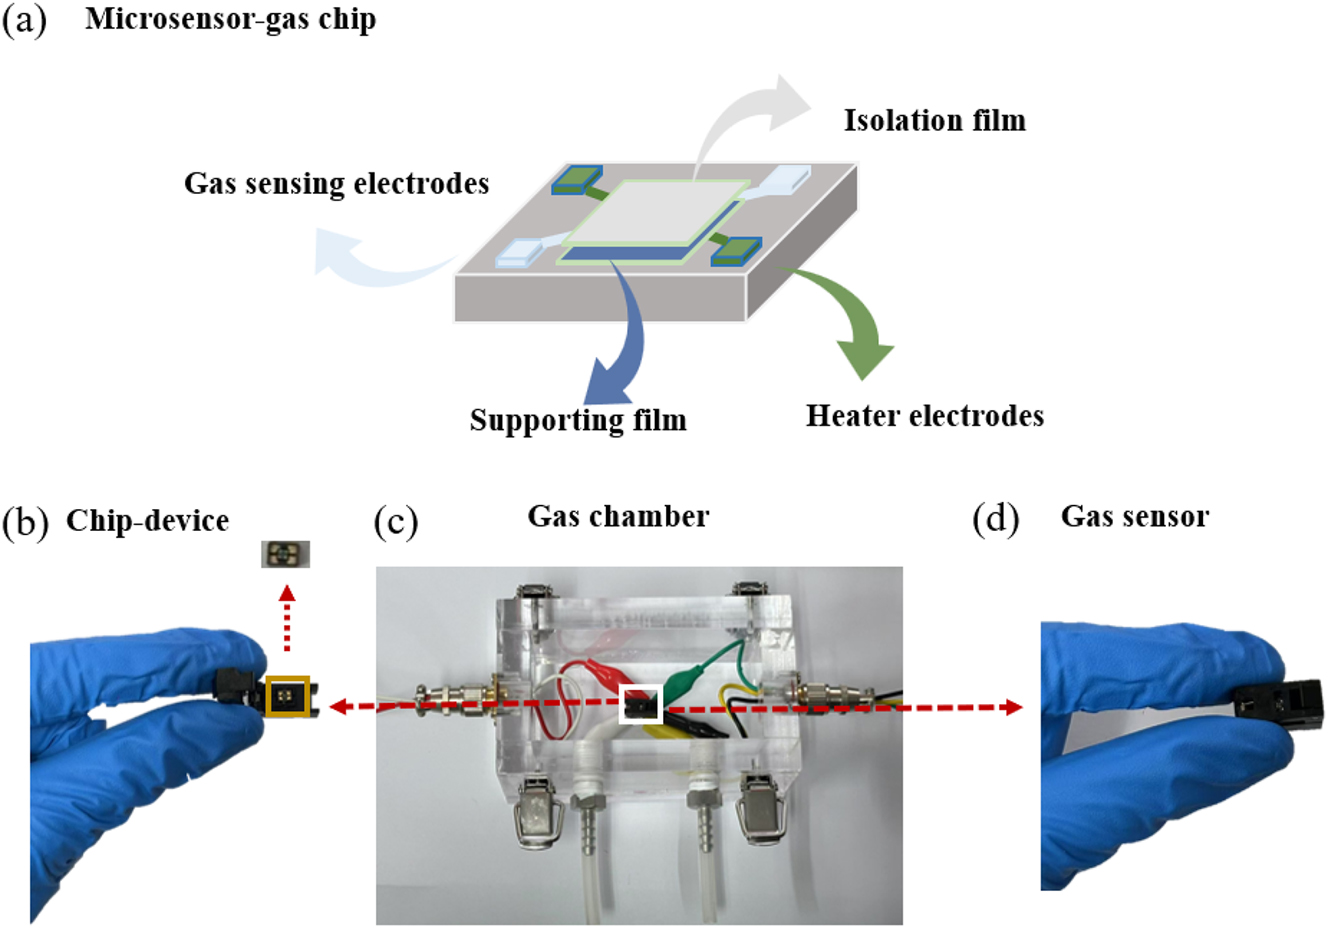
Microsensor of (a) internal structure of the chip, (b) the chip, (c) the chamber, and (d) the gas sensor device.
3 Results and discusion
3.1 XRD characterization
Figure 3 presents the XRD results, obtained using CoKα radiation (λ = 1.79026 Å), where the peaks observed at 2θ diffraction angles of 37.1°, 40.2°, 42.3°, 55.8°, 66.9°, 74.6° and 79.1°, which belong to the (1 0 0), (0 0 2), (1 0 1), (1 0 2), (1 1 0), (1 0 3) and (2 0 0) faces of the hexagonal lattice (space group P63mc, #186; PDF#36-1,451). 15 The angles of the Co-doped ZnO diffraction peaks were consistent with those of undoped ZnO, confirming that the introduction of Co had no effect on altering the crystalline framework of the Co x Zn1−x O (x = 0, 0.05, 0.1, 0.15, 0.2) composition. Indeed a peak was observed in the XRD profile at 43.2° which can be attributed to a Co reflection. 16 No other impurity peaks, apart from those of ZnO and Co, were detected in the experiment, confirming that the Co x Zn1−x O (x = 0, 0.05, 0.1, 0.15, 0.2) sensitive composite material was successfully prepared with good crystallinity.
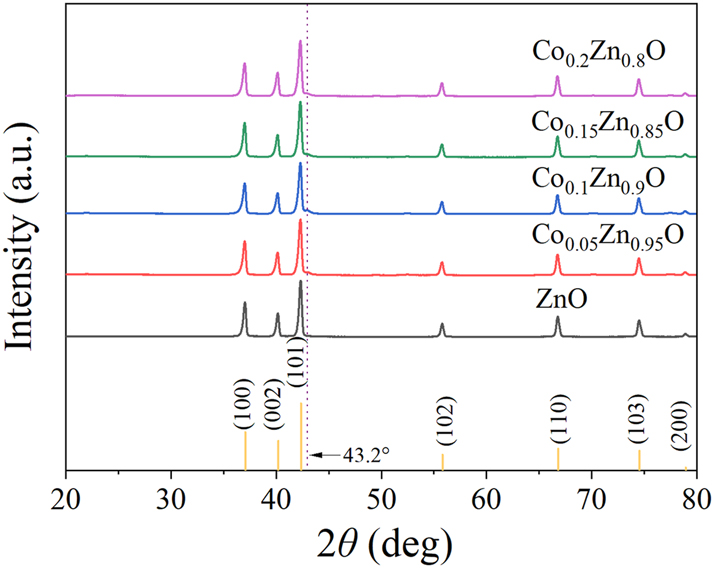
XRD pattern of Co x Zn1−x O (x = 0, 0.05, 0.1, 0.15, 0.2) sensing material.
3.2 XPS characterization
The XPS spectrum for the Co x Zn1−x O (x = 0, 0.05, 0.1, 0.15, 0.2) samples is shown in Figure 4(a). The elements present in the samples are Co, Zn, and O. The C 1s 17 peak corresponds to either organic carbon contamination or a small amount of glycerol that was not completely decomposed in the composite.
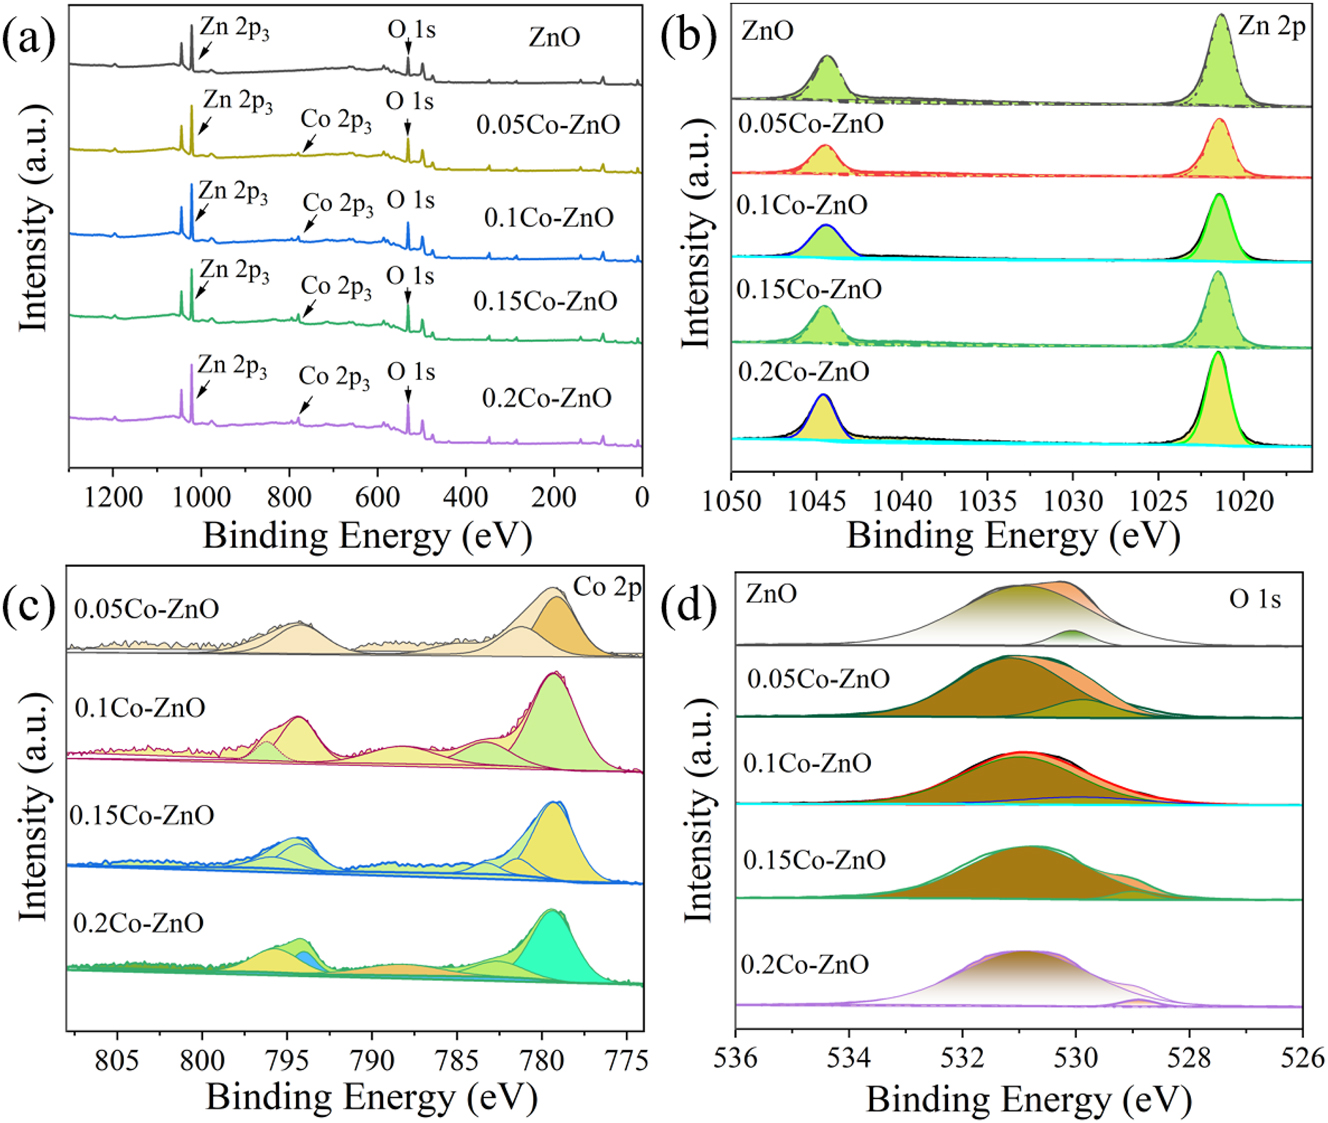
The XPS spectrum. (a) XPS full-scan image of Co x Zn1−x O (x = 0, 0.05, 0.1, 0.15, 0.2), (b) Zn 2p region, (c) Co 2p region, (d) O 1s.
The fitted Zn 2p peaks 18 in Figure 4(b) show binding energies of 1,044.3 eV for Zn 2p 1/2 and 1,022.2 eV for Zn 2p 3/2, respectively. Compared to pure ZnO (1,021.58 eV), the Zn peak in Co3O4/ZnO shifts to a higher binding energy, which suggests strong electronic interactions in the sample, likely due to the interaction between Co3O4 and ZnO. These findings further suggest an enhanced interaction between ZnO and Co3O4, indicating a unique surface architecture in the Co x Zn1−x O materials (x = 0, 0.05, 0.1, 0.15, 0.2). Figure 4(c) shows Co 2p 19 peaks at binding energies of 796.85 eV for Co 2p 1/2 and 779.21 eV for Co 2p 3/2, respectively, indicating that Co is present in both Co2+ and Co3+ states. Due to the low doping content, the signal intensity is relatively weak.
To determine the proportion of chemisorbed oxygen, the O 1s 20 peak was analyzed via XPS testing. As shown in Figure 4(d), deconvolution of the O 1s peak reveals three components. The binding energies measured at 530.84 eV and 531.25 eV are associated with oxygen in the adsorbed state and lattice-bound oxygen, respectively. The binding energy at the adsorbed oxygen site (Oc) is typically attributed to chemisorption on the surface of the sensitive film. As the Co content increases, the binding energy of adsorbed oxygen shifts to higher values. The interaction between oxygen and the material’s surface through chemisorption plays a key role in influencing the response behavior of the gas sensor. 21
3.3 SEM characterization
The prepared sensitive materials were mechanically ground, then dispersed in deionized water, and finally tested at room temperature. The SEM images presented in Figure 5 illustrate the structural morphology of the Co x Zn1−x O (x = 0, 0.05, 0.1, 0.15, 0.2) sensitive materials at magnifications of 5×, 10×, and 20×,. The Co-doped sensitive material has a relatively regular and loose porous spherical material on the surface. Under 50× magnification, the surface of the sensitive materials is clearly discernible. The images reveal unevenly shaped droplets of various sizes, characterized by a porous, loosely structured arrangement. 22 The smallest irregular spherical grains are primarily distributed in the 20–25 μm range, with clear particle boundaries and relatively smooth surfaces. Gaps between the sheets enhance the ability to adsorb and desorb gases.
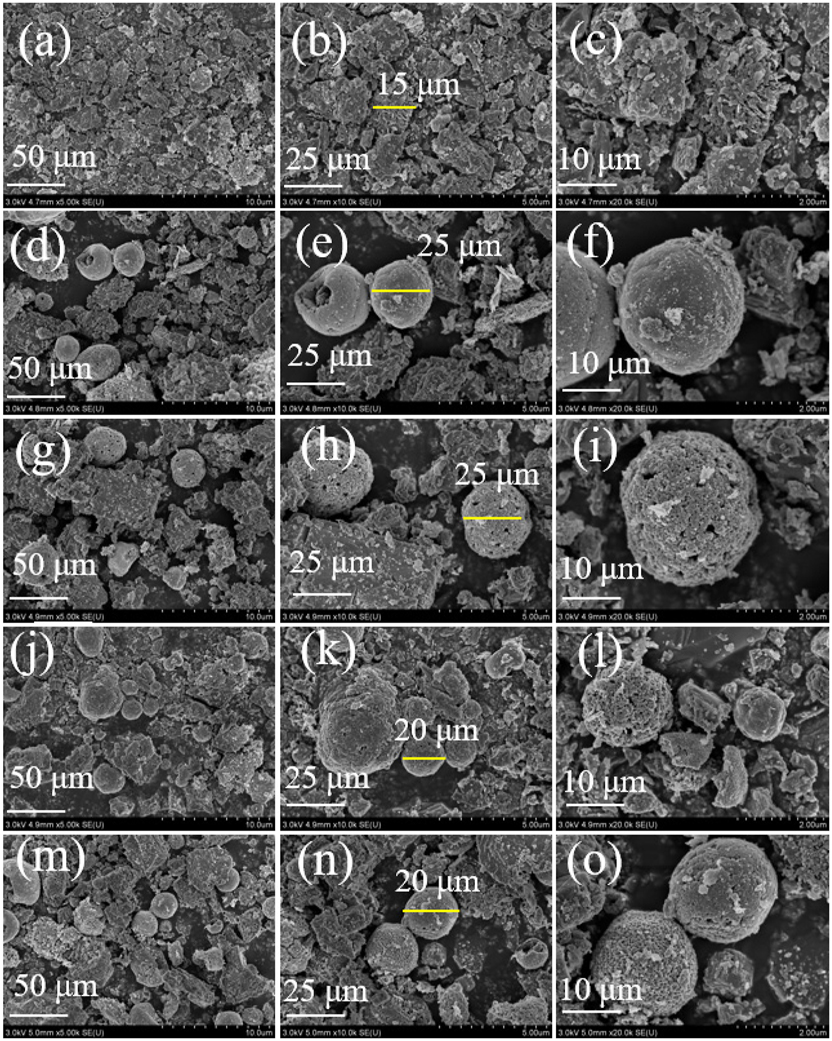
The FE-SEM spectrum of the Co x Zn1−x O (x = 0, 0.05, 0.1, 0.15, 0.2) sensitive material (a)–(c) ZnO, (d)–(f) Co0.05Zn0.95O, (g)–(i) Co0.1Zn0.9O, (j)–(l) Co0.15Zn0.85O, (m)–(o) Co0.2Zn0.8O.
In Figure 6(a)–(d), the elemental distribution maps of the sensitive material Co0.1Zn0.9O are presented. The prepared Co0.1Zn0.9O contains the corresponding elements, with no other impurities. Figure 6(e) presents the HAADF spectrum of Co0.1Zn0.9O.
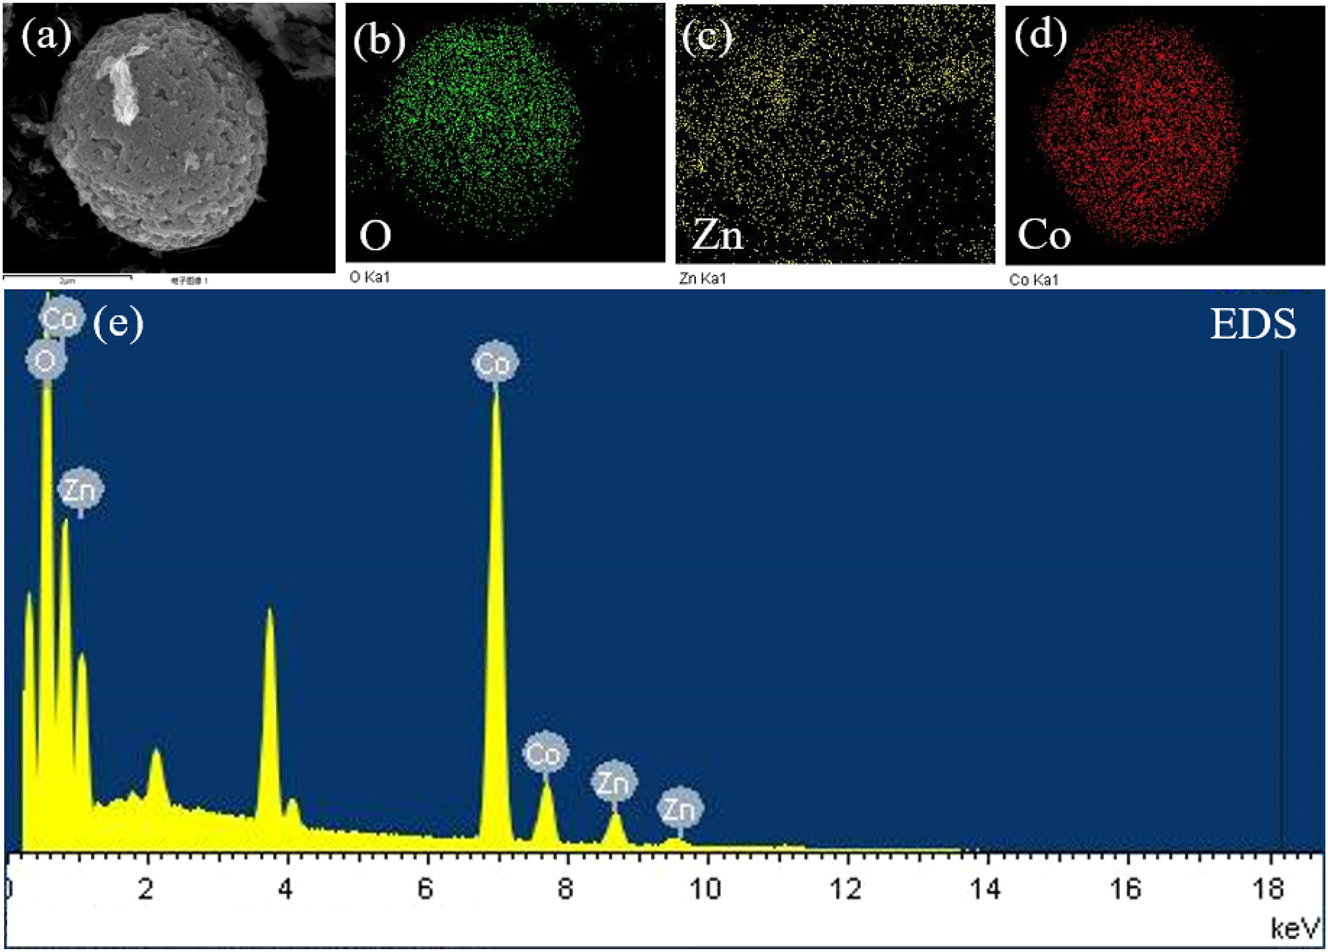
The Co0.1Zn0.9O HRTEM images. (a) The HADDF image of Co0.1Zn0.9O, the mapping image of (b)O, (c)Zn, and (d)Co, and (e) the EDS spectrum of Co x Zn1−x O.
3.4 Gas sensing
The prepared sensitive materials were placed in a 100 ppm hydrogen sulfide atmosphere. As can be seen from Figure 7, the response was strongest when x = 0.1. Therefore, the sensitive material selected for the gas experiment is Co0.1Zn0.9O. When functioning at 200 °C, Co0.1Zn0.9O materials were subjected to hydrogen sulfide gas concentrations ranging between 0 and 100 ppm, with measurements taken at 0, 20, 50, 80, and 100 ppm. Figure 8(a) presents the sensor’s response curves for varying concentrations of hydrogen sulfide gas. With higher concentrations of the test gas, the sensor covered with the reactive material displays a heightened response to hydrogen sulfide. The microsensor showed the best sensitivity to H2S at 0.02565 mA ppm−1 (95 % confidence intervals, CI: 0.0255 to 0.0258), with a linearity of 0.99506 (95 % CI: 0.9986 to 0.9977) (Figure 8(b)).
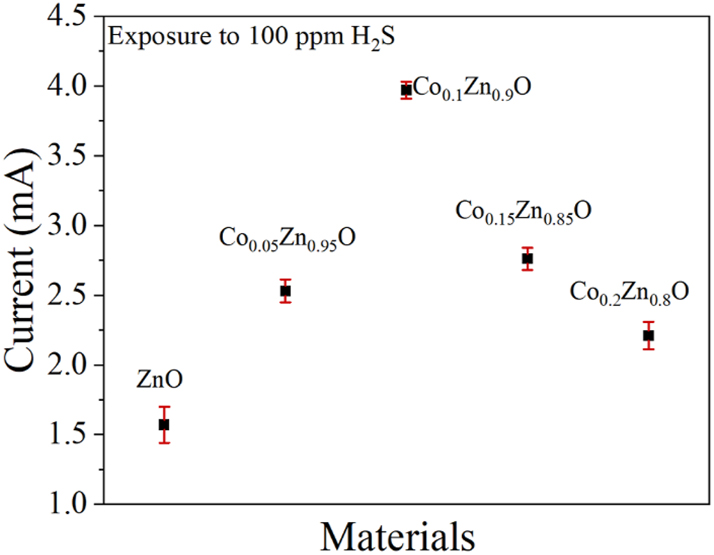
The gas sensor testing of different materials under 100 ppm hydrogen sulfide conditions.
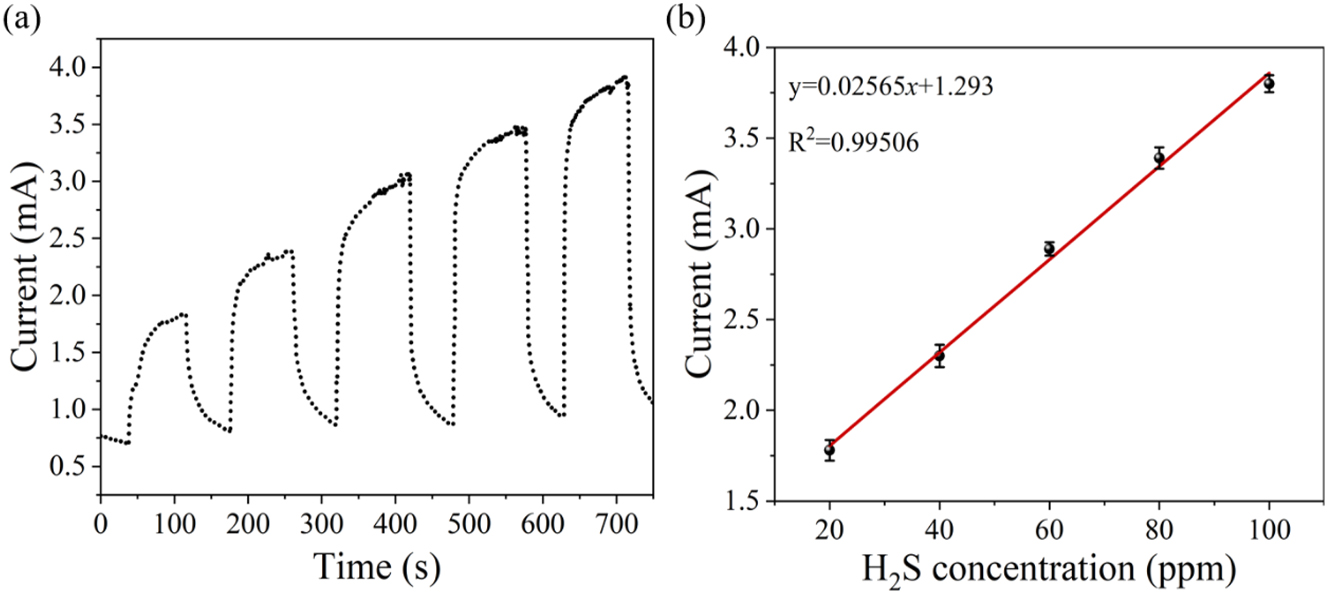
The response test diagrams. (a) Gas sensitivity response characteristic curve of the Co0.1Zn0.9O microsensor to different concentrations of H2S, (b) the linear fitting of the sensor.
The experimental data was linearized using Origin, and the standard deviation (δ) was obtained. The gas sensor’s limit of detection (LOD) was determined through calculation, with K representing the slope of the linear fit. The sensor’s LOD is: 23
The calculated LOD for the gas sensor can reach 0.03521 ppm.
The ability to selectively detect specific gases is a vital performance criterion in determining the application potential of sensors. For evaluating how the coated gas sensor responds to different substances, including air, Cl2, CO2, CO, ethanol, SF6 and H2S, all at equal 100 ppm concentrations, were prepared and introduced into the gas chamber for testing.
Figure 9 shows the gas selectivity of the sensor, exhibiting low sensitivity to air, Cl2, CO2, CO, ethanol, SF6 and H2S gases at the same concentration, indicating that Co0.1Zn0.9O has specific selectivity for H2S.
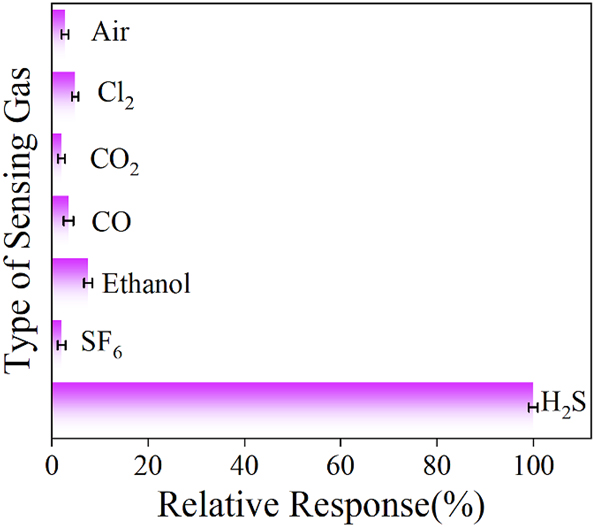
The selectivity of the 0.1Co–ZnO microsensor for air, Cl2, CO2, CO, ethanol, SF6 and H2S.
Figure 10 illustrates the sensor’s dynamic behavior during its response and recovery phases. Measurements were recorded every second, with response time assessed at randomly chosen moments within the response interval. To mitigate inaccuracies caused by manual computation, the response and recovery durations must be repeatedly evaluated. With a response time near 7.9 s (95 % CI: 7.757 to 8.043) and a recovery time close to 6.5 s (95 % CI: 6.357 to 6.643), the sensor demonstrates fast performance. Table 1 24 , 25 , 26 , 27 , 28 , 29 , 30 outlines a comparative analysis of the Co0.1Zn0.9O sensor’s response and recovery efficiency relative to various other gas sensors.
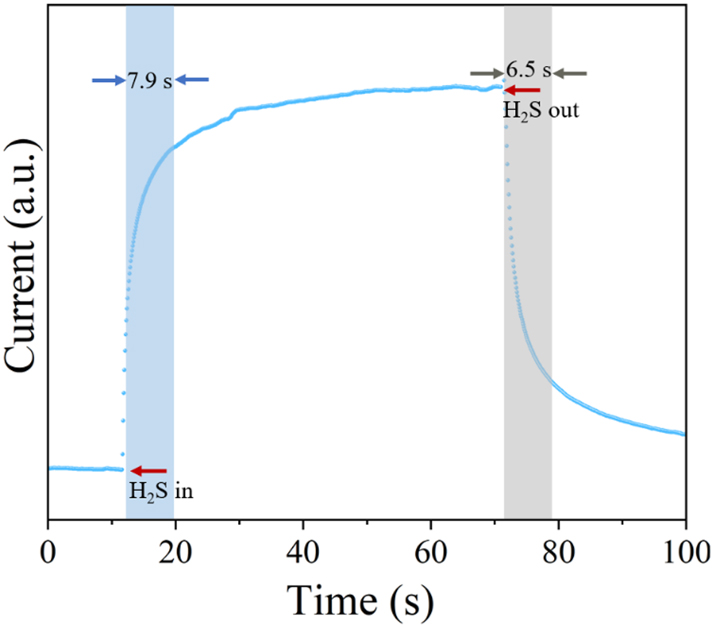
The response and recover time of the Co0.1Zn0.9O micro-hotplate sensor.
Comparation of the response and recover time of this work for each H2S sensor.
| Material | Temperature (°C) | H2S | T res (sec) | T rec | Ref. |
|---|---|---|---|---|---|
| TiO2 | 100 | 50 ppm | 48 | 5 min | 24] |
| NiO-doped CuO | −25 | 50 ppb | 115 | 251 s | 25] |
| CuO/In2O3 | 400 | 5 ppm | 10 | > 2000 s | 26] |
| ZnO | 150 | 100 ppm | 15 | 90 s | 27] |
| CS-CuO-IL | 40 | 15 ppm | 14 | – | 28] |
| MoO3/CuO/g-C3N4 a | RT | 1,000 ppb | 49 | 210 s | 29] |
| Pd/WO3 | 250 | 50 ppb | 14 | 29 s | 30] |
| Co–ZnO | 200 | 100 ppm | 7.9 | 6.5 s | This work |
-
aGraphitic phase carbon nitride. 29
As seen in Figure 11(a), the sensor demonstrates good reproducibility in 50 ppm H2S gas. For the same sensor, the reproducibility error, or the relative standard deviation of sensitivity, should not be greater than ±5 %. Achieving the reproducibility error within the defined limits indicates that the Co0.1Zn0.9O microsensor maintains reliable reproducibility. To assess long-term stability, the sensor was tested for 30 days, with response measurements conducted at 5-day intervals in a 50 ppm hydrogen sulfide atmosphere. As shown in Figure 11(b), the response exhibited minimal fluctuation, remaining largely stable. This strongly suggests that the Co0.1Zn0.9O gas sensor maintains remarkable consistency over both brief and prolonged durations, making it a trustworthy choice for practical use in the market.
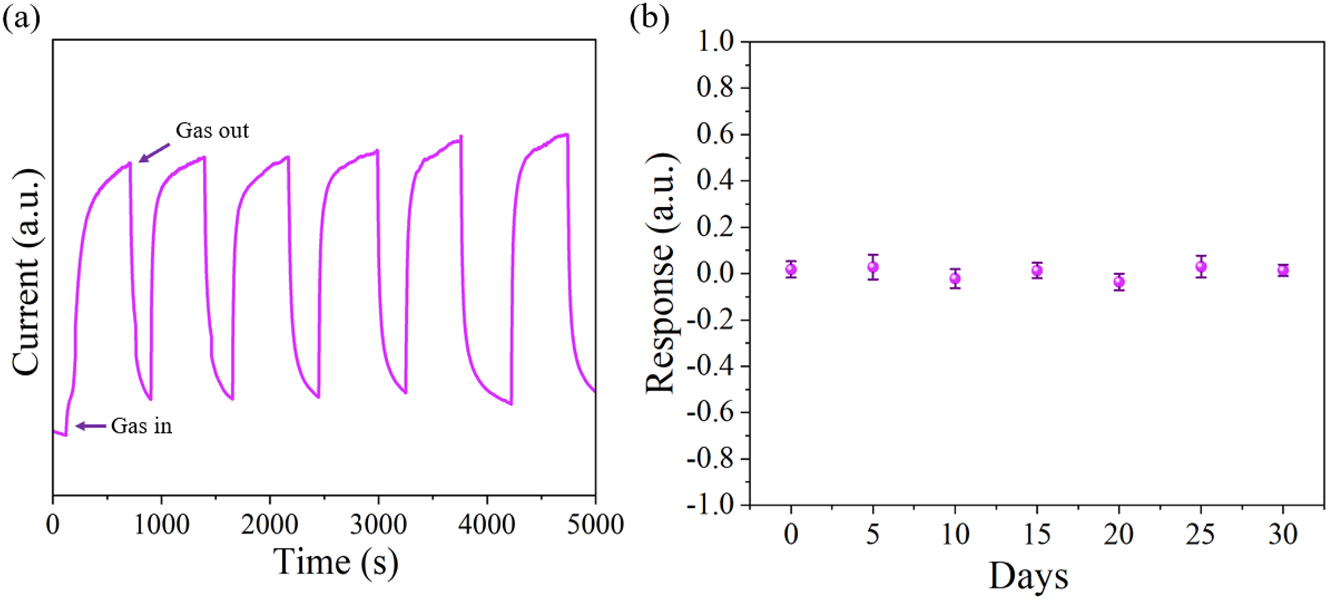
The reproducibility and stability testing. (a) Reproducibility of the Co0.1Zn0.9O sensor for H2S at 50 ppm concentration, (b) time stability of the sensor.
4 Principle
4.1 Sensing principle
The basic structure of the gas sensor consists of a microheater and a Co x Zn1−x O composite material. The sensitive material is uniformly spin-coated onto the microheater and then placed in the gas chamber for gas experiments. When the detected gas enters the sensor, it adsorbs or reacts with the Co x Zn1−x O sensitive film, altering the concentration and mobility of carriers (electrons or holes) on its surface or in its volume, which in turn changes its resistance, enabling gas concentration detection by measuring the current.
Co x Zn1−x O 31 , 32 is an n-type semiconductor with a wide bandgap, and its bandgap characteristics are suitable for illustrating the traditional electron depletion model. The porous structure in the layered microspheres provides more reaction sites for H2S, greatly enhancing the efficiency of gas-sensitive reactions.
The gas sensing mechanism is shown in Figure 12. When air comes into contact with the microheater sensor, oxygen molecules adsorb onto the defect sites of the thin sensitive coating. At this interface, oxygen molecules are reduced by removing electrons from the conduction band of the material, forming oxygen species such as O−, O2 −, and O2−. 33 , 34 This removal of electrons creates a charge depletion region on the surface of the Co x Zn1−x O material, which increases its resistance (Equations (1) and (2)). This keeps the sensor in a high resistance (Ra) state when exposed to air. The formation of Co(III) is closely related to the reduction process of oxygen. During the adsorption of oxygen and electron removal, Co(III) plays an important role as an intermediate species, facilitating the reduction of oxygen molecules. Co(III) accepts electrons removed from the conduction band and is converted into Co(II), a process that is crucial for the response of the gas sensor. 35 When the reducing gas H2S is introduced into the test chamber, it reacts with the oxygen ions adsorbed on the surface, releasing the electrons captured by the chemisorbed oxygen. These free electrons then return to the conduction band of the material (Equations (3) and (4)). 33 , 34 This causes a significant decrease in the material’s resistance (Rg) and greatly enhances the sensing response.
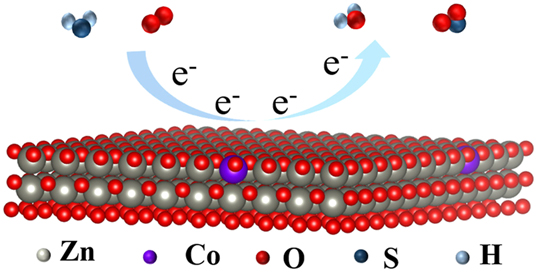
Gas sensing mechanism of Co x Zn1−x O.
With the reduction of the boundary barrier between neighboring particles, the electron depletion zone shallows, resulting in a swift drop in the resistance of the sensor. Adjusting the heterojunction barrier height in the presence of adsorbed oxygen is critical for improving the sensing performance. When the reducing gas is present, the resistance (Rg) is significantly lowered, thereby greatly enhancing the sensing response.
5 Conclusions
Co x Zn1−x O (x = 0, 0.05, 0.1, 0.15, 0.2) sensitive materials were synthesized via chemical precipitation, and used in a microsensor SEM analysis revealed that the prepared materials Co x Zn1−x O are loose and porous, effectively increasing the contact area with H2S gas and enhancing its adsorption performance. The sensitive material selected for the gas experiment is Co0.1Zn0.9O, which has the best gas-sensitive test effect. The results of the H2S ventilation test reveal a direct correlation between increasing H2S concentration and a rise in the measured current, demonstrating a sensitivity rate of 0.02565 mA ppm−1 (95 % CI: 0.0255 to 0.0258). With response and recovery times of approximately 7.9 s (95 % CI: 7.757 to 8.043) and 6.5 s (95 % CI: 6.357 to 6.643), the sensor demonstrates a high linearity 0.99506 (95 % CI: 0.9986 to 0.9977) between the H2S concentration and the corresponding current output. When functioning at 200 °C, the Co0.1Zn0.9O gas sensor has outstanding capacity to revert to its original state, maintains reliable performance over extended periods, and shows a pronounced preference for detecting H2S gas. The sensor is low-cost, compact, and simple in structure, with promising application prospects for H2S gas detection.
Acknowledgements
The authors would like to acknowledge support from the National Natural Science Foundation of China (62075017).
-
Research ethics: No applicable.
-
Informed consent: Not applicable.
-
Author contributions: The authors have accepted responsibility for the entire content of this manuscript and approved its submission. Cui Chen: Conceptualization, writing of original draft, methodology. Zhiguo Zhang: Conceptualization, supervision, funding acquisition. Yang Zhao: Investigation. Tian Guo: Data curation, formal analysis.
-
Use of Large Language Models, AI and Machine Learning Tools: None declared.
-
Conflict of interest: There are no competing interests to declare.
-
Research funding: This work was supported by the National Natural Science Foundation of China (No. 62075017).
-
Data availability: The raw data can be obtained on request from the corresponding author.
References
1. Vakili, M.; Koutník, P.; Kohout, J. Addressing Hydrogen Sulfide Corrosion in Oil and Gas Industries: A Sustainable Perspective. Sustainability 2024, 16, 1661; https://doi.org/10.3390/su16041661.Suche in Google Scholar
2. Batterman, S.; Grant-Alfieri, A.; Seo, S. H. Low Level Exposure to Hydrogen Sulfide: A Review of Emissions, Community Exposure, Health Effects, and Exposure Guidelines. Crit. Rev. Toxicol. 2023, 53, 244–295; https://doi.org/10.1080/10408444.2023.2229925.Suche in Google Scholar PubMed PubMed Central
3. Wagner, F.; Asfar, P.; Calzia, E.; Radermacher, P.; Szabó, C. Bench-to-bedside Review: Hydrogen Sulfide-The Third Gaseous Transmitter: Applications for Critical Care. Criti. Care 2009, 13, 1–9; https://doi.org/10.1186/cc7700.Suche in Google Scholar PubMed PubMed Central
4. Khan, M. A.; Qazi, F.; Hussain, Z.; Idrees, M. U.; Soomro, S.; Soomro, S. Recent Trends in Electrochemical Detection of NH3, H2S and NOx Gases. Int. J. Electrochem. Sci. 2017, 12, 1711–1733; https://doi.org/10.20964/2017.03.76.Suche in Google Scholar
5. Yu, K.; Hu, J.; Li, X.; Zhang, L.; Lv, Y. Camellia-like NiO: A Novel Cataluminescence Sensing Material for H2S. Sens. Actuators, B 2019, 288, 243–250; https://doi.org/10.1016/j.snb.2019.02.120.Suche in Google Scholar
6. Zhu, L.; Rong, Q.; Yang, Z.; Zhang, W.; Jiao, M.; Song, J.; Wang, C.; Guo, Y. ZnO Nanoparticle-Based MEMS Sensors for H2S Detection. ACS Appl. Nano Mater. 2022, 5, 11595–11604; https://doi.org/10.1021/acsanm.2c02581.Suche in Google Scholar
7. Zhang, Y.; Zhang, Z.; Zhang, G. L. Y.; Chen, J.; Luo, Y.; Duan, G. Ultrafast-response H2S MEMS Gas Sensor Based on Double Phase In2O3 Monolayer Particle Film. Sens. Actuators, B 2024, 412, 135787.10.1016/j.snb.2024.135787Suche in Google Scholar
8. Maiti, S.; Pal, S.; Chattopadhyay, K. K. Recent Advances in Low Temperature, Solution Processed Morphology Tailored ZnO Nanoarchitectures for Electron Emission and Photocatalysis Applications. CrystEngComm 2015, 17, 9264–9295; https://doi.org/10.1039/c5ce01130b.Suche in Google Scholar
9. Dey, A. Semiconductor Metal Oxide Gas Sensors: A Review. Mater. Sci. Eng., B 2018, 229, 206–217; https://doi.org/10.1016/j.mseb.2017.12.036.Suche in Google Scholar
10. Krishna, G.; Parne, S.; Pothukanuri, N.; Kathirvelu, V.; Gandi, S.; Joshi, D. Nanostructured Metal Oxide Semiconductor-Based Gas Sensors: A Comprehensive Review. Sens. Actuators A 2022, 341, 113578; https://doi.org/10.1016/j.sna.2022.113578.Suche in Google Scholar
11. Molavi, R.; Safaiee, R.; Sheikhi, M. H. Oxygen Adsorption Properties of Small Cobalt Oxide Clusters: Application Feasibility as Oxygen Gas Sensors. Phys. Chem. Chem. Phys. 2020, 22, 14889–14899; https://doi.org/10.1039/d0cp01951h.Suche in Google Scholar PubMed
12. Xue, R.; Liu, Y.; Ma, Z.; Lu, X.; Xue, Z.; Liu, Y.; Tong, J.; Xu, J.; Bai, Y. Highly Selective H2S MEMS Sensors Based on Co12 Cluster and ZnO/Co12 Composites. Sens. Actuators, B 2024, 415, 136389; https://doi.org/10.1016/j.snb.2024.136389.Suche in Google Scholar
13. Sett, D.; Basak, D. Highly Enhanced H2 Gas Sensing Characteristics of Co: ZnO Nanorods and its Mechanism. Sens. Actuators, B 2017, 243, 475–483; https://doi.org/10.1016/j.snb.2016.11.163.Suche in Google Scholar
14. Adeel, M.; Saeed, M.; Khan, I.; Muneer, M.; Akram, N. Synthesis and Characterization of Co-ZnO and Evaluation of its Photocatalytic Activity for Photodegradation of Methyl Orange. ACS Omega 2021, 6, 1426–1435; https://doi.org/10.1021/acsomega.0c05092.Suche in Google Scholar PubMed PubMed Central
15. Sedefoglu, N. Green Synthesis of ZnO Nanoparticles by Myrtus Communis Plant Extract with Investigation of Effect of Precursor, Calcination Temperature and Study of Photocatalytic Performance. Ceram. Int. 2024, 50, 9884–9895; https://doi.org/10.1016/j.ceramint.2024.01.387.Suche in Google Scholar
16. Chiwaye, N.; Jewell, L. L.; Billing, D. G.; Naidoo, D.; Ncube, M.; Coville, N. J. In Situ Powder XRD and Mössbauer Study of Fe–Co Supported on CaCO3. Mater. Res. Bull. 2014, 56, 98–106; https://doi.org/10.1016/j.materresbull.2014.04.065.Suche in Google Scholar
17. Kang, R.; Zhang, Z.; Bin, F.; Wei, X.; Li, Y.; Chen, G.; Tu, X. Catalytic Ignition of CO over CuCeZr Based Catalysts: New Insights into the Support Effects and Reaction Pathways. Appl. Catal. B 2023, 327, 122435; https://doi.org/10.1016/j.apcatb.2023.122435.Suche in Google Scholar
18. Wang, Y.; Wang, C.; Ni, Z.; Ni, Z.; Gu, Y.; Wang, B.; Guo, Z.; Wang, Z.; Bin, D.; Ma, J.; Wang, Y. Binding Zinc Ions by Carboxyl Groups from Adjacent Molecules toward Long‐life Aqueous Zinc-Organic Batteries. Adv. Mater. 2020, 32, 2000338; https://doi.org/10.1002/adma.202000338.Suche in Google Scholar PubMed
19. Kudielka, A.; Schmid, M.; Klein, B. P.; Pierzonka, C.; Gottfried, J. M.; Harbrecht, B. Nanocrystalline Cobalt Hydroxide Oxide: Synthesis and Characterization with SQUID, XPS, and NEXAFS. J. Alloys Compd. 2020, 824, 153925; https://doi.org/10.1016/j.jallcom.2020.153925.Suche in Google Scholar
20. Frankcombe, T. J.; Liu, Y. Interpretation of Oxygen 1s X-Ray Photoelectron Spectroscopy of ZnO. Chem. Mater. 2023, 35, 5468–5474; https://doi.org/10.1021/acs.chemmater.3c00801.Suche in Google Scholar
21. Jung, G.; Ju, S.; Choi, K.; Kim, J.; Hong, S.; Park, J.; Shin, W.; Jeong, Y.; Han, S.; Choi, W. Y.; Lee, J. Reconfigurable Manipulation of Oxygen Content on Metal Oxide Surfaces and Applications to Gas Sensing. ACS Nano 2023, 17, 17790–17798; https://doi.org/10.1021/acsnano.3c03034.Suche in Google Scholar PubMed
22. Aier, I.; Purkayastha, D. D. Hierarchical 0D CuO Wrapped by Petal-like 2D ZnO: A Strategic Approach of Superhydrophobic Melamine Sponge toward Wastewater Treatment. Langmuir 2024, 40, 9702–9716; https://doi.org/10.1021/acs.langmuir.4c00651.Suche in Google Scholar PubMed
23. Fang, M.; Wang, Y. M.; Wang, Y. Y.; Wang, J. W.; Hu, X. L.; Su, Z. M. Three Fluorescent Probes Based on Cd-MOFs for Highly Selective, Sensitive and Stable Detection of Antibiotics, Anions and Cations in Water. J. Mol. Struct. 2024, 1320, 139625; https://doi.org/10.1016/j.molstruc.2024.139625.Suche in Google Scholar
24. Pravarthana, D.; Tyagi, A.; Jagadale, T. C.; Prellier, W.; Aswal, D. K. Highly Sensitive and Selective H2S Gas Sensor Based on TiO2 Thin Films. Appl. Surf. Sci. 2021, 549, 149281; https://doi.org/10.1016/j.apsusc.2021.149281.Suche in Google Scholar
25. Fang, H.; Li, S.; Jiang, W.; Zhao, H.; Han, C.; Li, J.; Wang, G.; Zhang, Y.; Wang, S.; Deng, J.; Feng, B.; Wang, D. Ppb-level H2S Gas Sensor Based on CuNi-MOFs Derivatives for Meat Freshness Detection at Low Temperature Environment. Sens. Actuators, B 2022, 368, 132225; https://doi.org/10.1016/j.snb.2022.132225.Suche in Google Scholar
26. Li, S.; Xie, L.; He, M.; Hu, X.; Luo, G.; Chen, C.; Zhu, Z. Metal-Organic Frameworks-Derived Bamboo-like CuO/In2O3 Heterostructure for High-Performance H2S Gas Sensor with Low Operating Temperature. Sens. Actuators, B 2020, 310, 127828; https://doi.org/10.1016/j.snb.2020.127828.Suche in Google Scholar
27. Yu, Z.; Gao, J.; Xu, L.; Liu, T.; Liu, Y.; Wang, X.; Suo, H.; Zhao, C. Fabrication of Lettuce-like ZnO Gas Sensor with Enhanced H2S Gas Sensitivity. Crystals 2020, 10, 145; https://doi.org/10.3390/cryst10030145.Suche in Google Scholar
28. Ali, F. I. M.; Mahmoud, S. T.; Awwad, F.; Greish, Y. E.; Abu-hani, A. F. S. Low Power Consumption and Fast Response H2S Gas Sensor Based on a Chitosan-CuO Hybrid Nanocomposite Thin Film. Carbohydr. Polym. 2020, 236, 116064; https://doi.org/10.1016/j.carbpol.2020.116064.Suche in Google Scholar PubMed
29. Feng, C.; Zhang, C.; Xu, C.; Lin, S.; Zhang, B.; Wu, H.; Zhang, Z.; Guo, X.; Bai, H.; Guo, F. A Room-Temperature Ppb-Level H2S Sensor Based on MoO3/CuO/g-C3n4 via a Simple Synthesis. Sens. Actuators, B 2023, 374, 132827; https://doi.org/10.1016/j.snb.2022.132827.Suche in Google Scholar
30. Guo, Y.; Liu, B.; Duan, Z.; Yuan, Z.; Jiang, Y.; Tai, H. Batch Fabrication of H2S Sensors Based on Evaporated Pd/WO3 Film with Ppb-Level Detection Limit. Mater. Chem. Phys. 2023, 302, 127768; https://doi.org/10.1016/j.matchemphys.2023.127768.Suche in Google Scholar
31. Han, N.; Pan, G.; Zheng, J.; Wang, R.; Wang, Y. Co3O4-ZnO Pn Heterostructure Nanomaterials Film and its Enhanced Photoelectric Response to Visible Lights at Near Room Temperature. Mater. Res. 2019, 22, e201480689; https://doi.org/10.1590/1980-5373-mr-2018-0689.Suche in Google Scholar
32. Liu, H.; Kong, J.; Dong, Z.; Zhao, M.; An, B.; Dong, J.; Xu, J.; Wang, X. Preparation of MOF-Derived ZnO/Co3O4 Nanocages and Their Sensing Performance toward H2S. Phys. Chem. Chem. Phys. 2023, 25, 17850–17859; https://doi.org/10.1039/d3cp02310a.Suche in Google Scholar PubMed
33. Natkaeo, A.; Phokharatkul, D.; Hodak, J. H.; Wisitsoraat, A.; Hodak, S. K. Highly Selective Sub-10 Ppm H2S Gas Sensors Based on Ag-Doped CaCu3Ti4O12 Films. Sens. Actuators, B 2018, 260, 571–580; https://doi.org/10.1016/j.snb.2017.12.134.Suche in Google Scholar
34. Kruefu, V.; Wisitsoraat, A.; Tuantranont, A.; Phanichphant, S. Ultra-sensitive H2S Sensors Based on Hydrothermal/impregnation-Made Ru-Functionalized WO3 Nanorods. Sens. Actuators, B 2015, 215, 630–636; https://doi.org/10.1016/j.snb.2015.03.037.Suche in Google Scholar
35. Qin, C.; Wang, B.; Wu, N.; Han, C.; Zhang, X.; Tian, Q.; Shen, S.; Li, P.; Wang, Y. Metal-organic Frameworks Derived Porous Co3O4 Dodecahedeons with Abundant Active Co3+ for Ppb-Level CO Gas Sensing. Appl. Surf. Sci. 2020, 506, 144900; https://doi.org/10.1016/j.apsusc.2019.144900.Suche in Google Scholar
© 2025 Walter de Gruyter GmbH, Berlin/Boston
Artikel in diesem Heft
- Frontmatter
- In this issue
- Research Articles
- A MEMS-based gas sensor for H2S detection with enhanced performance using a Ni–In2O3/ZnO nano-composite
- Ultra-sensitive and rapid response H2S microsensor based on Co–ZnO with ppm level detection
- Crystal chemistry and structural phase transition in CaLa2Zn1–x Ca x Ti2O9 (x = 0.00, 0.15, 0.30, 0.45, 0.90 and 1.00)
- RE 10Co3In10 (RE = Y, Gd, Tb, Dy, Ho, Er, Tm) – a new intergrowth structure with CsCl- and AlB2-type slabs
- Crystal structures of phases from the solid solutions DyNiIn1−xSn x
- Tricyanomethanides of the scandium group obtained from aqueous solution: syntheses, crystal structures and Raman spectra of Sc[C(CN)3]3(H2O)3, Y[C(CN)3]3(H2O)2 and La[C(CN)3]3(H2O)4
- Three pnictides with Sm6Rh30Si19-type structure: Sm6Rh30P19, Lu6Rh30P19 and Eu6Rh30Sb19
- The compound (NH4)0.64B4.36O6.72(OH)0.28(NH3)0.36 representing the first ammine/ammonium borate
- Extended investigations on the pressure stability of AlB4O6N:Cr3+
- Synthesis and crystal structures of new phases in the system Hf–Ta–O–N