Synthesis and structural characterization of Li3K3Eu7(BO3)9
-
Sebastian Bräuchle


Abstract
Li3K3Eu7(BO3)9 was prepared by high-temperature solid state synthesis at 900°C in a platinum crucible from lithium carbonate, potassium carbonate, boric acid, and europium(III) oxide. The title compound crystallizes in the orthorhombic space group Pca21 (no. 29) (Z=4). The structure was refined from single-crystal X-ray diffraction data: a=21.126(2), b=6.502(2), c=17.619(2) Å, V=2420.1(2) Å3, R1=0.0183 and wR2=0.0412 for all data. The crystal structure of Li3K3Eu7(BO3)9 is isotypic to Li3K3Y7(BO3)9 featuring isolated BO3 units and LiO6 octahedra forming [Li3B4O21] units in the ac plane, which are linked by additional BO3 units. The K+ and Eu3+ cations are arranged in the cavities of the structure.
1 Introduction
Concerning their wide range of applications, borates have gained remarkable interest in the scientific community. They show a good chemical and thermal stability, high transparency in the UV, and non-linear optical properties [1], [2], [3]. Due to their large band gap, borates are possible host structures for luminescent ions, e.g. YBO3 [4], GdBO3 [4], GdB5O9 [5], LiRE6O5(BO3)3 (RE=rare earth metal) [6], and Li3RE(BO3)2 [7] doped with Ce3+, Eu3+, and Tb3+ are appropriate phosphors for use in plasma display panels (PDPs). Additionally, there exist several compounds in the ternary system A2O–RE2O3–B2O3 (A=alkali metal) like Li6Y(BO3)3 doped with Yb3+ being promising materials for short pulse laser applications [8], [9], [10], or Ce3+ doped Li6RE(BO3) (RE=Gd, Y) as an efficient new scintillator material for neutron detection [11].
Just very recently, we reported the synthesis of Li3K3Y7(BO3)9 [12] in the quaternary system A2O–A′2O–RE2O3–B2O3 (A, A′=alkali metals). To date, this system exhibits only five other compounds, vic. CsLi2Gd4(BO3)5 [13], K6Li3Sc2B15O30 [14], K9Li3Nd3(BO3)7 [15], and A2LiNd(BO3)2 (A=Rb, Cs) [15]. With the synthesis of Li3K3Eu7(BO3)9, we could now extend the list of known compounds in the field of rare earth borates possessing two different alkali cations with another example. In the following, we report the preparation and single-crystal X-ray structure determination of Li3K3Eu7(BO3)9. Furthermore, the compound was characterized by infrared and luminescence spectroscopy.
2 Experimental section
2.1 Synthesis
As mentioned above, our synthesis was based on the system Li2O–K2O–Eu2O3–B2O3 leading to the new compound Li3K3Eu7(BO3)9. The starting materials Li2CO3 (99.5%, Alfa Aesar, Karlsruhe, Germany), K2CO3 (99.99%, ChemPur, Karlsruhe, Germany), Eu2O3 (99.99%, Smart Elements, Wien, Austria) and H3BO3 (99.5%, Merck, Darmstadt, Germany) were weighed, finely ground in an agate mortar according to the molar ratio of 3:6:1:7, and filled into a platinum FKS 95/5 crucible (feinkornstabilisiert, 95% Pt, 5% Au, Ögussa, Wien, Austria).
The sample was positioned in an electric resistance furnace (Nabertherm muffle furnace) and heated up to 900°C with a rate of 90°C h−1 and maintained at that temperature for 24 h. After that period, the temperature was lowered to 500°C with a rate of 2°C h−1 followed by switching off the furnace. The product cooled down to room temperature by natural rate.
The product Li3K3Eu7(BO3)9 was obtained in form of colorless, air and water resistant crystals. Any effort to synthesize Li3K3Eu7(BO3)9 from a stoichiometric mixture of the starting materials failed. The synthesis was only possible with the exact composition and heating process mentioned above.
2.2 Crystal structure analysis
The powder X-ray diffraction (PXRD) pattern of the reaction product was measured in transmission geometry using a Stoe Stadi P powder diffractometer with Ge(111)-monochromatized MoKα1 (λ=70.93 pm) radiation. The comparison of the experimental and theoretical PXRD pattern simulated from single-crystal data of Li3K3Eu7(BO3)9 showed that they match well (Fig. 1). However, the experimental PXRD pattern has some additional reflections (marked with red asterisks), which do not belong to Li3K3Eu7(BO3)9 and arise from side products, which could not be assigned until now.
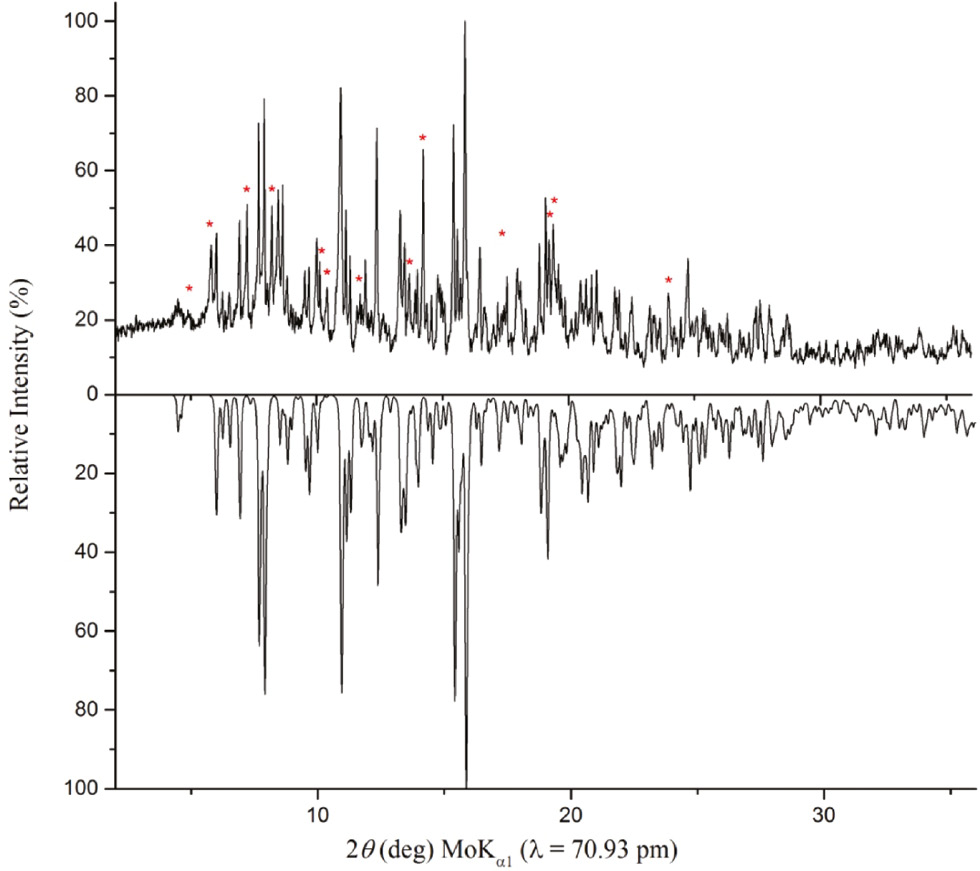
Top: experimental powder pattern of Li3K3Eu7(BO3)9. The reflections marked with red asterisks could not be assigned until now. Bottom: theoretical powder pattern of Li3K3Eu7(BO3)9 based on single-crystal diffraction data.
For the single-crystal structure analysis, small crystals of Li3K3Eu7(BO3)9 were isolated by mechanical fragmentation and picked using a polarization microscope. A Bruker D8 Quest Kappa diffractometer with MoKα radiation (λ=71.073 pm) was used to collect the single-crystal intensity data at room temperature of 298 K. A multi-scan absorption correction (Sadabs-2014 [16]) was applied to the intensity data sets. All relevant details of the data collection and the refinement are listed in Table 1. The orthorhombic space group Pca21 was derived from the systematic extinctions of Li3K3Eu7(BO3)9. The structure solution and parameter refinement were successfully performed with Shelxl-13 [17], [18]. All atoms were refined anisotropically and the final difference Fourier synthesis did not reveal any significant residual peaks. The structural refinement of Li3K3Eu7(BO3)9 was based on the positional parameters of the isotypic compound Li3K3Y7(BO3)9 [12]. Table 2 lists the interatomic distances. Atomic coordinates and anisotropic displacement parameters are listed in the Tables S1 and S2 of the Supplementary Information. Graphical representations of the structure were produced with the program Diamond [19].
Crystal data and structure refinement of Li3K3Eu7(BO3)9 (standard deviations in parentheses).
| Empirical formula | Li3K3Eu7(BO3)9 | |
| Molar mass, g·mol−1 | 1731.1 | |
| Crystal system | Orthorhombic | |
| Space group | Pca21 (no. 29) | |
| Powder data | ||
| Powder diffractometer | STOE Stadi P | |
| Radiation; λ, Å | MoKα1; 0.7093 | |
| a, Å | 21.153(8) | |
| b, Å | 6.497(2) | |
| c, Å | 17.601(7) | |
| V, Å3 | 2418.9(5) | |
| Single-crystal data | ||
| Single-crystal diffractometer | Bruker D8 Quest Kappa | |
| Radiation; λ, Å | MoKα ; 0.71073 | |
| a, Å | 21.126(2) | |
| b, Å | 6.502(2) | |
| c, Å | 17.619(2) | |
| V, Å3 | 2420.1(2) | |
| Formula units per cell | 4 | |
| Calculated density, g cm−3 | 4.75 | |
| Crystal size, mm3 | 0.15×0.10×0.03 | |
| Temperature, K | 298(2) | |
| Absorption coefficient, mm−1 | 18.494 | |
| F(000), e | 3072 | |
| θ Range, deg | 2.3–37.9 | |
| Range in hkl | ±36, ±11, ±30 | |
| Total no. of reflections | 119 765 | |
| Independent reflections | 13 059 | |
| Reflections with I>2 σ(I) | 12 844 | |
| Data/parameters | 13 059/443 | |
| Absorption correction | Multi-scan | |
| Goodness-of-fit on F2 | 1.072 | |
| Final R1/wR2 [I>2 σ(I)] | 0.0176/0.0410 | |
| Final R1/wR2 (all data) | 0.0183/0.0412 | |
| Flack parameter (x) | 0.025(4) | |
| Largest diff. peak/hole, e Å−3 | 4.08/−1.44 | |
Interatomic distances (Å) in Li3K3Eu7(BO3)9 (standard deviations in parentheses).
| Li1–O3 | 1.945(13) | Li2–O2 | 1.951(10) | Li3–O14 | 1.989(10) | ||||
| Li1–O5 | 2.119(13) | Li2–O18 | 1.984(10) | Li3–O10 | 1.995(11) | ||||
| Li1–O16 | 2.132(15) | Li2–O21 | 2.103(10) | Li3–O9 | 2.053(10) | ||||
| Li1–O4 | 2.200(16) | Li2–O6 | 2.176(10) | Li3–O12 | 2.074(11) | ||||
| Li1–O8 | 2.381(17) | Li2–O20 | 2.292(12) | Li3–O19 | 2.335(13) | ||||
| Li1–O25 | 2.617(15) | Li2–O27 | 2.937(15) | Li3–O22 | 2.941(18) | ||||
| Ø | 2.232 | Ø | 2.241 | Ø | 2.231 | ||||
| B1–O17 | 1.360(6) | B2–O7 | 1.364(5) | B3–O22 | 1.342(6) | B4–O27 | 1.359(6) | ||
| B1–O25 | 1.364(6) | B2–O8 | 1.364(6) | B3–O15 | 1.379(6) | B4–O11 | 1.376(5) | ||
| B1–O19 | 1.396(5) | B2–O20 | 1.410(5) | B3–O16 | 1.405(6) | B4–O12 | 1.395(6) | ||
| Ø | 1.373 | Ø | 1.379 | Ø | 1.375 | Ø | 1.377 | ||
| B5–O1 | 1.357(6) | B6–O10 | 1.365(5) | B7–O9 | 1.364(5) | B8–O13 | 1.368(6) | B9–O26 | 1.363(6) |
| B5–O4 | 1.377(6) | B6–O18 | 1.367(6) | B7–O21 | 1.379(6) | B8–O14 | 1.376(6) | B9–O23 | 1.372(6) |
| B5–O6 | 1.402(6) | B6–O5 | 1.411(6) | B7–O3 | 1.389(6) | B8–O2 | 1.384(5) | B9–O24 | 1.381(6) |
| Ø | 1.379 | Ø | 1.381 | Ø | 1.377 | Ø | 1.376 | Ø | 1.372 |
| Eu1–O26 | 2.319(4) | Eu2–O11 | 2.273(3) | Eu3–O17 | 2.285(3) | Eu4–O25 | 2.288(3) | Eu5–O22 | 2.250(3) |
| Eu1–O7 | 2.326(3) | Eu2–O20 | 2.398(3) | Eu3–O24 | 2.322(3) | Eu4–O1 | 2.312(3) | Eu5–O14 | 2.394(3) |
| Eu1–O16 | 2.335(4) | Eu2–O18 | 2.412(3) | Eu3–O5 | 2.377(3) | Eu4–O26 | 2.420(3) | Eu5–O23 | 2.424(4) |
| Eu1–O5 | 2.353(3) | Eu2–O13 | 2.418(4) | Eu3–O10 | 2.381(3) | Eu4–O3 | 2.425(4) | Eu5–O15 | 2.427(3) |
| Eu1–O20 | 2.419(3) | Eu2–O7 | 2.457(3) | Eu3–O19 | 2.436(3) | Eu4–O21 | 2.434(3) | Eu5–O8 | 2.456(3) |
| Eu1–O8 | 2.421(3) | Eu2–O2 | 2.571(3) | Eu3–O25 | 2.449(3) | Eu4–O6 | 2.437(3) | Eu5–O3 | 2.517(3) |
| Eu1–O18 | 2.438(3) | Eu2–O6 | 2.584(5) | Eu3–O4 | 2.465(4) | Eu4–O20 | 2.443(3) | Eu5–O16 | 2.526(4) |
| Eu1–O6 | 2.546(3) | Eu2–O21 | 2.635(3) | Eu3–O12 | 2.625(3) | Eu4–O4 | 2.447(3) | Eu5–O9 | 2.613(4) |
| Eu2–O1 | 2.657(4) | ||||||||
| Ø | 2.387 | Ø | 2.489 | Ø | 2.418 | Ø | 2.401 | Ø | 2.451 |
| Eu6–O15 | 2.285(3) | Eu7–O27 | 2.294(4) | K1–O18 | 2.770(3 | K2–O8 | 2.702(4) | K3–O23 | 2.640(4) |
| Eu6–O13 | 2.403(4) | Eu7–O2 | 2.323(3) | K1–O11 | 2.777(4) | K2–O4 | 2.739(3) | K3–O24 | 2.827(4) |
| Eu6–O19 | 2.455(3) | Eu7–O11 | 2.437(3) | K1–O14 | 2.802(3) | K2–O7 | 2.869(4) | K3–O1 | 2.944(4) |
| Eu6–O10 | 2.469(3) | Eu7–O24 | 2.457(4) | K1–O22 | 2.840(4) | K2–O3 | 2.873(4) | K3–O7 | 2.979(4) |
| Eu6–O12 | 2.481(3) | Eu7–O19 | 2.478(3) | K1–O15 | 2.859(4) | K2–O25 | 2.924(4) | K3–O17 | 3.113(4) |
| Eu6–O17 | 2.487(3) | Eu7–O21 | 2.529(3) | K1–O10 | 2.864(3) | K2–O17 | 2.936(4) | K3–O26 | 3.130(5) |
| Eu6–O14 | 2.547(3) | Eu7–O9 | 2.584(4) | K1–O2 | 2.870(4) | K2–O5 | 2.945(4) | K3–O22 | 3.175(6) |
| Eu6–O9 | 2.587(4) | Eu7–O12 | 2.706(3) | K1–O27 | 3.047(5) | K2–O16 | 2.966(4) | ||
| Eu6–O27 | 2.767(5) | Eu7–O23 | 2.802(4) | K2–O1 | 2.997(4) | ||||
| K2–O22 | 3.065(4) | ||||||||
| Ø | 2.498 | Ø | 2.512 | Ø | 2.854 | Ø | 2.902 | Ø | 2.973 |
Average values in bold characters.
Further details of the crystal structure investigation may be obtained from FIZ Karlsruhe, 76344 Eggenstein-Leopoldshafen, Germany (fax: +49-7247-808-666; e-mail: crysdata@fiz-karlsruhe.de) on quoting the deposition number CSD-433210.
2.3 Vibrational spectra
The transmission FT-IR spectrum of a single-crystal of Li3K3Eu7(BO3)9 was measured in the spectral range of 600–4000 cm−1 with a Vertex 70 FT-IR spectrometer (spectral resolution 4 cm−1), which is equipped with a KBr beam splitter, an LN-MCT (Mercury Cadmium Telluride) detector, and a Hyperion 3000 microscope (Bruker, Vienna, Austria). One hundred and twenty scans of the sample were acquired using a Globar (silicon carbide) rod as mid-IR source and a 15× IR objective as focus. During the measurement, the sample was positioned on a BaF2 window. A correction of atmospheric influences was performed with the software Opus 6.5.
2.4 Luminescence
The title compound’s emission signal was measured by exciting a single-crystal (exhibiting the above mentioned unit-cell metrics) with a 460 nm laser (model Sapphire 460/10, 10 mW; COHERENT). The converted light was collected using a multi-mode optical fiber (QP 600-2-VIS/BX; Ocean Optics) and finally detected in a spectrometer (QE 65000; Ocean Optics).
3 Results and discussion
3.1 Crystal structure of Li3K3Eu7(BO3)9
As already mentioned, Li3K3Eu7(BO3)9 crystallizes isotypically to Li3K3Y7(BO3)9 [12] in the orthorhombic space group Pca21 (no. 29) with lattice parameters of a=21.126(2), b=6.502(2), c=17.619(2) Å, V=2420.1(2) Å3, and Z=4. The structure features distorted LiO6 octahedra, which are connected via planar BO3 groups, forming [Li3B4O21] units in the ac plane (Fig. 2). These units are furthermore connected by additional BO3 groups, forming tunnels of 12-membered rings along the b axis (Fig. 2). The K+ and Eu3+ cations are arranged in the cavities of the structure (Fig. 3). K(1) is eight-fold, K(2) is 10-fold, and K(3) is seven-fold coordinated by oxygen atoms. Eu(1), Eu(3), Eu(4) and Eu(5) are all coordinated by eight oxygen atoms, whereas Eu(2), Eu(6) and Eu(7) are nine-fold coordinated by oxygen atoms. For a detailed description of the crystal structure, the reader is referred to the description of the isotypic compound Li3K3Y7(BO3)9 [12]. Below, a comparison of the two isotypic compounds Li3K3RE7(BO3)9 (RE=Y, Eu) is given.
![Fig. 2: Top: [Li3B4O21] units connected to each other via BO3 groups along the crystallographic b axis. Bottom: connection of LiO6 octahedra via BO3 groups along the a axis.](/document/doi/10.1515/znb-2017-0146/asset/graphic/j_znb-2017-0146_fig_002.jpg)
Top: [Li3B4O21] units connected to each other via BO3 groups along the crystallographic b axis. Bottom: connection of LiO6 octahedra via BO3 groups along the a axis.
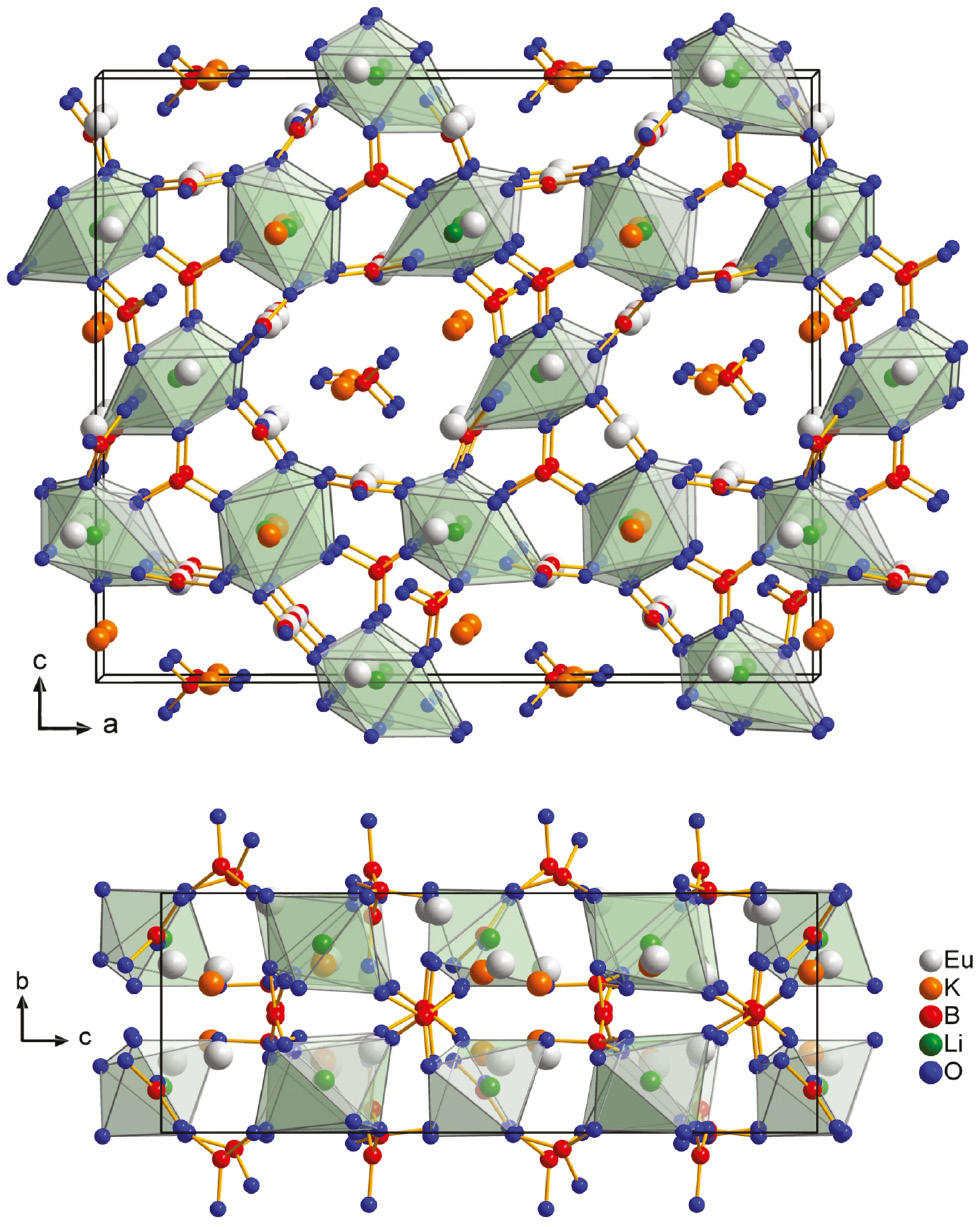
Top: View of the structure of Li3K3Eu7(BO3)9 along the crystallographic b axis. Bottom: structure along the a axis.
Table 3 shows a comparison of the lattice parameters of Li3K3Eu7(BO3)9 and Li3K3Y7(BO3)9. The increase of the lattice parameters corresponds to the increase of the ionic radii from Y3+ [1.159 Å for coordination number (CN) eight and 1.215 Å for CN nine] to Eu3+ (1.206 Å for CN eight and 1.260 Å for CN nine) [20]. The differences of the lattice parameters also cause an increase of the interatomic distances in Li3K3Eu7(BO3)9 compared to Li3K3Y7(BO3)9, see Table 4. Due to the increase of the lattice parameters and interatomic distances, the coordination environment of several cations changes. Table 5 compares the interatomic distances of K(3)–O and of Eu(7)–O in comparison with Y(7)–O on the two compounds, which lead to a change of the CN of K(3) from six to seven, and from eight for Y(7) to nine for Eu(7). All other CNs remain the same as reported in Li3K3Y7(BO3)9.
Comparison of the isotypic compounds Li3K3Eu7(BO3)9 and Li3K3Y7(BO3)9 (standard deviations in parentheses).
| Compound | Li3K3Eu7(BO3)9 | Li3K3Y7(BO3)9 |
|---|---|---|
| a, Å | 21.126(2) | 20.756(8) |
| b, Å | 6.502(2) | 6.322(2) |
| c, Å | 17.619(2) | 17.413(7) |
| V, Å3 | 2420.1(2) | 2284.9(5) |
Comparison of the av. distances (Å) of Li3K3Eu7(BO3)9 and Li3K3Y7(BO3)9.
| Compound | Li3K3Eu7(BO3)9 | Li3K3Y7(BO3)9 |
|---|---|---|
| Li1–O | 2.232 | 2.204 |
| Li2–O | 2.241 | 2.209 |
| Li3–O | 2.231 | 2.195 |
| B1–O | 1.373 | 1.370 |
| B2–O | 1.379 | 1.375 |
| B3–O | 1.375 | 1.37 |
| B4–O | 1.377 | 1.373 |
| B5–O | 1.379 | 1.379 |
| B6–O | 1.381 | 1.379 |
| B7–O | 1.377 | 1.373 |
| B8–O | 1.376 | 1.374 |
| B9–O | 1.372 | 1.373 |
| RE1–O | 2.387 | 2.347 |
| RE2–O | 2.489 | 2.441 |
| RE3–O | 2.418 | 2.372 |
| RE4–O | 2.401 | 2.350 |
| RE5–O | 2.451 | 2.389 |
| RE6–O | 2.498 | 2.458 |
| RE7–O | 2.512 | 2.409 |
| K1–O | 2.854 | 2.836 |
| K2–O | 2.902 | 2.870 |
| K3–O | 2.973 | 2.884 |
Comparison of the interatomic distances (Å) of Eu7, Y7 and K3 in Li3K3Eu7(BO3)9 and Li3K3Y7(BO3)9 indicating the different coordination numbers (CN; standard deviations in parentheses).
| Compound | |||
|---|---|---|---|
| Li3K3Eu7(BO3)9 | Li3K3Y7(BO3)9 | ||
| Eu7–O27 | 2.294(4) | Y7–O27 | 2.228(4) |
| Eu7–O2 | 2.323(3) | Y7–O2 | 2.271(3) |
| Eu7–O11 | 2.437(3) | Y7–O11 | 2.375(3) |
| Eu7–O24 | 2.457(4) | Y7–O24 | 2.379(3) |
| Eu7–O19 | 2.478(3) | Y7–O19 | 2.435(3) |
| Eu7–O21 | 2.529(3) | Y7–O21 | 2.440(3) |
| Eu7–O9 | 2.584(4) | Y7–O9 | 2.482(3) |
| Eu7–O12 | 2.706(3) | Y7–O12 | 2.658(3) |
| Eu7–O23 | 2.802(4) | Y7–O23 | 3.068(4) |
| Eu7–O17 | 4.083(4) | ||
| CN | 9 | CN | 8 |
| K3–O23 | 2.640(4) | K3–O23 | 2.618(4) |
| K3–O24 | 2.827(4) | K3–O24 | 2.855(3) |
| K3–O1 | 2.944(4) | K3–O1 | 2.868(4) |
| K3–O7 | 2.979(4) | K3–O26 | 2.948(4) |
| K3–O17 | 3.113(4) | K3–O7 | 2.974(4) |
| K3–O26 | 3.130(5) | K3–O17 | 3.041(4) |
| K3–O22 | 3.175(6) | K3–O22 | 3.346(4) |
| K3–O27 | 3.527(5) | ||
| CN | 7 | CN | 6 |
In Li3K3Eu7(BO3)9, the K–O distances range from 2.640(4) to 3.175(6) Å, with average values of 2.854 (K1), 2.902 (K2) and 2.973 Å (K3). The distances within the EuOx polyhedra are between 2.250(3) and 2.802(4) Å, with mean values of 2.387 (Eu1), 2.489 (Eu2), 2.418 (Eu3), 2.401 (Eu4), 2.451 (Eu5), 2.498 (Eu6) and 2.512 Å (Eu7). The average values of the B–O bonds range from 1.372 to 1.381 Å, which fit very well to the literature value of 1.37 Å [21] for common B–O distances in BO3 groups. The Li–O distances range from 1.945(13) to 2.941(18) Å with mean values of 2.232, 2.241, and 2.231 Å for Li(1), Li(2) and Li(3), respectively.
We additionally calculated the bond valence sums for Li3K3Eu7(BO3)9 with the bond-length/bond-strength concept (ΣV) [22], [23] and the CHARDI concept (charge distribution in solids, ΣQ) [24]. The results of these calculations are listed in Table 6 and correspond well with the expected values of the formal ionic charge of each specific atom.
Charge distribution in Li3K3Eu7(BO3)9 calculated with the bond-length/bond-strength (∑V) and the CHARDI (∑Q) concept.
| Li1 | Li2 | Li3 | Eu1 | Eu2 | Eu3 | Eu4 | Eu5 | Eu6 | Eu7 | |
|---|---|---|---|---|---|---|---|---|---|---|
| ∑V | 0.88 | 0.97 | 0.98 | 3.43 | 3.09 | 3.41 | 3.34 | 3.00 | 3.03 | 2.99 |
| ∑Q | 1.00 | 0.96 | 0.98 | 3.00 | 2.95 | 2.97 | 3.02 | 3.03 | 3.01 | 3.03 |
| B1 | B2 | B3 | B4 | B5 | B6 | B7 | B8 | B9 | ||
| ∑V | 3.02 | 2.91 | 2.97 | 2.95 | 2.94 | 2.96 | 2.93 | 2.96 | 2.98 | |
| ∑Q | 2.96 | 2.93 | 3.04 | 3.16 | 3.09 | 2.81 | 2.93 | 2.96 | 3.17 | |
| K1 | K2 | K3 | O1 | O2 | O3 | O4 | O5 | O6 | O7 | |
| ∑V | 1.12 | 1.15 | 0.73 | −1.98 | −2.26 | −2.19 | −2.1 | −2.34 | −2.12 | −2.27 |
| ∑Q | 0.97 | 0.99 | 1.02 | −2.03 | −2.15 | −2.10 | −1.95 | −1.99 | −1.84 | −2.12 |
| O8 | O9 | O10 | O11 | O12 | O13 | O14 | O15 | O16 | O17 | |
| ∑V | −2.22 | −2.12 | −2.3 | −2.26 | −2 | −1.9 | −2.18 | −2.23 | −2.12 | −2.27 |
| ∑Q | −1.98 | −1.99 | −2.21 | −2.04 | −1.85 | −1.86 | −2.11 | −1.974 | −1.90 | −2.10 |
| O18 | O19 | O20 | O21 | O22 | O23 | O24 | O25 | O26 | O27 | |
| ∑V | −2.3 | −2.28 | −2.37 | −2.24 | −2.06 | −1.88 | −2.08 | −2.24 | −2.15 | −1.79 |
| ∑Q | −2.18 | −2.02 | −2.05 | −2.06 | −2.03 | −1.78 | −1.97 | −1.97 | −1.94 | −1.82 |
MAPLE values (Madelung Part of Lattice Energy) [25], [26], [27] of Li3K3Eu7(BO3)9 were compared with those received from the summation of the data for the starting compounds Li2O [28], K2O [29], Eu2O3 [30] and B2O3 [31]. A value of 158777 kJ mol−1 was obtained in comparison to 155254 kJ mol−1 (deviation=0.03%) calculated from the binary oxides [1½ Li2O (5254 kJ mol−1)+1½ K2O (3767 kJ mol−1)+3½ Eu2O3 (47574 kJ mol−1)+4½ B2O3 (98659 kJ mol−1)]. The good accordance between the value of the product and the sum of the values of the binary compounds prove the plausibility of the crystal structure solution.
3.2 IR spectroscopy
Figure 4 shows the experimental FT-IR spectra of Li3K3Eu7(BO3)9 and Li3K3Y7(BO3)9 [12] in the range between 600 and 4000 cm−1. The absorption bands of the two compounds correspond well with negligible shifts in wavelengths and relative intensities. As already reported for the isotypic compound Li3K3Y7(BO3)9 [12], an assignments of the vibrational modes can be done based on previous investigations of borates containing trigonal [BO3]3− groups [32], [33], [34], [35], [36]. The absorption bands between 600 and 800 cm−1 could be assigned as deformation and out-of-plane bending of BO3 groups. The bands in the region from 900 to 965 cm−1 are typical for B–O symmetric stretching vibrations. The strong bands observed in the spectral range between 1150 and 1500 cm−1 can be related to the antisymmetric B–O stretching vibrations. According to Mak et al. [36] the region between 2100 and 2650 cm−1 can be related to combination- and overtone-bands of the BO3 groups. The absorption peaks in the range of 2800–3000 cm−1 most likely belong to the grease, which was used to fix the crystal on a glass fiber.
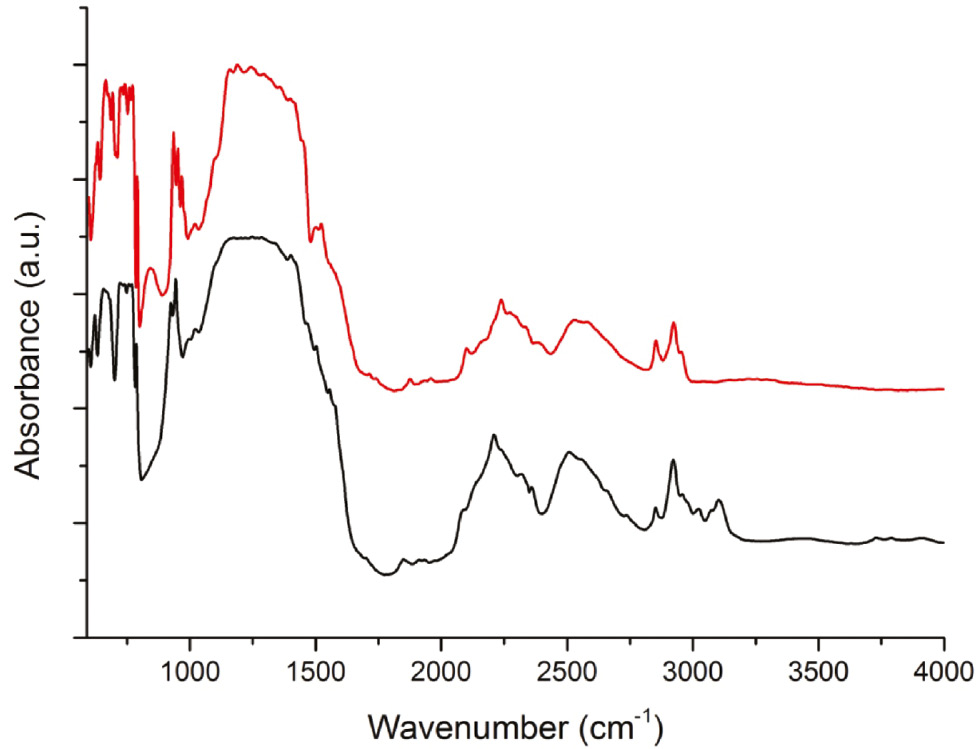
FT-IR absorbance spectra of Li3K3Eu7(BO3)9 (black) and the isotypic compound Li3K3Y7(BO3)9 (red).
3.3 Luminescence
Figure 5 shows the title compound’s emission signal on excitation at 460 nm. The profile can be assigned to typical Eu3+ luminescence regarding the transition 5D0→7FJ (J=0–4). From the relative intensities, one can conclude that there is no inversion symmetry around the Eu3+ activator ion which is in good agreement with the results of the crystal structure determination. To our astonishment, concentration quenching of Li3K3Eu7(BO3)9 was not observed. Ortner et al. also reported this phenomenon in the europium borate Eu[B6O8(OH)5]·H3BO3 [37], which could be expected due to the fact that the shortest Eu–Eu distance is 4.459(1) Å. Obviously an Eu–Eu distance of 3.556(2) Å in Li3K3Eu7(BO3)9 does not lead to concentration quenching of the Eu3+ activator ion.
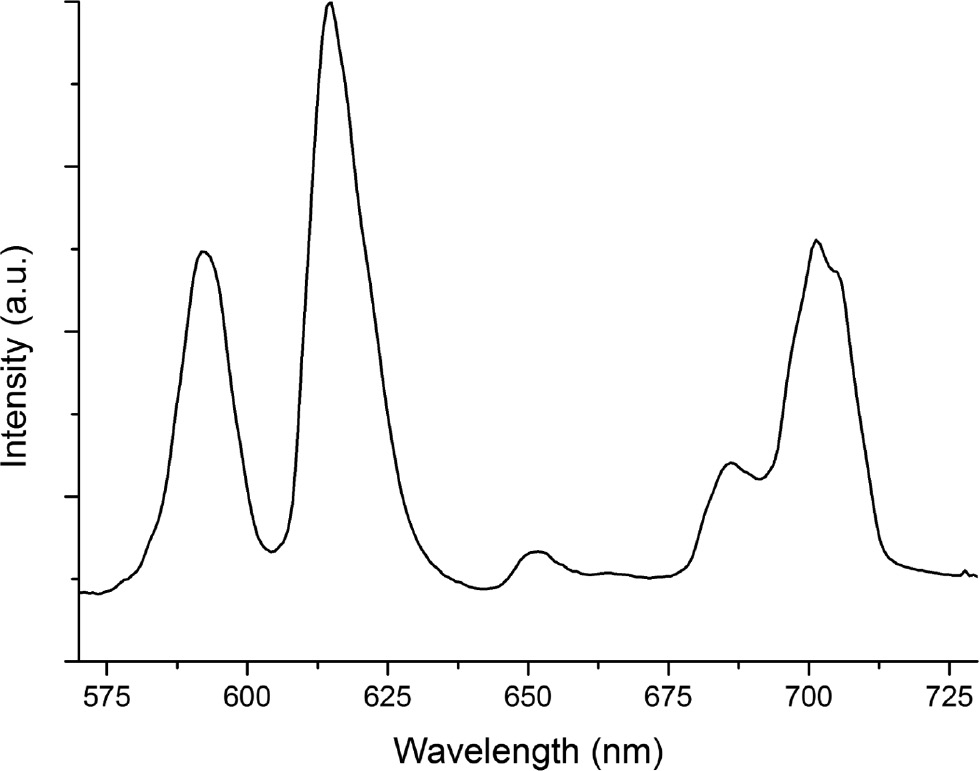
Luminescence spectrum of a single-crystal of Li3K3Eu7(BO3)9, obtained on excitation at 460 nm.
4 Conclusions
This report contains the description of the synthesis and crystal structure of the new mixed alkali rare earth borate Li3K3Eu7(BO3)9. Furthermore, the compound was characterized by infrared and luminescence spectroscopy. With the successful synthesis of Li3K3Eu7(BO3)9, this class of compounds could be extended by an additional example.
5 Supporting information
Additional crystallographic data for Li3K3Eu7(BO3)9 (atomic coordinates and anisotropic displacement parameters) are given as Supporting Information available online (https://doi.org/10.1515/znb-2017-0146).
Acknowledgments
Special thanks go to Dr. G. Heymann for collecting the single-crystal diffraction data, to D. Vitzthum for the measurements of the single-crystal IR spectra (both from Institute for General, Inorganic, and Theoretical Chemistry, University of Innsbruck) and to Univ.-Prof. Dr. R. Stalder, Institute for Mineralogy and Petrography, University of Innsbruck, for the access to the FTIR spectrometer.
References
[1] D. A. Keszler, Curr. Opin. Solid State Mater. Sci.1996, 1, 204.10.1016/S1359-0286(96)80085-4Suche in Google Scholar
[2] P. Becker, Adv. Mater.1998, 10, 979.10.1002/(SICI)1521-4095(199809)10:13<979::AID-ADMA979>3.0.CO;2-NSuche in Google Scholar
[3] J. Czirr, G. MacGillivray, R. MacGillivray, P. Seddon, Nucl. Instrum. Methods A1999, 424, 15.10.1016/S0168-9002(98)01295-9Suche in Google Scholar
[4] J. Dexpert-Ghys, R. Mauricot, B. Caillier, P. Guillot, T. Beaudette, G. Jia, P. A. Tanner, B.-M. Cheng, J. Phys. Chem. C2010, 114, 6681.10.1021/jp909197tSuche in Google Scholar
[5] X. Sun, W. Gao, T. Yang, R. Cong, Dalton Trans.2015, 44, 2276.10.1039/C4DT03303ESuche in Google Scholar
[6] G. Abdullaev, K. S. Mamedov, P. Rza-Zade, S. A. Guseinova, G. Dzhafarov, Russ. J. Inorg. Chem.1977, 22, 1765.Suche in Google Scholar
[7] V. Jubera, P. Gravereau, J. P. Chaminade, Solid State Sci.2001, 3, 469.10.1016/S1293-2558(01)01156-6Suche in Google Scholar
[8] M. J. Delaigue, V. Jubera, J. Sablayrolles, J.-P. Chaminade, A. Garcia, I. Manek-Hönninger, Appl. Phys. B2007, 87, 693.10.1007/s00340-007-2641-7Suche in Google Scholar
[9] J. Sablayrolles, V. Jubera, M. Delaigue, I. Manek-Hönninger, J.-P. Chaminade, J. Hejtmánek, R. Decourt, A. Garcia, Mater. Chem. Phys.2009, 115, 512.10.1016/j.matchemphys.2009.02.011Suche in Google Scholar
[10] J. Sablayrolles, V. Jubera, J.-P. Chaminade, I. Manek-Hönninger, S. Murugan, T. Cardinal, R. Olazcuaga, A. Garcia, F. Salin, Opt. Mater.2005, 27, 1681.10.1016/j.optmat.2004.11.037Suche in Google Scholar
[11] J. Chaminade, O. Viraphong, F. Guillen, C. Fouassier, B. Czirr, IEEE T. Nucl. Sci.2001, 48, 1158.10.1109/23.958742Suche in Google Scholar
[12] S. Bräuchle, H. Huppertz, J. Solid State Chem.2017, 253, 242.10.1016/j.jssc.2017.05.044Suche in Google Scholar
[13] M.-J. Xia, R. Li, Acta Crystallogr.2007, E63, i173.10.1107/S1600536807036586Suche in Google Scholar
[14] S. Zhao, G. Zhang, J. Yao, Y. Wu, Cryst. Eng. Comm.2012, 14, 5209.10.1039/c2ce25304fSuche in Google Scholar
[15] P. Chen, M. Xia, R. Li, Z. Anorg. Allg. Chem.2016, 642, 424.10.1002/zaac.201500804Suche in Google Scholar
[16] Sadabs V5, Bruker AXS Inc., Madison, Wisconsin (USA) 2014.Suche in Google Scholar
[17] G. M.Sheldrick, Shelxs-13 and Shelxl-13, Program Suite for the Solution and Refinement of Crystal Structures, University of Göttingen, Göttingen (Germany) 2013.Suche in Google Scholar
[18] G. M. Sheldrick, Acta Crystallogr.2015, C71, 3.Suche in Google Scholar
[19] K. Brandenburg, Diamond (version 3.2i), Crystal and Molecular Structure Visualization, Crystal Impact – H. Putz & K. Brandenburg GbR, Bonn (Germany) 2012.Suche in Google Scholar
[20] R. T. Shannon, Acta Crystallogr.1976, A32, 751.10.1107/S0567739476001551Suche in Google Scholar
[21] E. Zobetz, Z. Kristallogr.1982, 160, 81.10.1524/zkri.1982.160.1-2.81Suche in Google Scholar
[22] I. Brown, D. Altermatt, Acta Crystallogr.1985, B41, 244.10.1107/S0108768185002063Suche in Google Scholar
[23] N. Brese, M. O‘Keeffe, Acta Crystallogr.1991, B47, 192.10.1107/S0108768190011041Suche in Google Scholar
[24] R. Hoppe, S. Voigt, H. Glaum, J. Kissel, H. P. Müller, K. Bernet, J. Less-Common Met.1989, 156, 105.10.1016/0022-5088(89)90411-6Suche in Google Scholar
[25] R. Hübenthal, M. Serafin, R. Hoppe, Maple (version 4.0), Program for the Calculation of Distances, Angles, Effective Coordination Numbers, Coordination Spheres, and Lattice Energies, University of Gießen, Gießen (Germany) 1993.Suche in Google Scholar
[26] R. Hoppe, Angew. Chem., Int. Ed. Engl.1970, 9, 25.10.1002/anie.197000251Suche in Google Scholar
[27] R. Hoppe, Angew. Chem., Int. Ed. Engl.1966, 5, 95.10.1002/anie.196600951Suche in Google Scholar
[28] W. I. David, M. O. Jones, D. H. Gregory, C. M. Jewell, S. R. Johnson, A. Walton, P. P. Edwards, J. Am. Chem. Soc.2007, 129, 1594.10.1021/ja066016sSuche in Google Scholar
[29] E. Zintl, A. Harder, B. Dauth, Z. Elektrochem.1934, 40, 588.Suche in Google Scholar
[30] H. L. Yakel, Acta Crystallogr.1979, B35, 564.10.1107/S0567740879004167Suche in Google Scholar
[31] G. Gurr, P. Montgomery, C. Knutson, B. Gorres, Acta Crystallogr.1970, B26, 906.10.1107/S0567740870003369Suche in Google Scholar
[32] J. Laperches, P. Tarte, Spectrochim. Acta1966, 22, 1201.10.1016/0371-1951(66)80023-1Suche in Google Scholar
[33] R. Böhlhoff, H. Bambauer, W. Hoffmann, Z. Kristallogr.1971, 133, 386.10.1524/zkri.1971.133.133.386Suche in Google Scholar
[34] K. Machida, H. Hata, K. Okuno, G. Adachi, J. Shiokawa, J. Inorg. Nucl. Chem.1979, 41, 1425.10.1016/0022-1902(79)80205-5Suche in Google Scholar
[35] A. Haberer, H. Huppertz, J. Solid State Chem.2009, 182, 888.10.1016/j.jssc.2009.01.023Suche in Google Scholar
[36] C. Mak, P. Tanner, Z. Zhuo, J. Alloys Compd.2001, 323, 292.10.1016/S0925-8388(01)01117-3Suche in Google Scholar
[37] T. S. Ortner, K. Wurst, M. Seibald, B. Joachim, H. Huppertz, Eur. J. Inorg. Chem.2016, 2016, 3292.10.1002/ejic.201600222Suche in Google Scholar
Supplemental Material
The online version of this article offers supplementary material (https://doi.org/10.1515/znb-2017-0146).
©2017 Walter de Gruyter GmbH, Berlin/Boston
Artikel in diesem Heft
- Frontmatter
- In this Issue
- Improvement of the Van Leusen reaction in the presence of β-cyclodextrin: a green and efficient synthesis of oxazoles in water
- Nano-colloidal silica-tethered polyhedral oligomeric silsesquioxanes with eight branches of 3-aminopropyltriethoxysilane as high-performance catalyst for the preparation of bis-thiazolidinones under ultrasonic conditions
- A Mn(II) coordination polymer from a polycarboxylate-containing ligand: synthesis, structural characterization, and properties
- Syntheses, crystal structures and phosphorescence properties of cyclometalated iridium(III) bis(pyridylbenzaldehyde) complexes with dithiolate ligands
- A supramolecular tetranuclear zinc(II) complex constructed from an asymmetrical Salamo-type ligand: synthesis, structure and fluorescence properties
- Bioactive chemical constituents from the resin of Aloe vera
- Synthesis and structural characterization of Li3K3Eu7(BO3)9
- Ni6B22O39·H2O – extending the field of nickel borates
- High-pressure synthesis and crystal structure of α-Y2B4O9
- β-Y(BO2)3 – a new member of the β-Ln(BO2)3 (Ln=Nd, Sm, Gd–Lu) structure family
- Antiferromagnetic ordering in the plumbide EuPdPb
- Note
- Single-crystal structure refinement of YbF2 with a remark about YbH2