An advanced rotational rheometer system for extremely fluid liquids up to 1273 K and applications to alkali carbonate melts
-
 ,
,

Abstract
A high-temperature rheometer equipped with a graphite furnace, characterized by an air-bearing-supported synchronous motor, has been enhanced by a custom-made Pt-Au concentric cylinder assembly. With this adaptation, viscosity measurements of highly fluid melts can be achieved at high temperatures, up to 1273 K.
Due to the air-bearing-supported motor, this apparatus can perform measurements of extremely low torque ranging between 0.01 μNm and 230 mNm (resolution of 0.1 nNm), extending the typical range of viscosity measurements accessible in the present configuration to 10-3.5-103.5Pa.s and shear rates up to 102of s-1.
We calibrated the system with distilled water, silicone oils, and the DGG-1 standard glass. We further present new data for the viscosity of Na2CO3, K2CO3, and Li2CO3 liquids. Finally, a comparison between our results and literature data is provided, to illustrate the effect of chemical composition and oxygen fugacity on the viscosity of alkali carbonate melts, which serve as analogs for both carbonatitic melts and molten carbonates of industrial relevance.
This study substantially improves the database of alkali carbonate melts and dramatically increases the accuracy with respect to previous measurement attempts. The very low viscosity range data and their temperature dependence also helps to constrain very well the activation energy of these highly fluid systems and confirms the estimate of a universal pre-exponential factor for non-Arrhenian visco sity-temperature relationships.
Introduction
Viscosity is a fundamental property influencing the fluid dynamics of natural and synthetic systems. In recent years, the mobility of naturally occurring and extremely fluid, carbonatite melts, has attracted renewed interest (Liu et al. 2007; Jones et al. 2013). Such melts are considered to be the main transport agent of carbon from the mantle to the crust and are thought to be intimately linked to the generation and transport of kimberlites to the Earth’s surface (Russell et al. 2012).
Due to the extremely low viscosity of these melts and their near ubiquitous presence in the asthenosphere, carbonatite melts may play a crucial role in the relative motion of tectonic plates, hence in the shaping of the Earth’s crust (e.g., Hammouda and La-porte 2000; Gaillard et al. 2008). Gaillard et al. (2008) proposed that high conductivity values obtained for the asthenosphere could indicate the presence of small but significant amounts of carbonate melt in the upper mantle.
From a planetary perspective carbonatite melts are believed to be involved, as erosive fluids, in the formation of lava channels and valleys observed on Venus (Baker et al. 1992; Kargel et al. 1994; Treiman 1995). The astonishing lengths of channel landforms (up to 6800 km) and their fluvial-like shape, together with their longitudinal continuity, suggest that Venusian lavas may have been characterized by extremely low viscosities. As carbonatites are almost exclusively associated with alkali mafic and ultramafic silicate melts on Earth (Baker et al. 1992 and references therein; Russell et al. 2012), the two ultramafic and highly potassic compositions (Venera 8 and 13 probes, see Treiman 1995, and references therein) measured in situ in the Venera 13 sample (nephelinite) and by the Vega rover (Soviet Venera and Vega programs, 1981/5) provide strong support for the presence of carbonatite melts on Venus.
Beyond their importance in the geological and planetary science, carbonate melts are assuming an increasingly important role in industrial processes. Lithium-, potassium-, and sodium-carbonate melts are employed as electrolytes in molten carbonate fuel cells (MCFCs), which operate at high temperatures (923 K), for the production of CO2-emission-free electricity. For this reason MCFCs are considered one of the most promising sources of green power production in the near future (Koishi et al. 2000). In this context, it has been demonstrated that the physical properties of molten alkali carbonates employed in the MCFCs affect the cell performances and durability (Reeve and Tseung 1996 and references therein; Yoshiba et al. 2004). Consequently, a detailed knowledge of the physical properties of molten alkali carbonates assumes a strategic importance in view of future improvementsand electricity generation capabilities.
It is therefore evident that accurate measurement of flow properties and in particular the liquid viscosity is key to modeling the mobility of carbonate melts both in nature and in industrial and technological processes.
Obtaining accurate viscosity measurements of these extremely fluid melts involves several serious experimental challenges due to their high volatility, corrosive action on crucible materials, as well as the very low torques to be expected in this viscosity range.
To overcome these experimental limitations, we have customized a low-torque and high-temperature commercial rheometer system to enable measurements on extremely low viscosity melts. Here we present the calibration of the rheometer together with the results of a viscosity study of different alkali carbonate melts, as a function of temperature and oxygen fugacity at ambient pressure. We compare the obtained results with literature values and discuss the effect of chemical composition on the viscosity behavior.
Instrument description
The measuring device consists of a controlled stress and strain rheometer, incorporated air-bearing-supports, and an electronically commutated (EC) synchronous motor. Figure 1 shows the apparatus together with an illustration of both the synchronous electronically commutated (EC) motor and the measuring geometry used in this study.
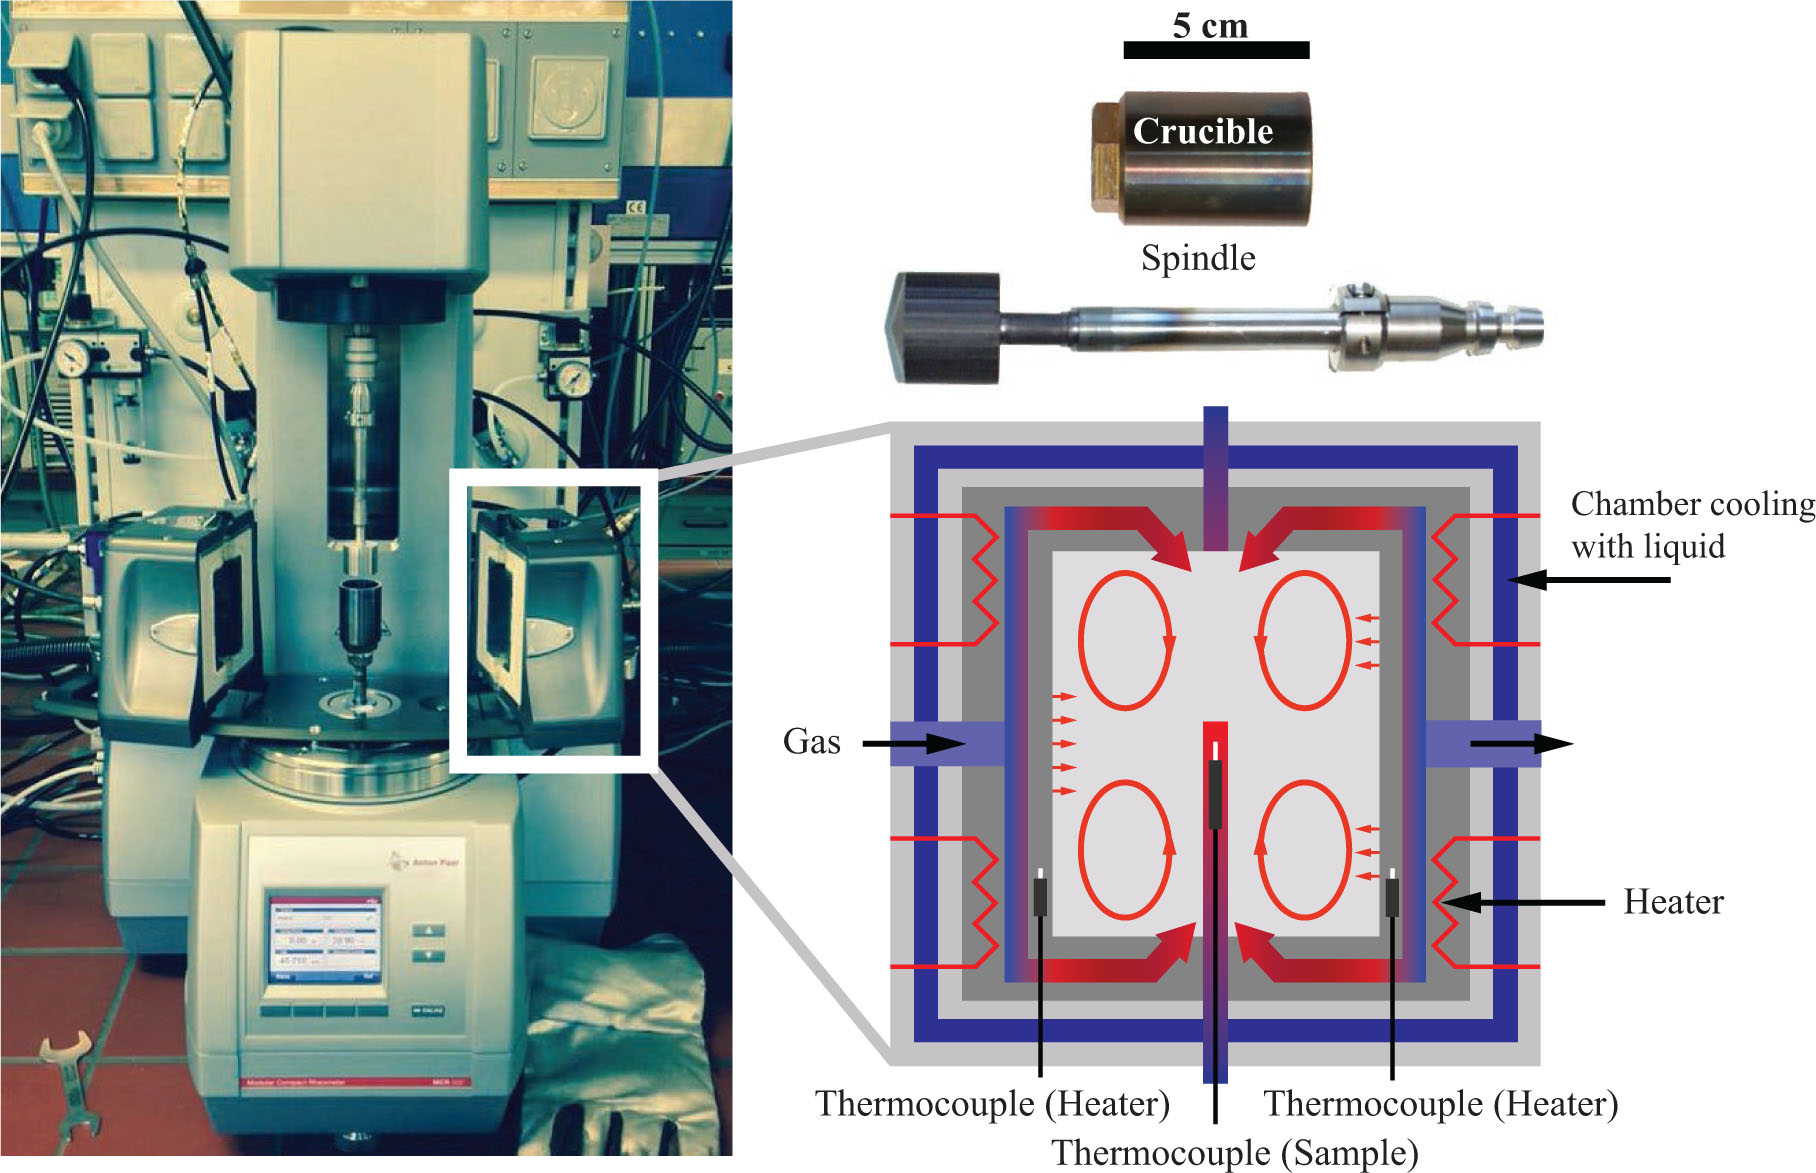
Sketch of the rheometer and the measuring geometry (concentric cylinder). Additionally, a sketch of the furnace is also shown.
In contrast to traditional controlled-strain rheometers involving rotational variable displacement transducers (e.g., Dingwell 1986), here the electrical current of the motor is used as the measure of the torque. For this reason, a separate transducer measuring the torque is obviated, and the measured value is not influenced by the torque needed to accelerate the motor (Lauger and Stettin 2010). The rheometer is air- and water-cooled to protect and stabilize the electronics. All these features taken together yield rheological measurements with unprecedented accuracy and precision.
Additionally, the motor, which is equipped with a permanent magnet on the rotor, is defined as a synchronous motor because the magnetic field in the stator rotates at a speed proportional to the frequency of the applied voltage. This configuration allows the maintenance of constant motor characteristics, which prevent any drift of the registered signal and exclude any change in the relation between the applied electrical current to the motor and the measured torque. This feature represents one of the main advantages of a synchronous motor in respect to classical drag-cup motor in performing rheological measurements (Lauger and Stettin 2010).
Another peculiarity of the EC motor lies in the absence of mechanical contacts to excite the motor. In comparison with motors involving brush contacts to activate the rotor, this contactless solution provides several advantages, including: (1) a higher reliability and lifetime of the motor, (2) a reduction of noise, and (3) an overall reduction of electromagnetic interference.
Using the apparatus presented in this work it is possible to perform viscosity measurements characterized by very small torques of less than 0.5 mNm (which is typically taken to be the lower limit of common mechanical commutation rheometers). At the same time, this setup is capable of sustaining high torques (up to 230 mNm) for long times, thus enabling a continuous and wide dynamic range of measurements.
To perform viscosity measurements at high temperatures (up to 1273 K) without the threat of reaction of sample with the viscometer materials, custom-made Pt-Au crucible and spindle have been fabricated (Fig. 1) replicating the steel originals. The measuring geometry consists of a concentric cylinder arrangement, where the outer cylinder has a diameter of 24 mm and the gap between the two cylinders is 1 mm. The furnace is an electrical resistance “convection temperature device” (CTD 1000), containing a K type thermocouple positioned at the base of the measuring cup. The chamber is cooled by water, while the sample is heated by convection and radiation of heat produced by the heating elements. Finally, the geometry of the furnace is such as to allow for viscosity investigation under controlled gas flows including gas mixtures, such that partial pressures of active chemical components (e.g., oxygen fugacity) can be controlled.
Instrument calibration
The instrument was calibrated in a broad viscosity (η)-shear rate (γ)-temperature (T) interval. In particular, 53 calibration measurements were performed in the temperature range from 293 to 1273 K, at standard viscosity ranging between-3.33 and 3.13 log Pas, and shear rates from 0.5 to 70 s”1 and using both the steel and Pt-Au assemblies. For the calibration both the steel and the Pt-Au assemblies were used. The investigated η-γ-T interval well overlaps with the interval relevant for volcano logical and industrially interesting carbonate and carbonatitic melts. For example, Norton and Pinkerton (1997) performed viscosity measurements of carbonatites from Lengai volcano (Tanzania) in the temperature range 773 to 923 K, applying different shear rates up to 30 s-1. The measured viscosity ranged between 0.15 and 260 Pa.s.
The standard materials we used for the calibration are (1) distilled water, (2) a Newtonian silicone oil (viscosity standard Cannon N15000), and (3) a soda-lime-silicate viscosity standard glass (DGG-1, supplied by the Deutsche Glastechnische Gesellschaft). Using DGG-1, we additionally check for thermal gradient along the crucible and/or shear heating effect. The absolute error in temperature derived from the high-precision viscosity measurements is less than 3 K, therefore we consider this effect negligible.
The calibration results are reported in Table 1 together with the certified viscosity values of the standards. The standard materials have been chosen to cover a wide range of viscosities and temperatures against which the rheometer, equipped with both steel and custom-made measurement geometries has been calibrated.
Viscosity data from standard materials as a function of temperature and shear rate
| Sample | T (K) | Shear rate (s–1) | Measured log (Pa·s) | Reference log (Pa·s) |
|---|---|---|---|---|
| Distilled water | 303 | 30 | –3.095 | –3.098 |
| Distilled water | 303 | 50 | –3.093 | –3.098 |
| Distilled water | 303 | 60 | –3.099 | –3.098 |
| Distilled water | 303 | 70 | –3.105 | –3.098 |
| Distilled water | 333 | 30 | –3.328 | –3.331 |
| Distilled water | 333 | 50 | –3.334 | –3.331 |
| Distilled water | 333 | 60 | –3.328 | –3.331 |
| Distilled water | 333 | 70 | –3.323 | –3.331 |
| Distilled water | 333 | 30 | –3.325 | –3.331 |
| Distilled water | 333 | 50 | –3.335 | –3.331 |
| Distilled water | 333 | 60 | –3.329 | –3.331 |
| Distilled water | 333 | 70 | –3.323 | –3.331 |
| Cannon N15000 | 298 | 15 | 1.581 | 1.590 |
| Cannon N15000 | 298 | 10 | 1.581 | 1.590 |
| Cannon N15000 | 298 | 5 | 1.581 | 1.590 |
| Cannon N15000 | 313 | 15 | 1.059 | 1.063 |
| Cannon N15000 | 313 | 10 | 1.059 | 1.063 |
| Cannon N15000 | 313 | 5 | 1.060 | 1.063 |
| Cannon N15000 | 323 | 15 | 0.752 | 0.753 |
| Cannon N15000 | 323 | 10 | 0.752 | 0.753 |
| Cannon N15000 | 323 | 5 | 0.752 | 0.753 |
| Cannon N15000 | 333 | 15 | 0.472 | 0.470 |
| Cannon N15000 | 333 | 10 | 0.472 | 0.470 |
| Cannon N15000 | 333 | 5 | 0.473 | 0.470 |
| Cannon N15000 | 313 | 15 | –0.013 | –0.023 |
| Cannon N15000 | 313 | 10 | –0.013 | –0.023 |
| Cannon N15000 | 313 | 5 | –0.013 | –0.023 |
| Cannon N15000 | 313 | 15 | –0.013 | –0.023 |
| Cannon N15000 | 313 | 10 | –0.013 | –0.023 |
| Cannon N15000 | 313 | 5 | –0.013 | –0.023 |
| Cannon N15000 | 373 | 15 | –0.415 | –0.432 |
| Cannon N15000 | 373 | 10 | –0.415 | –0.432 |
| Cannon N15000 | 373 | 5 | –0.415 | –0.432 |
| Cannon N15000 | 373 | 15 | –0.414 | –0.432 |
| Cannon N15000 | 373 | 10 | –0.414 | –0.432 |
| Cannon N15000 | 373 | 5 | –0.413 | –0.432 |
| Cannon N15000 | 313 | 15 | –0.010 | –0.023 |
| Cannon N15000 | 313 | 10 | –0.009 | –0.023 |
| Cannon N15000 | 313 | 5 | –0.009 | –0.023 |
| Cannon N15000 | 313 | 15 | –0.009 | –0.023 |
| Cannon N15000 | 313 | 10 | –0.009 | –0.023 |
| Cannon N15000 | 313 | 5 | –0.009 | –0.023 |
| Cannon N15000 | 333 | 15 | 0.479 | 0.470 |
| Cannon N15000 | 333 | 10 | 0.479 | 0.470 |
| Cannon N15000 | 333 | 5 | 0.479 | 0.470 |
| Cannon N15000 | 323 | 15 | 0.759 | 0.753 |
| Cannon N15000 | 323 | 10 | 0.760 | 0.753 |
| Cannon N15000 | 323 | 5 | 0.760 | 0.753 |
| Cannon N15000 | 313 | 15 | 1.068 | 1.063 |
| Cannon N15000 | 313 | 10 | 1.069 | 1.063 |
| Cannon N15000 | 313 | 5 | 1.069 | 1.063 |
| DGG-1 | 1273 | 0.5 | 3.131 | 3.173 |
| DGG-1 | 1273 | 2.5 | 3.135 | 3.173 |
The measured viscosities for distilled water (using the steel assembly) are shown in Figure 2a as a function of time, temperature, and shear rate. These measurements were performed at 303 and 333 K and at shear rates of 30, 50,60, and 70 sr1. The measured viscosities range between -3.33 and -3.09 log Pas, (0.463 to 0.807 m Pa.s), respectively.

(a) Measured viscosity of distilled water, as a function of time (minutes), at 303 and 333 K. The numbers in the figure show the employed strain rate (s−1) during the measurements. (b) Measured viscosity of silicone standard (Cannon N15000) as a function of time. The measurements were carried out between 298 and 373 K, while the numbers in the figure show the employed strain rate (s−1) during the measurements.
Before starting the viscosity measurement, the distilled water was stirred for 5 min to achieve thermal equilibrium of the entire system (water + steel assembly). Additionally, due to the rapid water evaporation, the viscosity at the 333 K was measured at time intervals of 1 min, whereas at 303 K the viscosity was measured every 5 min. Measured viscosities at 333 K (Fig. 2a) are more scattered with respect to those at 303 K. This is because the sampling rate (1 min) at 33 3 K is probably too short to obtain a stable value of viscosity. Despite the slight data scattering, the results match very well the reference values of viscosity of distilled water at 3 3 3 K (Table 1). To test the reproducibility of our results, the measurements were repeated 5 times. The precision in measuring the viscosity of water ranges between 0.001 and 0.008 log Pa- s, which corresponds to 0.3 and 1.9%, respectively.
Viscosity measurements of the Newtonian silicone standard (Cannon Nl5000) were carried out at 298, 313, 323, 333, 353, and 373 K by using the Pt-Au spindle and cup. The viscosity was measured at each temperature with 10 s sampling interval for 5 min after waiting 10 min for thermal equilibration of the system. Moreover, the reproducibility of our results was verified byperforming new viscosity measurements decreasing the temperature from 373 to 298 K (see Table 1).
Viscosity measurements have been performed as a function of temperature at different shear rates (5, 10, and 15 s–1) showing values ranging between –0.42 and 1.58 log Pa·s. The results are reported in Table 1 and shown in Figure 2b as a function of time, temperature, and shear rate. As expected, viscosity decreases from 298 to 373 K and the silicon standard exhibits a Newtonian behavior over the entire interval of temperature and shear rate investigated. These results agree with the references values to within ±0.01 log Pa·s.
We also considered the possibility of viscous heating due to the very high shear during viscosity measurements. The results showed that at high shear rate (100 s–1) and at 15, 20, and 40 °C a viscous heating effect was detected after few minutes (i.e., an increase in temperature in the order of 0.2 °C and a decrease in viscosity). For this reason those viscosity measurements were not taken into account for the calibration of the instrument.
Finally, the calibration of our device was augmented by performing high-temperature measurements on the DGG-1 soda-lime silicate standard glass. Initially, a bubble-free glass was synthesized by melting the DGG-1 at 1773 K for 12 h in the Pt-Au cup using a Nabertherm box furnace. Afterward, the bubble-free glass was remelted in the rheometer furnace and heated to the target temperature. Finally the spindle was immersed in the sample to the measuring position and allowed to thermally equilibrate before starting the measurement. Viscosity measurements were carried out at 1273 K, the maximum temperature achievable with the rheometer furnace, for 80 min at two different strain rates: 2.5 and 0.5 s-1. The average measured viscosity is 3.15 (±0.02) log Pas, while the reference values is 3.17 log Pas (Table 1).
Figure 3 shows a comparison between the measured and the reference values. The large data symbols span the error of the measurements and the 1:1 linear regression agrees to within 0.004, 0.01, and 0.02 log unit for distilled water, silicone oil standard, and DGG-1, respectively.
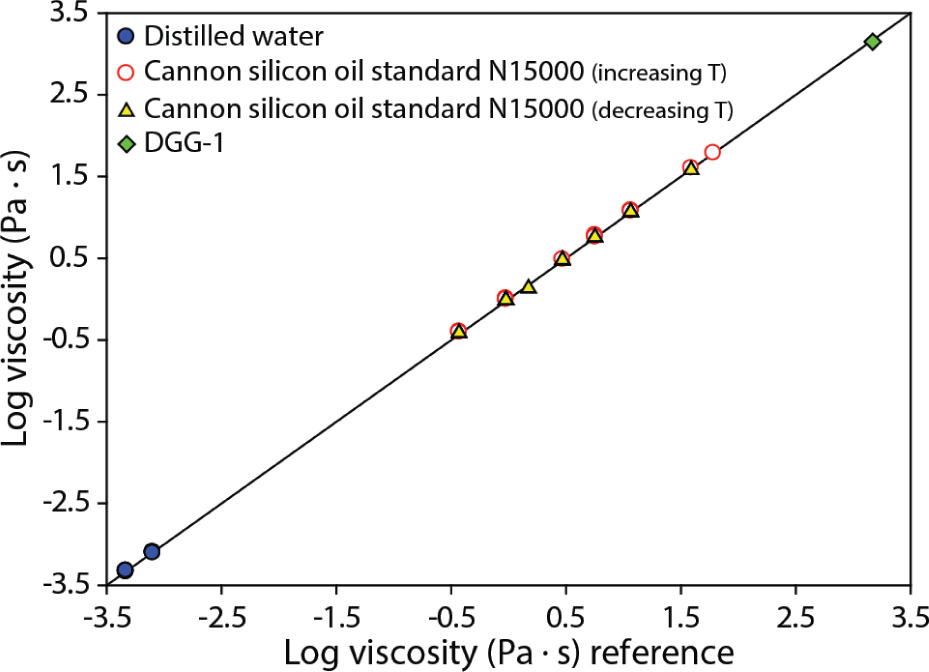
Comparison between measured and reference viscosities. The viscosity measurements were performed between 298 and 1273 K, at different shear rates ranging between 0.5 and 70 s−1. The error is smaller than the symbol size and the 1:1 linear regression agrees to within 0.004 log unit for distilled water, 0.01 log unit for silicone oil standard and 0.02 log unit for DGG-1 standard glass.
To summarize, the calibration validates the use of this new rheometer for viscosity measurements characterized by a high precision and accuracy. The measurements can be carried out between ambient temperature and 1273 K, in a viscosity range between -3.5 and 3.5 log Pas.
Viscosity measurements of Na2CO3, K2CO3, and Li2CO3
As noted above, the viscosity of molten carbonates is of great importance in both earth sciences and industrial processes. Notwithstanding their great importance, knowledge of the physical properties of these melts is still far from complete, with many of the available results being inconsistent having been apparently compromised by experimental complications.
Janz and Saegusa (1963), Vorob’ev et al. (1966), and Sato et al. (1999) have investigated the viscosity of lithium, sodium, and potassium carbonate melts at/or near ambient pressure. Sato et al. (1999) reported a comparison between the results obtainedfrom the different studies. According to these studies, within the investigated interval of temperature (1016–1234 K), Li2CO3, Na2CO3, and K2CO3 melts exhibit Arrhenian behavior.
Additionally, the viscosity data presented in Sato et al. (1999) and Vorob’ev et al. (1966) are in good agreement, whereas a large discrepancy with the Janz and Saegusa (1963) is observed.
Sato et al. (1999) observed a trend among the measured viscosities of the alkali carbonate melts, in which the viscosity appears to be directly related to the ionic radius of the cations. Nevertheless, the authors claim that two observed phenomena are difficult to explain: (1) the reversal relation between the Rb2CO3 and K2CO3 viscosity and ionic radius and (2) the similarity of viscosities of Li2CO3 andNa2CO3 melts.
We therefore performed viscosity measurements of Na-, K-, and Li-carbonate (Fig. 4) to clarify the question of the relative viscosities of these melts and the validity of the relationships presented in Sato et al. (1999). First, to verify the chemical stability of the carbonatite melts (e.g., decarbonization reactions), and the reproducibihty of measurements, the first measurement was performed at the highest temperature and further measurements followed at 10 K intervals separated by cooling stages at 5 K/min. The system was held at each temperature for enough time to obtain a stable value of viscosity (i.e., minutes). Later, repeated viscosity measurements were performed at temperature equal or very similar to the initial one. The comparison between the initial measurements (during heating) and the last measurements (after cooling) shows no changes of measured viscosity (see Table 2), indicating negligible influence of decarbonization reactions on the viscosity measurements.

Measured viscosity of Li2CO3 and Na2CO3 as a function of the reciprocal temperature. In the figure it is also shown a comparison between the results obtained in this study and the results presented in Janz and Saegusa (1963) and Sato et al. (1999). The error is smaller than the symbol size.
Viscosity data from standard materials as a function of temperature and shear rate
| Sample | T (K) | 104/T (K) | Measured log (Pa·s) | Measured (mPa·s) |
|---|---|---|---|---|
| K2CO3 | 1183 | 8.5 | –2.420 | 3.80 |
| K2CO3 | 1193[b] | 8.4 | –2.432 | 3.70 |
| K2CO3 | 1203[a] | 8.3 | –2.444 | 3.60 |
| Na2CO3 | 1153 | 8.7 | –2.310 | 4.90 |
| Na2CO3 | 1163[b] | 8.6 | –2.319 | 4.80 |
| Na2CO3 | 1173[a] | 8.5 | –2.328 | 4.70 |
| Na2CO3 (CO2) | 1153 | 8.7 | –2.173 | 6.71 |
| Na2CO3 (CO2) | 1173 | 8.5 | –2.163 | 6.87 |
| Na2CO3 (CO2) | 1173 | 8.5 | –2.175 | 6.68 |
| Na2CO3(CO2) | 1173 | 8.5 | –2.182 | 6.58 |
| Na2CO3(CO2) | 1193 | 8.4 | –2.187 | 6.50 |
| Na2CO3(CO2) | 1193 | 8.4 | –2.187 | 6.50 |
| Na2CO3(CO2) | 1213[a] | 8.2 | –2.214 | 6.11 |
| Na2CO3(CO2) | 1213[b] | 8.2 | –2.214 | 6.11 |
| Li2CO3 | 1013 | 9.9 | –1.848 | 14.20 |
| Li2CO3 | 1023 | 9.8 | –1.866 | 13.60 |
| Li2CO3 | 1033 | 9.7 | –1.879 | 13.20 |
| Li2CO3 | 1043 | 9.6 | –1.889 | 12.90 |
| Li2CO3 | 1053 | 9.5 | –1.903 | 12.50 |
| Li2CO3 | 1063[b] | 9.4 | –1.907 | 12.40 |
| Li2CO3 | 1073[a] | 9.3 | –1.917 | 12.10 |
Viscosity measurements of Na2CO3, K2CO3, and Li2CO3 melts [fromMerck, purity >99.9% (Na2CO3), ≥99.5% (K2CO3), and >99.0% (Li2CO3)] were next carried out in the temperature range ofl013-1213K applying a shear rate of 20 sr1. The results are reported in Table 2 and shown in Figure 4 as a function of reciprocal absolute temperature. The measured viscosities range between 3.6 and 14.2 mPa- s, and are reported in Figure 4 together with a comparison with the results of Sato et al. (1999) and Janz and Saegusa (1963). Moreover, our samples show absolute viscosities that are in good agreement with those reported in Sato et al. (1999) and Vorob’ev et al. (1966) (see Fig. 3 in Sato et al. 1999), while those measured by Janz and Saegusa (1963) are systematically lower than those reported here and in Sato etal. (1999).
Our data exhibit Arrhenian behavior over the investigated interval of temperature, in accordance with the findings of Janz and Saegusa (1963) and Sato et al. (1999).
As data points follow an Arrhenian behavior, the measured viscosities can be parameterized according to the following Arrhenian viscosity-temperature relationship:
where r| is the viscosity in Pa˙s and T the absolute temperature. The fitting parameters are reported in Table 3. Using this equation it is also possible to calculate the activation energy of viscous flow [Ea, Table 3].
Fit parameters of experimental data according to Equation 1
| A | B | Ionic radius (pm)[a] | Ea (kJ/mol) | |
|---|---|---|---|---|
| K2CO3 | -3.83 (0.02) | 1671 (21) | 151 | 32.0 (0.4) |
| Na2CO3 | -3.37(0.01) | 1224(13) | 102 | 23.4 (0.3) |
| Li2CO3 | -3.05 (0.08) | 1216(83) | 59 | 23.4(1.6) |
Calculated activation energies (27,28, and 35 kJ/mol for K-, Na-, and Li-carbonate, respectively) are comparable to those reported by Sato et al. (1999) and other molten salts (Fig. 6 in Sato et al. 1999), while a large discrepancy can be observed with data reported by Janz and Saegusa (1963). Indeed, data from Janz and Saegusa (1963) show systematically higher activation energy of 70.71, 107.53, and 121.75 kJ/mol for Li-, Na-, and K-carbonate, respectively.
In the case of molten salts (where measurement of very low viscosity is possible) the A parameter of Equation 1 (the extrapolated viscosity at infinite temperature) could be linked to a minimum relaxation time (for gases and liquids) via the
Maxwell relation (η=G∞.τs; where G∞. is the shear module at infinite high frequencies and xs is the shear relaxation time). The physical interpretation of the minimum relaxation time is that of an average period of vibration of the liquid quasi-lattice of about 10–13.5 s. This minimum relaxation time (in a first approximation) is supposed to be independent from the composition of a liquid (Schmidtke et al. 2015). Angell et al. (1989) found extrapolated viscosity data at infinite temperature for a wide range of chemical compositions (from oxides, silicates, metals to molten salts) varying only between -5 and -3 log η(Pa.s). Further, Russell et al. (2003) confirmed these values based on silicate melt compositions.
Values of the A parameter (Table 3) determined in this study vary between -3.8 and -3.1 log η(Pa.s); well within the values given by Angell et al. (1989). On the contrary, the measured viscosities from Janz and Saegusa (1963) extrapolate to a range between -7.9 and -5.8 log η (Pa.s).
Therefore the results from Janz and Saegusa (1963) are not in agreement with the implications of Maxwell theory and the experimental findings of Angell et al. (1989) and seem to be incorrect.
However, in contrast with the results presented in Sato et al. (1999), our viscosity values for Li2CO3 are much higher (~3 times) than for Na2CO3. This is therefore in agreement with the theoretical behavior expected for lithium as function of the dimensions of its ionic radius (Sato et al. 1999).
Moreover, in Figure 5 we plot the calculated viscosities for Na2CO3, K2CO3, and Li2CO3 melts at 1183 K (104/T = 8.5) as function of the ionic radius of cations.
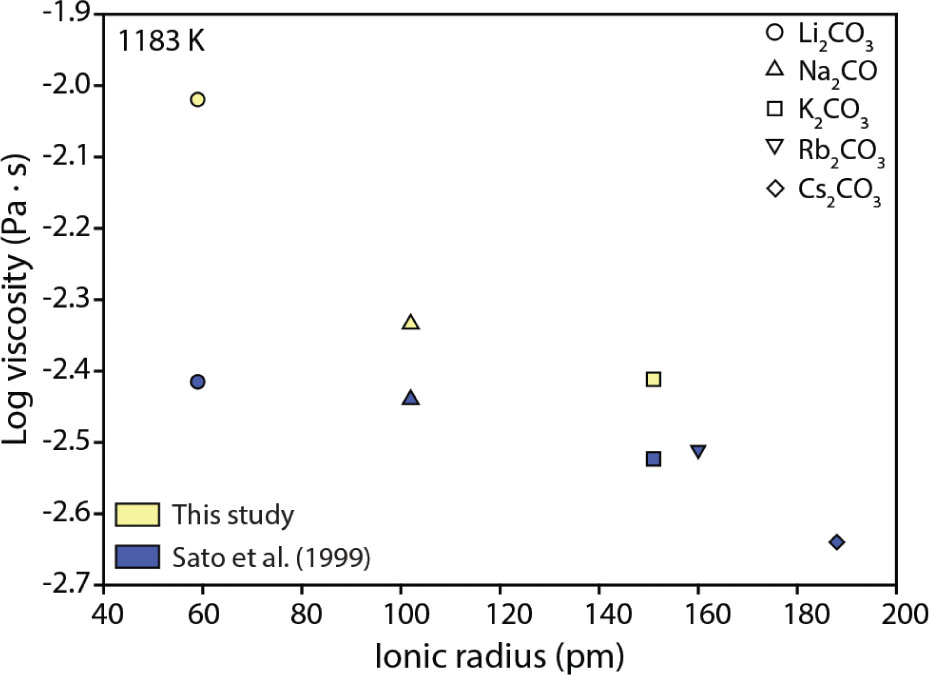
Calculated viscosities for Na2CO3, K2CO3, and Li2CO3 melts at 1183 K (104/T = 8.5) respect to the ionic radius together with data reported in Sato et al. (1999). The viscosity was calculated using an Arrhenian viscosity–temperature relationship (Eq. 1) and fit parameters reported in Table 3. The error is smaller than the symbol size.
In doing so, contrary to how reported in Sato et al. (1999) we clearly show that there is a dependency of viscosity on ionic radius of the cation (i.e., viscosity of Li2CO3 higher than Na2CO3) and confirm that the theoretical predictions of Sato et al. (1999) were correct.
Finally, we investigated the effect of reduced oxygen fugacity (pure CO2 at 1 bar pressure) on melt viscosity for the sodium carbonate melt (Table 2). Before starting the viscosity measurements, the furnace has been previously flushed with a constant CO2 flow for two hours. Then the target temperature was reached and the viscosity measurements were performed. Figure 4 shows that, under CO2 atmosphere, higher viscosity values were measured with respect to those obtained under oxidized conditions (e.g., at 1173 K,ηairis4.7 mPa.s while r|C02 is 6.9 mPa.s). This discrepancy in the two values show that reduced conditions have a weak effect on the viscosity of alkali carbonate melts.
Implications
Results presented in this study demonstrate the high value of this new adapted rheometric setup in performing high-accuracy and high-precision measurements, with particular emphasis on the rheology of melts at high temperature in general and more significantly for melts that show extremely low viscosity. The importance of accuracy and precision of the measurements is highlighted by the results obtained on Li-carbonate melts that show for the first time a higher viscosity than Na-carbonate in agreement with the theoretically derived viscosity behavior and validate the predictions of the parameterization proposed by Sato et al. (1999). This apparatus now opens future opportunities in expanding the investigated data set to cover the composition range matching the carbonatite melt chemistry variation observed in nature.
Acknowledgments
We acknowledge the support of Advanced Researcher Grant of the European Research council (no. 247076; “EVOKES”). We thank J. Lauger, C. Montanaro, and S. Kolzenburg for useful discussions. We acknowledge one anonymous reviewer that considerably improved this manuscript.
References cited
Angell, C.A., Scamehom, C.A., List, D.J., and Kieffer, J. (1989) Glass forming liquid oxides at the fragile limit of the viscosity-temperature relationship. From Proceedings of XV International Congress on Glass, Leningrad.Search in Google Scholar
Baker, V.R., Komatsu, G., Parker, T.J., Gulick, V.C., Kargel, J.S., and Lewis, J.S. (1992) Channels and valleys on Venus-Preliminary analysis of Magellan data. Journal of Geophysical Research, 97, 13,421-13,444.10.1029/92JE00927Search in Google Scholar
Dingwell, D.B.(1986) Viscosity-temparature relationships in the system Na2Si205- Na4Al205. Geochimica et Cosmochimica Acta, 50, 1261-1265.10.1016/0016-7037(86)90409-6Search in Google Scholar
Gaillard, F., Malki, M., Iacono-Marziano, G., Pichavant, M., and Scaillet, B. (2008) Carbonatite melts and electrical conductivity in the asthenosphere. Science, 270, 1363-1365.10.1126/science.1164446Search in Google Scholar
Hammouda, T., and Laporte, D. (2000) Ultrafast mantle impregnation by carbonatite melts. Geology, 28, 283-285.10.1130/0091-7613(2000)28<283:UMIBCM>2.0.CO;2Search in Google Scholar
Janz, G. J., and Saegusa, F. (1963) Molten carbonates as electrolytes: viscosity ad transport properties. Journal of the Electrochemical Society, 452-456.10.1149/1.2425785Search in Google Scholar
Jones, A.P., Genge, M., andCarmody, L. (2013) Carbonate melts andcarbonatites. Reviews in Mineralogy and Geochemistry, 75, 289-322.10.2138/rmg.2013.75.10Search in Google Scholar
Kargel, J.S., Kirk, R.L., Fegley, B., and Treiman, A.H. (1994) Carbonate-sulfate volcanism on Venus? Icarus, 112, 219-252.10.1006/icar.1994.1179Search in Google Scholar
Koishi, T., Kawase, S., Tamaki, S., and Ebisuzaki, T. (2000) Computer simulation of molten Li2CO3-K2CO3 mixtures. Journal of the Physics Society Japan, 69, 3291-3296.10.1143/JPSJ.69.3291Search in Google Scholar
Lauger, J., and Stettin, H. (2010) Differences between stress and strain control in the non-linear behavior of complex fluids. Rheologica Acta, 49, 909-930.10.1007/s00397-010-0450-0Search in Google Scholar
Liu, Q., Tenner, T. J., and Lange, R.A. (2007) Do carbonate liquids become denser than silicate liquids at pressure? Constraints from the fusion curve of K2CO3 to 3.2 GPa. Contributions to Mineralogy and Petrology, 153, 55-66.10.1007/s00410-006-0134-zSearch in Google Scholar
Norton, G., and Pinkerton, H. (1997) Rheological properties of natrocarbonatite lavas from Oldoinyo Lengai, Tanzania. European Journal of Mechanics-B/ Fluids, 9, 351-364.10.1127/ejm/9/2/0351Search in Google Scholar
Reeve, R.W., and Tseung, A.C.C. (1996) Factors affecting the dissolution and reduction of oxygen in molten carbonate electrolytes. Part 1: Effect of temperature and alkali carbonate mixture. Journal of Electroanalytical Chemistry, 403, 69-83.10.1016/0022-0728(95)04190-7Search in Google Scholar
Russell, J.K., Giordano, D., and Dingwell, D.B. (2003) High-temperature limits on viscosity of non-Arrhenian silicate melts. American Mineralogist, 88, 1390-1394.10.2138/am-2003-8-924Search in Google Scholar
Russell, J.K., Porritt, L.A., Lavallée, Y, and Dmgwell, D.B. (2012) Kimberlite ascent by assimilation-fuelled buoyancy. Nature, 481, 352-6.10.1038/nature10740Search in Google Scholar PubMed
Sato, Y, Yaegashi, S., Kijima, T., Takeuchi, E., Taman, K., Hasebe, M., Hoshi. M., and Yamamura, T. (1999) Viscosities of molten alkali carbonates. Netsu Bussei, 13, 156-161.10.2963/jjtp.13.156Search in Google Scholar
Schmidtke, B., Hofmann, M., Lichtinger, A., and Rössler, E.A. (2015). Temperature dependence of the segmental relaxation time of polymers revisited. Macromolecules, 48, 3005-3013, doi:10.1021/acs.macromol.5b00204.10.1021/acs.macromol.5b00204">10.1021/acs.macromol.5b00204Search in Google Scholar
Shannon, R.D., and Prewit, C.T. (1969) Effective ionic radii in oxides and fluorides. Acta Crystallographica, B25, 925-946.10.1107/S0567740869003220Search in Google Scholar
Treiman, A.H. (1995) Ca-rich carbonate melts: a regular-solution model, with applications to carbonatite magma + vapor equilibria and carbonate lavas on Venus. American Mineralogist, 80, 115-130.10.2138/am-1995-1-212Search in Google Scholar
Vorob’ev, G.V, Pal’guev, S.F., and Karpachev, S.V (1966) In Electrochemistry of Molten and Solid Electrolytes, Vol. 3, A.N. Baraboshkin, p. 33. Consultants Bureau, New York; Trans. (Trudy) No. 6; Inst. Electrochem. Urals Acad. Sci. (1965).Search in Google Scholar
Yoshiba, F, Morita, H., Yoshikawa, M., Mugikura, Y, Izaki, Y, Watanabe, T.: Komoda, M., Masuda, Y, and Zaima, N. (2004) Improvement of electricity generating performance and life expectancy of MCFC stack by applying Li/ Na carbonate electrolyte test results and analysis of 0.44m2/10kW- and 1.03 m2/10 kW-class stack. Journal of Power Sources, 128, 152-164.10.1016/j.jpowsour.2003.10.011Search in Google Scholar
© 2016 by Walter de Gruyter Berlin/Boston
This work is licensed under the Creative Commons Attribution-NonCommercial-NoDerivatives 3.0 License.
Articles in the same Issue
- Research Article
- Glass structure, melt structure, and dynamics: Some concepts for petrology
- Research Article
- The validity of plagioclase-melt geothermometry for degassing-driven magma crystallization
- Research Article
- Outlooks in Earth and Planetary Materials: Chemistry and Mineralogy of Earth’s Mantle: A petrological assessment of diamond as a recorder of the mantle nitrogen cycle
- Research Article
- Special Collection: Advances in Ultrahigh-Pressure Metamorphism: Contrasting P-T paths within the Barchi-Kol UHP terrain (Kokchetav Complex): Implications for subduction and exhumation of continental crust
- Research Article
- Special Collection: New Advances in Subduction Zone Magma Genesis: Experimental formation of pyroxenite veins by reactions between olivine and Si, Al, Ca, Na, and Cl-rich fluids at 800 °C and 800 MPa: Implications for fluid metasomatism in the mantle wedge
- Review
- Special Collection: Olivine: Rates and styles of planetary cooling on Earth, Moon, Mars, and Vesta, using new models for oxygen fugacity, ferric-ferrous ratios, olivine-liquid Fe-Mg exchange, and mantle potential temperature
- Research Article
- Special Collection: Rates and Depths of Magma Ascent on Earth: Amphibole thermometers and barometers for igneous systems and some implications for eruption mechanisms of felsic magmas at arc volcanoes
- Research Article
- Special Collection: Rates and Depths of Magma Ascent on Earth: Degassing of Hydrous Trachytic Campi Flegrei and Phonolitic Vesuvius Melts: Experimental Limitations and Chances to Study Homogeneous Bubble Nucleation
- Research Article
- Special Collection: Water in Nominally Hydrous and Anhydrous Minerals: Crystal/melt partitioning of water and other volatiles during the near-solidus melting of mantle peridotite: Comparisons with non-volatile incompatible elements and implications for the generation of intraplate magmatism
- Research Article
- Carbon mineral ecology: Predicting the undiscovered minerals of carbon
- Research Article
- Chromium, vanadium, and titanium valence systematics in Solar System pyroxene as a recorder of oxygen fugacity, planetary provenance, and processes
- Research Article
- Iron-titanium oxyhydroxides as water carriers in the Earth’s deep mantle
- Research Article
- Radiation damage in biotite mica by accelerated α-particles: A synchrotron microfocus X-ray diffraction and X-ray absorption spectroscopy study
- Research Article
- Models for the estimation of Fe3+/Fetot ratio in terrestrial and extraterrestrial alkali- and iron-rich silicate glasses using Raman spectroscopy
- Research Article
- An advanced rotational rheometer system for extremely fluid liquids up to 1273 K and applications to alkali carbonate melts
- Research Article
- Experimental temperature cycling as a powerful tool to enlarge melt pools and crystals at magma storage conditions
- Research Article
- Exploring the potential of Raman spectroscopy for crystallochemical analyses of complex hydrous silicates: II. Tourmalines
- Research Article
- Crystal structure of a new compound, CuZnCl(OH)3, isostructural with botallackite
- Research Article
- Elastic wave velocities in polycrystalline Mg3Al2Si3O12-pyrope garnet to 24 GPa and 1300 K
- Research Article
- Presentation of the Mineralogical Society of America Award for 2015 to Nicholas J. Tosca
- Research Article
- Acceptance of the Mineralogical Society of America Award for 2015
- Research Article
- Presentation of the 2015 Roebling Medal of the Mineralogical Society of America to Rodney C. Ewing
- Research Article
- Acceptance of the 2015 Roebling Medal of the Mineralogical Society of America
- Research Article
- Presentation of the Distinguished Public Service Award of the Mineralogical Society of America for 2015 to J. Alexander Speer
- Research Article
- Acceptance of the 2015 Mineralogical Society of America Distinguished Public Service Award
- Research Article
- Presentation of the Dana Medal of the Mineralogical Society of America for 2016 to Patrick Cordier
- Research Article
- Acceptance of the Dana Medal of the Mineralogical Society of America for 2016
- Book Review
- New Mineral Names*†
- Book Review
- Book Review