Oxygen evolving reactions catalyzed by different manganese oxides: the role of oxidation state and specific surface area
-
Stefanie Becker


Abstract
A set of the four manganese oxide powders α-MnO2 (hollandite), δ-MnO2 (birnessite), Mn2O3 (bixbyite), and Mn3O4 (hausmannite) have been synthesized in a phase-pure form and tested as catalysts in three different oxygen evolution reactions (OER): electrochemical OER in KOH (1 mol L−1), chemical OER using aqueous cerium ammonium nitrate, and H2O2 decomposition. The trends in electrochemical (hollandite >> bixbyite > birnessite > hausmannite) and chemical OER (hollandite > birnessite > bixbyite > hausmannite) are different, which can be explained by differences in electric conductivity. H2O2 decomposition and chemical OER, on the other hand, showed the same trend and even a linear correlation of their initial OER rates. A linear correlation between the catalytic performance and the manganese oxidation state of the catalysts was observed. Another trend was observed related to the specific surface area, highlighting the importance of these properties for the OER. Altogether, hollandite was found to be the best performing catalyst in this study due to a combination of the high manganese oxidation state and a large specific surface area. Likely, due to a sufficient electrical conductivity, this intrinsically high OER performance is also found to some extent in electrocatalysis for this specific example.
1 Introduction
Oxygen evolving reactions are of high interest, because the anodic oxidation of water to oxygen is the potential-limiting step in the water electrolysis reaction [1, 2]. Thus, there is a need of highly active and stable catalysts which lower the overpotential of the electrochemical oxygen evolution reaction (OER) [3], [4], [5], [6], [7], [8]. Inspired by nature’s photosystem II [9], [10], [11], manganese oxides are discussed as possible OER catalysts in alkaline electrolytes [12], [13], [14], [15], [16], [17], [18], [19], [20], [21]. Various Mn x O y compounds and polymorphs with manganese oxidations states ranging from +II to +VII are known [22]. This structural and compositional diversity of manganese oxides makes them an interesting field to study structure/composition-activity correlations in OER, and different factors have been highlighted in the literature as being responsible for a high catalytic performance; among these are the manganese oxidation state [23], the exposed surface area [24], the crystal structure [25], [26], [27], [28], the electrical conductivity [29], lattice strain [30], oxygen vacancies [31, 32], or the presence of specific sites or building units such as under-coordinated surface sites [33], µ-oxo bridges [34, 35] or pseudo-cubanes [33] A recent comprehensive review has been presented by Kurz and colleagues [12]. In two studies we have recently highlighted the importance of the particle morphology in the electrical conductivity of cryptomelane catalysts [29] and discussed the challenges of manganese oxide powder catalysts [36]. Samples of the α-MnO2 phase were identified as the most promising candidates.
The very different catalytic performance of the manganese oxides may be due to the in situ change of a well-defined pre-catalyst, especially its oxidation at high anodic potentials or its surface hydroxylation in contact with the electrolyte [21, 34, 37, 38]. Also, differences in test setups and screening protocols in different laboratories can make comparisons of results unreliable [39]. In particular, there are problems related to electrical conductivity that affect the activity of powder catalysts [36] more than that of nanoparticles [14, 15, 40, 41] or thin films [30, 42, 43] on conductive substrates. The porosity, the exposed surface area or the particle size or shape may vary between samples of the same compound that were synthesized via different routes or subjected to pretreatment leading to a modified performance of the manganese oxides [29].
In this study, we present a comparative study of a set of four manganese oxide catalysts that were all synthesized from the same precursor material by application of different thermal and chemical treatments. The samples comprise hollandite, α-MnO2 with a tunnel structure, birnessite, δ-MnO2 with a layered structure and K inclusions, bixbyite, α-Mn2O3 with a dense 3D orthorhombic structure, and hausmannite, Mn3O4 with a spinel structure. We compare their catalytic activity in different oxygen evolving reactions [44]. In addition to the electrochemical OER also a chemical OER using Ce3+ as a sacrificial oxidant [45, 46] and OER by decomposition of H2O2 were investigated. The latter reaction is of relevance for Fenton-like processes or bleaching reactions [47], [48], [49], but can also be related to water oxidation, where a hydro-peroxide surface species is proposed to react in the last step of oxygen evolution [50]. The effect of the manganese oxidation state and of the specific surface area on the powder catalysts’ performance and the variations in the trends observed for the three reactions are discussed.
2 Results
2.1 Synthesis of the precursor
The precursor was prepared by precipitation [51], [52], [53] using a semi-automatized synthesis work station at a temperature of 50 °C maintaining a constant pH of 11, by computer-controlled co-dosing of the metal salt solution and the precipitating agent. Figure 1 shows the pH oscillations around the set point during the simultaneous dosing of the two solutions and the featureless pH evolution during 1 h of additional precipitate ageing.
![Figure 1:
(a) Precipitation process of 150 g 0.5 mol L−1 MnSO4 with 0.5 mol L−1 KOH solution at pH 11 and 50 °C. The suspension was aged for 1 h. (b) XRD pattern of the washed and dried precipitate compared to that of manganese spinel (Mn3O4) [54] (blue bars). (c) Thermogravimetric analysis of the precursor up to 1000 °C in synthetic air.](/document/doi/10.1515/znb-2022-0009/asset/graphic/j_znb-2022-0009_fig_001.jpg)
(a) Precipitation process of 150 g 0.5 mol L−1 MnSO4 with 0.5 mol L−1 KOH solution at pH 11 and 50 °C. The suspension was aged for 1 h. (b) XRD pattern of the washed and dried precipitate compared to that of manganese spinel (Mn3O4) [54] (blue bars). (c) Thermogravimetric analysis of the precursor up to 1000 °C in synthetic air.
The XRD pattern in Figure 1b corresponds to a precursor material whose crystalline fraction exclusively consists of manganese oxide spinel, hausmannite Mn3O4, which formed due to the oxidation of Mn2+ with oxygen from air at the high pH of the synthesis. This material served for the preparation of well-defined manganese oxide phases by thermal and chemical treatments and was further characterized by electron microscopy and nitrogen physisorption (Figure 2). The SEM image (Figure 2a) shows a sponge-like aggregate with an estimated average primary particle size of approximately 130 nm. The TEM image (Figure 2b) shows a similar particle size distribution of 113 ± 34 nm. The nitrogen physisorption isotherms and the BJH pore size distribution of the precursor material are shown in Figure 2c. From the isotherm, the BET surface area was determined from the linear range between 0.1 and 0.3 p p0−1 to be 20 m2 g−1. The pore size distribution, determined using the desorption branch, shows the mesoporosity of the sample (Figure 2d).
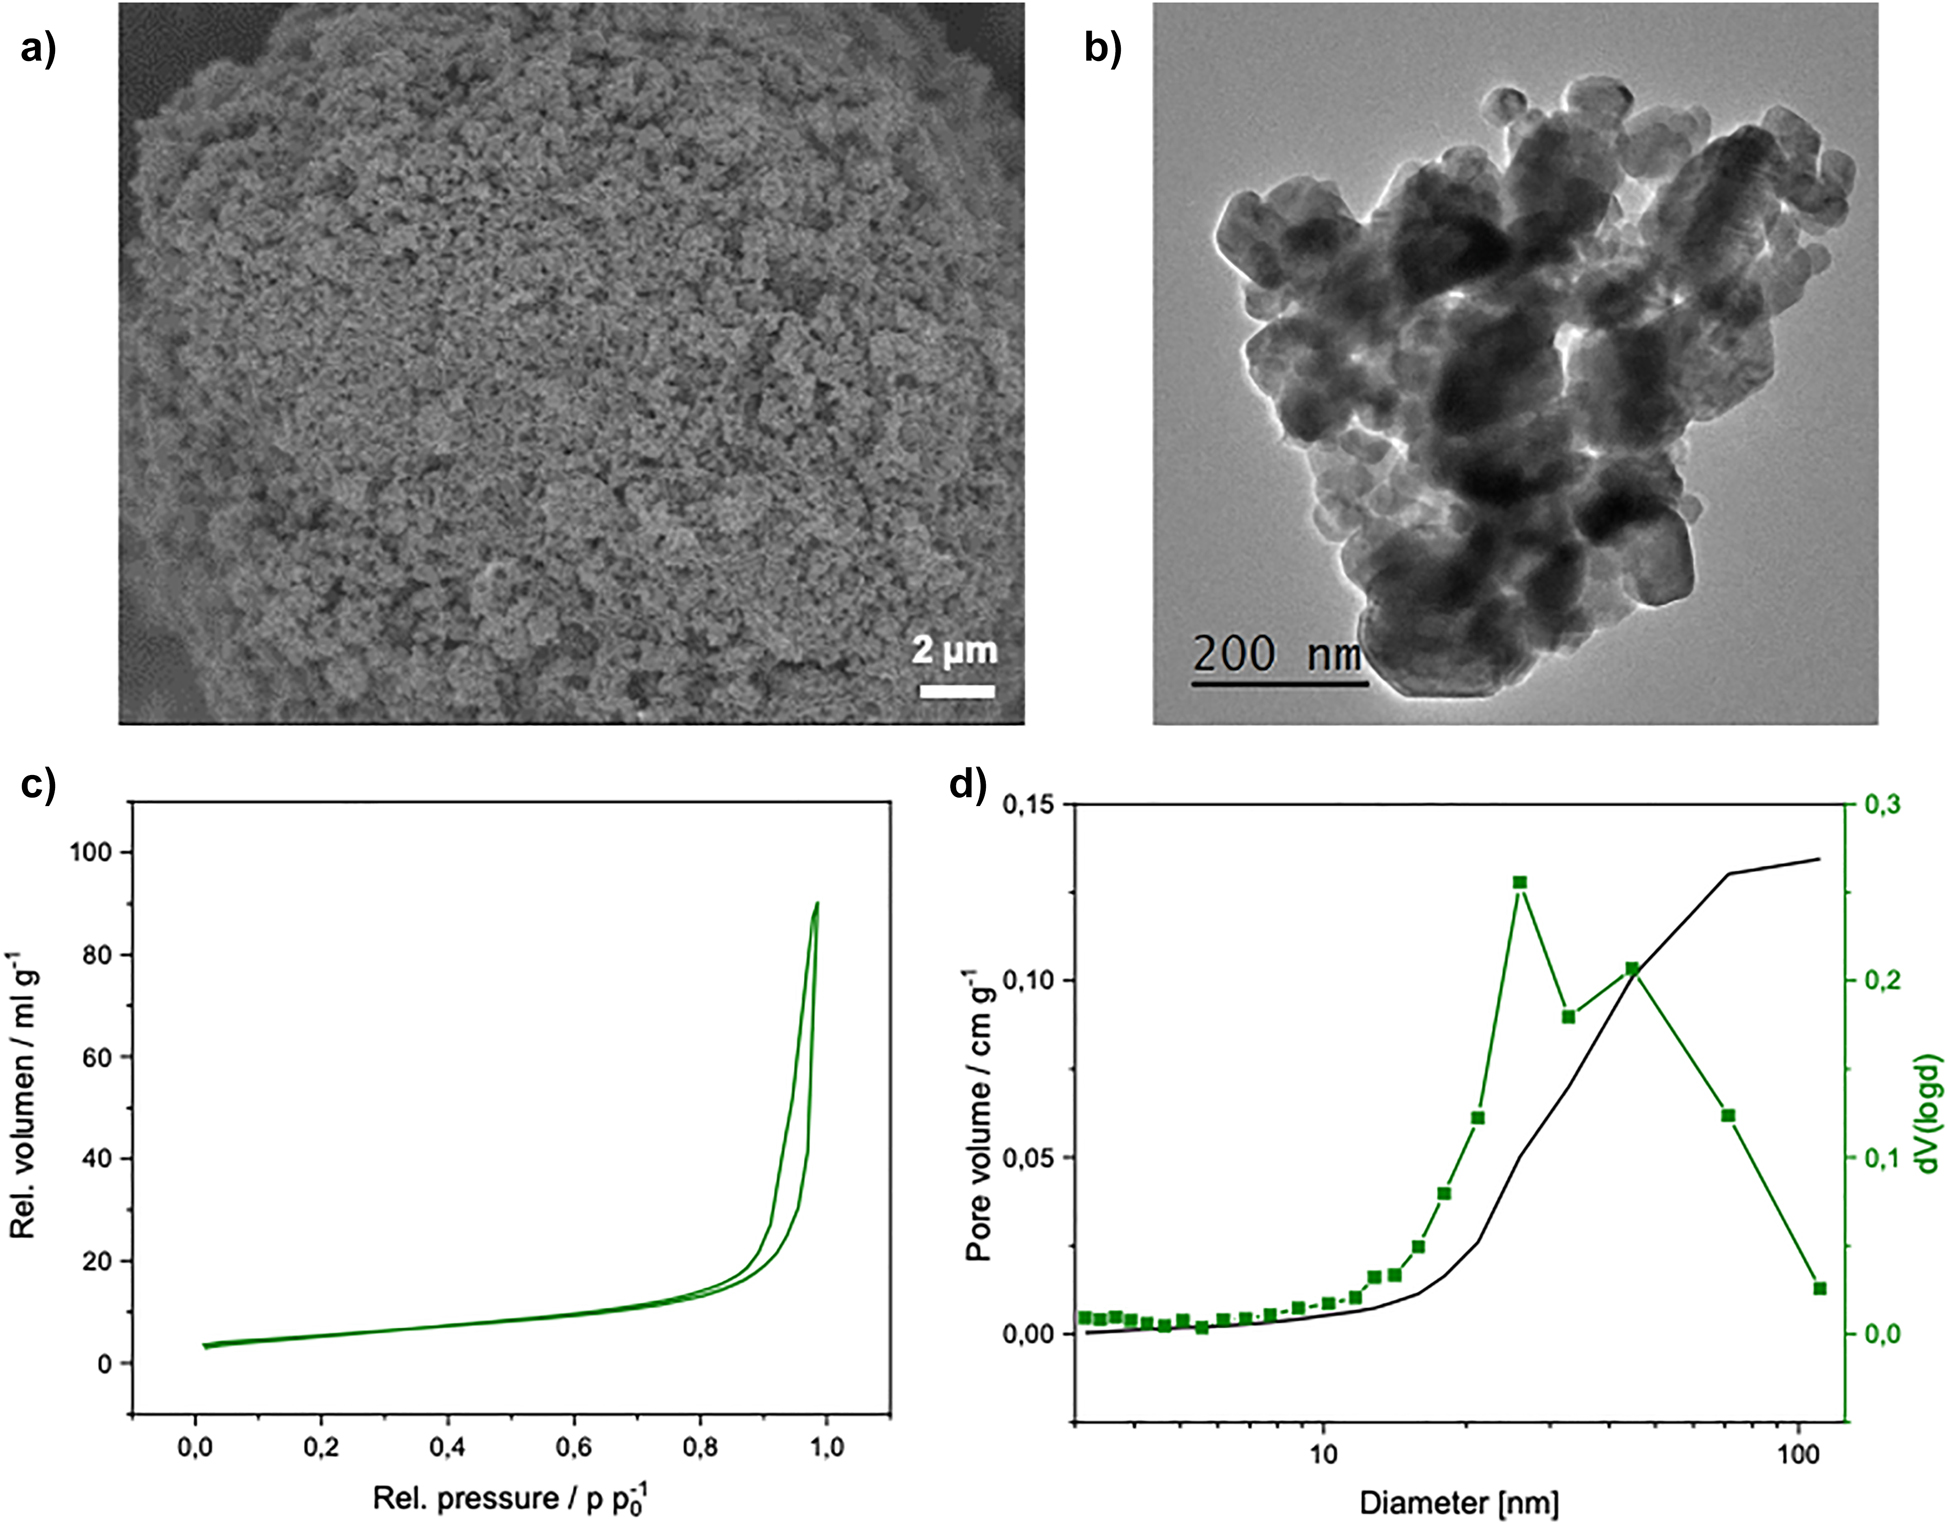
(a) SEM and (b) TEM images, and (c) N2-physisorption isotherm of the dried and washed precipitate with (d) the pore size distribution calculated using the BJH approach.
2.2 Synthesis and characterization of the different manganese oxides
The thermogravimetric measurement of the precursor material shown in Figure 1c imply two reactions that change the Mn:O stoichiometry at around 600 and 900 °C by consumption or release of oxygen. According to the literature, these can be assigned to the formation of Mn2O3 and Mn3O4 [51], which was confirmed by ex-situ XRD after calcination at 200, 400, 600, 800, and 1000 °C as shown in Figure 3. The crystalline Mn3O4 in the precursor is stable up to 400 °C and the smaller weight loss at 380 °C in the TGA curve cannot be assigned to a clear change in the XRD patterns. At 600 °C first reflection of the evolving Mn2O3 phase can be seen. The increase in weight indicated the incorporation of oxygen from the gas phase when this phase is formed due to the lower average oxidation state than +III in the precursor as indicated by the reflections of the Mn2+/Mn3+ spinel in the XRD pattern. However, the sample weight at 600 °C, at which stage all moisture is expected to be evaporated from the sample, is still higher than that at 1000 °C, where stoichiometric Mn3O4 can be assumed. This suggests that an additional amorphous phase with higher oxidation state than hausmannite was present in the precursor.

Powder XRD patterns of the precursor material after calcination at different temperatures in air. The blue reference patterns refer to Mn3O4 and the green one to Mn2O3.
As suggested by the TGA results and confirmed in Figure 3, calcination temperatures of 800 and 1000 °C yield phase-pure Mn2O3 and Mn3O4, which were used for the comparative catalytic study. In order to convert the precursor into two more phase-pure forms of manganese oxides, also hydrothermal post-treatment and acid digestion were applied. Layered manganese oxide, birnessite, δ-MnO2 or more precisely (K0.5)(Mn4+,Mn3+)2O4·1.5H2O, was synthesized in a hydrothermal reactor at pH 13 at 115 °C, based on the report of Giovanoli et al. [55]. Finally, hollandite, α-MnO2, was formed from the bixbyite sample in sulfuric acid under reflux [56, 57]. An overview of the resulting compounds and the major synthesis parameters are shown in Figure 4a.
![Figure 4:
(a) Schematic overview of the synthesis routes of the individual catalysts, Mn3O4 (haumannite), Mn2O3 (bixbyite), K0.5Mn2O4·1.5H2O (birnessite) and α-MnO2 (hollandite) from the same precipitated precursor material. (b) XRD powder patterns of the resulting catalysts compared to literature patterns of birnessite [58], hollandite [56], bixbyite [59] and hausmannite [60].](/document/doi/10.1515/znb-2022-0009/asset/graphic/j_znb-2022-0009_fig_004.jpg)
(a) Schematic overview of the synthesis routes of the individual catalysts, Mn3O4 (haumannite), Mn2O3 (bixbyite), K0.5Mn2O4·1.5H2O (birnessite) and α-MnO2 (hollandite) from the same precipitated precursor material. (b) XRD powder patterns of the resulting catalysts compared to literature patterns of birnessite [58], hollandite [56], bixbyite [59] and hausmannite [60].
The selected synthesis routes lead to the desired phase-pure samples of four manganese oxide compounds, as was confirmed by XRD shown in Figure 4b. The exposed specific surface areas of the manganese oxide catalysts were determined by nitrogen physisorption and were found to vary strongly in the range between 1 and 60 m2 g−1 (Table 1). The adsorption/desorption isotherms are shown in Figure 5.
Specific surface area determined by N2 physisorption and using the BET method, and experimental oxidation states of Mn determined by TPR of the different manganese oxide catalysts in this study that are compared to expected (+2.67 for MnIIMnIII2O4 and +3 for MnIII2O3) and literature values in parentheses. The error of this method of oxidation state determination is estimated to be ±0.1.
| Manganese oxide catalyst | BET surface area/m2 g−1 | Experimental oxidation state of Mn (±0.1) | Current density at 1.8 V/mA cm−2 | Initial rate in CAN test/μmol g−1 h−1 | Initial rate in H2O2 decomp./mmol g−1 h−1 |
|---|---|---|---|---|---|
| Hausmannite | 1 | 2.5 (2.7) | 1.49 | 110 | 2.5 |
| Bixbyite | 9 | 3.0 (3.0) | 0.53 | 460 | 365 |
| Birnessite | 56 | 3.5 (3.5–4.0 [61]) | 1.00 | 970 | 585 |
| Hollandite | 58 | 3.8 (3.7–3.9 [62]) | 3.30 | 1420 | 965 |

Isotherms of nitrogen adsorption and desorption of hausmannite, bixbyite, birnessite and hollandite (offset for clarity).
The average particle sizes were estimated based on SEM images and found to be in the mm-range for hausmannite (Figure 6a and e), and around 200 nm for bixbyite (Figure 6b and f). Hollandite and birnessite show large aggregates consisting of much smaller primary particles (Figure 6c and d), which can be described as needle- and platelet-shaped with longer dimensions around 500 nm in TEM images (Figure 6g and h) in accordance with the tunneled and layered structures. The smaller dimensions were found to be in the lower-nm range. Electron microscopy investigations confirmed the larger, more isotropic and sintered particle morphology of the hausmannite and bixbyite samples (Figure 6e and f). Clearly, the low surface area and large particles of these latter catalyst can be attributed to the high temperature route of their formation, while the wet low-temperature routes yield samples with smaller particles and higher specific surface area.

SEM and TEM images of the catalysts hausmannite (a) and (e), bixbyite (b) and (f), hollandite (c) and (g), and birnessite (d) and (h).
To gain experimental information on the average oxidation state, temperature-programmed reduction (TPR) experiments were performed with 5% H2 in argon up to 1000 °C (Figure 7a). The final material after TPR turned out to be MnO in all cases (Figure 7b) in accordance with the sequence of reductions of tetravalent manganese oxide: MnO2 → Mn2O3 → Mn3O4 → MnO. To estimate an average oxidation number, the TPR signal was integrated and related to the calibrated hydrogen consumption. The results agree with the expected values for hausmannite and bixbyite and to those reported in the literature for α-MnO2 and δ-MnO2 (Table 1).
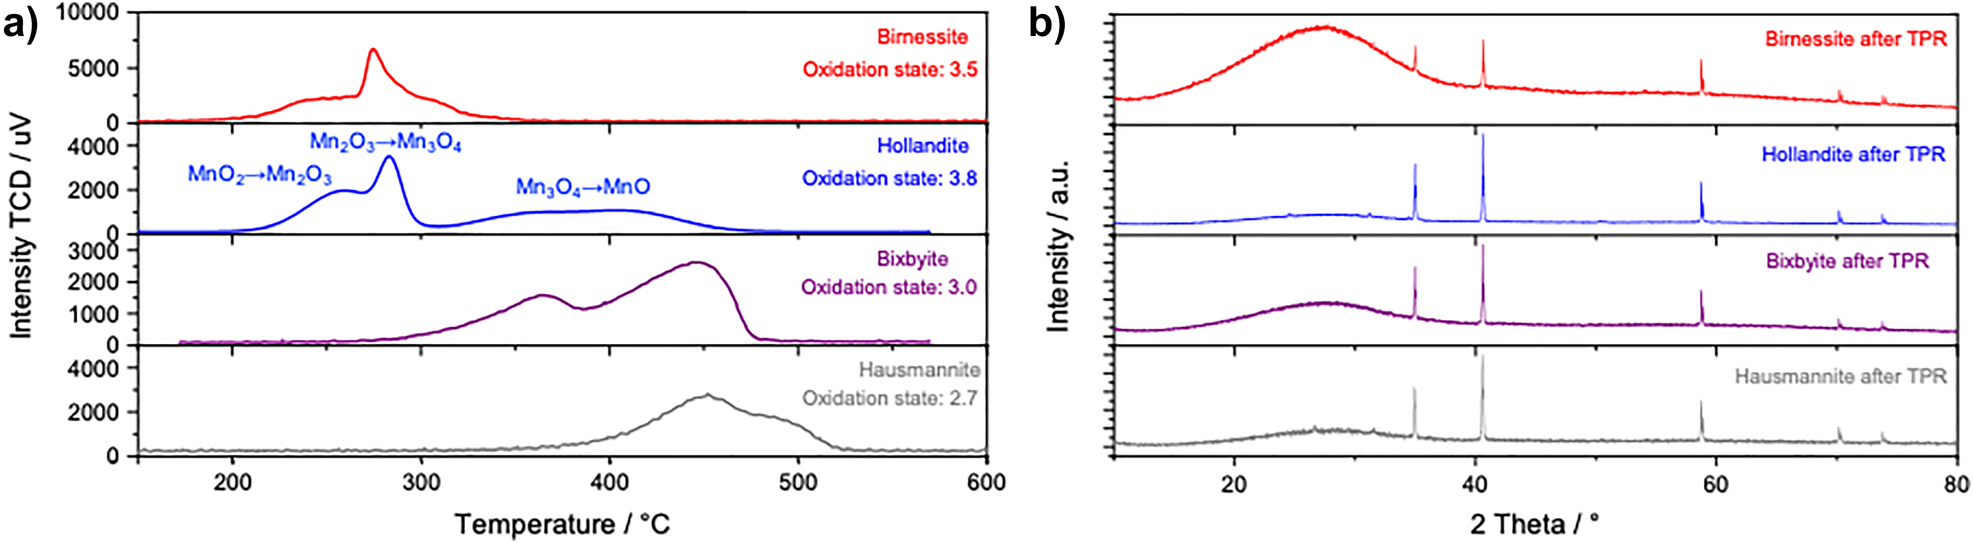
(a) TPR profiles of manganese oxide catalysts measured by a thermal conductivity detector (TCD). (b) Powder XRD patterns of the four catalysts and the precursor material (lowermost panel) after the TPR experiments. All sharp reflections are assigned to MnO. The broad background modulation between 20 and 35° 2θ is caused by incomplete removal of the quartz wool used to keep the powder in place in the TPR reactor.
An XPS analysis of the Mn2p and the Mn3s core level signals was carried out to probe the catalyst’s surfaces. In the Mn3s region, the spin-energy separation (ΔE), as well as the shape of the Mn2p lines provide information on the Mn oxidation states. However, only small differences were found for the Mn2p region. As can be seen in Figure 8a, the Mn2p3/2 peaks of hollandite and birnessite show shoulders and a narrower line shape, which is in line with the observations made by Biesinger et al. [63]. The shoulder at higher binding energies has previously been ascribed to MnIV oxides [64]. The shoulder at lower binding energies can be assigned to MnIII oxides [63], which can be found at the surface of high-valent transition manganese oxides.

(a) Mn2p and (b) Mn3s core level XP spectra of the manganese oxide catalysts.
More detailed information can be gained from the Mn3s region (Figure 8b). Castro and Polozonetti presented detailed values for ΔE and assigned them to specific oxidation states [65]. Hollandite and birnessite show energy separations of 4.8 (±0.1) eV typical for MnIV oxides. The lower valency of manganese in hausmannite and bixbyite leads to values of 5.4 (±0.1) and 5.5 (±0.1) eV, respectively. Values around 6.1 eV are typical for a pure MnII oxide [64, 65]. While is it difficult to extract quantitative oxidation states from XPS, the two groups of samples with lower (hausmannite and bixbyite) and higher oxidation states (birnessite and hollandite) can be clearly identified. The trend in oxidation state determined by TPR for the bulk, is thus also reflected in the spectral XPS features of the different compounds, and maintained at the surface.
2.3 Oxygen evolution by electrochemical water oxidation
The electrochemical OER performance was tested by linear sweep voltammetry according to the test protocol of the MANGAN project in 1 M KOH, 5 mV s−1 scan rate and 1600 rpm rotation speed (Figure 9). Details can be found in the experimental section and in the literature [29, 36, 66]. In this study, the current density at a potential of 1.8 V versus RHE was used as a performance parameter (Table 1). There is a clear trend in the performance among the four catalysts: hollandite >> bixbyite > birnessite > hausmannite. The best catalyst in this study reaches a value of 3.4 mA at 1.8 V, which still is much lower compared to the best manganese oxide catalysts reported in the literature. The worst case, hausmannite, shows performance in the range expected for the bare glassy carbon electrode [36] and thus can be considered as rather inactive.

(a) Comparison of linear sweep voltammetry (LSV) results in OER of the four manganese oxide catalysts (in 1 M KOH, 5 mV s−1 scan rate and 1600 rpm rotation speed). (b) Tafel slope derived from these voltammograms.
The Tafel slopes of the tested manganese oxides fall in a range between 89 mV dec−1 and 128 mV dec−1. Hausmannite shows no meaningful Tafel slope which indicates that no substantial OER takes place. Birnessite and Bixbyite show values exceeding 100 mV dec−1, indicating that there is no favorable electron transport in the catalyst. The performance trend is also reflected in the resistivity determined by electrochemical impedance spectroscopy at 1.79 V versus RHE shown in Figure 10: hollandite << bixbyite < birnessite << hausmannite.

Nyquist plot obtained from EIS in 1 mol KOH solution on the four manganese oxides recorded at an anodic potential of 1.79 V versus RHE.
2.4 Oxygen evolution by chemical water oxidation
Chemical oxygen evolution using cerium ammonium nitrate (CAN) as a sacrificial oxidant is often used as an indicator for the activity of a catalyst in electrocatalytic water splitting [46, 67]. As an important difference to electrocatalytic systems, in this case the charge carriers do not have to be transferred to the back contact of the electrode, and thus the CAN test activity is supposed to be independent of transport properties such as the electrical resistance of the catalyst. Instead, the reaction happens directly at the surface of the catalyst, which is immersed into the aqueous solution of the single-electron oxidant. However, it should be kept in mind that the reaction conditions are different, regarding, e.g., the pH value, which is strongly alkaline in the electrochemical experiment and slightly acidic in the CAN test.
The course of the oxygen evolution during the CAN test of the four different catalysts is shown in Figure 11. The different manganese oxides show a different performance trend than in the electrochemical OER: hollandite > birnessite > bixbyite > hausmannite. While the hollandite sample still is the best and the hausmannite sample the worst catalyst, birnessite is more active in the CAN test than bixbyite. The relative differences between the four samples seem less pronounced in the CAN test. Table 1 shows the initial oxygen evolution rates of the CAN test.

Oxygen evolution over the different manganese oxides in the CAN test.
2.5 Oxygen evolution by hydrogen peroxide decomposition
Oxygen formation from hydrogen peroxide takes place via a disproportionation/decomposition process. The literature describes manganese oxides as highly active catalysts for this reaction [68], and indeed high oxygen evolution rates are detected as shown in Figure 12. The sequence of catalyst performance is the same as in the CAN test: hollandite > birnessite > bixbyite >> hausmannite, and the initial rates are given in Table 1.

Oxygen evolution initiated by the different manganese oxides in the H2O2 decomposition reaction.
3 Discussion
With the data collected in Table 1, the attempt to correlate the catalytic activities in the different oxygen evolving reactions with the initial average oxidation state and with the exposed specific surface area of the manganese oxide catalyst was made. The relevant plots are shown in Figure 13.

OER activity in electrocatalysis (first line: a, b), in the CAN test (middle line: c, d) and in the H2O2 decomposition (bottom line: e, f) dependent on the manganese oxidation state (left hand column: a, c, e) and on the specific surface area (right hand column, b, d, f).
There is no monotonous trend in the electrochemical OER data owing to the low activity of the birnessite catalyst, while the performance of the other three catalysts follow both the initial oxidation state and the specific surface area (Figure 13a and b). The better performance of the higher oxidation state catalysts is in line with literature reports [67, 69]. Also a positive influence of a high specific surface area is not unexpected although a direct correlation was not always observed if manganese oxide powders were applied in electrocatalysis [29, 36].
In case of the chemical water oxidation in the CAN test, an almost linear correlation of the catalytic performance and the oxidation state is observed and the birnessite catalyst fits nicely to this trend (Figure 13c). Looking at the specific surface area, the trend is monotonous, but deviates clearly from linearity. In particular, the birnessite catalyst performs worse than expected from its high specific surface area, and the bixbyite catalyst is more active than expected, possibly due to a lower and higher oxidation state compared to the hollandite and hausmannite with comparable specific surface area (Figure 13d). These deviations suggest that not the whole surface area is active, but specific minority sites are required, their number being dependent on the surface area. However, high activity in addition requires a proper initial oxidation state of manganese at the surface.
Under the assumption that chemical and electrochemical water oxidation are related to the same active sites, it can be concluded that the electrocatalytic performance of birnessite is limited by a factor that does not play a role in the chemical oxidation, electric conductivity being a likely candidate. While the intrinsic activity of the birnessite surface provides the required activity according to the oxidation state of the near-surface manganese atoms, the electron transport through the catalyst may hinder the electrocatalytic turnover. Under CAN test conditions, the electrons liberated by the oxidation of water are collected directly at the surface by the Ce3+ solution leading to an activity expected for this sample based on the correlation of reaction rate and the oxidation state.
The hydrogen peroxide decomposition reaction is expected to be more facile compared to water oxidation. A hydro-peroxide surface species is assumed to react in the last step of oxygen evolution process. However, this step is not considered to be rate- or potential-limiting. The more facile nature of the reaction is manifested in initial oxygen evolution rates that are higher by three orders of magnitude in the H2O2 decomposition compared to the CAN test. Nevertheless, the trend among the four different manganese oxides is very similar. Again, a correlation close to linearity is observed between performance and initial oxidation state (Figure 13e), and a deviation with higher-than-expected activity for bixbyite and lower for birnessite was found for the trend of reaction rate as related with the specific surface area (Figure 13f).
This leads to a clear linear correlation of the (lower) oxygen evolution rates of the CAN test with those (higher ones) from the H2O2 decomposition (Figure 14), suggesting that the latter can be used as a probe for the water oxidations within this series of catalyst samples. Shevela et al. [70] indeed proposed a peroxidic species as an important intermediate in the oxygen formation from aqueous CAN. The linearity is however by no means a unifying trend as it is known that for example cobalt oxides are better OER catalysts, but inferior in H2O2 decomposition compared to manganese oxides [68]. Further studies are planned to show if for different samples from other metal oxide families also linear correlations can be obtained, and if their slope is element-specific.

Linear correlation of the initial rates in chemical OER and H2O2 decomposition for the four manganese oxide catalysts used in this study.
4 Conclusions
A set of four manganese oxides with different manganese oxidation states and specific surface areas was synthesized by precipitation of a precursor and its thermal and chemical conversion into α-MnO2 (hollandite), δ-MnO2 (birnessite), Mn2O3 (bixbyite), and Mn3O4 (hausmannite). Phase purity was confirmed and the average bulk oxidation states were found to correspond to the nominal values and to be similar for the oxidation states at the surface. The specific surface areas varied over a large range due to the different synthesis protocols. Three different oxygen evolution reactions were catalyzed by the four powders: electrochemical OER, chemical OER and H2O2 decomposition. The different trends observed in electrochemical and chemical OER can be attributed to differences in the electrical conductivity of the catalyst samples. In the two chemical reactions, a linear correlation of the catalyst oxidation state with the catalytic performance was observed, highlighting the importance of this factor. A positive trend with the specific surface area was also observed, but a clear deconvolution was not possible as the samples with low specific surface area were also those with a low oxidation state of the manganese atoms. The initial OER rates in chemical water oxidation and H2O2 decomposition were observed to scale linearly for the investigated manganese oxides. In summary, α-MnO2 was found to be the best performing catalyst in this study due to a combination of high manganese oxidation state and a large specific surface area. Likely, due to a sufficient conductivity, this intrinsically high performance is maintained in electrocatalysis.
5 Experimental section
5.1 Sample synthesis
The catalyst precursors were synthesized in an OptiMax 1001 semi-automatized lab reactor from Mettler Toledo pre-filled with 300 mL of water. Manganese sulfate (Sigma-Aldrich Chemie GmbH, pharmaceutical quality) was dissolved in water and potassium hydroxide (Bernd Kraft GmbH, p.a.) used as the precipitating agent (0.5 mol L−1 MnSO4/0.5 mol L−1 KOH). 150 g of the aqueous MnSO4 solution was dosed with a constant rate over 1 h and the KOH solution was co-dosed to maintain the pH near the set point of 11. The reactor was heated and maintained at 50 °C. After the precipitation reaction, the resulting suspension was aged in the mother liquor for an additional hour. The precipitate was then washed by repeated suspension in deionized water and centrifugation until the conductivity of the supernatant remained below 200 μS cm−1. Bixbyite and hausmannite were synthesized from the precipitated precursor by thermal treatment in air at 800 and 1000 °C in a muffle furnace for 3 h. The heating rate was 5 K min−1. The resulting bixbyite was further converted to Hollandite. Therefore 200 mL sulfuric acid (3 mol L−1) were added together with 200 mg Bixbyite in a 500 mL round flask and refluxed for 24 h [56, 57]. In addition, birnessite was synthesized by a hydrothermal treatment of the precursor at pH 13 and 115 °C for 10 h in a steel reactor (Berghof) [55]. For a complete drying, hollandite and birnessite were annealed in air at 300 °C for 3 h after the respective wet chemical treatment.
5.2 Sample characterization
X-ray powder diffractograms were measured with a Bruker D8 Advance Bragg-Brentano diffractometer, which is equipped with a copper radiation source and a Lyneye EX-T detector as well as a nickel filter for filtering the Kβ-radiation. The powder samples were suspended in ethanol and spread on a flat sample holder for the measurement. TG analysis was performed in a NETZSCH GmbH STA 449 F3 Jupiter using approximately 50 mg of the sample in a 21% oxygen atmosphere. The heating rate was 5 K min−1 up to a final temperature of 1000 °C. A Quantachrome NOVA 3200e was used to determine the BET surface area. The samples were pretreated for 2 h at 100 °C in vacuum before measurement to remove adsorbed water. The sample quantity was adapted to the expected surface area, trying to have a total surface area of 2–3 m2 in the sample vessel for each measurement. For scanning electron microscopy (SEM), a JSM-6510 SEM by JEOL Ltd. (Tokyo, Japan) was used at a voltage of 5.0 kV and an emission current of 10 μA. EDX spectra were recorded with a Quantax 400 detector from Bruker (Billerica, USA). TEM images were obtained using a Cs-corrected TEM of the JEOL 2200 FS type from JOEL Ltd. (Tokyo, Japan) at the ICAN in Duisburg with an acceleration voltage of 200 kV. An ethanol suspension of the samples was added dropwise onto the carbon film of a copper TEM grid. X-ray Photoelectron Spectroscopy (XPS) measurements were carried out in the ultra-high vacuum (UHV) XPS system PHI 5000 Versaprobe II at the ICAN (Duisburg). A monochromatic Al-K alpha X-ray source (hν = 1486.6 eV) was used as incident radiation and a pass energy of 11 eV was chosen resulting in an energy resolution better than 0.5 eV. Dual beam charge compensation is applied to measure insulating samples. Binding energies were calibrated by using the Cu 2p 3/2 signal of a sputter cleaned Cu foil fixed on the same insulating double-sided tape as the sample itself. The TPR experiments were conducted in a BELCAT-B (MicrotracBEL Corp., Japan) gas flow system. The catalyst is heated to 1000 °C in 5% H2 in argon with a heating rate of 6 K min−1. Prior to the TPR experiment, 20 mg of the catalysts per experiment were pretreated at 100 °C in argon for 1 h to remove adsorbed water from the surface. The reaction was performed with a flow of 80 mL min−1 and observed via the thermal conductivity detected (TCD). To calibrate the TCD signal, a calibration curve with copper oxide (CuO) from Alfa Aesar (99.9995% metal based powder) was recorded. Afterwards, the reduced materials were analyzed by XRD.
5.3 Catalytic testing
Potentiometric measurements were carried out according to a standard protocol using the specifications of the MANGAN project [66]. The measurements were performed in a PGSTAT204 potentiostat from Methrom Autolab in a three-electrode arrangement. The protocol for oxygen evolution reaction (OER) includes the determination of an open circuit potential (Impedance) to calculate the IR-drop before the linear sweep volumetric (LSV) measurements up to 1.8 V versus RHE. The measurements were performed in 25 mL of a 1 mol L−1 KOH solution (Sigma Aldrich; for Analysis). To apply the catalyst to the electrode surface of the glassy carbon electrode, an ink was produced from the ground catalyst. For the ink 2.5 mg sample were given to 249 μL ethanol, 249 μL deionized water and 2 μL Nafion. The resulting mixture was ultrasonicated for 15 min, drop casted on the electrode and dried for 1 h at room temperature. A rotation speed of 1600 rpm was maintained throughout the whole measurement, which were described in detail previously [29, 36]. The CAN Test used in this work was also described previously [29, 71]. It is performed in a self-built set up which is connected to an oxygen analyzer EC900 Syntech. For the test, 5 mL of a 12.5 mmol L−1 cerium ammonium nitrate (CAN) solution was injected in 45 mL of a 2.22 g L−1 aqueous suspension of the catalyst. Before starting the test, both the catalyst suspension and the CAN solution were degassed with Argon so that all detected oxygen originates from the reaction. The CAN solution was then rapidly introduced into the catalyst suspension. During the reaction the suspension was stirred with 500 rpm. The evolved oxygen was transported by a continuously Argon flow of 50 mL min−1 to the Analyzer. The CAN test was run for 2 h and the oxygen evolution was recorded continuously. The hydrogen peroxide (H2O2) decomposition was performed in a set-up similar to the CAN test. The catalyst was placed together with 360 mL water in the reaction vessel (0.55 g L−1) and 40 mL hydrogen peroxide solution (30%) in a dropping funnel. The solution and the suspension were degassed with Argon before the reaction was started. The H2O2 solution was then rapidly introduced into the catalyst suspension and an argon flow transported the evolved oxygen to the analyzer. The recording was started at the moment when catalyst suspension and hydrogen peroxide solution came into contact and ended after 2 h. The initial rates of the CAN test and the H2O2 decomposition haven been determined at the maximum of the first derivative of the oxygen evolution curves.
Dedicated to Professor Christian Näther on the occasion of his 60th birthday.
Funding source: BMBF
Award Identifier / Grant number: FKZ: 03SF0511B
Acknowledgment
The authors acknowledge the financial support of the BMBF funded project MANGAN (FKZ: 03SF0511B) and the fruitful collaboration and discussions with the participating working groups. We would like to thank the team at ICAN for providing the TEM and XPS measurements. SEM images have been recorded in the group of Prof. M. Epple at UDE. Nicolas Cosanne helped editing the manuscript.
-
Author contribution: All the authors have accepted responsibility for the entire content of this submitted manuscript and approved submission.
-
Research funding: BMBF (FKZ: 03SF0511B)
-
Conflict of interest statement: The authors declare no conflicts of interest regarding this article.
References
1. Katsounaros, I., Cherevko, S., Zeradjanin, A. R., Mayrhofer, K. J. Angew. Chem. Int. Ed. 2014, 53, 102–121. https://doi.org/10.1002/anie.201306588.Search in Google Scholar PubMed
2. Dau, H., Limberg, C., Reier, T., Risch, M., Roggan, S., Strasser, P. ChemCatChem 2010, 2, 724–761. https://doi.org/10.1002/cctc.201000126.Search in Google Scholar
3. Linnemann, J., Kanokkanchana, K., Tschulik, K. ACS Catal. 2021, 11, 5318–5346. https://doi.org/10.1021/acscatal.0c04118.Search in Google Scholar
4. Yu, M., Budiyanto, E., Tüysüz, H. Angew. Chem. Int. Ed. 2022, 61, e202103824.10.1002/anie.202205058Search in Google Scholar
5. Hong, W. T., Risch, M., Stoerzinger, K. A., Grimaud, A., Suntivich, J., Shao-Horn, Y. Energy Environ. Sci. 2015, 8, 1404–1427. https://doi.org/10.1039/c4ee03869j.Search in Google Scholar
6. Schalenbach, M., Zeradjanin, A. R., Kasian, O., Cherevko, S., Mayrhofer, K. Int. J. Electrochem. Sci. 2018, 13, 1173–1226.10.20964/2018.02.26Search in Google Scholar
7. Dresp, S., Dionigi, F., Klingenhof, M., Strasser, P. ACS Energy Lett. 2019, 4, 933–942. https://doi.org/10.1021/acsenergylett.9b00220.Search in Google Scholar
8. Buller, S., Strunk, J. J. Energy Chem. 2016, 25, 171–190. https://doi.org/10.1016/j.jechem.2016.01.025.Search in Google Scholar
9. McEvoy, J. P., Brudvig, G. W. Chem. Rev. 2006, 106, 4455–4483. https://doi.org/10.1021/cr0204294.Search in Google Scholar PubMed
10. Dau, H., Zaharieva, I., Haumann, M. Curr. Opin. Chem. Biol. 2012, 16, 3–10. https://doi.org/10.1016/j.cbpa.2012.02.011.Search in Google Scholar PubMed
11. Wiechen, M., Zaharieva, I., Dau, H., Kurz, P. Chem. Sci. 2012, 3, 2330–2339. https://doi.org/10.1039/c2sc20226c.Search in Google Scholar
12. Melder, J., Bogdanoff, P., Zaharieva, I., Fiechter, S., Dau, H., Kurz, P. Z. Phys. Chem. 2020, 234, 925–978. https://doi.org/10.1515/zpch-2019-1491.Search in Google Scholar
13. Morales, D. M., Kazakova, M. A., Purcel, M., Masa, J., Schuhmann, W. J. Solid State Electrochem. 2020, 24, 2901–2906. https://doi.org/10.1007/s10008-020-04667-2.Search in Google Scholar
14. Antoni, H., Morales, D. M., Fu, Q., Chen, Y.-T., Masa, J., Schuhmann, W., Muhler, M. ACS Omega 2018, 3, 11216–11226. https://doi.org/10.1021/acsomega.8b01433.Search in Google Scholar PubMed PubMed Central
15. Mette, K., Bergmann, A., Tessonnier, J.-P., Haevecker, M., Yao, L., Ressler, T., Schlögl, R., Strasser, P., Behrens, M. ChemCatChem 2012, 4, 851–862. https://doi.org/10.1002/cctc.201100434.Search in Google Scholar
16. Ristig, S., Cibura, N., Strunk, J. Green 2015, 5, 23–41. https://doi.org/10.1515/green-2015-0010.Search in Google Scholar
17. Indra, A., Menezes, P. W., Zaharieva, I., Baktash, E., Pfrommer, J., Schwarze, M., Dau, H., Driess, M. Angew. Chem. Int. Ed. 2013, 52, 13206–13210. https://doi.org/10.1002/anie.201307543.Search in Google Scholar PubMed
18. Masa, J., Xia, W., Sinev, I., Zhao, A., Sun, Z., Grützke, S., Weide, P., Muhler, M., Schuhmann, W. Angew. Chem. Int. Ed. 2014, 53, 8508–8512. https://doi.org/10.1002/anie.201402710.Search in Google Scholar PubMed
19. Mosa, I. M., Biswas, S., El-Sawy, A. M., Botu, V., Guild, C., Song, W., Ramprasad, R., Rusling, J. F., Suib, S. L. J. Mater. Chem. A 2015, 4, 620–631.10.1039/C5TA07878DSearch in Google Scholar
20. Rabe, M., Toparli, C., Chen, Y.-H., Kasian, O., Mayrhofer, K. J. J., Erbe, A. Phys. Chem. Chem. Phys. 2019, 21, 10457–10469. https://doi.org/10.1039/c9cp00911f.Search in Google Scholar PubMed
21. Tesch, M. F., Bonke, S. A., Jones, T. E., Shaker, M. N., Xiao, J., Skorupska, K., Mom, R., Melder, J., Kurz, P., Knop-Gericke, A., Schlögl, R., Hocking, R. K., Simonov, A. N. Angew. Chem. Int. Ed. 2019, 58, 3426–3432. https://doi.org/10.1002/anie.201810825.Search in Google Scholar PubMed
22. McKenzie, R. M. Manganese oxides and hydroxides. In Minerals in Soil Environments; Dixon, J. B., Weed, S. B., Eds. Soil Science Society of America: Madison, 2018, pp. 439–465.10.2136/sssabookser1.2ed.c9Search in Google Scholar
23. Takashima, T., Hashimoto, K., Nakamura, R. J. Am. Chem. Soc. 2012, 134, 1519–1527. https://doi.org/10.1021/ja206511w.Search in Google Scholar PubMed
24. Boppana, V. B. R., Jiao, F. Chem. Commun. 2011, 47, 8973–8975. https://doi.org/10.1039/c1cc12258d.Search in Google Scholar PubMed
25. Smith, P. F., Deibert, B. J., Kaushik, S., Gardner, G., Hwang, S., Wang, H., Al-Sharab, J. F., Garfunkel, E., Fabris, L., Li, J., Dismukes, G. C. ACS Catal. 2016, 6, 2089–2099. https://doi.org/10.1021/acscatal.6b00099.Search in Google Scholar
26. Gupta, P. K., Bhandari, A., Saha, S., Bhattacharya, J., Pala, R. G. S. J. Phys. Chem. C 2019, 123, 22345–22357. https://doi.org/10.1021/acs.jpcc.9b05823.Search in Google Scholar
27. Robinson, D. M., Go, Y. B., Mui, M., Gardner, G., Zhang, Z., Mastrogiovanni, D., Garfunkel, E., Li, J., Greenblatt, M., Dismukes, G. C. J. Am. Chem. Soc. 2013, 135, 3494–3501. https://doi.org/10.1021/ja310286h.Search in Google Scholar PubMed
28. Pokhrel, R., Goetz, M. K., Shaner, S. E., Wu, X., Stahl, S. S. J. Am. Chem. Soc. 2015, 137, 8384–8387. https://doi.org/10.1021/jacs.5b05093.Search in Google Scholar PubMed
29. Heese-Gaertlein, J., Morales, D. M., Rabe, A., Bredow, T., Schuhmann, W., Behrens, M. Chem. Eur. J. 2020, 26, 12256–12267.10.1002/chem.201905090Search in Google Scholar PubMed PubMed Central
30. Chan, Z. M., Kitchaev, D. A., Weker, J. N., Schnedermann, C., Lim, K., Ceder, G., Tumas, W., Toney, M. F., Nocera, D. G. Proc. Natl. Acad. Sci. Unit. States Am. 2018, 115, E5261–E5268. https://doi.org/10.1073/pnas.1722235115.Search in Google Scholar PubMed PubMed Central
31. Ganesan, K., Murugan, P. Phys. Chem. Chem. Phys. 2016, 18, 22196–22202. https://doi.org/10.1039/c6cp02032a.Search in Google Scholar PubMed
32. Tompsett, D. A., Parker, S. C., Islam, M. S. J. Mater. Chem. A 2014, 2, 15509–15518. https://doi.org/10.1039/c4ta00952e.Search in Google Scholar
33. Tao, H. B., Fang, L., Chen, J., Yang, H. B., Gao, J., Miao, J., Chen, S., Liu, B. J. Am. Chem. Soc. 2016, 138, 9978–9985. https://doi.org/10.1021/jacs.6b05398.Search in Google Scholar PubMed
34. Bergmann, A., Zaharieva, I., Dau, H., Strasser, P. Energy Environ. Sci. 2013, 6, 2745–2755. https://doi.org/10.1039/c3ee41194j.Search in Google Scholar
35. Zaharieva, I., Chernev, P., Risch, M., Klingan, K., Kohlhoff, M., Fischer, A., Dau, H. Energy Environ. Sci. 2012, 5, 7081–7089. https://doi.org/10.1039/c2ee21191b.Search in Google Scholar
36. Heese-Gärtlein, J., Rabe, A., Behrens, M. Z. Anorg. Allg. Chem. 2021, 647, 1363–1372.10.1002/zaac.202000180Search in Google Scholar
37. Jooss, C., Ronge, E., Lindner, J., Ross, U., Melder, J., Ohms, J., Roddatis, V., Kurz, P. J. Phys. Chem. C 2021, 125, 5037–5047.10.1021/acs.jpcc.0c09806Search in Google Scholar
38. Gorlin, Y., Lassalle-Kaiser, B., Benck, J. D., Gul, S., Webb, S. M., Yachandra, V. K., Yano, J., Jaramillo, T. F. J. Am. Chem. Soc. 2013, 135, 8525–8534. https://doi.org/10.1021/ja3104632.Search in Google Scholar PubMed PubMed Central
39. Wei, C., Rao, R. R., Peng, J., Huang, B., Stephens, I. E. L., Risch, M., Xu, Z. J., Shao-Horn, Y. Adv. Mater. 2019, 31, 1806296. https://doi.org/10.1002/adma.201806296.Search in Google Scholar PubMed
40. Antoni, H., Xia, W., Masa, J., Schuhmann, W., Muhler, M. Phys. Chem. Chem. Phys. 2017, 19, 18434–18442. https://doi.org/10.1039/c7cp02717f.Search in Google Scholar PubMed
41. Antoni, H., Morales, D. M., Bitzer, J., Fu, Q., Chen, Y.-T., Masa, J., Kleist, W., Schuhmann, W., Muhler, M. J. Catal. 2019, 374, 335–344. https://doi.org/10.1016/j.jcat.2019.05.010.Search in Google Scholar
42. Kölbach, M., Fiechter, S., van de Krol, R., Bogdanoff, P. Catal. Today 2017, 290, 2–9.10.1016/j.cattod.2017.03.030Search in Google Scholar
43. Huynh, M., Shi, C., Billinge, S. J. L., Nocera, D. G. J. Am. Chem. Soc. 2015, 137, 14887–14904. https://doi.org/10.1021/jacs.5b06382.Search in Google Scholar PubMed
44. Rabe, A., Büker, J., Salamon, S., Koul, A., Hagemann, U., Landers, J., Friedel Ortega, K., Peng, B., Muhler, M., Wende, H., Schuhmann, W., Behrens, M. Chem. Eur. J. 2021, 27, 17038–17048. https://doi.org/10.1002/chem.202102400.Search in Google Scholar PubMed
45. Wiechen, M., Berends, H. M., Kurz, P. Dalton Trans. 2012, 41, 21–31. https://doi.org/10.1039/c1dt11537e.Search in Google Scholar PubMed
46. Frey, C. E., Wiechen, M., Kurz, P. Dalton Trans. 2014, 43, 4370–4379. https://doi.org/10.1039/c3dt52604f.Search in Google Scholar PubMed
47. Colodette, J. L., Rothenberg, S., Dence, C. W. J. Pulp Pap. Sci. 1989, 15, 45–51.Search in Google Scholar
48. Do, S.-H., Batchelor, B., Lee, H.-K., Kong, S.-H. Chemosphere 2009, 75, 8–12. https://doi.org/10.1016/j.chemosphere.2008.11.075.Search in Google Scholar PubMed
49. Wekesa, M., Ni, Y. Can. J. Chem. Eng. 2003, 81, 968–972.10.1002/cjce.5450810507Search in Google Scholar
50. Rossmeisl, J. J. Electroanal. Chem. 2007, 607, 83–89. https://doi.org/10.1016/j.jelechem.2006.11.008.Search in Google Scholar
51. Dhaouadi, H., Ghodbane, O., Hosni, F., Toutu, F. ISRN Spectrosc. 2012, 1–8.10.5402/2012/706398Search in Google Scholar
52. Chen, Z. W., Lai, J. K. L., Shek, C. H. Appl. Phys. Lett. 2005, 86, 181911. https://doi.org/10.1063/1.1923753.Search in Google Scholar
53. Raj, B. G. S., Asiri, A. M., Wu, J. J., Anandan, S. J. Alloys Compd. 2015, 636, 234–240. https://doi.org/10.1016/j.jallcom.2015.02.164.Search in Google Scholar
54. Jarosch, D. Mineral. Petrol. 1987, 37, 15–37. https://doi.org/10.1007/bf01163155.Search in Google Scholar
55. Cornell, R. M., Giovanoli, R. Clay Clay Miner. 1988, 36, 249–257. https://doi.org/10.1346/ccmn.1988.0360306.Search in Google Scholar
56. Vicat, J., Fanchon, E., Strobel, P., Tran Qui, D. Acta Crystallogr. B 1986, 42, 162–167. https://doi.org/10.1107/s0108768186098415.Search in Google Scholar
57. Ohzuku, T., Kitagawa, M., Sawai, K., Taketsugu, H. J. Electrochem. Soc. 1991, 138, 360–365. https://doi.org/10.1149/1.2085589.Search in Google Scholar
58. Post, J. E., Veblen, D. R. Am. Mineral. 1990, 75, 477–489.Search in Google Scholar
59. Norrestam, R. Acta Chem. Scand. 1967, 21, 2871–2884. https://doi.org/10.3891/acta.chem.scand.21-2871.Search in Google Scholar
60. Baron, V., Gutzmer, J., Rundlöf, H., Tellgren, R. Am. Mineral. 1998, 83, 786–793. https://doi.org/10.2138/am-1998-7-810.Search in Google Scholar
61. Wang, Y., Feng, X., Villalobos, M., Tan, W., Fan, L. Chem. Geol. 2012, 292–293, 25–34. https://doi.org/10.1016/j.chemgeo.2011.11.001.Search in Google Scholar
62. DeGuzman, R. N., Shen, Y.-F., Neth, E. J., Suib, S. L., O’Young, C.-L., Levine, S., Newsam, J. M. Chem. Mater. 1994, 6, 815–821. https://doi.org/10.1021/cm00042a019.Search in Google Scholar
63. Biesinger, M. C., Payne, B. P., Grosvenor, A. P., Lau, L. W. M., Gerson, A. R., Smart, R. S. C. Appl. Surf. Sci. 2011, 257, 2717–2730. https://doi.org/10.1016/j.apsusc.2010.10.051.Search in Google Scholar
64. Ilton, E. S., Post, J. E., Heaney, P. J., Ling, F. T., Kerisit, S. N. Appl. Surf. Sci. 2016, 366, 475–485. https://doi.org/10.1016/j.apsusc.2015.12.159.Search in Google Scholar
65. Castro, V. D., Polozonetti, G. J. Electron. Spectrosc. Relat. Phenom. 1989, 48, 117–123. https://doi.org/10.1016/0368-2048(89)80009-x.Search in Google Scholar
66. Spanos, I., Auer, A. A., Neugebauer, S., Deng, X., Tüysüz, H., Schlögl, R. ACS Catal. 2017, 7, 3768–3778. https://doi.org/10.1021/acscatal.7b00632.Search in Google Scholar
67. Frey, C. E., Kurz, P. Chem. Eur. J. 2015, 21, 14958–14968. https://doi.org/10.1002/chem.201501367.Search in Google Scholar PubMed
68. Lapierre, L., Bouchard, J., Berry, R. M., van Lierop, B. J. Pulp Pap. Sci. 1995, 21, J268–J273.Search in Google Scholar
69. Ramírez, A., Hillebrand, P., Stellmach, D., May, M. M., Bogdanoff, P., Fiechter, S. J. Phys. Chem. C 2014, 118, 14073–14081.10.1021/jp500939dSearch in Google Scholar
70. Shevela, D., Koroidov, S., Najafpour, M. M., Messinger, J., Kurz, P. Chem. Eur. J. 2011, 17, 5415–5423. https://doi.org/10.1002/chem.201002548.Search in Google Scholar PubMed
71. Heimann, M., Friedel Ortega, K., Behrens, M. Z. Phys. Chem. 2020, 234, 1185–1204. https://doi.org/10.1515/zpch-2019-1477.Search in Google Scholar
© 2022 Walter de Gruyter GmbH, Berlin/Boston
Articles in the same Issue
- Frontmatter
- In this issue
- Laudatio/Preface
- Christian Näther zum 60. Geburtstag gewidmet
- Research Articles
- Bismuth-rich bimetallic clusters (CuBi8)3+ and [MBi10]4+ (M = Pd, Pt) from ionothermal synthesis
- Crystal structure of phenanthrenide salts stabilized by 15-crown-5 and 18-crown-6
- Structure and properties of two new heteroleptic bismuth(III) dithiocabamates of the general composition Bi(S2CNH2)2X (X = Cl, SCN)
- Synthesis and structural characterization of three new mixed ligand alkaline-earth metal picrates
- Dimorphism of MnHAsO4(H2O): natural monoclinic krautite and its synthetic triclinic modification
- Synthesis, crystal structure, and topology of a polycatenated bismuth coordination polymer
- The unexpected crystal structure of thallium(I) tricyanomethanide Tl[C(CN)3]
- Synthesis, structure characterization and properties of a new oxidovanadium(IV) coordination polymer incorporating bridging (MoO4)2– and (Mo8O26)4– ligands
- Crystal structure of Dy11Ge4.33In5.67 and Tm11Ge4In6 from X-ray single-crystal and powder data
- Crystallisation of phosphates revisited: a multi-step formation process for SrHPO4
- Oxygen evolving reactions catalyzed by different manganese oxides: the role of oxidation state and specific surface area
- Synthesis and structural characterization of a new heterometallicmolybdate coordination polymer based on a µ3-bridging amino alcohol
- Chemically and Light-Driven Coordination-Induced Spin State Switching (CISSS) of a nonheme-iron complex
- Extracting information from X-ray diffraction patterns containing Laue oscillations
- Gadolinium trisilicide − a paramagnetic representative of the YbSi3 type series