Crystallisation of phosphates revisited: a multi-step formation process for SrHPO4
-
Laura Ruiz Arana


Abstract
SrHPO4 is used in a multitude of applications, including biomedicine, catalysts, luminescent materials, and batteries. However, the performance of these materials depends on the ability to control the formation and transformation of strontium phosphates. This work focuses on the application of in situ and ex situ measurements, including synchrotron-based X-ray diffraction (XRD) analysis, luminescence of Ce3+ and Eu3+ dopants, light transmission, reflectance, and thermogravimetry to track structural changes in SrHPO4 under different experimental conditions. Ex situ analysis of aliquots revealed favourable crystallisation of β-SrHPO4 through the formation of Sr6H3(PO4)5·2H2O as an intermediate. Furthermore, in situ analysis showed that the reaction mechanism evolves via the initial formation of amorphous strontium phosphate and Sr5(PO4)3OH, which subsequently transforms to γ-SrHPO4. Analysis of the luminescence properties of the lanthanide dopants provided insights into the coordination environments of the substituted Sr2+ sites.
1 Introduction
In recent years, SrHPO4 has been applied in a wide variety of fields, such as bone cements [1], drug delivery [2], immobilisation of heavy-metal ions [3, 4], catalysis [5], luminescent compounds [6], and battery material coatings [7]. Among these applications, special attention has been paid to the use of strontium phosphates in biomedicine as a means of improving or substituting calcium phosphate compounds in bone regeneration [8]. In comparison to calcium phosphates, strontium phosphates have been reported to have better bioaffinity, which improves the proliferation of bone stem cells [2]. However, biomedical applications depend on the stability of phosphate-based compounds in aqueous solutions, which has motivated many research groups to study the transformation between different phosphate phases, primarily focusing on calcium-based compounds [9], [10], [11], [12], [13], [14], [15], [16].
Strontium phosphates can form different phases in and from solutions. Some examples are α- [17, 18], β- [18, 19], and γ-SrHPO4 [20], Sr5(PO4)3OH [21], and Sr6H3(PO4)5·2H2O [22]. Two primary methods, ex situ and in situ, can be used to understand the formation and transformation of these phases. In ex situ approaches, aliquots are removed during the reaction, centrifuged, washed, dried, and prepared for analysis. In addition to requiring a large number of samples and producing results with low temporal resolution, the steps necessary to prepare for ex situ analyses may cause changes in the crystal structure. Thus, the results might not reflect what actually occurs during the reaction [23]. In contrast, in situ characterisation methods are performed under real reaction conditions, which means that crystallisation processes may be monitored beginning with the early nucleation stages, through the rise of possible transient intermediates, and during product formation. This enables the development of rational synthesis protocols [24], [25], [26], [27], [28], [29], [30], [31], [32], [33], [34].
The in situ luminescence analysis of coordination sensors (ILACS) technique [35], [36], [37] uses the spectroscopic sensitivity of lanthanide ions (Ln) to their coordination environment for monitoring chemical reactions. A specific example is the 5d → 4f electronic transitions of Ln ions such as Eu2+ and Ce3+ [38], [39], [40], [41], since the 5d orbitals are not shielded by outer orbitals. Therefore, the energy and position of the emission-peak maxima are sensitive to changes in the ligand field of these ions. The emission peaks assigned to 4f → 4f electronic transitions of Ln ions such as Eu3+ are not as prone to changes in the coordination environment. However, their narrow emission peaks allow better resolution of local symmetry and subtle ligand field effects, compared to broad 5d–4f emission bands [42]. To monitor crystallisation processes, these ions are introduced as local coordination sensors for the formation of a compound of interest. Changes in the coordination environment during nucleation, crystal growth, and phase transformations are detected under real reaction conditions using fast charge-coupled device (CCD)-based detectors. ILACS can be performed in conventional research laboratories and provides an efficient complementary approach for synchrotron-based in situ XRD analysis. This allows for the characterisation of ions in solution, and thus also desolvation processes.
In this work, we focus on the transformations between different strontium phosphate phases, especially those leading to the formation of SrHPO4. To this end, we compared: 1) the crystallisation pathway suggested by ex situ analysis of aliquots removed during the reaction, 2) the pathway suggested by in situ measurements of Ce3+ or Eu3+-doped luminescence and light transmission, and 3) the pathway observed in synchrotron-based in situ X-ray diffraction analysis. With our findings, we aim to contribute to a better understanding of the crystallisation pathway of phosphates, enabling their rational synthesis and the improvement of their stability within technical and biomedical applications.
2 Results and discussion
To monitor the phenomena leading to the formation of SrHPO4, Eu3+ and Ce3+ were chosen as coordination sensors, based on the sensitivity of their luminescence towards local structural changes in their coordinative environment. The crystallisation process of SrHPO4 was monitored using real-time luminescence and synchrotron-based X-ray diffraction. Details of the reaction conditions are presented in the Experimental Section and in Table S1 in the Supplementary material (‡).
2.1 Eu3+-doped strontium phosphates
Figure 1 summarises the preliminary results obtained during the synthesis of Eu3+-doped SrHPO4. As expected, after starting the addition of Eu3+- and Sr2+-containing solutions (exp. 1, Table S1‡ ), the intensity of the narrow bands (Figure 1a and S1‡ ) 5D0 → 7F J (J = 1, λ = 591 nm; J = 2, λ = 614 nm; J = 3, λ = 650 nm), representing the emissive transitions of Eu3+ rose and remained nearly constant (Figure 1a and b). The ratio of the integrated intensities of the 5D0 → 7F2 and 5D0 → 7F1 transitions is typically taken as a measure of the asymmetry of the coordinated sites occupied by the Eu3+ ions (Figure 1b) [42]. The suitability of this ratio as a semi-quantitative measure of structural changes is justified for the following reasons. The 5D0 → 7F1 transition has a strong magnetic dipole character. Because it is already parity-allowed, it is insensitive to the presence or absence of an inversion centre at the sites occupied by Eu3+ ions. In contrast, the 5D0 → 7F2 transition has a strong forced electric dipole character and gains intensity by odd-parity mixing (e.g. induced by the crystal field or vibrations) with wavefunctions of even parity, such as the 5d orbitals, in accordance with the Judd–Ofelt theory [43,44]. As such, the transition is only very intense if the coordination environment of the Eu3+ ions is non-centrosymmetric [42]. In addition, the 5D0 → 7F2 transition is hypersensitive to local surroundings. Its intensity is affected by subtle changes in the surrounding ligand field in an unusually strong manner for intraconfigurational 4f–4f transitions [42]. Overall, any relative enhancement of the intensity of the emission peaks assigned to the 5D0 → 7F2 transition, compared to the relatively insensitive emission peaks due to the 5D0 → 7F1 transition, is a measure of the asymmetry of the coordination environment of the Eu3+ ions. This measure is referred to as the asymmetry factor R [42, 45]. In experiment 1 ‡, the lowest values for R (Figure 1b, top panel) are reached at the beginning of the reaction. This result is expected due to the symmetric coordination environment of Eu3+ in aqueous solution [46] before reaction with the phosphate ions. Upon reaction with the phosphate anions offered in the solution, an increase in the R value was observed, which allowed monitoring of the desolvation process through an increase in the asymmetry around the Eu3+ ions. Interestingly, the R values increased until the Eu3+ and Sr2+ solution was completely added, with the growth rate changing approximately 9 min after the reaction started.
![Figure 1:
a) In situ luminescence (λ
ex = 375 nm) spectra recorded during the formation of γ-SrHPO4:Eu3+ at the P23 DESY beamline (exp. 1
‡). b) Time dependence of the volume of Sr(NO3)2 and Eu(NO3)3·H2O to the reactor containing (NH4)2HPO4. Comparison of the intensity ratio of the 5D0 → 7F2 and 5D0 → 7F1 transitions of Eu3+ (black dots), of the emission intensity at 614 nm as well as of the XRD intensity of the (3–21) reflection of Sr5(PO4)3OH [21] (*) and (210) reflection of γ-SrHPO4 [20] (**) to time dependency. Dashed lines mark significant changes in the phase transformation processes. c) In situ XRD patterns (λ = 0.6199 Å) showing the reflections assigned to Sr5(PO4)3OH [21] (*) and to γ-SrHPO4 [20] (**).](/document/doi/10.1515/znb-2021-0182/asset/graphic/j_znb-2021-0182_fig_001.jpg)
a) In situ luminescence (λ ex = 375 nm) spectra recorded during the formation of γ-SrHPO4:Eu3+ at the P23 DESY beamline (exp. 1 ‡). b) Time dependence of the volume of Sr(NO3)2 and Eu(NO3)3·H2O to the reactor containing (NH4)2HPO4. Comparison of the intensity ratio of the 5D0 → 7F2 and 5D0 → 7F1 transitions of Eu3+ (black dots), of the emission intensity at 614 nm as well as of the XRD intensity of the (3–21) reflection of Sr5(PO4)3OH [21] (*) and (210) reflection of γ-SrHPO4 [20] (**) to time dependency. Dashed lines mark significant changes in the phase transformation processes. c) In situ XRD patterns (λ = 0.6199 Å) showing the reflections assigned to Sr5(PO4)3OH [21] (*) and to γ-SrHPO4 [20] (**).
A similar behaviour was observed during monitoring of the time dependent growth rate of the intensity of the 5D0 → 7F2 transition (Figure 1b, purple curve), which becomes steeper at t ≈ 9 min, before stabilising after 20 min. At this point in time, the addition of the Sr2+ and Eu3+ solution is stopped and the plateau indicates that the reaction reaches a steady-state.
Although the total emission intensity was relatively low, which resulted in a correspondingly low resolution of the different Eu3+-related emission transitions, an additional change in the coordination environment could be recorded when the radiative 5D0 → 7F1 transition split into two peaks at 591 and 597 nm after approximately 9 min (Fig. S1). The change in the splitting pattern of the respective emission peaks is indicative of a modification of the coordinative environment of the Eu3+ ions and leads to a lift in the degeneracy of the 7F1 spin–orbit level in the ligand field [42, 47, 48]. This is in agreement with the low symmetry of the coordinative environment, indicated by the asymmetry factor R ≈ 1.8.
The reaction behaviour observed by the in situ luminescence spectra was confirmed by the simultaneously measured in situ X-ray diffraction analysis at the P23 beamline of the Deutsches Elektronen-Synchrotron (DESY) (Figure 1c). The evolution of Bragg reflections within the in situ XRD patterns is analogous to the observations in the luminescence spectra. Initially appearing and rising reflections can be assigned to the formation of the apatite phase Sr5(PO4)3OH (e.g. (002), (32;—1) and (300)) [21], which are subsequently substituted by the reflections assigned to γ-SrHPO4 [20] (e.g. (210), (123), and (024); Figure 1c and Fig. S2). These results are in agreement with the crystallisation behaviour of calcium phosphates, which is characterised by the transformation of Ca5(PO4)3OH to CaHPO4·2H2O during the reaction between the precursor compounds [13]. The evolution of the phases can be followed by the intensity of the reflections, which is shown in detail in Figure 1b (red and green curves) and is also compared to the in situ luminescence spectra. The reflections assigned to Sr5(PO4)3OH increased up to t ≈ 14 min at two different growth rates. The first growth rate lasted up to the 9 min point, which is in agreement with the initial increase in intensity of the Eu3+-related 5D0 → 7F2 transition (Figure 1b, purple curve) and the evolution of the asymmetry factor R (Figure 1b, black dots). After approximately 14 min, the intensity of the Bragg reflections assigned to Sr5(PO4)3OH decreased (e.g. (32;—1), Figure 1b, red curve) and the intensity of the reflections assigned to γ-SrHPO4 (e.g. (210), Figure 1b, green curve) started to increase. γ-SrHPO4 continued to form until the end of the addition of the Sr and Eu precursors to the PO4 3–-containing solution (Figure 1b, blue curve). In this context, it is important to note that the decay of the normalised intensity (I norm) of the reflection assigned to the Sr5(PO4)3OH phase (red curve, Figure 1b) and the increase in the intensity assigned to the γ-SrHPO4 phase (green curve, Figure 1b) intersect at I norm ≈ 0.5. This suggests that the reaction mechanism more likely involves a solid-solid transformation, rather than a partial dissolution of the Sr5(PO4)3OH phase [23, 49, 50]. After approximately 20 min, the intensities of the relevant Bragg reflections remain stable, which indicates that the reaction reaches equilibrium, similar to the results of the in situ luminescence measurements. It is worth noting that the synchrotron radiation and the excitation light source did not significantly influence the reaction temperature. The temperature was kept constant at (28.5 ± 0.1) °C during the synthesis procedure (Fig. S3 ‡).
2.2 Ce3+-doped strontium phosphates
Within the next set of experiments, we aimed to further understand the formation of SrHPO4. To this end, Ce3+, with a strong electric dipole-allowed 5d → 4f transition located in the UV or visible range, was applied as a coordination sensor (exp. 2, Table S1 ‡). Our previous studies on calcium phosphates have shown that the change of the coordination sensor from Eu3+ to Ce3+ does not influence the crystallisation behaviour of these materials [13]. In the respective X-ray diffraction analysis performed at the P02.1 DESY beamline (λ = 0.2073 Å, Figure 2), the small angle range at 0.0–0.7° 2θ was measured simultaneously in the wide-angle range, 3.1–4.2° 2θ.
![Figure 2:
a) and b) 3D in situ XRD measurements recorded during the formation of γ-SrHPO4:Ce3+ at the P02.1 DESY beamline (λ = 0.2073 Å, exp. 2
‡). c) Comparison of in situ XRD measurements with simulated XRD patterns for Sr5(PO4)3OH [21] (violet curve) and γ-SrHPO4 [20] (green curve). The blue and red curves highlight the single-phase transformation steps. d) Time dependence of the volume of Sr(NO3)2 and Ce(NO3)3·H2O to the reactor containing (NH4)2HPO4 (blue curve). Comparison to time-dependence of the XRD intensity of the amorphous strontium phosphate (0.35° 2θ, red curve), of the γ-SrHPO4 phase (3.20° 2θ, orange curve) and of the Sr5(PO4)3OH phase (4.05° 2θ, violet curve). The green curve displays the time dependence of the light transmission at 383 nm.](/document/doi/10.1515/znb-2021-0182/asset/graphic/j_znb-2021-0182_fig_002.jpg)
a) and b) 3D in situ XRD measurements recorded during the formation of γ-SrHPO4:Ce3+ at the P02.1 DESY beamline (λ = 0.2073 Å, exp. 2 ‡). c) Comparison of in situ XRD measurements with simulated XRD patterns for Sr5(PO4)3OH [21] (violet curve) and γ-SrHPO4 [20] (green curve). The blue and red curves highlight the single-phase transformation steps. d) Time dependence of the volume of Sr(NO3)2 and Ce(NO3)3·H2O to the reactor containing (NH4)2HPO4 (blue curve). Comparison to time-dependence of the XRD intensity of the amorphous strontium phosphate (0.35° 2θ, red curve), of the γ-SrHPO4 phase (3.20° 2θ, orange curve) and of the Sr5(PO4)3OH phase (4.05° 2θ, violet curve). The green curve displays the time dependence of the light transmission at 383 nm.
Figure 2a shows a prominent increase in the background in the small angle range of the in situ XRD patterns within the first 8 min of the chemical reaction, followed by a decrease. This behavior was not observed in the previous P23 in situ XRD data due to the different detector position. This increase in the background is indicative of the formation of an X-ray amorphous phase [13, 51], in agreement with the formation of amorphous phases detected for other metal phosphates [15, 52, 53]. The formation of this phase can also explain the increase in growth rate observed after the first 9 min of product formation, as detected in the in situ luminescence spectra and XRD patterns of the corresponding solutions containing Eu3+ (cf. Figure 1). The characteristic reflections assigned to Sr5(PO4)3OH [21] (e.g. (002), (32;—0) and (32;—1); Figure 2c and Fig. S3) increased within the first minute of the reaction, in a similar fashion to those of the Eu3+-doped strontium phosphates. The intensities of the reflections assigned to this phase increased up to t ≈ 9 min and then decreased.
Furthermore, the decrease in the concentration of the Sr5(PO4)3OH phase coincides with the significant increase in the formation of γ-SrHPO4 [20], detected through the rise of the characteristic reflections (e.g. (210), (123), (024), and (214); Figure 2c), which confirms the findings for the respective Eu3+-containing strontium phosphates. The difference between the transformation of Sr5(PO4)3OH to γ-SrHPO4 at t ≈ 14 min in experiment 1 ‡ and t ≈ 9 min in experiment 2 ‡ is attributed to the slight change in the concentration in these experiments (Table S1 ‡).
No significant changes in the concentration of the amorphous Sr5(PO4)3OH or γ-SrHPO4 phases were detected after the addition of Ce3+ and Sr2+ to the PO4 3−-containing solution was completed (Figure 2d). It is noteworthy that the presence of the amorphous phase can still be registered after t ≈ 20 min and its concentration only slowly decreases afterwards, accompanied by a simultaneous increase in the concentration of the γ-SrHPO4 phase.
To investigate the impact of temperature on the phase transitions of strontium phosphates, the reaction temperature was raised to 80 °C after t ≈ 40 min. This heating step caused a simultaneous increase in the intensity of the scattering peak of the amorphous phase and the observed Bragg reflections assigned to the γ-SrHPO4 phase, which indicates an increase in the respective concentrations. The increasing intensity of the reflection at 4.05° 2θ, which is assigned to the Sr5(PO4)3OH phase, is attributed to the overlap with a Bragg reflection at 4.10° 2θ assigned to γ-SrHPO4.
In situ light transmission was measured simultaneously with in situ XRD analysis in Experiment 2 ‡. During the addition of both Ce3+ and Sr2+ to the reactor, the light transmission at 383 nm increased up to t ≈ 9 min, most probably due to the dilution of the PO4 3−-containing solution by the cation solutions. Because the turbidity does not increase, the size of the formed amorphous and Sr5(PO4)3OH particles clearly must be below the wavelength of the transmitted light [54]. After the formation of γ-SrHPO4, an increase in turbidity was observed, which indicates an overall growth of the particle size. The turbidity was strongly reinforced by an increase in the reaction temperature after t ≈ 40 min.
During experiment 3 ‡, the same reaction conditions as in experiment 2 ‡ were employed to perform in situ luminescence measurements (λ ex = 260 nm) instead of in situ X-ray diffraction. Although the emission intensity reached the saturation limit of the detector during the experiments (Fig. S4 ‡), exemplary measurements before (t = 1 min) and after (t = 80 min) saturation were used to acquire the emission spectra of Ce3+-doped amorphous strontium phosphate, Sr5(PO4)3OH, and γ-SrHPO4.
At t = 1 min, after the addition of 2 mL of the Ce3+- and Sr2+-containing solution to the PO4 3–-containing solution (Figure 3a, blue curve), a broad emission band covering a range between 300 and 500 nm was detected. This emission band, with a full width at half maximum (FWHM) of 4727 cm−1, is composed of two overlapping main bands centred at 350 and 374 nm (Figure 3b, red curve). This double-band profile is typical for the Ce3+-related 5d → 4f electronic transition from the lowest excited 2D3/2 level to the 2F5/2 and 2F7/2 ground levels, respectively [55]. The large FWHM is a result of inhomogeneous broadening due to the different crystallographic sites accommodated by the Ce3+ ions in both phases. Energy dispersive X-ray (EDX) spectroscopy results indicated the presence of Ce3+ in the final product (Fig. S6 ‡).

a) Time dependence of the volume of Sr(NO3)2 and Ce(NO3)3·H2O to the reactor containing (NH4)2HPO4 (blue curve) in comparison to the time-dependence of the temperature. b) In situ emission spectra (λ ex = 260 nm) at t = 0 min (blue curve), t = 1 min (red curve) and t = 80 min (green curve) (exp. 3 ‡).
At t = 80 min (Figure 3b, green curve), the position of the Ce3+-related emission band does not significantly differ from that measured at t = 1 min, and it still covers the same spectral range between 300 and 500 nm. The total FWHM increases to 5504 cm−1; this is attributed to the increase in temperature from 20.5 to 80.5 °C at t = 80 min (Figure 3a). The product at t = 80 min contained the amorphous phase and γ-SrHPO4, according to the corresponding in situ XRD analysis.
A similar wavelength range of the Ce3+-based emission bands at both t = 1 min and t = 80 min is expected, because the average coordination environments of the Sr2+ sites substituted by Ce3+ do not differ significantly in Sr5(PO4)3OH and in γ-SrHPO4. In Sr5(PO4)3OH, two crystallographic Sr2+ sites are available: one is coordinated 7-fold and the other is coordinated 9-fold by oxygen atoms. The average Sr–O bond lengths are (2.6 ± 0.1) Å and (2.7 ± 0.2) Å, respectively [21]. Similarly, two crystallographically independent Sr2+ sites are available in γ-SrHPO4, which are both ninefold coordinated by oxygen atoms with average Sr–O bond lengths of (2.7 ± 0.1) Å [20]. The presence of an OH− ion in the coordination environment of hydroxyapatite, Sr5(PO4)3OH, instead of only phosphate-based oxygen atoms, leads to a chemically different ligand field. Moreover, PO4 3− and OH− ions differ in their optical basicities. Nonetheless, the presence of two Sr2+ sites, only one of which is coordinated by a single OH− ion in the hydroxyapatite, and the very similar bond lengths in Sr5(PO4)3OH and γ-SrHPO4 lead to similar Ce3+-based emission spectra (see Figure 3b). The broad-band nature of the emission of the Ce3+ ions does not allow sufficient distinction between these two phases, despite the generally higher sensitivity of 5d–4f transitions towards subtle coordinative changes. More advanced spectroscopic probes, such as luminescence decay experiments, are necessary to appropriately account for these changes. Thus, Eu3+ is a more suitable candidate for distinguishing the formation of Sr5(PO4)3OH from the formation of γ-SrHPO4 (see Figure 1b). Although the lack of long-range order in the amorphous phase does not allow for a consistent determination of any local coordinative structure by means of diffraction techniques, the similarity of the Ce3+-related luminescence properties in all three phosphate phases shows that the coordination environment around the Ce3+ ions in the amorphous phosphate phase is similar to that in the Sr5(PO4)3OH and γ-SrHPO4 phases.
To demonstrate the relevance of in situ measurements for the elucidation of reaction events during the formation of strontium phosphates, an additional experiment was carried out. Experiment 4 ‡ was performed under the same experimental conditions as experiments 2 ‡ and 3 ‡ (Table S1 ‡), but aliquots were removed from the reactor after selected time intervals. The colloidal solutions were quenched in a water bath at 2 °C, centrifuged, and the isolated solid residues were washed with H2O and ethanol prior to drying at 80 °C for 2 h. The powders were analysed using ex situ XRD. In contrast to the in situ XRD measurements, the ex situ analyses indicated the formation of Sr6H3(PO4)5·2H2O after 5 min, while β-SrHPO4 was formed after 15 min (see Figure 4a). This difference is attributed to the preparation steps necessary for the ex situ analysis and the results no longer reflect the real-time phase transformations culminating in the formation of the γ polymorph.
![Figure 4:
a) Ex situ XRD measurements of aliquots removed from the reactor during the strontium phosphate synthesis in comparison to calculated patterns of Sr6H3(PO4)5·2H2O [22] and β-SrHPO4 [19]. b) Ex situ XRD measurements of β-SrHPO4:Ce3+ (exp. 4
‡) after thermogravimetric analysis in comparison to the calculated XRD pattern of β-Sr2P2O7. The asterisks (*) mark reflections assigned to an unknown phase.](/document/doi/10.1515/znb-2021-0182/asset/graphic/j_znb-2021-0182_fig_004.jpg)
a) Ex situ XRD measurements of aliquots removed from the reactor during the strontium phosphate synthesis in comparison to calculated patterns of Sr6H3(PO4)5·2H2O [22] and β-SrHPO4 [19]. b) Ex situ XRD measurements of β-SrHPO4:Ce3+ (exp. 4 ‡) after thermogravimetric analysis in comparison to the calculated XRD pattern of β-Sr2P2O7. The asterisks (*) mark reflections assigned to an unknown phase.
The final product of experiment 4 ‡, β-SrHPO4, was additionally analysed thermogravimetrically (TG) to characterise any thermally-induced phase transformations of the strontium phosphates (Fig. S7). The decomposition of β-SrHPO4 occurs in two main steps. The first one occurs at approximately 150 °C with the maximum differential thermogravimetric (DTG) signal at 384 °C, while the second one is observed between approximately 430 and 630 °C, with the maximum DTG at 587 °C. As shown in Figure 4b, the decomposition product of β-SrHPO4 after calcination at 700 °C is the expected condensed β-Sr2P2O7. This result is in agreement with previous findings on the thermal behaviour of CaHPO4 [56], which undergoes dehydration of its HPO4 2− units with formation of γ-Ca2P2O7 after thermal treatment at 800 °C.
β-SrHPO4:Ce3+ shows a diffuse reflectance of almost 100% over the entire visible spectral range, in accordance with the colourless appearance of the powder under visible light irradiation (see Figure 5a). At wavelengths below 410 nm, the reflectivity decreases owing to the absorption of the Ce3+ ions. The emission spectrum of β-SrHPO4:Ce3+ is composed of two unresolved broad bands centred between 300 and 400 nm. The overall emission band has an FWHM of 4480 cm−1 (λ ex = 260 nm, Figure 5b and is assigned to the Ce3+-related 5d → 4f electronic transition from the 2D3/2 level to the 2F5/2 and 2F7/2 ground levels, respectively [55]. The related excitation spectrum acquired by monitoring the emission at λ em = 342 nm (see Figure 5b) reveals the presence of several bands with maxima at 260 and 275 nm. These observations are in agreement with the luminescence properties reported by Wang et al. [6] Because there is a strong overlap between the absorption and emission of Ce3+ in β-SrHPO4:Ce3+ (see Figure 5a and b), self-absorption is expected, which favours energy transport and thus, concentration quenching at low concentrations.
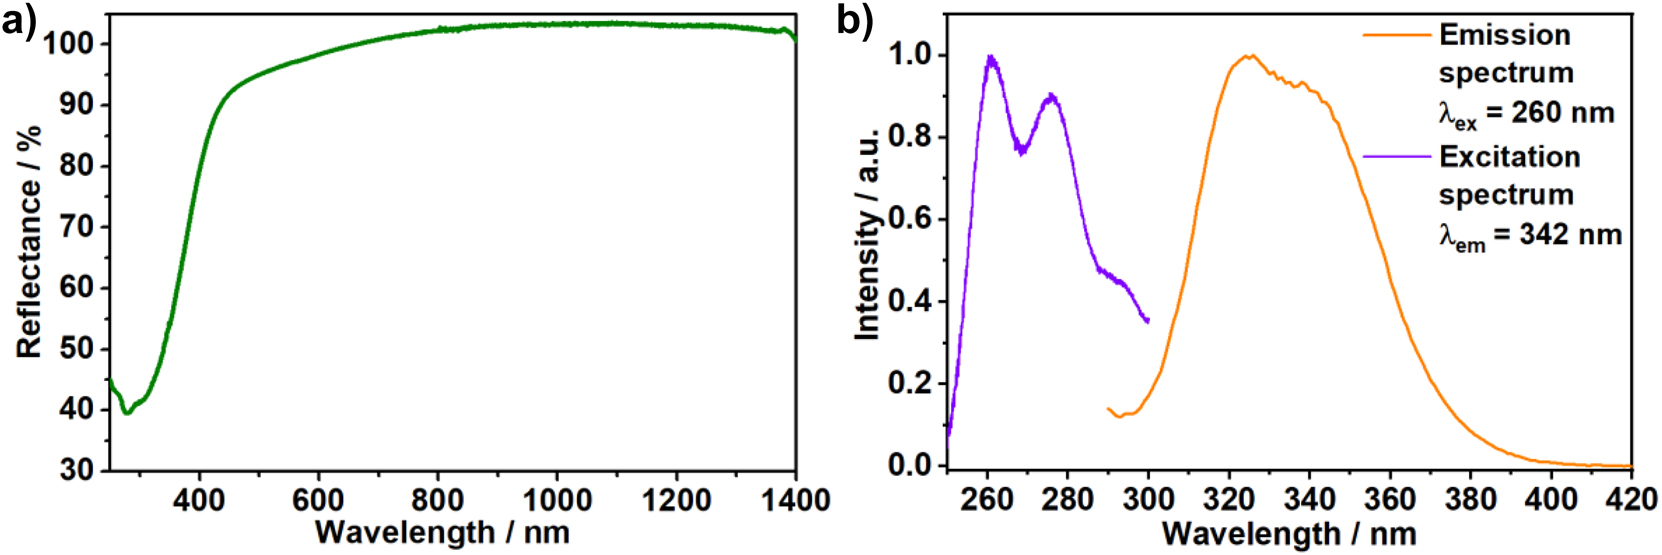
a) Reflectance (green curve), b) emission (λ ex = 260 nm, orange curve) and excitation (λ em = 342 nm) spectra of β-SrHPO4:Ce3+ (exp. 4 ‡).
It is noteworthy that the emission spectrum recorded for the ex situ formed β-SrHPO4:Ce3+ (see Figure 5b) is slightly blue-shifted compared to those recorded for the mixtures of amorphous strontium phosphate, Sr5(PO4)3OH, and γ-SrHPO4 (Figure 3b). These findings indicate a slightly different coordinative environment of the Sr2+ ions in β-SrHPO4 with longer or shorter Ce–O bonds affecting the Ce3+ 4f 1 ground state, given that the Stokes shift is similar among the different phosphates.
3 Conclusions
The transformations between different strontium phosphate phases were monitored by combining in situ and ex situ measurements including (synchrotron-based) X-ray diffraction analysis, luminescence, light transmission, reflectance, and thermogravimetry. The in situ techniques revealed the formation of an amorphous strontium phosphate and a hydroxyapatite (Sr5(PO4)3OH) phase upon mixing the respective precursor solutions, which ultimately led to the formation of γ-SrHPO4 (Scheme 1). In contrast, ex situ XRD and luminescence characterisation of aliquots, which were removed at selected time intervals, indicated the presence of Sr6H3(PO4)5·2H2O and β-SrHPO4, which finally condensed to β-SrP2O7 above 700 °C (Scheme 1). These findings are in strong contrast to the phase composition of intermediates and products in solution, and demonstrate the importance of an appropriate in situ characterisation of chemical reactions that are prone to conflicting conclusions. The local coordination environments of Sr2+ ions within amorphous strontium phosphate and β-SrHPO4 were previously unknown. It was shown that the 4f 6 → 4f 6 luminescence of Eu3+ is sensitive to changes in the coordination environment in aqueous solutions on the one hand and in various phosphate solids on the other. Ce3+ was also chosen as the local coordination sensor. Given the premise that the Ce3+ ions substitute the Sr2+ ions within the phosphates, a comparison of the respective Ce3+-related luminescence spectra provided additional insight into this topic. It can be concluded that the coordination environment of the Ce3+ ions in doped amorphous strontium phosphate is similar to that in doped Sr5(PO4)3OH and γ-SrHPO4. In contrast, the coordination environment and Ce–O bond lengths in β-SrHPO4 are expected to differ from those in Sr5(PO4)3OH and γ-SrHPO4. Thus, both in situ and ex situ luminescence studies with appropriate luminescent ions can be a valuable and simple tool to gain insights into local structural features, even without long-range crystalline order.

Summary of strontium phosphate phases detected in situ (amorphous strontium phosphate, Sr5(PO4)3OH, and γ-SrHPO4), as well as ex situ (Sr6H3(PO4)5·2H2O, β-SrHPO4, and β-Sr2P2O7).
4 Materials
In a typical SrHPO4 precipitation experiment, an aqueous solution containing Sr(NO3)2 (99%, Grüssing GmbH) and Eu(NO3)3·6H2O (99.9%, ChemPur Feinchemikalien und Forschungsbedarf GmbH) or Ce(NO3)3·H2O (99.5%, Alfa Aesar GmbH & Co KG) was added to the reactor containing an aqueous solution of (NH4)2HPO4 (99+%, Merck KGaA). Detailed descriptions of all solution concentrations and experimental conditions are summarised in Table S1 ‡.
After synthesis, the products were centrifuged, washed with water and ethanol, dried at 80 °C for 2 h, and subjected to ex situ analyses. Ex situ XRD measurements were performed in transmission geometry, applying a STOE Stadi-p X-ray powder diffractometer (STOE & Cie GmbH, Darmstadt, Germany) with a DECTRIS® MYTHEN 1 K detector (DECTRIS, Baden-Daettwil, Switzerland) with Cu Kα1 radiation (λ = 1.54056 Å) and a Ge monochromator. Reflection spectra were recorded at room temperature with a Cary 5000 two-channel spectrometer (Varian Techtron Pty., Darmstadt, Germany) using BaSO4 as a reference material. Thermogravimetric analysis was carried out with a Linseis STA PT1600 simultaneous thermobalance; the samples were heated in a nitrogen atmosphere at a rate of 4 K min−1.
4.1 Equipment for in situ measurements
The in situ experiments reported in this work were performed by applying two main experimental setups. The mobile Setup I was specifically designed to perform in situ XRD measurements at synchrotron facilities, while Setup II consisted of a stationary in situ crystallisation cell at the University of Kiel.
4.2 Setup I
To perform in situ X-ray diffraction analysis at synchrotron facilities, the glass reaction vessel was modified. The path length of the X-ray beam through the reaction volume was decreased by inserting a glass tube into one of its walls [36]. This vessel was placed in a reactor holder containing an integrated stirring system designed to flexibly fit different beamlines without requiring realignment after each reaction [13]. The reactor holder contains two openings for the entrance and exit of the X-ray beam. These are complemented by a larger opening for the irradiation of the reactor with the light source for in situ luminescence and light transmission measurements.
At the DESY P23 PETRA III beamline, in situ XRD measurements were carried out at 20 keV (λ = 0.6199 Å) using a Pilatus 1 M with an active area of 169 × 179 mm2 and 172 × 172 µm pixel size as the X-ray detector (Figs. S8 ‡ and S9 ‡). X-ray diffractograms were recorded at a time resolution of 1 s. The Shamrock 303i spectrograph coupled with a low-noise CCD iVAC camera (15 × 15 µm pixel size) was used for in situ studies of the luminescence properties. The spectrometer was connected to a sample cell using a quartz optical fibre. A fiber-coupled M375F2 LED (Thorlabs GmbH, wavelength 375 nm) was used as the excitation source.
At the DESY P02.1 PETRA III beamline [57], in situ XRD measurements were carried out at 60 keV (λ = 0.2073 Å) using a Perkin Elmer XRD1621 detector (PerkinElmer Technologies, Walluf, Germany) (2048 × 2048 pixels, X pixel size 200.00 μm, Y pixel size 200.00 μm), and powder diffraction patterns were recorded every 30 s.
For the sake of clarity in the assignment of the in situ measured Bragg peaks to the respective simulated diffraction patterns, the XRD data was treated in the manner suggested by Platero-Prats et al. [58] for the in situ pair-distribution function measurements. Thus, our in situ XRD data was normalised to overcome the oscillation of the intensity of the synchrotron X-ray beam. We used the first measurement, prior to mixing the precursor solutions, as a baseline for subtracting the background caused by the reactor walls and the solvent.
In situ measurements of light transmission were performed by illuminating the reactor with a 395 nm light-emitting diode (LED, Sahlmann Photochemical Solutions, Germany). The intensity of the light source was measured during the reaction by an optical fibre submerged inside the solution and connected to a portable spectrometer (StellarNet Inc., Tampa, FL, USA) equipped with a CCD detector [59].
4.3 Setup II
This setup comprises an Easy MaxTM reactor system (Mettler Toledo GmbH, Gießen, Germany), capable of automatically controlling the temperature and the stirring and dosing rates. The in situ luminescence measurements were performed using a Fluorolog-3 fluorescence spectrometer FL322 (HORIBA Jovin Yvon GmbH, Unterhaching, Germany), equipped with an iHR-320-FA triple grating imaging spectrograph, combined with a Syncerity CCD detector and a 450 W Xenon lamp. A Y-shaped optical fibre was used to transmit excitation light from the spectrometer to the solution and the light emitted from the reactor to the Syncerity CCD detector. In situ luminescence spectra were recorded every 30 s. Ex situ luminescence spectra were detected using the R928P photomultiplier-based detector within the Fluorolog3 spectrometer.
Dedicated to Professor Christian Näther on the occasion of his 60th birthday.
Funding source: German Research Foundation
Award Identifier / Grant number: 1415
Award Identifier / Grant number: TE 1147/1-1
Acknowledgments
Thanks go to the ILACS Group for the interesting discussions, M. Radke for the photos of the Setups and Dr. M. Köppen for the development of the in situ data helper software for analysing the DESY data. We acknowledge DESY (Hamburg, Germany), a member of the Helmholtz Association HGF, for the provision of experimental facilities. Parts of this research were carried out at PETRA III P02.1 and P23 beamlines. Beamtime was allocated for proposals BAG-20170560 and II-20180600.
-
Author contributions: All the authors have accepted responsibility for the entire content of this submitted manuscript and approved submission.
-
Research funding: The authors thank Prof. Dr. W. Bensch for providing the equipment necessary for performing these experiments, as well as the German Research Foundation (DFG, Priority Program 1415 and project TE 1147/1-1) for financial support.
-
Conflict of interest statement: The authors declare no conflicts of interest regarding this article.
References
1. Guo, D., Mao, M., Qi, W., Li, H., Ni, P., Gao, G., Xu, K. J. Mater. Sci. Mater. Med. 2011, 22, 2631–2640; https://doi.org/10.1007/s10856-011-4448-7.Search in Google Scholar
2. Shi, H., Wu, T., Zhang, J., Ye, X., Zeng, S., Liu, X., Yu, T., Ye, J., Zhou, C. Mater. Sci. Eng. C 2017, 81, 8–12; https://doi.org/10.1016/j.msec.2017.07.034.Search in Google Scholar
3. Zhuang, F.-Q., Tan, R.-Q., Shen, W.-F., Zhang, X.-P., Xu, W., Song, W.-J. Acta Metall. Sin. 2015, 28, 438–443; https://doi.org/10.1007/s40195-015-0214-z.Search in Google Scholar
4. Lu, Z., Tan, R., Chu, W., Tang, S., Xu, W., Song, W. Microchem. J. 2018, 142, 152–158; https://doi.org/10.1016/j.microc.2018.06.030.Search in Google Scholar
5. Fischer, A., Mallat, T., Baiker, A. Catal. Today 1997, 37, 167–189; https://doi.org/10.1016/s0920-5861(97)00009-6.Search in Google Scholar
6. Wang, M., Tian, B., Yue, D., Lu, W., Yu, M., Li, C., Li, Q., Wang, Z. J. Rare Earths 2015, 33, 355–360; https://doi.org/10.1016/s1002-0721(14)60426-9.Search in Google Scholar
7. Zhang, X., Xu, Y., Zhang, H., Zhao, C., Qian, X. Electrochim. Acta 2014, 145, 201–208; https://doi.org/10.1016/j.electacta.2014.08.043.Search in Google Scholar
8. Li, Z., Lam, W. M., Yang, C., Xu, B., Ni, G. X., Abbah, S. A., Cheung, K. M., Luk, K. D., Lu, W. W. Biomaterials 2007, 28, 1452–1460; https://doi.org/10.1016/j.biomaterials.2006.11.001.Search in Google Scholar PubMed
9. Schroeder, R., Besch, L., Pohlit, H., Panthoefer, M., Roth, W., Frey, H., Tremel, W., Unger, R. E. J. Tissue Eng. Regener. Med. 2018, 12, 1754–1768.10.1002/term.2703Search in Google Scholar PubMed
10. Schroeder, R., Pohlit, H., Schueler, T., Panthoefer, M., Unger, R. E., Frey, H., Tremel, W. J. Mater. Chem. B 2015, 3, 7079–7089.10.1039/C5TB01032BSearch in Google Scholar
11. Bach, S., Celinski, V. R., Dietzsch, M., Panthoefer, M., Bienert, R., Emmerling, F., Schmedt auf der Guenne, J., Tremel, W. J. Am. Chem. Soc. 2015, 137, 2285–2294; https://doi.org/10.1021/ja5103663.Search in Google Scholar
12. Ibsen, C. J. S., Gebauer, D., Birkedal, H. Chem. Mater. 2016, 28, 8550–8555; https://doi.org/10.1021/acs.chemmater.6b01088.Search in Google Scholar
13. Terraschke, H., Rothe, M., Tsirigoni, A.-M., Lindenberg, P., Ruiz Arana, L., Heidenreich, N., Bertram, F., Etter, M. Inorg. Chem. Front. 2017, 4, 1157–1165; https://doi.org/10.1039/c7qi00172j.Search in Google Scholar
14. Pan, H., Jiang, S., Zhang, T., Tang, R. Methods Enzymol. 2013, 532, 129–144; https://doi.org/10.1016/b978-0-12-416617-2.00006-0.Search in Google Scholar
15. Posner, A. S., Betts, F. Acc. Chem. Res. 1975, 8, 273–281; https://doi.org/10.1021/ar50092a003.Search in Google Scholar
16. Dorozhkina, E. I., Dorozhkin, S. V. Colloids Surf. A 2002, 203, 237–244; https://doi.org/10.1016/s0927-7757(01)01108-6.Search in Google Scholar
17. Boudjada, A., Masse, R., Guitel, J. C. Acta Crystallogr. 1978, B34, 2692–2695; https://doi.org/10.1107/s0567740878009036.Search in Google Scholar
18. Roming, M., Feldmann, C. J. Mater. Sci. 2008, 43, 5504–5507; https://doi.org/10.1007/s10853-008-2830-8.Search in Google Scholar
19. Ropp, R. C., Hoffman, W. W., Veleker, T. J., Mooney, R. W. Anal. Chem. 1959, 31, 1163–1166; https://doi.org/10.1021/ac60151a026.Search in Google Scholar
20. Taher, L. B., Smiri, L., Laligant, Y., Maisonneuve, V. J. Solid State Chem. 2000, 152, 428–434; https://doi.org/10.1006/jssc.2000.8700.Search in Google Scholar
21. Sudarsanan, K., Young, R. A. Acta Crystallogr. 1972, B28, 3668–3670; https://doi.org/10.1107/s0567740872008544.Search in Google Scholar
22. Collin, R. L. J. Chem. Eng. Data 1964, 9, 165–166; https://doi.org/10.1021/je60021a002.Search in Google Scholar
23. Pienack, N., Ruiz Arana, L., Bensch, W., Terraschke, H. Crystals 2016, 6, 157/1–14; https://doi.org/10.3390/cryst6120157.Search in Google Scholar
24. Pienack, N., Bensch, W. Angew. Chem. Int. Ed. 2011, 50, 2014–2034; https://doi.org/10.1002/anie.201001180.Search in Google Scholar PubMed
25. Terraschke, H., Rothe, M., Lindenberg, P. Rev. Anal. Chem. 2018, 37, 20170003/1–22; https://doi.org/10.1515/revac-2017-0003.Search in Google Scholar
26. Seidlhofer, B., Pienack, N., Bensch, W. Z. Naturforscher 2010, 65b, 937–975; https://doi.org/10.1515/znb-2010-0803.Search in Google Scholar
27. Kiebach, R., Pienack, N., Ordolff, M.-E., Studt, F., Bensch, W. Chem. Mater. 2006, 18, 1196–1205; https://doi.org/10.1021/cm051788t.Search in Google Scholar
28. Feyand, M., Huebner, A., Rothkirch, A., Wragg, D. S., Stock, N. Inorg. Chem. 2012, 51, 12540–12547; https://doi.org/10.1021/ic301976s.Search in Google Scholar PubMed
29. Heidenreich, N., Rütt, U., Köppen, M., Kentaro Inge, A., Dippel, A.-C., Suren, R., Stock, N. Rev. Sci. Instrum. 2017, 88, 104102/1–12; https://doi.org/10.1063/1.4999688.Search in Google Scholar PubMed
30. Embrechts, H., Kriesten, M., Hoffmann, K., Peukert, W., Hartmann, M., Distaso, M. J. Phys. Chem. C 2018, 122, 12267–12278; https://doi.org/10.1021/acs.jpcc.8b02484.Search in Google Scholar
31. Kohlmann, H. Eur. J. Inorg. Chem. 2019, 39–40, 4174–4180; https://doi.org/10.1002/ejic.201900733.Search in Google Scholar
32. Dantelle, G., Testemale, D., Homeyer, E., Cantarano, A., Kodjikian, S., Dujardin, C., Hazemann, J.-L., Ibanez, A. RSC Adv. 2018, 8, 26857–26870; https://doi.org/10.1039/c8ra05914d.Search in Google Scholar
33. Pienack, N., Lindenberg, P., Doungmo, G., Heidenreich, N., Bertram, F., Etter, M., Wharmby, M. T., Terraschke, H. Z. Anorg. Allg. Chem. 2018, 644, 1902–1907; https://doi.org/10.1002/zaac.201800392.Search in Google Scholar
34. Ruiz Arana, L., Olchowka, J., Terraschke, H. Z. Naturforsch. 2019, 74b, 147–152; https://doi.org/10.1515/znb-2018-0201.Search in Google Scholar
35. Terraschke, H., Ruiz Arana, L., Lindenberg, P., Bensch, W. Analyst 2016, 141, 2588–2594; https://doi.org/10.1039/c6an00075d.Search in Google Scholar
36. Lindenberg, P., Ruiz Arana, L., Mahnke, L. K., Rönfeldt, P., Heidenreich, N., Doungmo, G., Guignot, N., Bean, R., Chapman, H. N., Dierksmeyer, D., Knoska, J., Kuhn, M., Garrevoet, J., Mariani, V., Oberthuer, D., Pande, K., Stern, S., Tolstikova, A., White, T. A., Beyerlein, K. R., Terraschke, H. React. Chem. Eng. 2019, 4, 1757–1767; https://doi.org/10.1039/c9re00191c.Search in Google Scholar
37. Ruiz Arana, L., Lindenberg, P., Said, H., Radke, M., Heidenreich, N., Cunha, C. S., Leubner, S., Terraschke, H. RSC Adv. 2017, 7, 52794–52800; https://doi.org/10.1039/c7ra07488c.Search in Google Scholar
38. Bünzli, J.-C., Piguet, C. Chem. Soc. Rev. 2005, 34, 1048–1077.10.1039/b406082mSearch in Google Scholar
39. Dorenbos, P. Phys. Rev. 2002, 65, 235110/1–6; https://doi.org/10.1103/physrevb.65.235110.Search in Google Scholar
40. Höppe, H. A., Lutz, H., Morys, P., Schnick, W., Seilmeier, A. J. Phys. Chem. Solid 2000, 12, 2001–2006.10.1016/S0022-3697(00)00194-3Search in Google Scholar
41. Wylezich, T., Boettcher, R., Sontakke, A. D., Castaing, V., Viana, B., Poeppl, A., Kunkel, N. J. Phys. Chem. C 2019, 123, 5031–5041; https://doi.org/10.1021/acs.jpcc.8b12420.Search in Google Scholar
42. Binnemans, K. Coord. Chem. Rev. 2015, 295, 1–45; https://doi.org/10.1016/j.ccr.2015.02.015.Search in Google Scholar
43. Judd, B. Phys. Rev. 1962, 127, 750–761; https://doi.org/10.1103/physrev.127.750.Search in Google Scholar
44. Ofelt, G. J. Chem. Phys. 1962, 37, 511–520; https://doi.org/10.1063/1.1701366.Search in Google Scholar
45. Kirby, A. F., Foster, D., Richardson, F. S. Chem. Phys. Lett. 1983, 95, 507–512; https://doi.org/10.1016/0009-2614(83)80342-x.Search in Google Scholar
46. Samikkanu, S., Mellem, K., Berry, M., May, P. S. Inorg. Chem. 2007, 46, 7121–7128; https://doi.org/10.1021/ic070329m.Search in Google Scholar PubMed
47. Dorn, K. V., Blaschkowski, B., Netzsch, P., Höppe, H. A., Hartenbach, I. Inorg. Chem. 2019, 58, 8308–8315; https://doi.org/10.1021/acs.inorgchem.9b00098.Search in Google Scholar PubMed
48. Gramm, V. K., Schuy, A., Suta, M., Wickleder, C., Sternemann, C., Ruschewitz, U. Z. Anorg. Allg. Chem. 2018, 644, 127–135; https://doi.org/10.1002/zaac.201700361.Search in Google Scholar
49. Engelke, L., Schäfer, M., Porsch, F., Bensch, W. Eur. J. Inorg. Chem. 2003, 3, 506–513; https://doi.org/10.1002/ejic.200390072.Search in Google Scholar
50. Polzin, P., Eliani, I. V., Ströh, J., Braun, M., Ruser, N., Heidenreich, N., Rönfeldt, P., Bertram, F., Suta, M., Terraschke, H. Phys. Chem. Chem. Phys. 2018, 20, 7428–7437; https://doi.org/10.1039/c7cp07142f.Search in Google Scholar PubMed
51. Wendt, M., Mahnke, L. K., Heidenreich, N., Bensch, W. Eur. J. Inorg. Chem. 2016, 34, 5393–5398; https://doi.org/10.1002/ejic.201601025.Search in Google Scholar
52. Bach, S., Panthoefer, M., Bienert, R., Buzanich, A. O. G., Emmerling, F., Tremel, W. Cryst. Growth Des. 2016, 16, 4232–4239; https://doi.org/10.1021/acs.cgd.6b00208.Search in Google Scholar
53. Lu, B.-Q., Garcia, N. A., Chevrier, D. M., Zhang, P., Raiteri, P., Gale, J. D., Gebauer, D. Cryst. Growth Des. 2019, 19, 3030–3038; https://doi.org/10.1021/acs.cgd.9b00274.Search in Google Scholar
54. Goesmann, H., Feldmann, C. Angew. Chem. Int. Ed. 2010, 49, 1362–1395; https://doi.org/10.1002/anie.200903053.Search in Google Scholar PubMed
55. Blasse, G., Grabmaier, B. C. Luminescent Materials; Springer: Berlin, 1994.10.1007/978-3-642-79017-1Search in Google Scholar
56. Mulongo-Masamba, R., El Kassri, T., Khachani, M., Arsalane, S., Halim, M., El Hamidi, A. J. Therm. Anal. Calorim. 2016, 124, 171–180; https://doi.org/10.1007/s10973-015-5130-y.Search in Google Scholar
57. Dippel, A.-C., Liermann, H. P., Delitz, J. T., Walter, P., Schulte-Schrepping, H., Seeck, O., Franz, H. J. Synchrotron. Radiat. 2015, 22, 675–687; https://doi.org/10.1107/s1600577515002222.Search in Google Scholar PubMed PubMed Central
58. Platero-Prats, A. E., Li, Z., Gallington, L. C., Peters, A. W., Hupp, J. T., Farha, O. K., Chapman, K. W. Faraday Discuss 2017, 201, 337–350; https://doi.org/10.1039/c7fd00110j.Search in Google Scholar PubMed
59. Ströh, J., Ruiz Arana, L., Polzin, P., Eliani, I. V., Lindenberg, P., Heidenreich, N., Cunha, C. S., Leubner, S., Terraschke, H. Z. Anorg. Allg. Chem. 2019, 645, 537–543.10.1002/zaac.201800458Search in Google Scholar
Supplementary Material
The online version of this article offers supplementary material (https://doi.org/10.1515/znb-2021-0182).
© 2022 Walter de Gruyter GmbH, Berlin/Boston
Articles in the same Issue
- Frontmatter
- In this issue
- Laudatio/Preface
- Christian Näther zum 60. Geburtstag gewidmet
- Research Articles
- Bismuth-rich bimetallic clusters (CuBi8)3+ and [MBi10]4+ (M = Pd, Pt) from ionothermal synthesis
- Crystal structure of phenanthrenide salts stabilized by 15-crown-5 and 18-crown-6
- Structure and properties of two new heteroleptic bismuth(III) dithiocabamates of the general composition Bi(S2CNH2)2X (X = Cl, SCN)
- Synthesis and structural characterization of three new mixed ligand alkaline-earth metal picrates
- Dimorphism of MnHAsO4(H2O): natural monoclinic krautite and its synthetic triclinic modification
- Synthesis, crystal structure, and topology of a polycatenated bismuth coordination polymer
- The unexpected crystal structure of thallium(I) tricyanomethanide Tl[C(CN)3]
- Synthesis, structure characterization and properties of a new oxidovanadium(IV) coordination polymer incorporating bridging (MoO4)2– and (Mo8O26)4– ligands
- Crystal structure of Dy11Ge4.33In5.67 and Tm11Ge4In6 from X-ray single-crystal and powder data
- Crystallisation of phosphates revisited: a multi-step formation process for SrHPO4
- Oxygen evolving reactions catalyzed by different manganese oxides: the role of oxidation state and specific surface area
- Synthesis and structural characterization of a new heterometallicmolybdate coordination polymer based on a µ3-bridging amino alcohol
- Chemically and Light-Driven Coordination-Induced Spin State Switching (CISSS) of a nonheme-iron complex
- Extracting information from X-ray diffraction patterns containing Laue oscillations
- Gadolinium trisilicide − a paramagnetic representative of the YbSi3 type series