High-temperature diffraction experiments and phase diagram of ZrO2 and ZrSiO4
-
Akira Yoshiasa

 ,
Tsubasa Tobase
,
Tsubasa Tobase

Abstract
High-temperature X-ray diffraction (XRD) experiments up to T = 2710 °C have been performed on ZrSiO4 and ZrO2 powders, using the container-less levitation technique. A two-dimensional imaging plate (IP) detector was used for short-time observation. The diffraction data in a wide area was projected in one dimension. The unit cell parameters, thermal expansions, and c/a ratios for ZrSiO4 (space group I41/amd and Z = 4), tetragonal ZrO2 (space group P42/nmc and Z = 2) and cubic ZrO2 (space group
1 Introduction
ZrO2, baddeleyite, with a high melting temperature is one of the major polymorphs of modern ceramic materials such as superionic conductors. The high-temperature polymorphs of ZrO2, the tetragonal and the cubic phase, have been extensively studied and are used in industry. The phase transitions of ZrO2 under high pressure attract much interest in both material and geophysical research [1], [2], [3], [4], [5], [6], [7], [8], [9]. ZrO2 is monoclinic at ambient conditions. At ambient pressure, two high-temperature phases of ZrO2 have been found [10]; a tetragonal structure, space group P42/nmc and a cubic fluorite-type structure, space group
It is very important to investigate the characteristics of minerals existing in ancient age for understanding the history of the Earth. Zircon, ZrSiO4, is the oldest identified mineral formed in the initial stage of the Earth’s crust activity, 3.9–4.4 billion years ago, found in Mt. Narryer and Jack Hills, Western Australia [11, 12]. It is an important refractory material due to its low coefficient of thermal expansion, high thermal shock resistance, and resistance to weathering. Zircon shows a specific structural change under high pressure and high-temperature [13], [14], [15], [16], [17], [18], [19], [20], [21], [22], [23], [24], [25], [26]. A phase transition was observed from zircon to the scheelite-type structure, redite [26], under static high pressure [16, 17, 22], and shock compression [18, 19]. The systematic trend in the thermal expansion coefficients was studied in high-temperature experiments [20]. Natural zircon is affected by metamictization, which is caused by radioactive decay of, mainly, U and Th atoms substituting Zr in the structure. Recrystallization phenomena from metamictic zircon at high-temperatures are reported [21]. Since zircon is resistant to weathering and records structure changes under extreme conditions, clues as to the extreme environment in the history of the Earth such as meteorite impact may be obtained from the investigation of the structural changes at higher temperatures and the phase relationships in the high-temperature region of the SiO2–ZrO2 system [25]. ZrSiO4 decomposes into ZrO2 and SiO2 at T = 1673 (±10) °C [23]. The phase diagram of the SiO2–ZrO2 system was presented by Butterman and Foster [15], in which an immiscibility gap of the liquids was proposed between 2250 and 2430 °C. The origin of this data is uncertain [13]. In general, it is considered that the existence of liquid immiscible phases becomes less probable at high-temperatures due to thermal motion. The coexistence of two liquid phases has not been confirmed in the literature [14].
In this work, we performed high-temperature X-ray diffraction (XRD) and dissolution experiments of ZrSiO4 and ZrO2 powder to confirm the phase diagram. As ZrO2 has an extremely high melting point (2715 °C), the difficulties at high-temperatures lead to problems in selecting suitable container materials to avoid contamination effects. The structural analysis of glass with high solidification points has been advanced significantly with the development of the levitation technique [27, 28], especially in combination with diffraction techniques. Since grain growth occurs at high-temperatures, diffraction measurement in a short-time and projection of a wide range of data to one dimension by a two-dimensional imaging plate (IP) detector are required [29]. The IP detector is highly sensitive to X-rays and used for rapid collection of full powder diffraction patterns. An IP detector was used extensively for high-temperature powder diffraction [29, 30]. The unit cell parameters and unit cell volumes of ZrSiO4 and ZrO2 can be investigated by in-situ observation using laser heating and synchrotron radiation. Sintered spheric samples of pure ZrO2 were heated up to 2710 °C. Pre-transitional behavior in the tetragonal phase before the tetragonal-to-cubic phase transition and thermal expansion properties are discussed based on the unit cell parameters and volumes. The phase diagram of the system SiO2–ZrO2 is proposed based on high-temperature diffraction experiments and quantitative chemical analysis of quenched glass of a melted ZrSiO4 sample obtained in the temperature interval 1700–2400 °C.
2 Experimental section
2.1 Sample preparation
We used ZrSiO4 and ZrO2 powder reagents of 99.9% purity (Furu-uchi Chem. Cltd). For diffraction experiments, the pure ZrSiO4 and ZrO2 powders, a ZrSiO4-platinum mixture and a ZrO2-platinum mixture were used. The platinum mixtures were obtained by adding 20 wt% Pt. The pure powders and mixtures were pressed into cylindrical shape and sintered at T = 1400–1550 °C for 24 h. The sintered samples were shaped into a sphere with a diameter of 2 mm.
2.2 High-temperature diffraction experiments
High-temperature angular dispersive diffraction experiments of ZrSiO4 and ZrO2 were carried out at the BL04B2 beamline at the SPring-8 synchrotron radiation facility, using the laser heating and aerodynamic levitation technique [27], [28], [29]. The energy of the incident X-rays was 61.4 KeV (BL04B2). Each diffraction pattern was measured within about 3 min to avoid grain growth at high-temperature. A two-dimensional IP detector was used and diffraction profiles in wide azimuth angles were projected onto one dimension for Rietveld analysis. Using the Rietveld analysis program [31], we simulated a powder diffraction pattern of each specimen. The sample was set in a shallow nozzle where the sample was aerodynamically levitated. The levitated sample was then heated by a 100-W CO2 laser. The temperature of the sample was monitored by a two-color pyrometer. The temperature was calibrated using the melting temperatures of ZrO2 (2715 °C) and Al2O3 (2072(10) °C). Although error values on the experimental device are within 5 K, temperature fluctuations of about ±30 K were observed due to rotation of the spherical samples. Platinum was also used for temperature calibration for the diffraction experiments in the medium temperature range [29]. The unit cell parameters and volumes of pure ZrSiO4, tetragonal and cubic ZrO2 were determined as a function of temperature. High-temperature XRD experiments for ZrSiO4 in the range from room temperature to 1200 °C were carried out at the Institute for Material Research, Tohoku University, Sendai, Japan. XRD powder patterns were measured using CuKα radiation at 40 kV and 20 mA by using a Rigaku Ultima III X-ray diffractometer and a high-temperature furnace. The temperature was calibrated using the thermal expansion ratio of α-Al2O3. Figure 1 shows the experimental results using synchrotron radiation and the aerodynamic levitation technique (data labeled “synchro”) and the laboratory diffraction methods (data labeled “lab”).
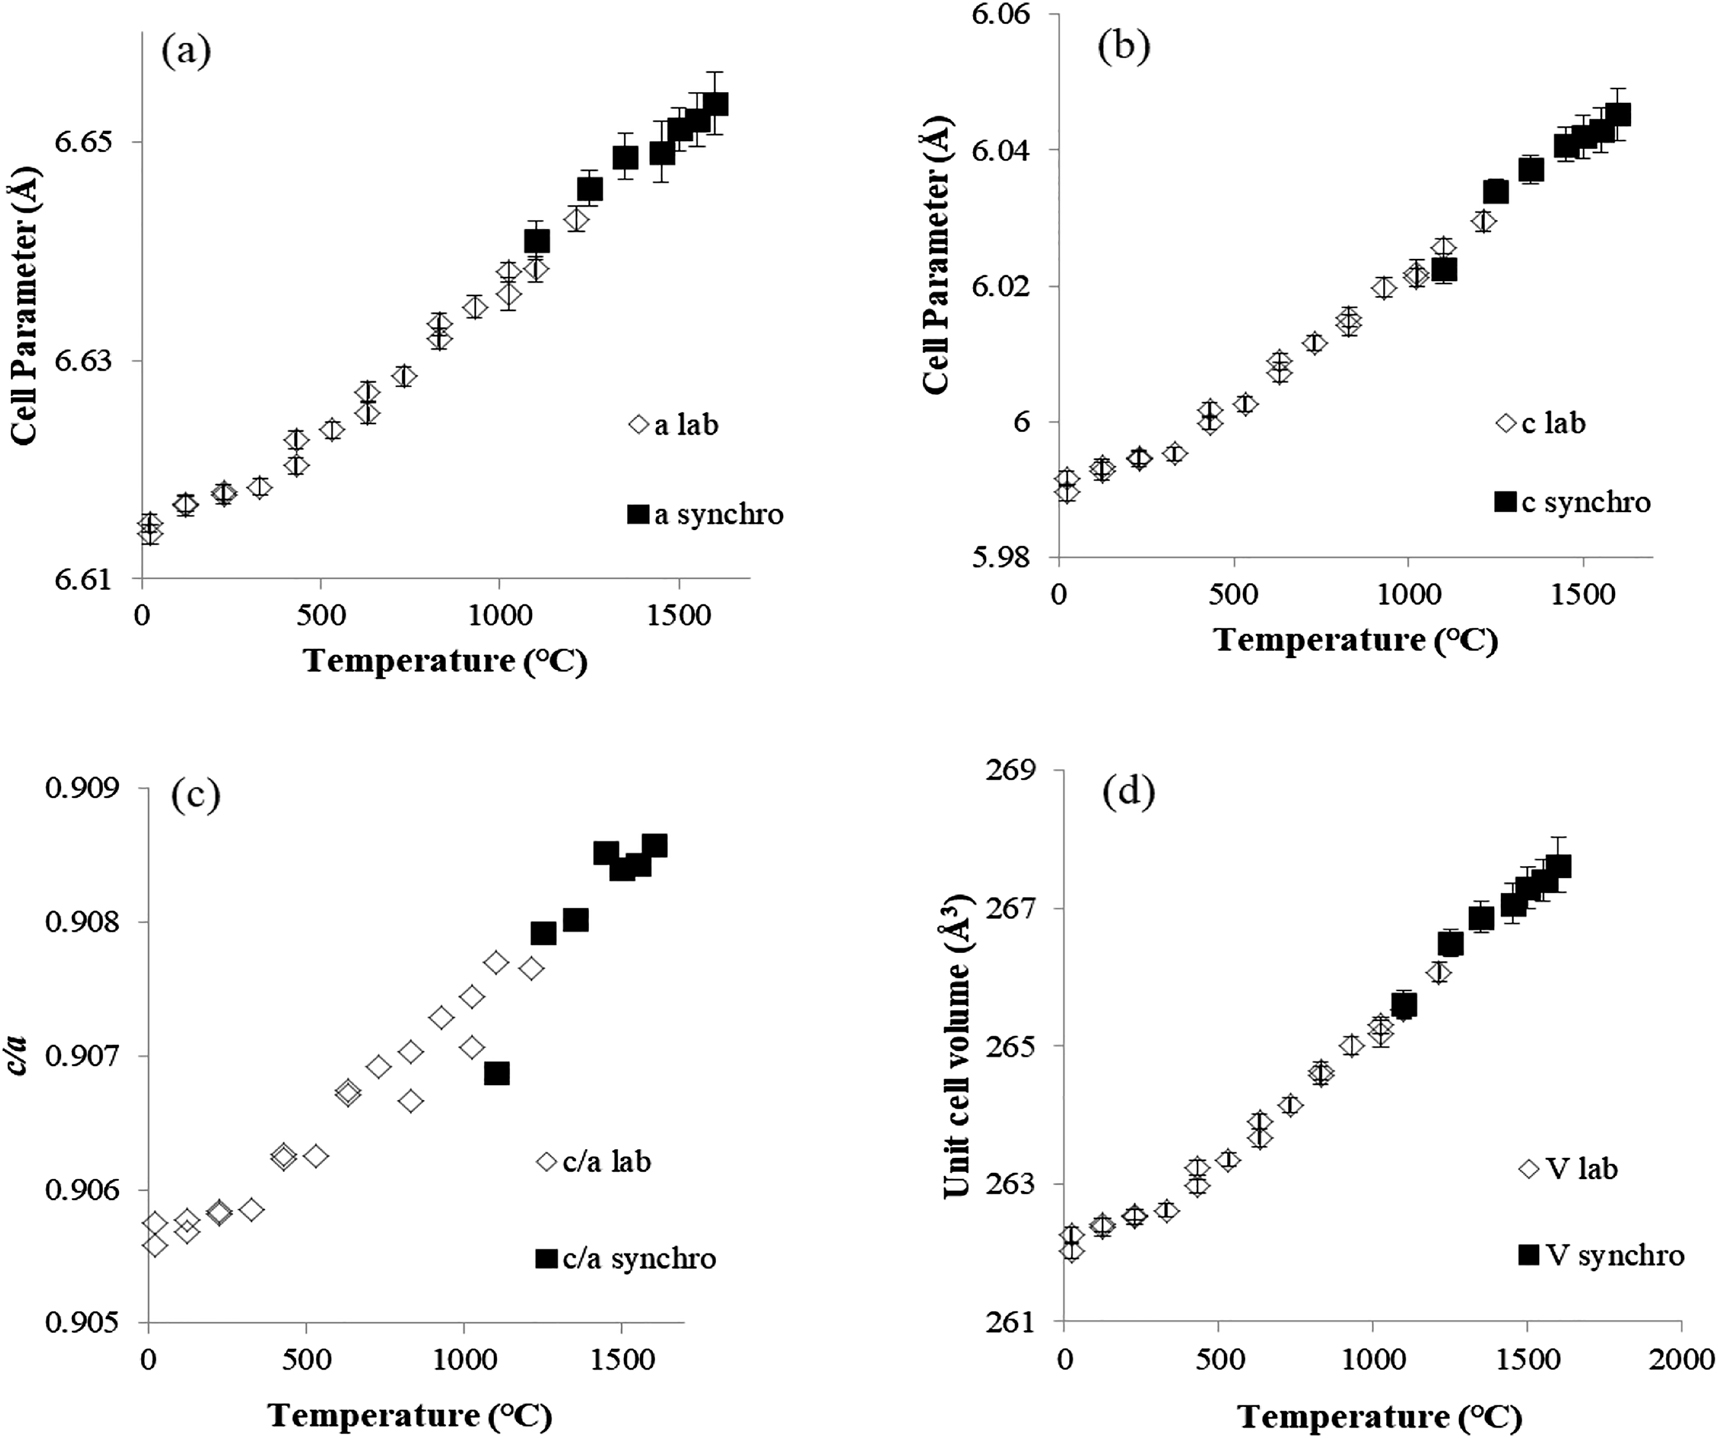
Temperature dependencies of unit cell parameters a (a) and c (b), c/a ratios (c) and unit cell volumes for ZrSiO4 (d). Open diamonds and solid squares show the results using the laboratory diffraction method (lab) and the aerodynamic levitation technique at the synchrotron facility (synchro), respectively.
3 Results and discussion
3.1 Temperature dependence of unit cell parameters and phase transitions of ZrSiO4 and ZrO2
The unit cell parameters, c/a ratios and unit cell volumes for ZrSiO4 (space group I41/amd and Z = 4), tetragonal ZrO2 (space groupe P42/nmc and Z = 2), and cubic ZrO2 (space group
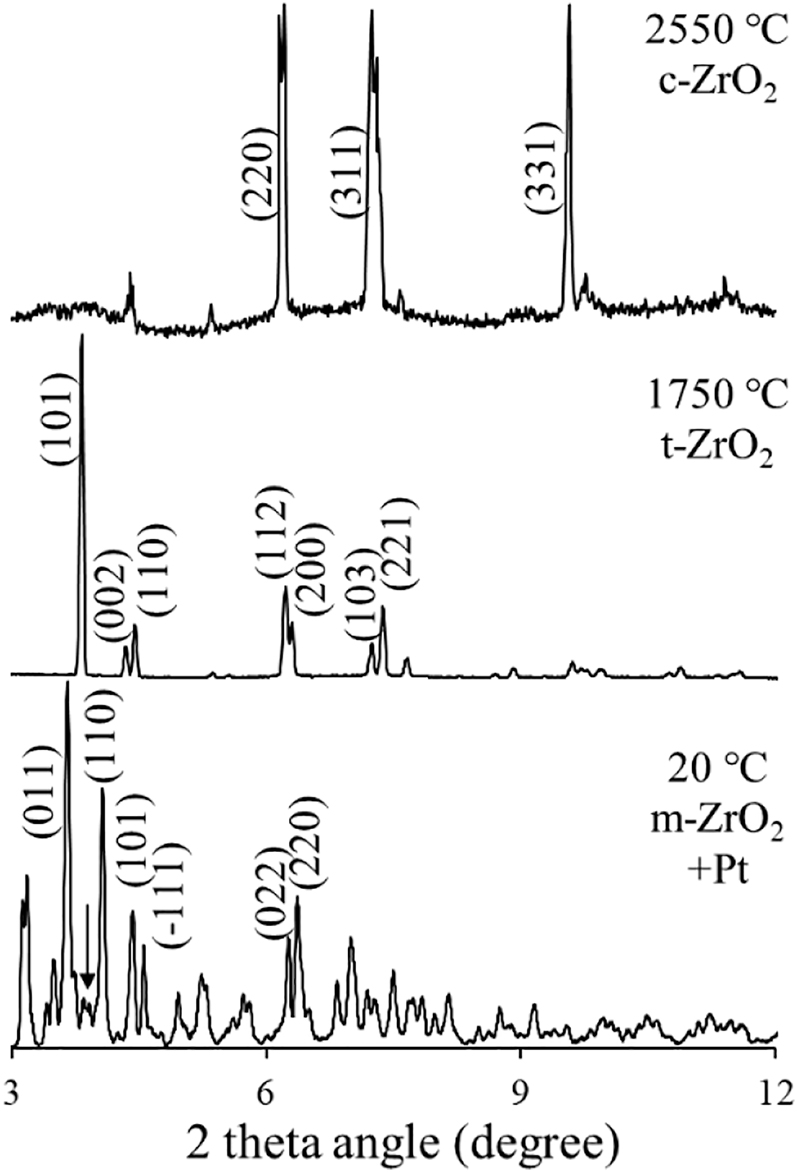
XRD patterns of ZrO2 at various temperatures with representative indices (ZrO2 monoclinic phase at 20 °C, tetragonal phase at 1750 °C and cubic phase at 2550 °C). The wavelength λ is 0.2019 Å.
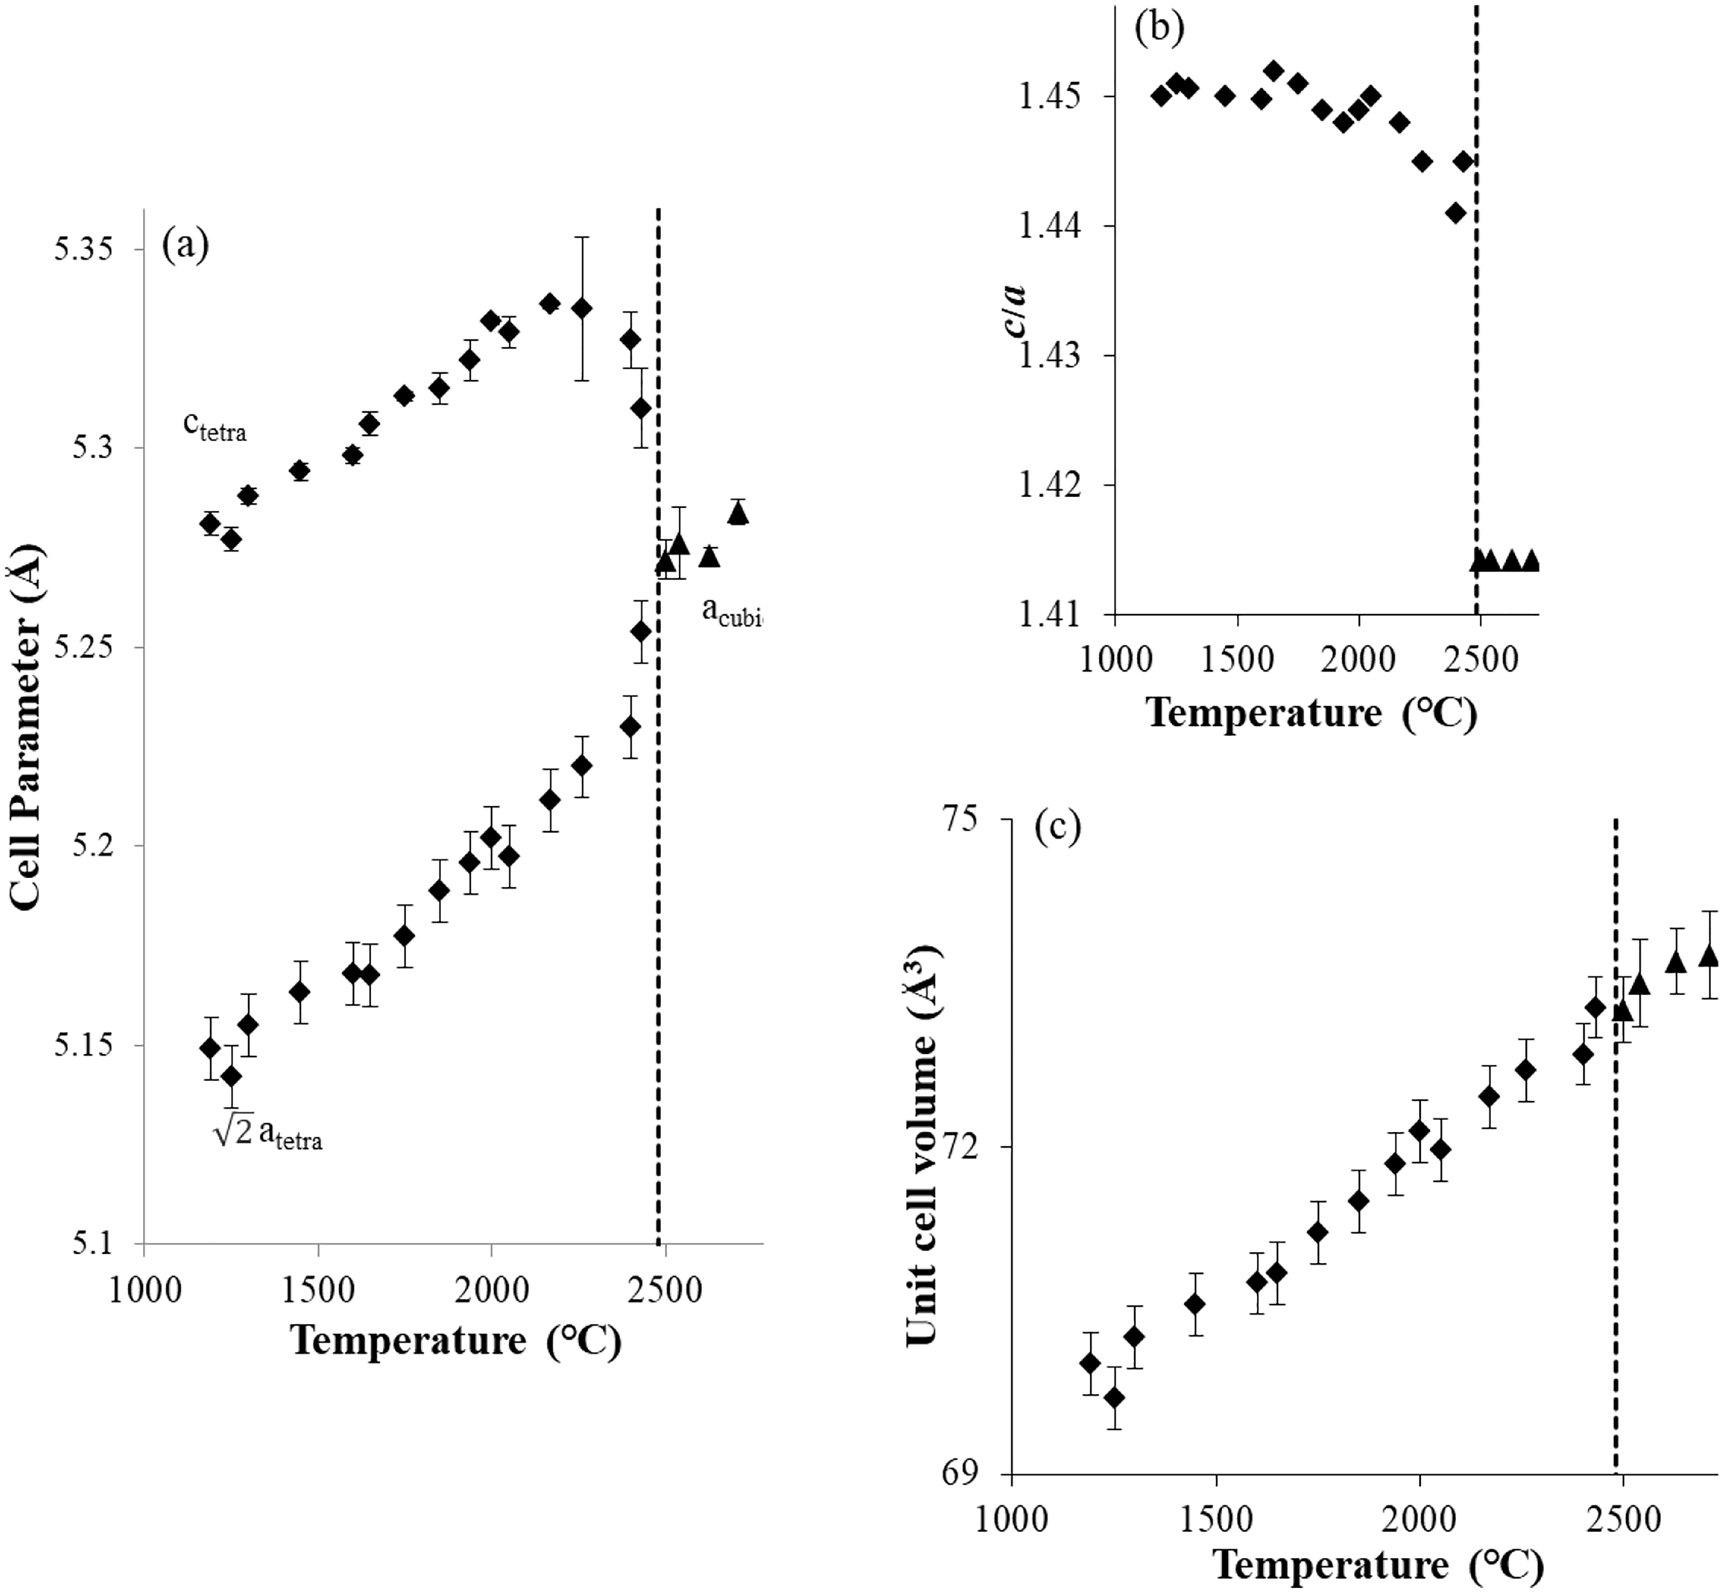
Temperature dependencies of unit cell parameters
The transition temperature of ZrO2 from the tetragonal to the cubic phase is specified between 2430 and 2540 °C (Figure 3). The pre-transition behavior becomes obvious from around 2200 °C on in terms of expansion of the a axis and contraction of the unit cell parameter c. This phenomenon starts from considerably lower temperature than the phase transition points. A similar observation was made for HfO2, which starts from around 1900 °C [29]. In ZrO2, this change starts at a higher temperature and the temperature range of this behavior is narrower than in HfO2.
A decrease of the unit cell volume has been observed at the transition point from the monoclinic phase to the tetragonal phase. The monoclinic-to-tetragonal phase boundary has a negative slope in the P-T phase diagram [1], [2], [3]. The slope of the coexistence line can be estimated based on the Clausius–Clapeyron equation, dP/dT = ΔS/ΔV. ΔV of ZrO2 is negative because the high-temperature tetragonal phase has a higher density than the low temperature monoclinic phase. The tetragonal-to-cubic phase boundary remains unobserved in the P-T phase diagram although the phase boundary is assumed to be negative. A clear unit cell volume change is not observed at the transition point from the tetragonal to the cubic phase (Figure 3c). We propose from this observation that the slope of the phase boundary from the tetragonal to the cubic phase is not negative (Figure 4). In the P-T phase diagram of ZrO2 proposed so far, the phase boundary from the tetragonal to the cubic phase has been shown with a negative slope. In-situ high pressure and high-temperature experiments [3] revealed that the tetragonal phase is stable up to the melting temperature below 12.5 GPa, and that there is no cubic phase in the high-temperature regime. The stoichiometric ZrO2 does not show the cubic structure up to the melting temperature under high pressure. The phase boundary from tetragonal-to-cubic may have a positive slope. According to Ohtaka et al. [3], we propose a revised phase diagram (Figure 4) assuming that the cubic phase does not have a region extending into the high pressure range.
![Figure 4:
Proposed P-T phase relationship for ZrO2 based on the presented experiments and in-situ high pressure and high-temperature measurements [1], [2], [3]. The gray diamonds and black triangles represent the tetragonal and the cubic phase of ZrO2, respectively.](/document/doi/10.1515/znb-2021-0043/asset/graphic/j_znb-2021-0043_fig_004.jpg)
3.2 Chemical composition and phase diagram in the ZrO2-SiO2 system
All recovered samples in our experiments were of pure white color, which excludes oxygen deficiency. Platinum powder gathered in small metal spheres. A representative SEM image of the quenched glass sample of the ZrSiO4 melt at 1800 °C is shown in Figure 5. The volume ratio of glass to ZrO2 crystals is relatively low in the lower temperature region after melting of zircon, whereas the volume ratio of glass increases at higher temperatures. The observed glass regions in the samples were less than 10 μm in width (Figure 5). The electron beam size for energy-dispersive X-ray spectrometry (EDS) analysis is 1 μm and the X-ray excitation region of the analytical point is larger than the beam size. Since the size of the measured points is mostly around 5 μm, the influence of fluorescent X-ray from the surrounding ZrO2 gives a higher content of Zr than is really present depending on the location. The analytical ratios of SiO2 to ZrSiO4 are shown in Figure 6. The analytical ratios with the highest Si content at a temperature below 2200 °C are consistent with the liquidus curve. Considering the reaction time of solid and liquid and the effect of X-ray fluorescence from the surrounding ZrO2, almost the same liquidus curve can be drawn between 1700 and 2200 °C. At 2300 and 2400 °C, we could not observe any liquid immiscibility area, as was proposed by Butterman and Foster [15]. The highest Si contents in glass are 53.3 and 49.1% for samples quenched from 2300 to 2400 °C, respectively, which are in the liquid immiscible area. The liquidus line in our phase diagram is basically consistent with the phase diagram proposed by Butterman and Foster [15] without a two liquids immiscible area. This area of two immiscible liquids at 2250–2430 °C, which is higher than the vaporization temperature of SiO2, may have been proposed from the observation of compositional fluctuations in glass due to volatilization of the SiO2 component from the liquid. We propose a new ZrO2–SiO2 phase diagram (Figure 6) based on the transition point of tetragonal-to-cubic ZrO2 and the chemical analyses of the quenched glass.
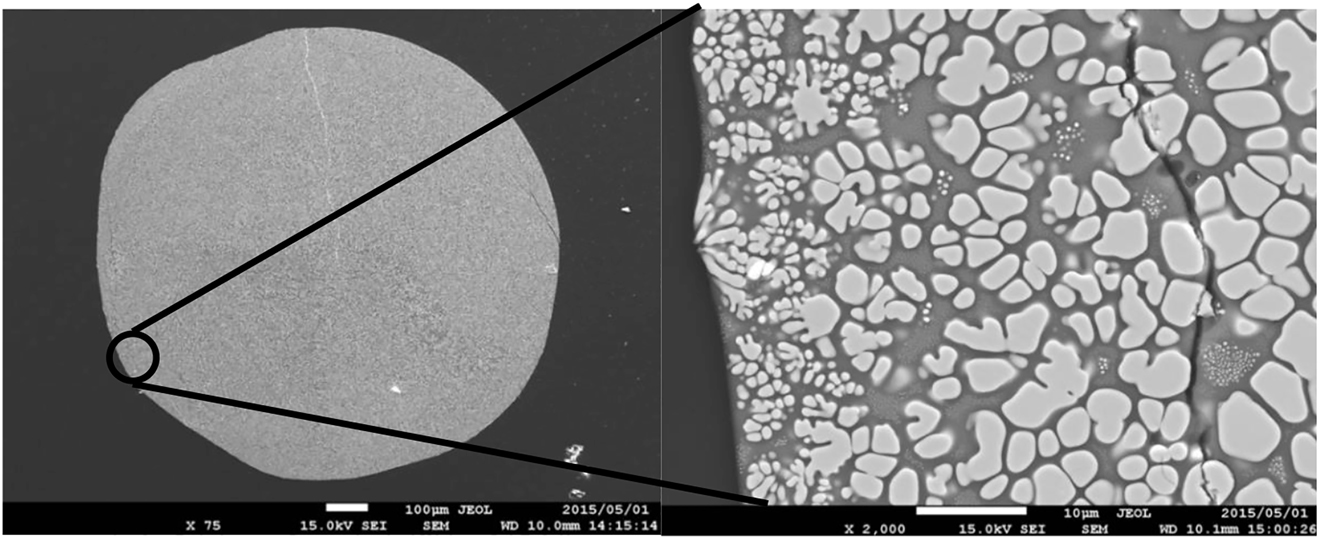
The representative SEM image of the quenched glass sample from ZrSiO4 melt at T = 1800 °C. Dark and bright areas are glass and ZrO2 crystals, respectively.
![Figure 6:
Proposed phase diagram of the SiO2–ZrO2 system revised from Butterman and Foster [15]. The diamonds represent the chemical composition of quenched glasses obtained from several analytical points of recovered samples.](/document/doi/10.1515/znb-2021-0043/asset/graphic/j_znb-2021-0043_fig_006.jpg)
Proposed phase diagram of the SiO2–ZrO2 system revised from Butterman and Foster [15]. The diamonds represent the chemical composition of quenched glasses obtained from several analytical points of recovered samples.
4 Conclusions
In order to confirm a structural change of zircon and baddeleyite at high-temperature, high-temperature experiments of pure ZrSiO4 and ZrO2 were performed by gas flow and laser heating. Gas levitation was used and it has been confirmed that even if zircon, ZrSiO4, and baddeleyite, ZrO2, are melted, oxygen vacancies due to reduction did not occur. In-situ high-temperature powder XRD experiments were performed for ZrSiO4 and ZrO2 to monitor their structural changes. Before the phase transition of ZrO2 from tetragonal-to-cubic, a pre-transition behavior was observed above around 2200 °C. The temperature dependencies of the unit cell parameters, the c/a ratios and characteristics of the phase transition in ZrO2 are very similar to those in HfO2. Based on the SEM analyses of the quenched samples and the XRD experiments, we propose a revised P-T phase diagram of ZrO2 and a revised phase diagram of the ZrO2–SiO2 system.
Dedicated to: Professor Richard Dronskowski of the RWTH Aachen on the accassion of his 60th birthday.
Acknowledgment
We would like to thank Prof. Richard Dronskowski for his valuable discussions on experiments under extreme conditions. The laser heating gas flow experiment was carried out on the BL04B at SPring-8 (Proposal No. 2014B1043).
-
Author contributions: All the authors have accepted responsibility for the entire content of this submitted manuscript and approved submission.
-
Research funding: None declared.
-
Conflict of interest statement: The authors declare no conflicts of interest regarding this article.
References
1. Ohtaka, O., Yamanaka, T., Kume, S., Ito, E., Navrostky, A. J. Am. Ceram. Soc. 1991, 74, 505–509; https://doi.org/10.1111/j.1151-2916.1991.tb04051.x.Suche in Google Scholar
2. Ohtaka, O., Fukui, H., Kunisada, T., Fujisawa, T., Funakoshi, K., Utsumi, W., Irifune, T., Kuroda, K., Kikegawa, T. Phys. Rev. B 2001, 63, 174108; https://doi.org/10.1103/physrevb.63.174108.Suche in Google Scholar
3. Ohtaka, O., Andrault, D., Bouvier, P., Schultz, E., Mezouar, M. J. Appl. Crystallogr. 2005, 38, 727–733; https://doi.org/10.1107/s0021889805018145.Suche in Google Scholar
4. Leger, J. M., Tomaszewski, P. E., Atouf, A., Pereira, A. S. Phys. Rev. B 1993, 47, 14075–14083; https://doi.org/10.1103/physrevb.47.14075.Suche in Google Scholar
5. Yashima, M., Kakihana, M., Yoshimura, M. Solid State Ionics 1996, 86–88, 1131–1149; https://doi.org/10.1016/0167-2738(96)00386-4.Suche in Google Scholar
6. Haines, J., Léger, M., Hull, S., Petitet, J. P., Pereira, A. S., Perottoni, C. A., da Jornada, J. A. H. J. Am. Ceram. Soc. 1997, 80, 1910–1914.10.1111/j.1151-2916.1997.tb03073.xSuche in Google Scholar
7. Bouvier, P., Godlewski, J., Lucazeau, G. J. Nucl. Mater. 2002, 300, 118–126; https://doi.org/10.1016/s0022-3115(01)00756-5.Suche in Google Scholar
8. Akaogi, M., Hashimoto, S., Kojitani, H. Phys. Earth Planet. In. 2018, 281, 1–7; https://doi.org/10.1016/j.pepi.2018.05.001.Suche in Google Scholar
9. Takagi, S., Kyono, A., Kawai, N., Inukai, K., Fukaya, R., Funamori, N., Adachi, S., Ichiyanagi, K. Geophys. Res. Lett. 2020, 47, e2020GL089592; https://doi.org/10.1029/2020gl089592.Suche in Google Scholar
10. Zhang, Y., Chen, H. X., Duan, L., Fan, J. B., Ni, L., Ji, V. J. Alloys Compd. 2018, 749, 283–292; https://doi.org/10.1016/j.jallcom.2018.03.253.Suche in Google Scholar
11. Compston, W., Pidgeon, R. T. Nature 1986, 321, 766–769; https://doi.org/10.1038/321766a0.Suche in Google Scholar
12. Maas, R., Kinny, P. D., Williams, I. S., Froude, D. O., Compston, W. Geochem. Cosmochim. Acta 1992, 56, 1281–1300; https://doi.org/10.1016/0016-7037(92)90062-n.Suche in Google Scholar
13. Curtis, C. E., Sowman, H. G. J. Am. Ceram. Soc. 1953, 36, 190–198; https://doi.org/10.1111/j.1151-2916.1953.tb12865.x.Suche in Google Scholar
14. Toropov, N. A., Galakhov, F. Y. Akad. Nauk SSSR, Izv. Ser. Khim 1956, 2, 158–161.Suche in Google Scholar
15. Butterman, W. C., Foster, W. R. Am. Mineral. 1967, 52, 880–885.Suche in Google Scholar
16. Reid, A. F., Ringwood, A. E. Earth Planet Sci. Lett. 1969, 6, 205–208; https://doi.org/10.1016/0012-821x(69)90091-0.Suche in Google Scholar
17. Liu, L. Earth Planet Sci. Lett. 1979, 44, 390–396; https://doi.org/10.1016/0012-821x(79)90078-5.Suche in Google Scholar
18. Mashim, T., Nagayama, K., Sawaoka, A. Phys. Chem. Miner. 1983, 9, 237–247; https://doi.org/10.1007/bf00309573.Suche in Google Scholar
19. Kusaba, K., Syono, Y., Kikuchi, M., Fukuoka, K. Earth Planet Sci. Lett. 1985, 72, 433–439; https://doi.org/10.1016/0012-821x(85)90064-0.Suche in Google Scholar
20. Subbarao, E. C., Agrawal, D. K., McKinstry, H. A., Sallese, C. W., Roy, R. J. Am. Ceram. Soc. 1990, 73, 1246–1252; https://doi.org/10.1111/j.1151-2916.1990.tb05187.x.Suche in Google Scholar
21. Mursic, Z., Vogt, T., Frey, F. Acta Crystallogr. 1992, B48, 584–590; https://doi.org/10.1107/s0108768192002982.Suche in Google Scholar
22. Tange, Y., Takahashi, E. Phys. Earth Planet. In. 2004, 143–144, 223–229; https://doi.org/10.1016/j.pepi.2003.10.009.Suche in Google Scholar
23. Kaiser, A., Lobert, M., Telle, R. J. Eur. Ceram. Soc. 2008, 28, 2199–2211; https://doi.org/10.1016/j.jeurceramsoc.2007.12.040.Suche in Google Scholar
24. Timms, N. E., Erickson, T. M., Pearce, M. A., Cavosie, A. J., Schmieder, M., Tohver, E., Reddy, S. M., Zanetti, M. R., Nemchin, A. A., Wittmann, A. Earth Sci. Rev. 2017, 165, 185–202; https://doi.org/10.1016/j.earscirev.2016.12.008.Suche in Google Scholar
25. Tomioka, N., Miyahara, M. Meteoritics Planet Sci. 2017, 52, 2017–2039; https://doi.org/10.1111/maps.12902.Suche in Google Scholar
26. Tokuda, M., Yoshiasa, A., Kojitani, H., Hashimoto, S., Uehara, S., Mashimo, T., Tobase, T., Akaogi, M. Mineral. Mag. 2019, 83, 561–567; https://doi.org/10.1180/mgm.2019.27.Suche in Google Scholar
27. Kohara, S., Suzuya, K. J. Jpn. Soc. Synchr. Rad. Res. 2001, 14, 365–375.Suche in Google Scholar
28. Kohara, S., Itou, M., Suzuya, K., Imamura, Y., Sakurai, Y., Ohishi, Y., Takata, M. J. Phys. Condens. Matter 2007, 19, 506101; https://doi.org/10.1088/0953-8984/19/50/506101.Suche in Google Scholar
29. Tobase, T., Yoshiasa, A., Arima, H., Sugiyama, K., Ohtaka, O., Nakatani, T., Funakoshi, K., Kohara, S. Phys. Status Solidi B 2018, 255, 1800090. https://doi.org/10.1002/pssb.201800090.Suche in Google Scholar
30. Mezouar, M., Faure, P., Crichton, W., Rambert, N., Sitaud, B., Bauchau, S., Blattmann, G. Rev. Sci. Instrum. 2002, 73, 3570–3574; https://doi.org/10.1063/1.1505104.Suche in Google Scholar
31. Izumi, F., Asano, H., Murata, N., Watanabe, N. J. Appl. Crystallogr. 1987, 20, 416–418; https://doi.org/10.1107/s0021889887086382.Suche in Google Scholar
© 2021 Walter de Gruyter GmbH, Berlin/Boston
Artikel in diesem Heft
- Frontmatter
- In this issue
- Laudatio/Preface
- Celebrating the 60th birthday of Richard Dronskowski
- Review
- Orbital-selective electronic excitation in phase-change memory materials: a brief review
- Research Articles
- Solving the puzzle of the dielectric nature of tantalum oxynitride perovskites
- d- and s-orbital populations in the d block: unbound atoms in physical vacuum versus chemical elements in condensed matter. A Dronskowski-population analysis
- Single-crystal structures of A 2SiF6 (A = Tl, Rb, Cs), a better structure model for Tl3[SiF6]F, and its novel tetragonal polymorph
- Na2La4(NH2)14·NH3, a lanthanum-rich intermediate in the ammonothermal synthesis of LaN and the effect of ammonia loss on the crystal structure
- Linarite from Cap Garonne
- Salts of octabismuth(2+) polycations crystallized from Lewis-acidic ionic liquids
- High-temperature diffraction experiments and phase diagram of ZrO2 and ZrSiO4
- Thermal conversion of the hydrous aluminosilicate LiAlSiO3(OH)2 into γ-eucryptite
- Crystal structure of mechanochemically prepared Ag2FeGeS4
- Effect of nanostructured Al2O3 on poly(ethylene oxide)-based solid polymer electrolytes
- Sr7N2Sn3: a layered antiperovskite-type nitride stannide containing zigzag chains of Sn4 polyanions
- Exploring the frontier between polar intermetallics and Zintl phases for the examples of the prolific ALnTnTe3-type alkali metal (A) lanthanide (Ln) late transition metal (Tn) tellurides
- Zwitterion coordination to configurationally flexible d 10 cations: synthesis and characterization of tetrakis(betaine) complexes of divalent Zn, Cd, and Hg
- An approach towards the synthesis of lithium and beryllium diphenylphosphinites
- Synthesis, crystal and electronic structure of CaNi2Al8
- Crystal and electronic structure of the new ternary phosphide Ho5Pd19P12
- Synthesis, structure, and magnetic properties of the quaternary oxysulfides Ln 5V3O7S6 (Ln = La, Ce)
- Synthesis, crystal and electronic structure of BaLi2Cd2Ge2
- Structural variations of trinitrato(terpyridine)lanthanoid complexes
- Preparation of CoGe2-type NiSn2 at 10 GPa
- Controlled exposure of CuO thin films through corrosion-protecting, ALD-deposited TiO2 overlayers
- Experimental and computational investigations of TiIrB: a new ternary boride with Ti1+x Rh2−x+y Ir3−y B3-type structure
- Synthesis and crystal structure of the lanthanum cyanurate complex La[H2N3C3O3]3 · 8.5 H2O
- Cd additive effect on self-flux growth of Cs-intercalated NbS2 superconducting single crystals
- 14N, 13C, and 119Sn solid-state NMR characterization of tin(II) carbodiimide Sn(NCN)
- Superexchange interactions in AgMF4 (M = Co, Ni, Cu) polymorphs
- Copper(I) iodide-based organic–inorganic hybrid compounds as phosphor materials
- On iodido bismuthates, bismuth complexes and polyiodides with bismuth in the system BiI3/18-crown-6/I2
- Synthesis, crystal structure and selected properties of K2[Ni(dien)2]{[Ni(dien)]2Ta6O19}·11 H2O
- First low-spin carbodiimide, Fe2(NCN)3, predicted from first-principles investigations
- A novel ternary bismuthide, NaMgBi: crystal and electronic structure and electrical properties
- Magnetic properties of 1D spin systems with compositional disorder of three-spin structural units
- Amine-based synthesis of Fe3C nanomaterials: mechanism and impact of synthetic conditions
- Enhanced phosphorescence of Pd(II) and Pt(II) complexes adsorbed onto Laponite for optical sensing of triplet molecular dioxygen in water
- Theoretical investigations of hydrogen absorption in the A15 intermetallics Ti3Sb and Ti3Ir
- Assembly of cobalt-p-sulfonatothiacalix[4]arene frameworks with phosphate, phosphite and phenylphosphonate ligands
- Chiral bis(pyrazolyl)methane copper(I) complexes and their application in nitrene transfer reactions
- UoC-6: a first MOF based on a perfluorinated trimesate ligand
- PbCN2 – an elucidation of its modifications and morphologies
- Flux synthesis, crystal structure and electronic properties of the layered rare earth metal boride silicide Er3Si5–x B. An example of a boron/silicon-ordered structure derived from the AlB2 structure type