The effects of a single dialysis session on serum hepcidin levels
-
Hamdi Oğuzman

 ,
Buket Kın Tekçe
,
Hikmet Tekçe
und
Güler Buğdaycı
,
Buket Kın Tekçe
,
Hikmet Tekçe
und
Güler Buğdaycı

Abstract
Objectives
Hepcidin plays an important role in regulating iron metabolism. Elevated levels of hepcidin in renal failure contribute to the development of anemia. We aimed to evaluate the association between hepcidin and inflammation in hemodialysis patients and how dialysis affects hepcidin levels.
Methods
Hepcidin clearance with hemodialysis was investigated by measuring hepcidin concentrations by enzyme-linked immunosorbent assay (ELISA) method before and after hemodialysis of 40 patients in a single dialysis session. Hemogram parameters and ferritin, iron, total iron binding capacity (TIBC), and C-reactive protein (CRP) were measured and evaluated their relations with predialysis hepcidin levels.
Results
Hepcidin levels decreased significantly with dialysis treatment (p=0.009). Median hepcidin concentration before dialysis was measured as 330 ng/mL (83–459) and post-dialysis median hepcidin concentration was 250 ng/mL (94–384). There was a significant correlation between predialysis hepcidin levels and ferritin (r=0.858, p<0.001), TIBC (r=−0.451, p=0.004), and MCV (r=0.384, p=0.016). It was found that increases in ferritin levels in time were positively correlated with hepcidin before dialysis.
Conclusions
We think that understanding the removal of the hepcidin by dialysis, which causes a decrease in the amount of iron available in the anemia, is important in managing future therapy.
Introduction
Chronic kidney disease (CKD) is an increasing public health issue worldwide, and anemia is a frequent complication in CKD patients [1]. Anemia occurs mainly in the majority of CKD patients due to erythropoietin (EPO) and iron deficiency [2, 3]. Anemia causes a significant decrease in the patient’s quality of life and leads to undesirable clinical problems [4]. Significant studies show the relationship between hepcidin-inflammation and hepcidin-anemia [5, 6]. Hepcidin is a 25 amino acids peptide that is mainly synthesized and released into the blood by hepatocytes and regulated by hypoxia/anemia, erythropoietic activity, iron status and inflammation status [7]. Hepcidin concentration is generally increased in CKD patients [8]. Elevated hepcidin results in the development of iron-restricted erythropoiesis by preventing the absorption and release of intestinal iron from storage areas (reticuloendothelial system) and has a significant impact on the pathophysiology of anemia in patients with CKD [9]. Reduced hepcidin concentration has also improved iron homeostasis and anemia [10].
Residual renal function, iron stores, erythropoiesis, and inflammation are thought to be related to hepcidin concentrations observed in CKD. Studies in adult CKD patients revealed an inverse association between hepcidin and glomerular filtration rate (GFR), and patients who depend on dialysis had the highest serum hepcidin levels [11, 12]. Hepcidin levels in CKD are thought to be higher due to impaired renal clearance of circulating hepcidin and increased systemic inflammation. Observational studies have demonstrated that the variations in hepcidin concentrations in CKD cannot be fully explained by GFR and inflammatory cytokines alone. However, it is thought that other possible factors, such as changes in iron stores of the patients, especially ferritin levels, which show iron store status, and changes in hemoglobin (Hb) levels, play a role in the increase of hepcidin [13].
The aim of this study was to investigate the effects of hemodialysis (HD) on hepcidin levels, which is thought to be the key regulator of iron metabolism in HD patients, and the relationships between anemia and inflammation with hepcidin.
Materials and methods
This study was carried out between January 2017 and July 2017 at Abant Izzet Baysal University (AIBU) Faculty of Medicine, Department of Medical Biochemistry. The study was approved by the AIBU Faculty of Medicine Clinical Ethics Committee (Date: 08/12/2016, Decision no: 225), and all participants signed informed consent papers before enrolling in the trial.
The study excluded individuals with anemia unrelated to iron deficiency, recent blood transfusions within the past four months, confirmed cases of malignancy, patients outside the age range of 18–70, active infections, individuals with both heart failure and severe endocrine disorders, advanced liver disease, chronic obstructive pulmonary disease (COPD), and individuals with a recent history of hospitalization or antibiotic usage within the past four months.
Blood was taken from the patients immediately after the dialysis procedure. The samples for routine biochemistry and enzyme-linked immunosorbent assay (ELISA) analysis were collected into BD Vacutainer® SST™ II Advance Tubes, and the samples for complete blood count analysis were collected into BD Vacutainer® K2EDTA Tubes (Becton, Dickinson and Company, Plymouth, UK). Serum hepcidin measurements were performed from the blood samples taken immediately before HD onset and after the dialysis was completed. Other parameters (C-reactive protein (CRP), creatinine, ferritin, hematocrit (Hct), Hb, iron, mean corpuscular volume (MCV), red blood cell (RBC), total iron binding capacity (TIBC) and urea) were measured in their predialysis blood. The data of the dialysis process were obtained from the HD unit records. Changes in hepcidin levels before and after dialysis were compared. The relationship between hepcidinpre with other parameters and dialysis parameters was examined. Previous ferritin, Hb, iron, MCV, RBC, and TIBC values were obtained from hospital records according to the study date of the patients one, two, and six months ago. The relationship between the change values of these parameters and hepcidinpre was evaluated.
Blood samples were routinely centrifuged at 1,500 g for 10 min, and their supernatant was separated. For a complete blood count, samples were mixed for 10 min and then run on a Cell Dyn 3700 (Abbott, IL, USA) instrument. Creatinine, CRP, iron, TIBC, and urea measurements were performed on the Architect c8000 (Abbott, IL, USA) autoanalyzer; ferritin measurements were performed on the Architect i2000SR (Abbott, IL, USA) according to the manufacturer’s instructions.
All patients have been treated with Fresenius 4008 B (Bad Homburg, Germany) dialysis device with a dialysate flow of 500 mL/min for an average of 4 h.
TIBC was calculated using the sum of iron and iron binding capacity values. Transferrin saturation (TSAT) was calculated using the formula [(Iron value)/(TIBC value) × 100]. Kt/V urea is obtained by dividing the amount of plasma cleared from urea by the urea dispersion volume. K: The clearance specified in the package insert calculated by the manufacturer in vitro conditions. T: The duration of the dialysis session in minutes. V: The distribution volume of the urea, based on dry body weight, 55–60 % of the total body fluid is calculated by movement. The Kt/V urea value was calculated using the Daugirdas formula [14]. Delta (Δ) ferritin rates indicate the rate of change in ferritin levels between two different time points and were calculated using the following formula: [(current ferritin value) − (previous ferritin value)/(previous ferritin value) × 100]. The Δ ferritin rates for 1, 2, and 6 months were calculated and were compared with hepcidinPre.
For the measurement of hepcidin, serum was separated from samples in serum separator tubes containing a coagulation activator. Aliquoted sera were stored at −80 °C. Serum samples gradually thawed on the same day were used to measure hepcidin amounts. Hepcidin measurements were performed according to the manufacturer’s instructions using the commercial ELISA kit (catalog number: CSB-E13062h, Cusabio Biotech, Wuhan, PRC). The measurement range of the kit was 12.5–400 ng/mL, sensitivity was 6.25 ng/mL, intra-assay precision CV was <15 %, and inter-assay CV<15 %. Samples with results outside the linear range were reanalyzed by diluting. To calculate the hepcidin reduction rate, which shows the amount of hepcidin exchanged by dialysis, we used the formula [(HepcidinPre – HepcidinPost)/HepcidinPre × 100].
Statistical analysis
In order to determine the required minimum sample size before the study, in the trial design, in which the difference between the groups will be determined, type I error probability (α)=0.05, power (1 − β)=0.80 criteria and f (effect size)=0.52, we calculated that a minimum of 33 individuals would be sufficient for participation in the study. PASS 11 and G*Power Version 3.1.9.2 statistical programs were used for power analysis [15]. The Kolmogorov-Smirnov test examined the acceptability of numerical variables for normal distribution. Descriptive statistics for numerical variables were expressed as mean±standard deviation. Parameters without a normal distribution were expressed as median (1st–3rd quartile). The mean values between the two variables were compared by the student-t test in normal distribution parameters and the Mann-Whitney U test in non-normal distribution parameters. Pearson’s correlation with normal distribution and Spearman’s correlation analysis for non-normally distributed data examined the linear relationship between the two variables. A correlation analysis was conducted between Δ ferritin rates and hepcidin levels, utilizing data from 30 individuals for whom pre-hospitalization ferritin results were available. Stepwise regression analysis was used to investigate the relationship between multiple variables. The logarithm of the data that did not exhibit normal distribution was analyzed in the stepwise regression analysis. The Wilcoxon signed-rank test performed the comparison of hepcidin levels before and after dialysis because the hepcidin level was not normally distributed. Results were evaluated in a 95 % confidence interval, and p<0.05 was accepted as significant. Statistical analysis was performed using SPSS Statistical Software (ver. 23; Chicago, IL).
Results
It was evaluated in this study the results of 40 patients with CKD who were followed in the HD Unit: 16 females (age 58.6±16.7 years) and 24 males (age 66.4±8.9 years). The patients underwent hemodialysis three times a week, with an average duration of 27±21 months. The demographic data of the patients are presented in Table 1.
Demographic, laboratory, and hemodialysis data of patients and correlation analysis results hepcidinPre and other parameters.
| n | Results | Correlation between HepcidinPre and other parameters | ||
|---|---|---|---|---|
| p-Value | r | |||
| Sex (males/females), n | 40 | 16/24 | – | – |
| Age, years | 40 | 62.9±13.4 | 0.081 | −0.283 |
| Height, cm | 40 | 165 (151–170) | 0.045 | −0.322 |
| Weight (predialysis), kg | 35 | 74.5±17.6 | 0.194 | −0.225 |
| Weight (postdialysis), kg | 27 | 73.6±14.9 | – | – |
| Dry weight, kg | 34 | 72.3±17.5 | 0.445 | −0.153 |
| Kt/Vurea | 30 | 1.63±0.3 | 0.347 | 0.178 |
| Ultrafitrate, mL | 35 | 3,000 (2,100–3,500) | 0.564 | −0.101 |
| URR, % | 30 | 0.73 (0.69–0.78) | 0.230 | 0.226 |
| Venous pressure, mmHg | 34 | 144±36 | 0.911 | −0.020 |
| Creatinine, mg/dL | 40 | 7.55±2.64 | 0.155 | −0.232 |
| CRP, mg/L | 40 | 8.0 (2.0–22.7) | 0.428 | 0.131 |
| Ferritin, ng/mL | 40 | 369 (94–513) | <0.001 | 0.858 |
| Hb, g/dL | 40 | 10.66±1.66 | 0.626 | −0.081 |
| Hematocrit, % | 40 | 31.9±5.0 | 0.384 | −0.143 |
| HepcidinPre, ng/mL | 39 | 330 (83–458) | 0.009 a | – |
| HepcidinPost, ng/mL | 39 | 250 (94–384) | – | – |
| Iron, µg/dL | 40 | 61.1±24.6 | 0.279 | 0.178 |
| MCV, fL | 40 | 89 (85–93) | 0.016 | 0.384 |
| RBC, 106/µL | 40 | 3.53 (3.26–3.90) | 0.249 | −0.189 |
| TIBC, µg/dL | 40 | 220±50 | 0.004 | −0.451 |
| TSAT, % | 40 | 27.6 (19.3–34.1) | 0.039 | 0.332 |
| Urea, mg/dL | 40 | 131±37 | 0.815 | −0.039 |
-
CRP, C-reactive protein; Hb, hemoglobin; HepcidinPre, predialysis hepcidin; HepcidinPost, postdialysis hepcidin; MCV, mean corpuscular volume; RBC, red blood cell; TIBC, total iron binding capacity; TSAT, transferrin saturation, URR, Urea Reduction Ratio. aWilcoxon-signed ranked test result between HepcidinPre and HepcidinPost. Spearman correlation analysis was performed. The values highlighted in bold are p<0.05, indicating statistical significance.
The mean decrease in the hepcidin values after dialysis was 9.88 % (p=0.009). Changes in the level of hepcidin are shown in Figure 1. No significant relationship was found between hepcidin change and Kt/V urea (p>0.05).
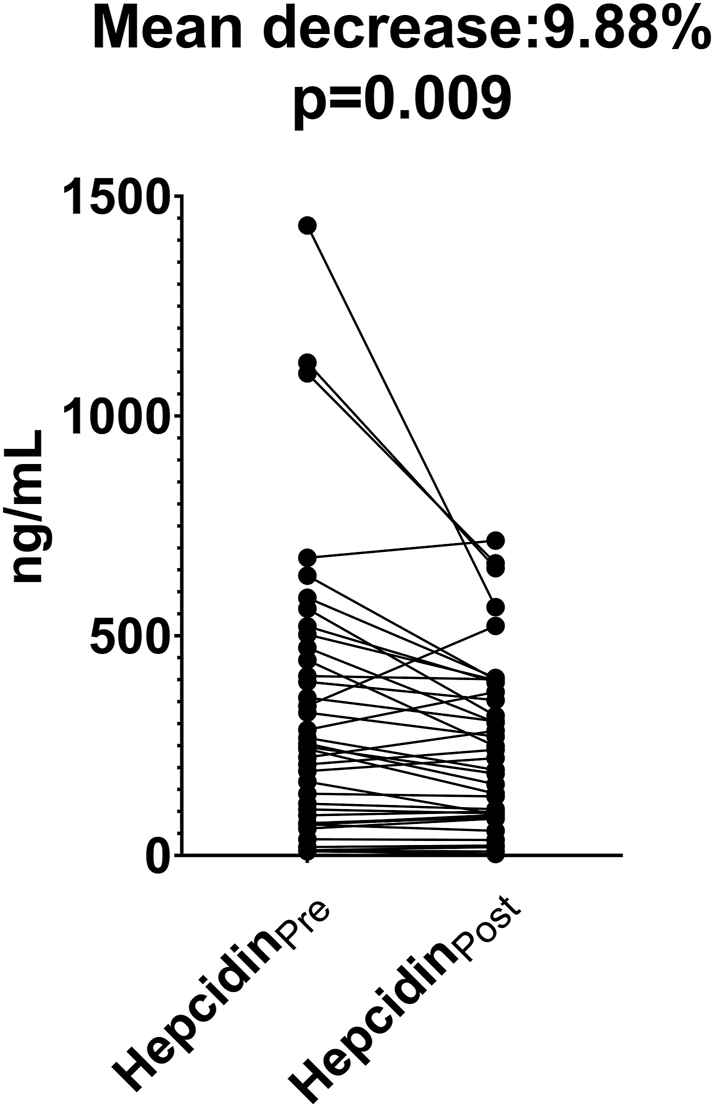
Comparison of changes in hepcidin levels before and after hemodialysis. HepcidinPre, predialysis hepcidin; HepcidinPost, postdialysis hepcidin. HepcidinPre and HepcidinPost were compared using Wilcoxon signed-rank test.
Spearman correlation analysis was used to investigate the association between hepcidinPre with iron metabolism and anemia parameters. Hepcidin levels were positively correlated with ferritin, MCV, and TSAT and negatively correlated with TIBC. There was no significant correlation with iron, Hb, Hct, and RBC values (p>0.05). Figure 2 shows the relationships of hepcidin with ferritin, TIBC, TSAT, and MCV.
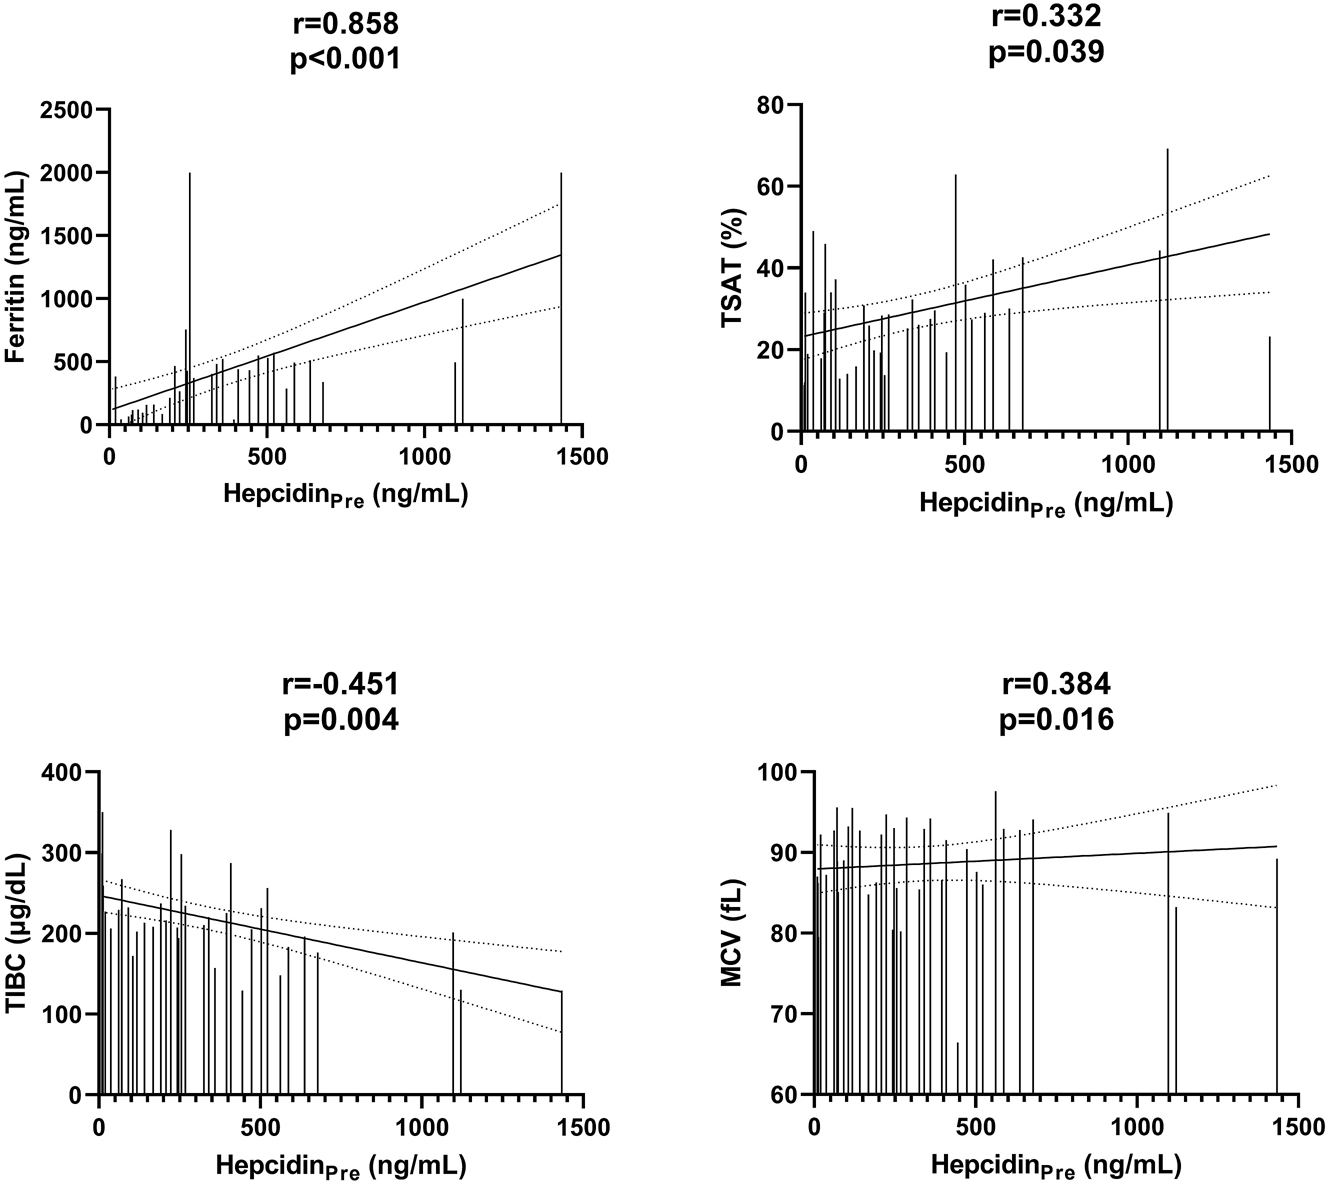
Correlations between HepcidinPre and other variables. HepcidinPre, predialysis hepcidin; HepcidinPost, postdialysis hepcidin; MCV, mean corpuscular volume; TIBC, total iron binding capacity; TSAT, transferrin saturation. Spearman correlation analysis was performed.
Spearman correlation analysis also considered the correlation of basal hepcidin levels with one, two, and six months Δ rates for ferritin, Hb, iron, MCV, RBC, and TIBC before dialysis. Hepcidin levels correlated significantly (r=0.443, p=0.014, r=0.508, p=0.004, and r=0.398, p=0.032, respectively) with Δ ferritin rates at one, two, and six months. No significant correlation was found between the other parameters and hepcidin levels. The data obtained are shown in Figure 3. There was no correlation between CRP and ferritin (r=0.232, p=0.156).
![Figure 3:
Correlations between HepcidinPre and ferritin changes. HepcidinPre, predialysis hepcidin. FerritinΔ indicates the rate of change in ferritin levels between two different time points and was calculated using the following formula: [(current ferritin value) − (previous ferritin value)/(previous ferritin value) × 100]. FerritinΔ1: 1-month ferritin change rate, FerritinΔ2: 2-month ferritin change rate, FerritinΔ6: 6-month ferritin change rate. Spearman correlation analysis was performed.](/document/doi/10.1515/tjb-2023-0009/asset/graphic/j_tjb-2023-0009_fig_003.jpg)
Correlations between HepcidinPre and ferritin changes. HepcidinPre, predialysis hepcidin. FerritinΔ indicates the rate of change in ferritin levels between two different time points and was calculated using the following formula: [(current ferritin value) − (previous ferritin value)/(previous ferritin value) × 100]. FerritinΔ1: 1-month ferritin change rate, FerritinΔ2: 2-month ferritin change rate, FerritinΔ6: 6-month ferritin change rate. Spearman correlation analysis was performed.
In order to ensure the normal distribution of CRP and ferritin values, which were not normally distributed, log values were used. The effect of age, logCRP, iron, creatinine, logFerritin, Hb, MCV, and TIBC on determining hepcidin level was analyzed by stepwise regression analysis. In the model, logCRP, logFerritin, and TIBC were shown to affect hepcidin levels (adjusted R2=0.896) (Table 2). Among these variables, logFerritin, TIBC, and logCRP were significant independent determinants of hepcidin (β=0.825, β=−0.007, and β=−0.198, respectively) (Table 2).
Model for prediction of hepcidin level (Stepwise linear regression analysis).
| β±SE | p-Value | |
|---|---|---|
| logFerritin | 0.825±0.073 | <0.001 |
| TIBC | −0.007±0.002 | <0.001 |
| logCRP | −0.198±0.074 | 0.013 |
-
HepcidinPre=2.855 + 0.825 * logFerritin − 0.007 * TIBC − 0.198 * logCRP (R=0.947, R2=0.896, adjusted R2=0.884). CRP, C-reactive protein; TIBC, total iron binding capacity; SE, standard error.
Discussion
It was investigated in this study how hepcidin levels change with HD, which factors have a role in regulating hepcidin level, and the relation of predialysis hepcidin with the parameters of inflammation and especially iron metabolism parameters. It was shown that hepcidin level decreased significantly with HD, and predialysis hepcidin level was associated with iron binding capacity, MCV, and especially ferritin level.
It was found that HD decreases the concentration of circulating hepcidin (hepcidinPre: 330 (1st–3rd quartiles: 83–59) and hepcidinPost: 250 (1st–3rd quartiles: 94–384), p=0.009). The mean decrease in hepcidin values after dialysis was 9.88 % compared to predialysis hepcidin values. There are limited studies investigating the effect of a single dialysis session on hepcidin levels [16, 17]. In these studies, it was shown that hepcidin levels decreased significantly with dialysis procedures. However, no significant correlation was found between the decrease in hepcidin concentration and the Kt/V urea value, which shows the ratio of urea cleared plasma to urea dispersion volume (r=0.079, p=0.658). In a study conducted in pediatric and adult HD patients, it was shown that the circulating amount of HD and hepcidin decreased and there was no relationship between Kt/V urea value and hepcidin clearance [16]. There are also studies showing that hepcidin clearance is associated with Kt/V urea [17]. The reason why there is no significant relationship between dialysis aggressiveness and decrease in hepcidin levels may be the concentration of a substance gets too low during the dialysis process and the more aggressive dialysis process will not be able to remove more substance [18]. Therefore, the increase in Kt/V urea may not be proportional to the decrease in the substance concentration.
On the other hand, not all hepcidin is free in circulation; some are transported in a bound form [19]. This factor may be why hepcidin kinetics do not match the kinetics of a molecule such as urea that can freely disperse in the entire extracellular compartment. Although studies have shown that hepcidin is removed from circulation with HD, the factors affecting it have not been fully elucidated yet. Further studies are needed to reveal the kinetics of hepcidin in HD patients. Our study is one of a limited number of studies evaluating the effect of single-session dialysis on hepcidin.
Although many studies in the literature show a strong correlation between hepcidin levels and ferritin and TSAT [11, 20, 21], a few studies do not [22]. In animal [23] and culture studies [24], it has been shown that hepcidin decreases intestinal absorption of iron by increasing ferroportin degradation and prevents the efflux of iron from cells such as hepatocytes and macrophages into the blood circulation [25]. Hepcidin levels correlated with ferritin, TSAT, and TIBC levels (r=0.858, p<0.001; r=0.332, p=0.039, r=−0.451, p=0.004, respectively) (Figure 2), which was consistent with the aspect that hepcidin regulated by iron stores and iron levels. This finding is consistent with the claim that hepcidin levels reflect systemic iron load rather than the inflammatory state [26]. It was shown that there was a significant positive correlation between one, two, and six months changes in the ferritin levels and hepcidinPre (r=0.443, r=0.508, and r=0.398, respectively). The correlation between the change in ferritin levels and the basal hepcidin levels in this study suggests that alterations in iron stores may be one of the main factors influencing hepcidin levels. This relationship between the change of ferritin levels and hepcidin basal status is one of the important findings in the study. In the studies investigating the analytical and biological variations of serum ferritin levels in HD patients, it was stated that serum ferritin levels showed a large within-subject biological variation (CV i ) and that the iron status of HD patients should not be measured by a single ferritin measurement [27]. In a study, CV i for ferritin was determined to be 20.8 (19.79–21.90), indicating the large within-subject variability in serum ferritin levels [28]. Many studies showed a positive correlation between ferritin and hepcidin levels. However, a study showing how the changes in ferritin levels affect hepcidin levels has not been done before in the literature as we scanned. These results suggest that hepcidin levels may be affected by changes in ferritin levels and that ferritin, which has a high biological variation in the follow-up of the iron status of the patients, may also contribute to the follow-up of the patients. Our study had no significant correlation between HepcidinPre levels and Hb concentrations (r=−0.081, p=0.626). Although there are studies showing a negative relationship between hepcidin and Hb, there are also studies showing that there is no relationship [29], [30], [31].
Many studies have shown that interleukin (IL)-6 is the main factor for the induction of hepcidin, which plays a role in the pathogenesis of anemia of inflammation. However, other mechanisms independent of hepcidin also have been shown to be effective in some inflammatory anemia [32]. It has been shown that, in addition to IL-6, IL-22 [33], IL-1 [34], and IL-1β [35] may play roles among hepcidin-inducing agents. In addition to these studies revealing the pathogenesis of hepcidin in the case of anemia of inflammation, a positive correlation was also found between hepcidin and CRP in studies researching the relationship between hepcidin and acute phase reactant CRP in acute inflammatory diseases such as pulmonary, urinary, and abdominal infections and acute pancreatitis [36, 37]. However, although hepcidin and CRP were higher in patients with brucellosis, a subacute or chronic disease, no correlation was found between hepcidin and CRP [38]. In addition, some studies found no significant relationship between hepcidin and CRP among CKD patients [20]. CRP increases rapidly in acute inflammatory diseases and then decreases to its normal level. Therefore, hepcidin and CRP levels may not show a correlation in chronic inflammatory diseases such as HD patients. In addition, in this study, there was a positive correlation between ferritin, which is a positive acute phase reactant such as CRP (r=0.858, p<0.001), and hepcidin while there was no correlation between ferritin and CRP (r=0.232, p=0.156). It supports the opinion that there is no correlation. However, in the regression analysis in which the factors effective in the prediction of hepcidin level were determined, it was suggested that CRP may have a small effect on hepcidin levels (β=−0.198, p=0.013).
The first limitation of this study was the small patient population and single center in which it was conducted. Another limitation is the inability to assess the equilibrium of hepcidin in intravascular and extravascular compartments since blood is taken immediately after the dialysis procedure.
In conclusion, it was shown that hepcidin levels decreased significantly with dialysis treatment. Hepcidin levels significantly correlated with ferritin, TIBC, and MCV levels. Hepcidin levels were shown to be affected by changes in iron store levels, and increases in ferritin levels were found to be positively linked with baseline hepcidin levels. We think that managing future treatment requires an understanding of how the hepcidin molecule is removed by dialysis, which results in a decrease in the quantity of iron accessible during the anemic period. Further studies are needed to better understand hepcidin’s kinetics in HD patients. The study presented is one of the limited number of studies that evaluate the effect of a single-session dialysis on hepcidin.
Funding source: Abant Izzet Baysal Ãœniversitesi
Award Identifier / Grant number: 2017.08.04.1179
-
Research ethics: Ethical permission was obtained from the Bolu Abant Izzet Baysal University Ethical Committee for this study with and no: 2016/87, and Helsinki Declaration rules were followed to conduct this study. This article is a restructured version of the thesis titled “Effect of Hemodialysis on Serum Hepcidin Levels/Serum hepsidin düzeyleri üzerine hemodiyalizin etkisi.”
-
Informed consent: Informed consent was obtained from all individuals included in this study, or their legal guardians or wards.
-
Author contributions: All authors have accepted responsibility for the entire content of this manuscript and approved its submission.
-
Competing interests: The authors declare that they have no conflict of interests regarding content of this article.
-
Research funding: This study was supported by Bolu Abant Izzet Baysal University Research Foundation (no. 2017.08.04.1179).
-
Data availability: The raw data can be obtained on request from the corresponding author.
References
1. Gafter-Gvili, A, Schechter, A, Rozen-Zvi, B. Iron deficiency anemia in chronic kidney disease. Acta Haematol 2019;142:44–50. https://doi.org/10.1159/000496492.Suche in Google Scholar PubMed
2. Yu, ASL, Chertow, GM, Luyckx, VA, Marsden, PA, Skorecki, K, Taal, MW, et al.. Brenner and Rector’s the Kidney 2-Volume Set e-Book, 11th ed. Philadelphia, PA: Elsevier; 2020:1861 p.Suche in Google Scholar
3. Abuşoğlu, S, Aydın, İ, Bakar, F, Bekdemir, T, Gülbahar, Ö, İşlekel, H, et al.. A short guideline on chronic kidney disease for medical laboratory practice/Kronik böbrek hastalığında tıbbi laboratuvar uygulamaları için kısa kılavuz. Turk J Biochem 2016;41:292–301. https://doi.org/10.1515/tjb-2016-0043.Suche in Google Scholar
4. Hall, JE, Hall, ME. Guyton and Hall textbook of Medical physiology e-Book, 14th ed. Philadelphia, PA: Elsevier; 2021:443 p.Suche in Google Scholar
5. Kroot, JJ, Tjalsma, H, Fleming, RE, Swinkels, DW. Hepcidin in human iron disorders: diagnostic implications. Clin Chem 2011;57:1650–69. https://doi.org/10.1373/clinchem.2009.140053.Suche in Google Scholar PubMed
6. Langdon, JM, Yates, SC, Femnou, LK, McCranor, BJ, Cheadle, C, Xue, QL, et al.. Hepcidin‐dependent and hepcidin‐independent regulation of erythropoiesis in a mouse model of anemia of chronic inflammation. Am J Hematol 2014;89:470–9. https://doi.org/10.1002/ajh.23670.Suche in Google Scholar PubMed PubMed Central
7. Ueda, N, Takasawa, K. Role of hepcidin-25 in chronic kidney disease: anemia and beyond. Curr Med Chem 2017;24:1417–52. https://doi.org/10.2174/0929867324666170316120538.Suche in Google Scholar PubMed
8. Cooke, KS, Hinkle, B, Salimi-Moosavi, H, Foltz, I, King, C, Rathanaswami, P, et al.. A fully human anti-hepcidin antibody modulates iron metabolism in both mice and nonhuman primates. Blood 2013;122:3054–61. https://doi.org/10.1182/blood-2013-06505792.Suche in Google Scholar
9. Zhao, N, Zhang, A-S, Enns, CA. Iron regulation by hepcidin. J Clin Invest 2013;123:2337–43. https://doi.org/10.1172/JCI67225.Suche in Google Scholar PubMed PubMed Central
10. Subha Palaneeswari, M, Ganesh, M, Karthikeyan, T, Manjula Devi, A, Mythili, S. Hepcidin—Minireview. J Clin Diagn Res 2013;7:1767–71. https://doi.org/10.7860/JCDR/2013/6420.3273.Suche in Google Scholar PubMed PubMed Central
11. Ashby, DR, Gale, DP, Busbridge, M, Murphy, KG, Duncan, ND, Cairns, TD, et al.. Plasma hepcidin levels are elevated but responsive to erythropoietin therapy in renal disease. Kidney Int 2009;75:976–81. https://doi.org/10.1038/ki.2009.21.Suche in Google Scholar PubMed
12. Zaritsky, J, Young, B, Wang, H-J, Westerman, M, Olbina, G, Nemeth, E, et al.. Hepcidin—a potential novel biomarker for iron status in chronic kidney disease. Clin J Am Soc Nephrol 2009;4:1051–6. https://doi.org/10.2215/CJN.05931108.Suche in Google Scholar PubMed PubMed Central
13. Panwar, B, Gutiérrez, OM. Disorders of iron metabolism and anemia in chronic kidney disease. Semin Nephrol 2016;36:252–61.10.1016/j.semnephrol.2016.05.002Suche in Google Scholar PubMed
14. Daugirdas, JT. Second generation logarithmic estimates of single-pool variable volume Kt/V: an analysis of error. J Am Soc Nephrol 1993;4:1205–13. https://doi.org/10.1681/ASN.V451205.Suche in Google Scholar PubMed
15. Faul, F, Erdfelder, E, Lang, AG. *Power 3.1: test for correlation and regression analyses flexible statistical power analysis. Behav Res Methods 2009;41:1149–60. https://doi.org/10.3758/BRM.41.4.1149.Suche in Google Scholar PubMed
16. Zaritsky, J, Young, B, Gales, B, Wang, H-J, Rastogi, A, Westerman, M, et al.. Reduction of serum hepcidin by hemodialysis in pediatric and adult patients. Clin J Am Soc Nephrol 2010;5:1010–4. https://doi.org/10.2215/CJN.08161109.Suche in Google Scholar PubMed PubMed Central
17. Ashby, D, Busbridge, M, Hildebrand, S, Clarke, C, Aldous, G, Palan, M, et al.. Hepcidin clearance is associated with erythropoietin requirement in stable hemodialysis patients. Clin Nephrol 2017;87:231. https://doi.org/10.5414/CN108906.Suche in Google Scholar PubMed
18. Meyer, TW, Sirich, TL, Fong, KD, Plummer, NS, Shafi, T, Hwang, S, et al.. Kt/Vurea and nonurea small solute levels in the hemodialysis study. J Am Soc Nephrol 2016;27:3469–78. https://doi.org/10.1681/ASN.2015091035.Suche in Google Scholar PubMed PubMed Central
19. Peslova, G, Petrak, J, Kuzelova, K, Hrdy, I, Halada, P, Kuchel, PW, et al.. Hepcidin, the hormone of iron metabolism, is bound specifically to α-2-macroglobulin in blood. Blood 2009;113:6225–36. https://doi.org/10.1182/blood-2009-01-201590.Suche in Google Scholar PubMed
20. Chand, S, Ward, DG, Ng, Z-YV, Hodson, J, Kirby, H, Steele, P, et al.. Serum hepcidin-25 and response to intravenous iron in patients with non-dialysis chronic kidney disease. J Nephrol 2015;28:81–8. https://doi.org/10.1007/s40620-014-0083-y.Suche in Google Scholar PubMed
21. Takasawa, K, Takaeda, C, Maeda, T, Ueda, N. Hepcidin-25, mean corpuscular volume, and ferritin as predictors of response to oral iron supplementation in hemodialysis patients. Nutrients 2014;7:103–18. https://doi.org/10.3390/nu7010103.Suche in Google Scholar PubMed PubMed Central
22. Ghahramanfard, F, Yarmohamadi, M, Ghorbani, R, Semnani, V, Mirzaei, A, Chubmasgedi, MG. Hepcidin in hemodialysis patients and its association with anemia and serum iron indices. J Ren Inj Prev 2019;8:146–50. https://doi.org/10.15171/jrip.2019.27.Suche in Google Scholar
23. Yeh, K-y, Yeh, M, Glass, J. Hepcidin regulation of ferroportin 1 expression in the liver and intestine of the rat. Am J Physiol Gastrointest Liver Physiol 2004;286:G385–94. https://doi.org/10.1152/ajpgi.00246.2003.Suche in Google Scholar PubMed
24. Ramey, G, Deschemin, J-C, Durel, B, Canonne-Hergaux, F, Nicolas, G, Vaulont, S. Hepcidin targets ferroportin for degradation in hepatocytes. Haematologica 2010;95:501. https://doi.org/10.3324/haematol.2009.014399.Suche in Google Scholar PubMed PubMed Central
25. Oates, PS. The role of hepcidin and ferroportin in iron absorption. Histol Histopathol 2007;22:791–804. https://doi.org/10.14670/HH-22.791.Suche in Google Scholar PubMed
26. Weiss, G, Theurl, I, Eder, S, Koppelstaetter, C, Kurz, K, Sonnweber, T, et al.. Serum hepcidin concentration in chronic haemodialysis patients: associations and effects of dialysis, iron and erythropoietin therapy. Eur J Clin Invest 2009;39:883–90. https://doi.org/10.1111/j.1365-2362.2009.02182.x.Suche in Google Scholar PubMed
27. Van Wyck, DB, Alcorn, HJr, Gupta, R. Analytical and biological variation in measures of anemia and iron status in patients treated with maintenance hemodialysis. Am J Kidney Dis 2010;56:540–6. https://doi.org/10.1053/j.ajkd.2010.05.009.Suche in Google Scholar PubMed
28. Lacher, DA, Hughes, JP, Carroll, MD. Biological variation of laboratory analytes based on the 1999–2002 National Health and Nutrition Examination Survey. National health statistics reports, no 21. Hyattsville, MD: National Center for Health Statistics; 2010.Suche in Google Scholar
29. Goyal, H, Mohanty, S, Sharma, M, Rani, A. Study of anemia in nondialysis dependent chronic kidney disease with special reference to serum hepcidin. Indian J Nephrol 2017;27:44. https://doi.org/10.4103/0971-4065.179301.Suche in Google Scholar PubMed PubMed Central
30. Petrulienė, K, Žiginskienė, E, Kuzminskis, V, Nedzelskienė, I, Bumblytė, IA. Hepcidin serum levels and resistance to recombinant human erythropoietin therapy in hemodialysis patients. Medicina 2017;53:90–100. https://doi.org/10.1016/j.medici.2017.03.001.Suche in Google Scholar PubMed
31. Uehata, T, Tomosugi, N, Shoji, T, Sakaguchi, Y, Suzuki, A, Kaneko, T, et al.. Serum hepcidin-25 levels and anemia in non-dialysis chronic kidney disease patients: a cross-sectional study. Nephrol Dial Transplant 2012;27:1076–83. https://doi.org/10.1093/ndt/gfr431.Suche in Google Scholar PubMed
32. Wang, C-Y, Babitt, JL. Hepcidin regulation in the anemia of inflammation. Curr Opin Hematol 2016;23:189. https://doi.org/10.1097/MOH.0000000000000236.Suche in Google Scholar PubMed PubMed Central
33. Wallace, DF, Subramaniam, VN. Analysis of IL-22 contribution to hepcidin induction and hypoferremia during the response to LPS in vivo. Int Immunol 2015;27:281–7. https://doi.org/10.1093/intimm/dxu144.Suche in Google Scholar PubMed
34. Lee, P, Peng, H, Gelbart, T, Wang, L, Beutler, E. Regulation of hepcidin transcription by interleukin-1 and interleukin-6. Proc Natl Acad Sci U S A 2005;102:1906–10. https://doi.org/10.1073/pnas.0409808102.Suche in Google Scholar PubMed PubMed Central
35. Shanmugam, NKN, Chen, K, Cherayil, BJ. Commensal bacteria-induced interleukin 1β (IL-1β) secreted by macrophages up-regulates hepcidin expression in hepatocytes by activating the bone morphogenetic protein signaling pathway. J Biol Chem 2015;290:30637–47. https://doi.org/10.1074/jbc.M115.689190.Suche in Google Scholar PubMed PubMed Central
36. Li, L, Zhang, J-g, Zhao, M-z, Wu, Z-h, Song, J-x. Applied value of monitoring serum hepcidin in differential diagnosis of infection versus tumor fevers. J Huazhong Univ Sci Technol 2017;37:253–6. https://doi.org/10.1007/s11596-017-1724-x.Suche in Google Scholar PubMed
37. Arabul, M, Celik, M, Aslan, O, Torun, S, Beyazit, Y, Alper, E, et al.. Hepcidin as a predictor of disease severity in acute pancreatitis: a single center prospective study. Hepato-Gastroenterol 2013;60:595–600. https://doi.org/10.5754/hge12770.Suche in Google Scholar PubMed
38. Hashemi, SH, Esna-Ashari, F, Nemat Gorgani, F, Tayebinia, H, Mamani, M. Increased serum levels of hepcidin and C-reactive protein in patients with brucellosis. Trans R Soc Trop Med Hyg 2018;112:509–12. https://doi.org/10.1093/trstmh/try092.Suche in Google Scholar PubMed
© 2023 the author(s), published by De Gruyter, Berlin/Boston
This work is licensed under the Creative Commons Attribution 4.0 International License.
Artikel in diesem Heft
- Frontmatter
- Review
- Metabolomics: a review of liquid chromatography mass spectrometry-based methods and clinical applications
- Opinion Papers
- Green transformation in the health sector and medical laboratories, adaptation to climate change in Türkiye
- Forward steps in green medical laboratory practices for a sustainable future
- Research Articles
- Comparison of the immunoassay method with the commercial and in-house LC-MS/MS methods for substance abuse in urine
- Peroxisome proliferator-activated receptor gamma and osteoprotegerin levels as an indicator and diagnostic predictor of endothelial dysfunction
- Gingival status and prophylactic oral hygiene measures modulate salivary amino acids’ profile in children with plaque-induced gingivitis
- FIB4 score is increased in severe preeclampsia
- The effects of a single dialysis session on serum hepcidin levels
- Gestational diabetes mellitus is associated with a low serum level of mitochondrial-derived peptide-MOTS-C
- Ideal timing of labor in terms of oxidative stress – which term period is best?
- Synergistic role of thymoquinone and 5-fluorouracil in U-251MG glioblastoma cell line
- Effect of oligosaccharides and aerobic training on hyperglycemia, growth and intestinal microbial diversity of diabetic rats
- Association of AdipoQ (G>T) gene polymorphism with obesity and hypertension in North Indian postmenopausal women of Punjab
- The attraction of paraoxonase-1 associated with the MAPK pathway on colon carcinoma cells
- Resveratrol modulates miRNA machinery proteins in different types of colon cancer cells
- The relationship between ASIC3 gene polymorphism and fibromyalgia syndrome
- Expression levels of genes involved in lipogenesis and cholesterol synthesis in adenomyosis
- Frequency of thrombophilia-associated mutations and polymorphisms in pregnant women with a history of thrombosis or pregnancy complications