The attraction of paraoxonase-1 associated with the MAPK pathway on colon carcinoma cells
-
 und
und


Abstract
Objectives
A comprehensive understanding of the role of PON enzymatic activities may play an important role in the etiology and prevention of many cancers. PON1 is known as a potent antioxidant that scavenges free radicals in the human body. The enzymatic activities of paraoxonase (PON1) and mitogen-activated protein kinase (MAPK) signalling pathways in colorectal cancer are being investigated to determine whether they hold promise for novel diagnostic or therapeutic applications in colorectal cancer.
Methods
HT-29 colon cancer cell lines and CCD-18Co colon cell lines were used. B-Raf, p-B-Raf, ERK, and p-ERK proteins involved in MAPK signalling pathways and serum levels of PON1 were detected and analyzed by the Western blotting method.
Results
The levels and activity of PON1 enzyme were significantly decreased in HT-29 cells compared to CCD-18Co cells (p=0.0173 and p=0.0281, respectively). The levels of p-B-Raf and p-ERK, which activates the MAPK signalling pathway, were significantly increased in HT-29 cells (p=0.0037 and p=0.0074, respectively).
Conclusions
A positive correlation was found between PON1 level and PON1 enzyme activity (p=0.008). A negative correlation was found between PON1 level and p-B-Raf/p-ERK protein levels, which play a role in the MAPK signalling pathway (p=0.016 and p=0.036, respectively). A negative correlation was also found between PON1 enzyme activity and p-B-Raf/p-ERK protein levels (p=0.060 and p=0.037, respectively).
It is suggested that the increase of proteins involved in the MAPK signaling pathway in cancer cells is caused by the decreasing serum levels of PON1 and enzymatic activity of PON1.
Introduction
Colon and rectal cancer are often grouped together under the name colorectal cancer (CRC). CRC is the second most common cancer in women and the third most common cancer in men in all age groups worldwide [1]. CRC occupies an important place among preventable cancers and treatment options increase when the disease is detected at an early stage. However, only one-third of the cases can be detected at an early stage [2, 3]. The main reasons for this are that the routinely used screening programs include interventional procedures, and their social awareness is not at the desired level. Moreover, the biomarkers recommended for CRC do not have a suitable area of use for the early diagnosis of the disease. They are generally used for the follow-up of recurrence after treatment. For these reasons, the identification of new molecular biomarkers with prognostic significance for CRC has become an important issue today. This situation calls for a better understanding of the molecular changes involved in the development of CRC [4, 5].
Mitogen-activated protein kinase (MAPK) signalling pathways occur in all eukaryotic cells and play critical roles in survival, proliferation, differentiation, apoptosis, transcriptional control, angiogenesis, and tumor metastasis. The MAPK/ERK signalling pathway begins with the activation of Ras and proceeds through the activity of Raf, MEK, and ERK, respectively. In the final step of signal transduction, the activated ERK enters the nucleus and mediates the cellular response. Signalling pathways responsible for basic cellular functions show increased or decreased activity by transforming into oncogenic signalling pathways in cancer cells. The MAPK pathway is overactive in approximately 30 % of human tumors and 40 % of CRCs [6, 7].
Oxidative stress occurs when the balance of oxidation in our body is disturbed for any reason. As we age, the production of reactive oxygen species (ROS) and free radicals increases. The harmful effects of ROS, produced during normal cellular metabolism, are eliminated by antioxidant systems. However, when ROS is not neutralized, oxidative stress occurs, which may play a role in the development and progression of cancer [8, 9].
Human antioxidants originate from ‘endogenous’ produced naturally by the body or ‘exogenous’ taken as an external supplement. Paraoxonase (PON) enzymes are a family of antioxidant enzymes that are among the endogenous free radical scavenging systems and have anti-inflammatory effects. The PON enzyme family consists of three known members, PON1, PON2, and PON3, and all three prevent oxidative stress. The calcium-dependent PON1 and PON3 are synthesized in the liver, bound to high-density lipoprotein (HDL), transported to cell membranes in various tissues and organs, and distributed [10, 11]. Alterations in PON enzyme activity and expression lead to inflammation with oxidative stress. Long-term intense oxidative stress and inflammation can both lead to carcinogenesis and provide an ideal environment for tumor cell growth [12]. It is suggested that PON1 activity and/or its polymorphisms may be a leading biomarker for carcinogenesis in pancreatic, liver, brain, breast, gastrointestinal, prostate, and ovarian cancers [13]. There are some studies in the literature on the role of both PON enzymes and MAPK pathways in the development of CRC. However, these studies aim to explain the role of both parameters independently in CRC carcinogenesis. No study was found that investigated the effects of these two parameters on each other in colorectal carcinogenesis. This study was carried out to test the role of the PON1 enzyme and MAPK pathway in the formation of colon cancer and to examine the interaction between PON1 and MAPK pathways in the cancerization process.
Materials and methods
Cell culture
The colon adenocarcinoma cell line HT-29 (ATCC HTB-38) and the healthy colon fibroblast cell line CCD-18Co (ATCC CRL-1459) were used in our study. In line with the manufacturer’s recommendation, HT-29 cells were grown in Dulbecco’s Modified Eagle Medium, and CCD-18Co cells used for control purposes were grown in Eagle’s Minimum Essential Medium. Cells were cultured in a medium containing 10 % fetal bovine serum (FBS) and 1 % penicillin–streptomycin at 5 % CO2 and 37 °C in 25 cm3 (T25) flasks and a cell culture incubator under sterile conditions. When the cells were 90 % confluent, 200 µL of lysis buffer was added (The lysis buffer was prepared by adding distilled water to the solution containing 50 mM Tris, 150 µM NaCl, 1 % NP-40, and 1 mL of proteinase inhibitor factor to make the final volume pH=8). Cells homogenized on ice with a cell scraper were sonicated three times. The lysates obtained by collecting the supernatant of the cells centrifuged at 4 °C and 6.179×g for 15 min were stored at −20 °C until the time of assay.
Measurements of PON1 enzyme activity
The enzyme activity of PON1 from the prepared lysates was determined spectrophotometrically [14, 15]. For this purpose, basal activity buffer (100 mM Tris–HCl containing 2 mM CaCl2) and substrate (2 mM paraoxon solution) were first prepared. In the next step, the basal activity buffer, the freshly prepared substrate solution, and the prepared lysates were added to the spectrophotometer cuvette. The absorbance values of the test samples were determined at 37 °C at 412 nm. Then, the PON1 enzyme activities (EU) were calculated using the following formula [16].
Determination of protein levels
The PON1 level and B-Raf, p-B-Raf, ERK, and p-ERK protein levels in the MAPK signalling pathway were analyzed by SDS-PAGE and Western blot.
SDS page
Protein concentrations in the samples were measured by Nanodrop before proceeding to the gel run. 2× Laemmli sample buffer was added to the prepared lysates and vortexed. Protein denaturation was achieved by boiling the mixture at 96 °C in the heating block for 8–10 min 4–12 % bis–tris gel was used for the electrophoresis run. The comb on the wells of the prepared gel was removed, and each well was washed with a syringe containing run buffer (40 mL NuPAGE run buffer and 760 mL distilled water). One of the wells was loaded with a 5 µL ladder, while the others were loaded with 20 µL samples each. After loading was completed, the tank was sealed, the electrodes were connected, and the power supply was set to 100 V, 120 A, and the run was performed for 100 min.
Western blot
The iBlot dry blotting protocol was used for protein transfer, which has higher efficiency than the wet and semi-dry transfer methods [17]. The gel transferred to the membrane was stained with Ponceau S dye to verify that the proteins were transferred to the membrane. A milk powder solution was used to prevent unnecessary binding by closing large antigenic regions on the membrane. After blocking, the membrane was washed with PBS-Tween20 for 10–15 min and incubated with the primary antibodies, whose names and dilution rates are listed in Table 2 overnight at +4 °C in a shaker (130 rpm). The membrane incubated with the primary antibodies was washed three times with PBS-Tween20 solution for 10–15 min. It was then incubated with HRP-conjugated secondary antibodies for 1 h at room temperature in a shaker (Table 2). After completion of the process, the membrane was washed with PBS-Tween20 for 15–20 min.
The membrane was treated with an enhanced luminol-based chemiluminescent agent (Pierce™ ECL substrate), and imaging was performed using the UVP ChemiDoc-It2 imager instrument. The band images corresponding to the protein levels of PON1, B-Raf, p-B-Raf, ERK, and p-ERK in the cell lines were calculated by normalization with α-tubulin in the Image J program (National Institutes of Health, USA). The experimental steps were performed with three replicates, and the data obtained from these replicates were used for the statistical analyzes.
Statistical analysis and evaluation of results
Statistical analyzes and calculations were performed using the GraphPad Prism 9 program for the Windows package program (GraphPad Software Inc., San Diego, CA). Changes in protein concentrations and enzyme activity results in cell lines were analyzed with t-tests for two independent samples. The relationships between the PON1 level and enzyme activity and the levels of proteins involved in the MAPK pathway were examined using Pearson correlation analysis [18]. In our study, the statistical significance level was accepted as p<0.05.
Results
Measurement of PON1 level and PON1 enzyme activity in cell lines
The PON1 expression level calculated by Western Blot analysis significantly decreased in the HT-29 cell line (p=0.0173) (Figure 1A). In addition, PON1 enzyme activity determined by spectrophotometry was significantly decreased in HT-29 cells compared to CCD-18Co cells (p=0.0281) (Figure 1B). According to our findings, a significant, very high positive correlation was found between PON1 level and PON1 enzyme activity (r=0.927, p=0.008). In cases where PON1 expression decreased, PON1 enzyme activity was also decreased (Table 1).

Change of PON1 enzyme level and activity in cell lines. (A) The change of PON1 levels in cell lines calculated using Western Blot band images of PON1 and α-tubulin, (B) change of PON1 enzyme activity in cell lines.
Correlation matrix showing the relationship between PON1 level and PON1 enzyme activity in colon cells.
| PON1 levels | PON1 enzyme activity | B-RAF protein levels | p-B-RAF protein levels | ERK protein levels | p-ERK protein levels | |
|---|---|---|---|---|---|---|
| PON1 levels | r=1.000 | r=0.927b | r=0.491 | r=−0.893a | r=0.926b | r=−0.840a |
| p=0.008 | p=0.323 | p=0.016 | p=0.008 | p=0.036 | ||
| PON1 enzyme activity | r=0.927b | r=1.000 | r=0.287 | r=−0.793 | r=0.926b | r=−0.838a |
| p=0.008 | p=0.581 | p=0.060 | p=0.008 | p=0.037 | ||
| B-RAF protein levels | r=0.491 | r=0.287 | r=1.000 | r=−0.282 | r=0.186 | r=−0.311 |
| p=0.323 | p=0.581 | p=0.588 | p=0.725 | p=0.548 | ||
| p-B-RAF protein levels | r=−0.893a | r=−0.793 | r=−0.282 | r=1.000 | r=−0.909a | r=0.840a |
| p=0.016 | p=0.060 | p=0.588 | p=0.012 | p=0.036 | ||
| ERK protein levels | r=0.926b | r=0.926b | r=0.186 | r=−0.909a | r=1.000 | r=−0.928b |
| p=0.008 | p=0.008 | p=0.725 | p=0.012 | p=0.008 | ||
| p-ERK protein levels | r=−0.840a | r=−0.838a | r=−0.311 | r=0.840a | r=−0.928b | r=1.000 |
| p=0.036 | p=0.037 | p=0.548 | p=0.036 | p=0.008 |
-
aSignificant at p<0.05 level, bsignificant at p<0.01 level, significant at p<0.001 level. Pearson correlation coefficient (r): 0.90–1.00 (−0.90 to −1.00), very high positive (negative) correlation; 0.70–0.90 (−0.70 to −0.90), high positive (negative) correlation; 0.50–0.70 (−0.50 to −0.70), moderate positive (negative) correlation; 0.30–0.50 (−0.30 to −0.50), low positive (negative) correlation; 0.00–0.30 (0.00 to −0.30), negligible positive (negative) correlation.
Primary and secondary antibodies are used in the blotting and dilution rates of these antibodies.
| Company (Catalog#) | Dilution | |
|---|---|---|
| Primary antibodies | ||
| PON1 polyclonal antibody | Thermo Fisher (PA5-115780) | 1/3,000 |
| Anti B-RAF antibody | St John’s Lab. (STJ95353) | 1/500 |
| Anti p-BRAF antibody | St John’s Lab. (STJ22042) | 1/500 |
| ERK1/2 monoclonal antibody | Thermo Fisher (ERK-7D8) | 1/500 |
| Anti p-ERK1/2 antibody | St John’s Lab. (STJ91357) | 1/500 |
| Tubulin alpha antibody | Affbiotech (AF7010) | 1/5,000 |
| Secondary antibodies | ||
| Goat-anti-mouse IgG (H+L), HRP conjugate | Advansta (R-05071-500) | 1/20,000 |
| Goat-anti-rabbit IgG (H+L), HRP conjugate | Advansta (R-05072-500) | 1/20,000 |
Determination of active and inactive expression levels of B-Raf and ERK proteins involved in the MAPK signalling pathway
B-Raf protein levels were decreased in HT-29 cancer cells compared to healthy CCD-18Co cells. However, this decrease was not significant (p=0.7707) (Figure 2A). Also, the level of ERK was significantly decreased in HT-29 cancer cells compared to healthy cells (p=0.0004) (Figure 2C). In addition, the levels of phosphorylated B-Raf (p-B-Raf) and phosphorylated ERK (p-ERK) were significantly increased in HT-29 cancer cells compared to healthy cells (p=0.0037 and p=0.0074, respectively) (Figure 2B and D).
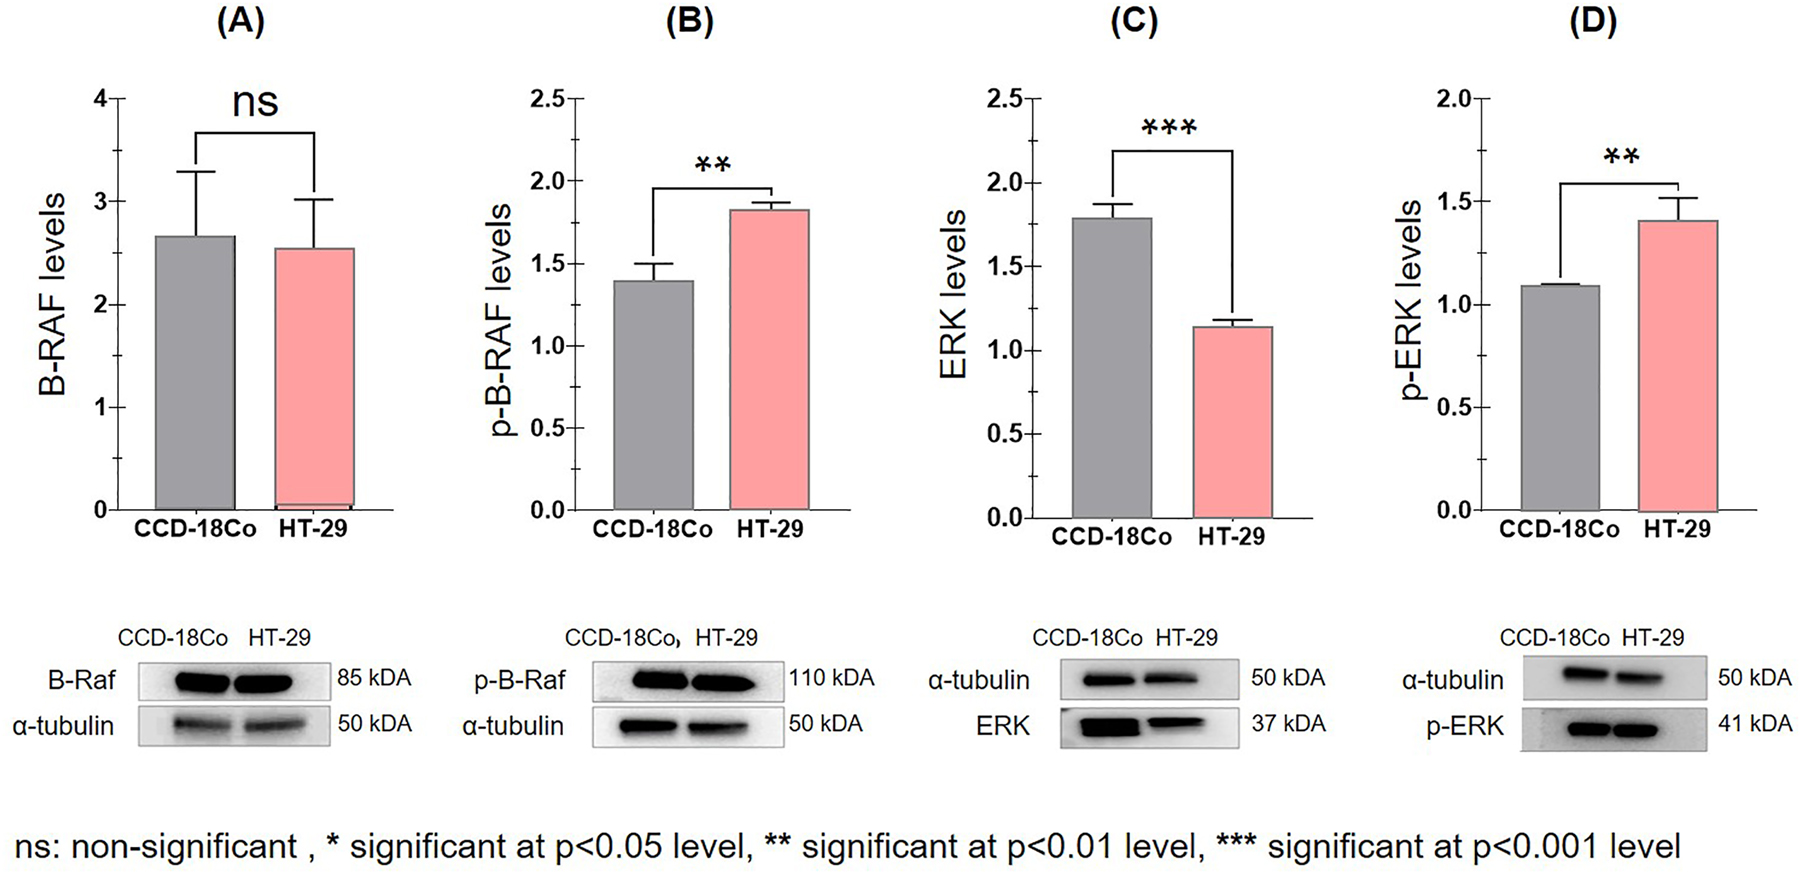
Variation of protein levels normalized with α-tubulin in cell lines using western blot band images. (A) B-Raf levels, (B) p-B-Raf levels, (C) ERK levels, (D) p-ERK levels.
Measurement of correlation between PON1 enzyme and MAPK pathway proteins
In our study, a significantly high negative correlation was found between PON1 levels and p-B-Raf and p-ERK levels (r=−0.893, p=0.016; r=−0.840, p=0.036), respectively. According to these results, the protein levels of p-B-Raf and p-ERK, which are responsible for the activation of the signalling pathway, significantly increased in the cases where the PON1 level decreased. In addition, an insignificant high negative correlation was found between PON1 enzyme activity and p-B-Raf level (r=−0.793, p=0.060). Additionally, a statistically high negative correlation was found between PON1 enzyme activity and p-ERK level (r=−0.838, p=0.037). According to these results, in the cases where PON1 enzyme activity decreases, an insignificant increase in p-B-Raf levels, which plays a role in MAPK pathway activation, was detected, and an excellent increase in p-ERK levels was observed (Table 1).
Discussion
Studies conducted in recent years have provided new insights into the genesis and development of CRC at the biochemical and molecular levels. Oxidative stress and the accumulation of ROS have been associated with an increased risk of several types of cancer. Today, low activity of the enzyme PON1 in serum, which causes oxidative stress, is thought to play a role in carcinogenesis. According to studies in the literature, both PON1 enzyme activity and PON1 levels (arylesterase and/or paraoxonase activity) decrease in CRC, and therefore, PON1 is recommended as a biomarker for CRC patients [19], [20], [21].
Defects in the capacity of the antioxidant system and altered PON1 enzyme activity and/or PON1 levels are thought to play a role in the pathogenesis of CRC. According to recent studies in the literature, the levels of PON1 enzyme and paraoxonase activity are decreased in CRC patients with one or two exceptions [19, 20, 22]. In our study, it was found that PON1 level and PON1 enzyme activity were significantly decreased in HT-29 colon cancer cells compared with healthy CCD-18Co colon cells. These results support the studies in the literature. According to our findings, there is a very high positive correlation between PON1 level and PON1 enzyme activity in cancer cells. Decreased PON1 level in the HT-29 cell line resulted in decreased PON1 enzyme activity.
Overactivity of the MAPK pathway is involved in many key processes of colon cancer development. Inhibition of this pathway inhibits tumor angiogenesis and halts tumor growth and metastasis. According to studies in the literature, abnormal activation of the MAPK pathway leads to differentiation of the intestinal epithelium and plays a role in the oncogenic behavior of CRC. Approximately 44 % of CRCs exhibit dysregulation of the MAPK pathway due to a K-Ras mutation and 10 % due to a B-Raf mutation [23, 24]. In our study, the active and inactive levels of B-Raf involved in the MAPK signaling pathway were analyzed in HT-29 colon cancer cells and CCD-18Co healthy colon cells. It was found that the p-B-Raf protein level was significantly increased in HT-29 cancer cells. Another protein of particular importance in the generation of the cellular response in the MAPK signaling system is ERK. ERK is the final step of the signalling cascade, and activated ERK (p-ERK) migrates into the nucleus and mediates the cellular response through hundreds of transcription factors. In our study, it was found that ERK protein levels significantly decreased and p-ERK levels significantly increased in HT-29 cancer cells. These increases in p-B-Raf and p-ERK levels suggest that the MAPK signalling pathway is over-activated in the HT-29 cancer cell line.
In recent years, research focusing on the effects of certain drugs, chemical agents, and antioxidants on the MAPK pathway has paved the way for significant studies on the treatment of cancer. Studies in the literature have presented results suggesting that many drugs or chemical agents can induce carcinogenesis by modulating the MAPK pathway. Conversely, some studies have shown that certain compounds with antioxidant properties can prevent carcinogenesis or halt its progression through their effects on the MAPK pathway [25], [26], [27], [28].
In our study, we investigated the effects of the endogenous antioxidant enzyme PON1 on the MAPK signaling pathway in both HT-29 cancer cell lines and healthy CCD-18Co cell lines. Our results showed a significant and high negative correlation between the level of PON1 and the levels of the proteins p-B-Raf and p-ERK. We also observed an insignificant but high negative correlation between PON1 enzyme activity and p-B-Raf protein. In addition, a high negative correlation was observed between PON1 enzyme activity and p-ERK protein levels.
In our study, the level and enzyme activity of PON1, an endogenous antioxidant, decreased in HT-29 cancer cells compared with healthy cells. This suggests that the disturbed oxidative balance resulting from the loss of antioxidants may be responsible for the abnormal activation of the MAPK pathway in cancer cells.
Further studies are needed to explain the physiological role of PON1 in the development of CRC and also to uncover its relationship with MAPK signaling pathways. Studies in patient groups that consider the localization and stage of colorectal cancer may provide a broader perspective.
Funding source: This research was supported by Ankara Yıldırım Beyazit University Scientific Research Projects Unit
Award Identifier / Grant number: project number 2196
Acknowledgments
The authors would like to thank Dr. Tuğba Kevser Uysal for her support during the laboratory process.
-
Research ethics: Not applicable.
-
Informed consent: Not applicable.
-
Author contributions: All authors have taken responsibility for the entire content of this manuscript and approved its submission.
-
Competing interests: The authors have no conflicts of interest to disclose.
-
Research funding: This research was supported by Ankara Yıldırım Beyazit University Scientific Research Projects Unit under project number 2196.
-
Data availability: The raw data can be obtained on request from the corresponding author.
References
1. WHO. World Health Organization (WHO) – early detection of cancer; 2020. Available from: http://www.who.int/cancer/detection/en [Accessed 2 Dec 2020].Suche in Google Scholar
2. Surveillance Research Program, National Cancer, Institute. An interactive website for SEER cancer statistics; 2021. Available from: https://seer.cancer.gov/statfacts/html/colorect.html [Accessed 31 Oct 2021].Suche in Google Scholar
3. Ilgaz, A. The determination of colorectal cancer (CRC) risk levels, CRC screening rates, and factors affecting the participation to screening of individuals working in the agriculture [MSc theses]. Antalya: Akdeniz University; 2015. Available from: http://acikerisim.akdeniz.edu.tr:8080/xmlui/handle/123456789/2521 [Accessed 20 Aug 2022].Suche in Google Scholar
4. Türkçapar, N, Özden, A. Tümör markerleri ve klinik önemi. Turk J Gastroenterol 2005;9:271–81.Suche in Google Scholar
5. Yıldız, MS, Önder, Y, Çıtıl, R, Okan, İ. Colorectal cancer risk factors and colorectal cancer screening awareness levels in adults applied to family health centers. Chron Precis Med Res 2022;3:68–77.Suche in Google Scholar
6. Blaj, C, Schmidt, EM, Lamprecht, S, Hermeking, H, Jung, A, Kirchner, T, et al.. Oncogenic effects of high MAPK activity in colorectal cancer mark progenitor cells and persist irrespective of RAS mutations. Cancer Res 2017;77:1763–74. https://doi.org/10.1158/0008-5472.can-16-2821.Suche in Google Scholar
7. Soyuğur, M. Effects of sapienic acid on MAPK pathway in melanoma cells [MSc theses]. Antalya: Alanya Alaaddin Keykubat University; 2021. Available from: http://acikerisim.alanya.edu.tr/xmlui/handle/20.500.12868/1489 [Accessed 23 Aug 2022].Suche in Google Scholar
8. Kumari, S, Badana, AK, Malla, R. Reactive oxygen species: a key constituent in cancer survival. Biomark Insights 2018;13:1–9. https://doi.org/10.1007/s10916-018-1115-2.Suche in Google Scholar PubMed
9. Shin, M, Franks, CE, Hsu, K-LJCs. Isoform-selective activity-based profiling of ERK signaling. Chem Sci 2018;9:2419–31. https://doi.org/10.1039/c8sc00043c.Suche in Google Scholar PubMed PubMed Central
10. Şimşek, E, Yavuz, AF, Terzi, E, Uysal, TK, Bedir, BEÖ, Haqverdiyev, E, et al.. Enzymes during pregnancy: cytosolic carbonic anhydrase, catalase, Paraoxonase 1, and xanthine oxidase levels. Turk J Health Sci 2019;4:79–93.10.26453/otjhs.409112Suche in Google Scholar
11. Toprak, C. Generating a candidate reporter system using paraoxonase enzyme for determination of transcriptional activity [MSc theses]. Balıkesir: Balıkesir University; 2013. Available from: https://dspace.balikesir.edu.tr/xmlui/handle/20.500.12462/2689 [Accessed 30 Oct 2022].Suche in Google Scholar
12. Memişoğulları, R. Paraoxonase and cancer. Konuralp Med J 2010;2:22–6.Suche in Google Scholar
13. Chen, L, Lu, W, Fang, L, Xiong, H, Wu, X, Zhang, M, et al.. Association between L55M polymorphism in Paraoxonase 1 and cancer risk: a meta-analysis based on 21 studies. OncoTargets Ther 2016;9:1151–8. https://doi.org/10.2147/ott.s96990.Suche in Google Scholar PubMed PubMed Central
14. Kockar, F, Sinan, S, Yildirim, H, Arslan, O. Differential effects of some antibiotics on paraoxonase enzyme activity on human hepatoma cells (HepG2) in vitro. J Enzyme Inhib Med Chem 2010;25:715–9. https://doi.org/10.3109/14756360903555266.Suche in Google Scholar PubMed
15. Arslan, M, Gencer, N, Arslan, O, Guler, OO. In vitro efficacy of some cattle drugs on bovine serum paraoxonase 1 (PON1) activity. J Enzyme Inhib Med Chem 2012;27:722–9. https://doi.org/10.3109/14756366.2011.611135.Suche in Google Scholar PubMed
16. Aşkın, U. Purifying enzyme paraoxonase and investigating its kinetic against ghrelin hormone [Ph.D. theses]. Elazığ: Fırat University; 2009. Available from: https://acikbilim.yok.gov.tr/handle/20.500.12812/416693 [Accessed 18 Oct 2022].Suche in Google Scholar
17. Thermo Fisher, Scientific. iBlot 2 dry blotting system; 2022. Available from: https://www.thermofisher.com/tr/en/home/life-science/protein-biology/protein-assays-analysis/western-blotting/transfer-proteins-western-blot/iblot-dry-blotting-system.html [Accessed 23 Aug 2022].Suche in Google Scholar
18. Yadav, S. Correlation analysis in biological studies. J Pract Cardiovasc Sci 2018;4:116–21. https://doi.org/10.4103/jpcs.jpcs_31_18.Suche in Google Scholar
19. Kamel, E-TA, Hussein, ZE-D, Mahmoud, F, Ibrahim, MG, El-Din, AE-NS. The interplay between paraoxonase-1 and epigenetic changes in colorectal carcinoma. Afr J Biochem Res 2018;12:63–72. https://doi.org/10.5897/ajbr2018.0990.Suche in Google Scholar
20. Zhang, J, Yang, X, Wei, L, Tan, H, Chen, J, Li, W, et al.. Improved diagnostic value by combining plasma PON1 level with tumor biomarkers in colorectal cancer patients. J Cancer 2020;11:6491–6. https://doi.org/10.7150/jca.45204.Suche in Google Scholar PubMed PubMed Central
21. Demirel, T, Yaylim, I, Ergen, HA, Gunay, MK, Tekant, Y, Isbir, T. Association of paraoxonase (PON1) polymorphisms and activity with colorectal cancer predisposition. Biotechnol Biotechnol Equip 2021;35:224–30. https://doi.org/10.1080/13102818.2020.1867006.Suche in Google Scholar
22. Yılmaz, İ, Akçay, MN, Polat, MF, Demiryılmaz, İ, Biçer, Ş. In colorectal cancer patients, plasma paraoxonase (PON) level. Okmeydanı Med J 2015;31:65–70.10.5222/otd.2015.065Suche in Google Scholar
23. Guo, YJ, Pan, WW, Liu, SB, Shen, ZF, Xu, Y, Hu, LL. ERK/MAPK signalling pathway and tumorigenesis. Exp Ther Med 2020;19:1997–2007. https://doi.org/10.3892/etm.2020.8454.Suche in Google Scholar PubMed PubMed Central
24. Li, Z-N, Zhao, L, Yu, L-F, Wei, M-J. BRAF and KRAS mutations in metastatic colorectal cancer: future perspectives for personalized therapy. Gastroenterol Rep 2020;8:192–205. https://doi.org/10.1093/gastro/goaa022.Suche in Google Scholar PubMed PubMed Central
25. Ryu, MJ, Chung, HS. [10]-Gingerol induces mitochondrial apoptosis through activation of MAPK pathway in HCT116 human colon cancer cells. In Vitro Cell Dev Biol Anim 2015;51:92–101. https://doi.org/10.1007/s11626-014-9806-6.Suche in Google Scholar PubMed
26. Kim, GT, Lee, SH, Kim, YM. Torilis japonica extract-generated intracellular ROS induces apoptosis by reducing the mitochondrial membrane potential via regulation of the AMPK-p38 MAPK signaling pathway in HCT116 colon cancer. Int J Oncol 2016;49:1088–98. https://doi.org/10.3892/ijo.2016.3578.Suche in Google Scholar PubMed
27. Shafiee, G, Saidijam, M, Tavilani, H, Ghasemkhani, N, Khodadadi, I. Genistein induces apoptosis and inhibits proliferation of HT29 colon cancer cells. Int J Mol Cell Med 2016;5:178–91.Suche in Google Scholar
28. Song, G, Xu, S, Zhang, H, Wang, Y, Xiao, C, Jiang, T, et al.. TIMP1 is a prognostic marker for the progression and metastasis of colon cancer through FAK-PI3K/AKT and MAPK pathway. J Exp Clin Cancer Res 2016;35:1–12. https://doi.org/10.1186/s13046-016-0427-7.Suche in Google Scholar PubMed PubMed Central
© 2023 the author(s), published by De Gruyter, Berlin/Boston
This work is licensed under the Creative Commons Attribution 4.0 International License.
Artikel in diesem Heft
- Frontmatter
- Review
- Metabolomics: a review of liquid chromatography mass spectrometry-based methods and clinical applications
- Opinion Papers
- Green transformation in the health sector and medical laboratories, adaptation to climate change in Türkiye
- Forward steps in green medical laboratory practices for a sustainable future
- Research Articles
- Comparison of the immunoassay method with the commercial and in-house LC-MS/MS methods for substance abuse in urine
- Peroxisome proliferator-activated receptor gamma and osteoprotegerin levels as an indicator and diagnostic predictor of endothelial dysfunction
- Gingival status and prophylactic oral hygiene measures modulate salivary amino acids’ profile in children with plaque-induced gingivitis
- FIB4 score is increased in severe preeclampsia
- The effects of a single dialysis session on serum hepcidin levels
- Gestational diabetes mellitus is associated with a low serum level of mitochondrial-derived peptide-MOTS-C
- Ideal timing of labor in terms of oxidative stress – which term period is best?
- Synergistic role of thymoquinone and 5-fluorouracil in U-251MG glioblastoma cell line
- Effect of oligosaccharides and aerobic training on hyperglycemia, growth and intestinal microbial diversity of diabetic rats
- Association of AdipoQ (G>T) gene polymorphism with obesity and hypertension in North Indian postmenopausal women of Punjab
- The attraction of paraoxonase-1 associated with the MAPK pathway on colon carcinoma cells
- Resveratrol modulates miRNA machinery proteins in different types of colon cancer cells
- The relationship between ASIC3 gene polymorphism and fibromyalgia syndrome
- Expression levels of genes involved in lipogenesis and cholesterol synthesis in adenomyosis
- Frequency of thrombophilia-associated mutations and polymorphisms in pregnant women with a history of thrombosis or pregnancy complications