Comparison of the immunoassay method with the commercial and in-house LC-MS/MS methods for substance abuse in urine
-
Gamze Avcioglu

 ,
Gulsen Yilmaz
,
Safak Yalcin Sahiner
,
L. Didem Kozaci
,
Ceylan Bal
and
Fatma Meric Yilmaz
,
Gulsen Yilmaz
,
Safak Yalcin Sahiner
,
L. Didem Kozaci
,
Ceylan Bal
and
Fatma Meric Yilmaz

Abstract
Objectives
The aim of this study was to compare the analytical performance of the KIMS (kinetic interaction of microparticles in solution) immunochemical method with a validated in-house and a commercial LC-MS/MS method.
Methods
The urine samples of the 100 subjects were included in the present study. The urine samples were analysed with Roche DAT immunochemical method based on KIMS method. In-house LC-MS/MS method was validated for 58 parameters according to the CLSI C62-A recommendations with the following parameters: matrix effect, lower limit of quantification (LLOQ), linearity, intra-day and inter-day precision and accuracy. Eureka Lab Division Drugs of Abuse kit was used as the commercial LC-MS/MS method.
Results
The immunochemical method had a satisfactory performance with specificity, sensitivity and accuracy values above 80 % and met the DRUID recommendation except benzodiazepines. The sensitivity and specificity of the immunochemical method were between 97–100 % and 84–100 %, respectively (except for benzodiazepines). The bias obtained for THC-COOH, morphine and codeine parameters were −17.5, 24.6 and 43.6 between two LC-MS/MS methods. The commercial method had a tendency to have a negative bias except for cannabinoids.
Conclusions
The analytical performance of the KIMS-based urine immunochemical method was found to be satisfactory for the intended use, except for benzodiazepines. The validated urine in-house LC-MS/MS method was found to be a good alternative for confirmation of substance abuse.
Introduction
Substance use disorder represents a worldwide problem that negatively affects the individual and society in terms of health, economic and social life. Various methods and sample types are used in the diagnosis and follow-up of substance use disorder. The most commonly used samples in substance analysis are urine, serum, plasma, oral fluid, hair, nail and meconium [1]. Results might vary depending on the method and sample type.
Immune methods are used as screening methods in substance analysis, and methods such as liquid chromatography tandem mass-spectrometry (LC-MS/MS), gas chromatography-mass spectrometry (GC-MS) are used as confirmation methods [2]. Immunochemical method provide a baseline result and obtained results are needed to be confirmed with a specific technique if necessary. Immunochemical method is the most widely used screening method for drug analysis due to its ease of use and automation, low cost and high speed [3, 4]. The disadvantages of immunological tests are poor specificity, obtaining qualitative or semi-quantitative results, and false positive or false negative results due to cross-reactivity [1, 5, 6]. Chromatographic and mass spectrometric methods give reliable and accurate quantitative results in the evaluation of substance abuse due to their high sensitivity and specificity.
Urine, blood and oral fluid are the most preferred specimens for substance analysis [7]. Depending on the purpose of use, urine or blood sample has many advantages. Urine is the preferred sample type for workplace testing or medical purposes, as it has advantages such as high amount of substances and metabolite in the urine, large sample quantity, easy sampling, lower cost analysis, and substance detection in days to months [8], [9], [10]. However, the substance concentrations in the urine are not correlated to the clinical symptoms and/or degree of impairment [7, 11]. The blood sample is particularly advantageous in determining the short-term exposure of the substance abuse, especially in road-side testing. The substance concentrations in the blood correlate with clinical symptoms and are unlikely to adulteration. Oral fluid is becoming more and more used in substance analysis due to its many advantages. These advantages are that a positive test result shows short-term exposure of the substance abuse, having correlation to blood/plasma concentrations and, therefore, to the clinical symptoms and/or degree of impairment, and providing simple and non-invasive sample collection [7]. In general, when evaluating these matrices, it is important to keep in mind that urine has higher drug metabolite concentrations, but oral fluid and blood have higher parent drug concentrations [11]. It is also necessary to know the time of substance use and to decide to use the appropriate sample type at that time.
In this study, we used the same matrix for substance screening and confirmation to eliminate the matrix effect, and we analysed two LC-MS/MS methods in urine, since urine matrix was used in the immunochemical method. It was aimed to compare the analytical performance of the KIMS immunochemical method with a validated in-house and a commercial LC-MS/MS method.
Materials and methods
Subjects and ethics
The present study was consisted of a total of 100 volunteers who admitted to the Alcohol and Substance Addiction Treatment and Education Center (AMATEM) for treatment. This study was approved by the Research Ethics Board of Ankara Atatürk Training and Research Hospital. All volunteers gave a written consent. The authors confirmed in writing that they have complied with the World Medical Association Declaration of Helsinki regarding ethical conduct of research involving human subjects and/or animals.
Inclusion criteria for the study; was to be between the ages of 18–65, to be diagnosed with substance use disorder according to DSM-5 criteria, and to be literate. Individuals who were clinically and intellectually incompetent (e.g., mental retardation, psychosis), diagnosed with smoking or alcohol use disorder other than illegal substances, whose samples were invalid according to sample integrity tests, who did not meet the sample collection criteria (e.g., adulteration of the urine before testing, or insufficient urine sample) were excluded from the study.
Sociodemographic and drug questionnaires data of the volunteers were obtained. Urine samples were analysed in the laboratory of AMATEM using Roche Cobas® 6000 plus immunochemical method system according to the manufacturer’s instructions. The immunochemical method analyses were done on the same day of urine collection. After immunochemical method analysis, these samples were aliquoted for LC-MS/MS analyses, immediately placed in the −80±2 °C freezer and kept at −80±2 °C until analysis day by LC-MS/MS. The in-house and the commercial LC-MS/MS analyses were performed with an ABSCIEX Triple Quad™ 3500 Instrument system in Ankara Yıldırım Beyazıt University Central Research Laboratory.
Roche Cobas® DAT immunochemical methods
The measurement principle of the Roche DAT immunochemical method was KIMS [12]. Reagents, calibration and control materials for the immunochemical method testing were purchased from Roche Diagnostics GmbH (Roche Diagnostics, 68305 Mannheim, Germany). Calibration and control studies were performed every working day. The Roche Cobas DAT system allows a semi-quantitative detection of the substance abuse based on six point calibration curves. Two quality control (QC) samples were analysed to check the performances of the system. The calibration curves ranges were 0–2000 ng/mL for opiates; 0–5000 ng/mL for amphetamine/methamphetamine and cocaine; 0–300 ng/mL for cannabinoids; 0–1000 ng/mL for benzodiazepines. The measured drugs and metabolites are as follows: benzodiazepines (nordiazepam), amphetamines (D-methamphetamine), opiates (morphine), cocaine (benzoylecgonine) and cannabinoids (11-nor-Δ9 THC-9-carboxylic acid, THC-COOH) were screened with the Roche Cobas® DAT immunochemical methods. The cut-off concentrations of the amphetamines, cocaine, opiates, benzodiazepines and cannabinoids were 500, 150, 300, 300 and 50 ng/mL, respectively. For detection of opiates, Roche offers two applications for the KIMS assay: 300 and 2000 ng/mL. 300 ng/mL was used routinely in the AMATEM and it was used for the confirmation studies. The results of the immunochemical method were confirmed by the in-house LC-MS/MS method. Cross reactivity lists for each parameter were provided by the manufacturer in the performance guide [13].
Eureka lab division drugs of abuse LC-MS/MS method
Eureka lab division drugs of abuse in urine by LC-MS–Code LC74010 (60033 Chiaravalle (AN), Italy) kit was used. ABSCIEX Triple Quad™ 3500 Instrument system was used for the confirmation studies. Eureka lab division drugs of abuse LC-MS/MS method (commercial method) was compared with the in-house LC-MS/MS method. The column was RESTEK LC Columns (50 mm × 2.1 mm, particle size of 5 μ) (Bellefonte, PA 16823, USA) which maintained at 40 °C. Multiple reaction monitoring mode (MRM) was used for the optimization of the parameters. Negative electrospray ionization (ESI−) mode was used for THC-COOH, THC, 11-OH THC and positive electrospray ionization mode (ESI+) for the other substances. Ion spray voltage was set at 3500 V, and analysis time was 18 min. Injection volume was 20 μL. The flow rate was 500 μL min−1. The mobile phase was consist of water:formic acid 100:0.1 (v/v) (component A) and acetonitrile:formic acid 100:0.1 (v/v) (component B). The gradient was: from t=0 to 10 min 90 % A; from t=10 to 15 min a linear gradient from 90 to 10 % A; from t=15 to 15.5 min a linear gradient from 10 to 90 % A; from t=15.5 to 18 min, 90 % A which was maintained for 2.5 min to re-equilibrate the system. Multi Quant 3.0.2 and Analyst 1.6.2. were used for the data analysis. The samples were prepared with a centrifuge for Eppendorf, Thermo Scientific Micro CL 21R (Waltham, MA 02451, USA).
A total of 23 parameters were detected by commercial LC-MS/MS method; morphine, amphetamine, pseudoephedrine, methamphetamine, 3,4-methylenedioxyamphetamine (MDA), tetrahydrocannabinol (THC), 3,4-methylenedioxy-N-ethylamphetamine (MDEA), 11-nor-9-carboxy-Δ9-tetrahydrocannabinol (THC-COOH), 3,4-methyl-enedioxy-methamphetamine (MDMA), diazepam, oxazepam, lorazepam, midazolam, clonazepam, flurazepam, 6-monoacetylmorphine (6-MAM), codeine, oxycodone, methadone, 2-ethylidene-1,5-dimethyl-3,3-diphenylpyrrolidine (EDDP), norbuprenorphine, buprenorphine and ketamine. MS parameters of the substances are given in (Supplementary Table 1). Measurement range of the commercial method was from 10 to 10,000 ng/mL for opiates, methadone and metabolites, amphetamines and metabolites and from 1 to 1000 ng/mL for THC and norbuprenorphine metabolite.
In-house LC-MS/MS method
ABSCIEX Triple Quad™ 3500 Instrument system was used for the in-house LC-MS/MS studies. All chemicals and deuterated internal standards (I.S.) used in in-house LC-MS/MS method were obtained from Cerilliant (Round Rock, TX) or Chiron AS (Trondheim, Norway). Analytical or HPLC grade solvents and chemicals were used. The column was Thermo Scientific Hypersil gold (100 mm × 2.1 mm, particle size of 3 μ) (Waltham, MA 02451, USA) which was set at 30 °C. Selective Reaction Monitoring (SRM) was used for the optimization of the parameters. Ion spray voltage was set at 4500 V, and analysis time was 15 min. The negative electrospray ionization (ESI−) mode was implemented for THC-COOH, THC, 11-OH THC and the positive electrospray ionization mode (ESI+) for the other substances. The flow rate was 350 μL min−1. The water:formic acid 100:0.1 (v/v) (component A) and acetonitrile:formic acid 100:0.1 (v/v) (component B) were used for mobile phase. The gradient was: from t=0 to 1 min 97 % A; from t=1 to 2 min, a linear gradient from 97 to 70 % A; from t=2 to 5 min 70 % A; from t=5 to 6 min, a linear gradient from 70 to 5 % A; from t=6 to 13 min 5 % A; from t=13 to 13.1 min, a linear gradient from 5 to 97 % A; from t=13.1 to 15 min 97 % A which was maintained for 2 min to re-equilibrate the system. Injection volume was 20 μL. Multi Quant 3.0.2 and Analyst 1.6.2 were used for the data analysis. The samples were prepared with a centrifuge for Eppendorf, Thermo Scientific Micro CL 21R (Waltham, MA 02451, USA).
A total of 58 parameters were detected by in-house LC-MS/MS method; morphine, methamphetamine, α-PVP, lysergic acid diethylamide (LSD), 4-OH-N-methylamphetamine, buprenorphine, amphetamine, MDA, JWH-250, MDMA, THC, cocaine, 11-OH THC, benzoylecgonine, diazepam, oxazepam, ketamine, cathinone, alprazolam, 1-(4-Chlorophenyl)piperazine, pregabaline, flunitrazepam, lorazepam, phenazepam, Cumyl-Butinaca, midazolam, JWH-200, pseudoephedrine, clonazepam, Apinaca, cannabidiol, 6-MAM, cocaethylene, hydromorphone, codeine, oxymorphone, piperazine, XLR-11, oxycodone, RCS-4, hydrocodone, THC-COOH, EDDP, methadone, thebaine, phencyclidine, flurazepam, AB-PINACA, JWH-122, MDEA, AB-CHMINACA, PB-22, AM-2201, gabapentin, MDMB-CHMICA, heroin, methylphenidate, and fentanyl. MS parameters of the substances are given in (Supplementary Table 2).
Calibrator, control and sample preparation for in-house method
In house LC-MS/MS method was developed and further validated using drug-free (blank) urine samples from volunteers. All analytes were prepared in methanol and the concentrations of the stock solutions were 1 mg/mL. Serial dilution was used for the preparation of the solutions for calibrators. Different concentrations were achieved in each groups, then it was added to 100 μL blank urine. The concentrations of the calibrators of the substance groups were generated following: natural cannabinoids (6.25, 12.5, 25, 50, 125 and 250 ng/mL); phencyclidine and synthetic cannabinoids (0.63, 1.25, 2.5, 6.25, 12.5 and 25 ng/mL); opiates and opioids (12.5, 50, 125, 250, 500 and 1000 ng/mL); 6-MAM (2.5, 5, 10, 15, 25 and 50 ng/mL); benzodiazepines, cocaine, amphetamines, methamphetamine/MDMA (12.5, 50, 125, 250, 500 and 1000 ng/mL); fentanyl (1.25, 5, 12.5, 25, 50 and 100 ng/mL); for pregabalin and gabapentin (62.5, 125, 250, 625, 1250 and 2500 ng/mL).
Serial dilution was implemented for the preparation of the quality controls (QC). Low and high concentrations of QC were fortified in 100 μL blank urine and obtained following concentrations; benzodiazepines, amphetamines, cocaine, methamphetamine/MDMA (100 and 500 ng/mL); opiates (100 and 300 ng/mL); 6-MAM (10 and 50 ng/mL); natural cannabinoids (50 and 150 ng/mL); synthetic cannabinoids (10 and 50 ng/mL); other parameters (200 and 1000 ng/mL). The concentration of the ISTD mix solutions (with methanol) was 50 ng/mL. Amber vials were used for the solution protection at −20 °C.
The raw urine samples were allowed to reach room temperature. The samples were centrifuged at 4600× rpm for 5 min and the supernatant were collected. A mixture solution comprising 500 µL supernatant, 35 µL IS working solution, and 30 µL NaOH was added. The mixture solutions were chemically hydrolysed for 45 min at 65 °C, 30 µL acetic acid was added and the mixture solutions were extracted by drug extraction tube (EqC, Ankara, Turkey). The mixture solutions were vortexed and centrifuged at 4600× rpm for 5 min. The supernatant phase were poured into glass vials (1.5 mL, Infochroma, Zug, Switzerland) and measured by LC–MS/MS.
Calibrator, control and sample preparation for commercial method
Calibrators, controls and samples were prepared based on the manufacturer’s instructions. All calibrators and controls were prepared in ultrapure water. The urine samples were allowed to reach room temperature. 500 μL sample (calibrator, control or urine sample) added to a centrifuge tube and spiked with 50 μL Reagent A (chemical hydrolysis solution for THC), 100 μL Reagent B (enzymatic hydrolysis solution for opiates) and 50 μL atropine labelled I.S. were added. The samples were hydrolysed for 1 h at 60 °C. After cooling to room temperature, the samples were centrifuged at 14,000× rpm for 5 min and the supernatant were collected. An Eppendorf tube was filled with 100 µL supernatant were taken and 100 µL of reagent D was added. This mixture was vortexed, filled into vials and analysed by LC-MS/MS system.
Method validation
Method validation studies were performed according to CLSI C62-A recommendations for bioanalytical based on the following parameters: linearity, intra-day and inter-day precision, matrix effect, lower limit of quantification (LLOQ), and accuracy [14], [15], [16].
Data analysis
The results obtained by Roche DAT immunochemical methods were compared with commercial and in-house LC-MS/MS methods. Commercial and in-house LC-MS/MS methods were also compared with each other. The immunochemical method results which were resulted in positive or negative based on screening test cut-off levels were confirmed with the results of in-house LC-MS/MS method. The cut-off limits recommended by European Guidelines for Workplace Drug Testing in Urine were used for the confirmation of the immunochemical method results [17]. The confirmation cut-off concentrations of the amphetamines, cocaine, opiates, 6-MAM, benzodiazepines and cannabinoids were 200, 100, 300, 10, 100 and 15 ng/mL, respectively [17].
Samples with positive or negative results by immunochemical method were defined as true positive (TP) or true negative (TN) after confirmation by LC-MS/MS. Samples measured positive by immunochemical method, but the target drug was not detected at the determined confirmation cut-offs defined false positive (FP). Samples measured negative, but the target drug was detected at the assigned confirmation cut-offs defined false negative (FN). Sensitivity, specificity, positive predictive value (PPV), negative predictive value (NPV), prevalence were calculated and the acceptable performance criteria for these parameters were evaluated as >80 %, in agreement with the Driving under the Influence of Drugs, Alcohol and Medicines (DRUID) and ROSITA, ROSITA-2 projects [18].
Statistical analysis
Descriptive statistics were calculated for the three methods using SPSS version 22 (Statistical Package for the Social Sciences, Chicago, IL, USA). Kolmogorov–Smirnov test was used for the distribution of the data. The correlation analyses were tested by Pearson’s or Spearman correlation test. A p-value of <0.05 was considered statistically significant. Bland–Altman analysis, Passing Bablok regression analysis and correlation coefficients were used to study interchangeability between results from the commercial and in-house LC-MS/MS methods with in-house LC–MS/MS as a reference. No constant bias between the methods was defined as when the 95 % confidence interval (CI) of the intercept of the regression line included zero. Similarly, no proportional bias was defined as when the 95 % confidence interval for the slope of the regression line included one. Bland–Altman and Passing and Bablok graphs were plotted using MedCalc software version 15.8 (MedCalc Software bvba, Ostend, Belgium). Analytical performance parameters and their confidence intervals were calculated using a MedCalc diagnostic test evaluation calculator.
Results
Analytical performance results of the immunochemical method
A total of 100 volunteers, 92 males (age between 18 and 60 years) and eight females (age between 20 and 27 years), were included in the study. Sociodemographic and drug questionnaire data were given in (Supplementary Table 3).
The analytical performance results of the immunochemical method are given in Table 1. The sensitivity results of the immunochemical method for amphetamines, cocaine, opiates and cannabinoids were determined as 100, 100, 97 and 97, respectively. The specificity results of the immunochemical method for amphetamines, cannabinoids, cocaine, benzodiazepines, and opiates were determined as 100, 100, 99, 90, and 85, respectively. The immunochemical method had a satisfactory performance with sensitivity, specificity, PPV, NPV and accuracy values above 80 % and met the DRUID recommendation except benzodiazepines (Table 1).
The results of analytical performance of Roche Cobas® DAT immunochemical method based on in-house LC-MS/MS method.
| Amphetamines | Cocaine | Benzodiazepines | Cannabinoids | Opiates | |
|---|---|---|---|---|---|
| TP | 24 | 11 | 0 | 38 | 38 |
| TN | 76 | 88 | 90 | 61 | 52 |
| FP | 0 | 1 | 10 | 0 | 9 |
| FN | 0 | 0 | 0 | 1 | 1 |
| Sensitivity, % (95 % CI) | 100 (82.8–100) | 100 (67.9–100) | N/A | 97 (84.9–99.9) | 97 (86.5–99.9) |
| Specificity, % (95 % CI) | 100 (94.0–100) | 99 (93.9–99.9) | 90 (82.4–95.1) | 100 (92.6–100) | 85 (73.8–93.0) |
| Accuracy, % (95 % CI) | 100 (96.4–100) | 99 (94.6–99.9) | N/A | 99 (94.6–99.9) | 90 (82.4–95.1) |
| Prevalence, % (95 % CI) | 24 (16.3–33.8) | 11 (5.8–19.2) | 0 | 39 (29.5–49.2) | 39 (29.4–49.3) |
| PPV, % (95 % CI) | 100 (82.8–100) | 92 (59.7–99.6) | 0 (0–30.9) | 100 (88.6–100) | 81 (69.7–88.6) |
| NPV, % (95 % CI) | 100 (94.0–100) | 100 (94.8–100) | 100 (94.6–100) | 98 (90.2–99.9) | 98 (88.2–99.7) |
-
CI, confidence interval; N/A, not applicable.
Sensitivity, specificity and accuracy for amphetamines were determined as 100 %. For cocaine analysis by immunochemical method, only one FP result was detected and the specificity of immunochemical method for cocaine was 99 %. The cocaine (benzoylecgonine) value of the FP sample was determined as 418 ng/mL by immunochemical method and determined 82.5 ng/mL by the in-house LC-MS/MS method. Thus, this level was considered FP because it was lower than the cut-off limit (<100 ng/mL) of the confirmation method. As a result of having no TP or FN samples for benzodiazepines, sensitivity and accuracy could not be calculated. The analysis of benzodiazepines by immunochemical method was confirmed by LC-MS/MS and 10 FP results were obtained. Benzodiazepines were detected in eight of these results by both LC-MS/MS methods. However, benzodiazepine levels in these samples were between 10.6 and 24.7 ng/mL and they were below the cut-off limit of the confirmation method (100 ng/mL). Oxazepam, diazepam, flunitrazepam and lorazepam were determined in these samples by the confirmation method.
The cannabinoid analysis by immunochemical method was confirmed by LC-MS/MS method and only one FN result was detected. The THC-COOH level in this sample was determined as 5 ng/mL LC-MS/MS method (confirmation cut-off was 15 ng/mL), respectively. Since this result was below the immunochemical method cut-off limit (50 ng/mL), it was determined as negative according to the immunochemical method.
The opiate analysis by immunochemical method was confirmed by LC-MS/MS method and nine FP results were determined. The morphine levels of the false positive samples were between 7.82 and 78.02 ng/mL according to in-house LC-MS/MS method (Supplementary Table 4). According to the drug questionnaire data of two of the nine volunteers with a FP result, it was declared that these volunteers used heroin 24 h before giving a urine sample. In the drug questionnaire data of nine volunteers with a FP result, it was stated that these volunteers used cannabinoids or used heroin 48 h before giving a urine sample. When 2000 ng/mL was used as the cut-off limit, it was determined that eight of the results obtained as TN and the specificity would have increased from 85 to 98 % and the sensitivity would be 98 %. According to the drug questionnaire data of the volunteer whose one FN result was found in opiate analysis by immunochemical method, it was stated that the volunteer used 3.5–4 g of heroin 6–12 h before giving a urine sample. The opiates result (6-MAM, morphine and codeine were detected) was found to be positive even when the urine sample of this volunteer was detected by the commercial LC-MS/MS method.
Validation of the LC-MS/MS method
The in-house LC–MS/MS method is capable of detecting 58 substance in urine and was fully validated according to the guidelines of the CLSI C62-A. The validation results are presented in (Table 2).
The validation results of the in-house LC-MS/MS method.
| Parameters | Linearity (n=5) | Lowest QC level | Highest QC level | Matrix effect (n=5) | Accuracy (n=5) | ||||||||||
|---|---|---|---|---|---|---|---|---|---|---|---|---|---|---|---|
| LOD, ng/mL | LLOQ, ng/mL | (R2) | CV% (intra-day) (n=16) | CV% (inter-day) (n=40) | Conc. | CV% (intra-day) (n=16) | CV% (inter-day) (n=40) | Conc. | ME% | RE% | PE% | Calibrator level 3 | Calibrator level 4 | Calibrator level 5 | |
| Methamphetamine | 5 | 12.5 | 0.995 | 4.9 | 6.1 | 100 | 4.8 | 6 | 500 | 126.5 | 94 | 125.2 | 95.9 | 105.4 | 104.2 |
| Cocaine | 5 | 12.5 | 0.996 | 5.1 | 6.4 | 100 | 2.8 | 6.3 | 500 | 87.8 | 47.2 | 38.6 | 105.7 | 93.4 | 103.1 |
| THC-COOH | 1 | 6.25 | 0.996 | 9.6 | 10.3 | 50 | 9.4 | 8.9 | 150 | 89.1 | 96 | 85.5 | 109.2 | 98.1 | 98.3 |
| Amphetamine | 5 | 12.5 | 0.996 | 5.7 | 7.6 | 100 | 2.3 | 7.1 | 500 | 121.3 | 98.7 | 153.7 | 103.3 | 104.3 | 97.7 |
| 6-MAM | 0.2 | 0.63 | 0.997 | 14 | 14.5 | 10 | 13 | 13.9 | 50 | 96.2 | 96.7 | 86.9 | 88.8 | 99.3 | 114.8 |
| Morphine | 5 | 12.5 | 0.996 | 7.8 | 8.6 | 100 | 7.8 | 9.5 | 300 | 90.1 | 123.5 | 104.3 | 99.9 | 107.8 | 100.3 |
| Diazepam | 5 | 12.5 | 0.998 | 5.1 | 6.7 | 100 | 4.6 | 7.3 | 500 | 80.3 | 94 | 76.1 | 117.9 | 117.1 | 99.8 |
| Oxazepam | 5 | 12.5 | 0.998 | 7.5 | 7.8 | 100 | 7 | 7.5 | 500 | 94.1 | 74.4 | 70.1 | 111.7 | 108.2 | 104.8 |
| AB-CHIMINACA | 0.2 | 0.63 | 0.998 | 17.4 | 18.3 | 10 | 12.8 | 15.9 | 50 | 104 | 103 | 119.2 | 103.4 | 91.2 | 111 |
| Codeine | 5 | 12.5 | 0.996 | 10.5 | 11.2 | 100 | 9.7 | 10 | 300 | 95.8 | 96.7 | 86.9 | 91.9 | 107.2 | 104.1 |
| α-PVP | 0.2 | 0.63 | 0.999 | 11.5 | 17.7 | 10 | 10 | 15 | 50 | 80.5 | 113.3 | 104.7 | 88.3 | 102 | 107.7 |
| Alprazolam | 5 | 12.5 | 0.996 | 9.9 | 16.2 | 100 | 8.2 | 16.7 | 500 | 93 | 90 | 83.4 | 90.4 | 104.8 | 99.3 |
| AM-2201 | 0.2 | 0.63 | 0.995 | 9.7 | 15.1 | 10 | 6.1 | 17.9 | 50 | 90.8 | 101.3 | 91.2 | 90.7 | 114.9 | 101.8 |
| APINACA | 0.2 | 0.63 | 0.998 | 11.3 | 14.9 | 10 | 8 | 18.4 | 50 | 93.4 | 100 | 88.3 | 86.8 | 107.6 | 108.4 |
| Benzoylecgonine | 5 | 12.5 | 0.996 | 6.1 | 6.2 | 100 | 5.6 | 8.7 | 500 | 87.5 | 69.6 | 61.9 | 105.7 | 103.4 | 103.1 |
| Buprenorphine | 5 | 12.5 | 0.998 | 8.9 | 9.8 | 100 | 8.5 | 9.7 | 300 | 89.8 | 79.3 | 71.1 | 97.9 | 104.7 | 98.5 |
| Clonazepam | 5 | 12.5 | 0.997 | 11.4 | 18.8 | 100 | 9.4 | 17.4 | 500 | 102.6 | 77.6 | 78.8 | 109.2 | 102.6 | 101.4 |
| Cumyl Butinaca | 0.2 | 0.63 | 0.997 | 6.7 | 10 | 10 | 4.7 | 9.1 | 50 | 107.6 | 91.2 | 93.8 | 97.1 | 98.2 | 92.5 |
| EDDP | 5 | 12.5 | 0.998 | 1.6 | 4.3 | 100 | 1.4 | 4 | 300 | 100.2 | 40.7 | 40.8 | 100.3 | 101.9 | 99.6 |
| Phencyclidine | 5 | 12.5 | 0.999 | 7.8 | 8.3 | 200 | 11.3 | 18.3 | 1000 | 114.3 | 105.4 | 111.8 | 102.3 | 105.6 | 98.9 |
| Fentanyl | 5 | 12.5 | 0.996 | 6.7 | 8.2 | 100 | 4.8 | 6.3 | 300 | 86 | 85.9 | 73.9 | 98.9 | 98.8 | 100.5 |
| Flunitrazepam | 5 | 12.5 | 0.995 | 10.3 | 15.2 | 100 | 10.6 | 17.2 | 500 | 90.9 | 99.7 | 90.6 | 91.2 | 95.1 | 102.5 |
| AB-PINACA | 0.2 | 0.63 | 0.998 | 16.3 | 19 | 10 | 10.2 | 18.4 | 50 | 100.4 | 53.3 | 48.5 | 85.2 | 102.5 | 105.5 |
| Flurazepam | 5 | 12.5 | 0.996 | 3.6 | 4.9 | 100 | 2.4 | 5.5 | 500 | 102.3 | 76.6 | 72.5 | 109.9 | 102.1 | 101.6 |
| Gabapentin | 20 | 62.5 | 0.998 | 19.1 | 14.7 | 100 | 19.2 | 17.6 | 500 | 124.9 | 68.9 | 63.2 | 89.1 | 79 | 96 |
| Heroin | 5 | 12.5 | 0.996 | 4.1 | 7.9 | 100 | 3.9 | 9.4 | 300 | 99.6 | 104.9 | 105.4 | 108.8 | 103.3 | 97.5 |
| Hydromorphone | 5 | 12.5 | 0.998 | 4.6 | 6 | 100 | 4.2 | 5.8 | 300 | 88.4 | 105.6 | 91.7 | 93 | 106.4 | 105.9 |
| Hydrocodone | 5 | 12.5 | 0.997 | 7.5 | 9.4 | 100 | 6.9 | 10.5 | 300 | 92.1 | 100.5 | 86.2 | 118 | 122 | 102.8 |
| JWH-122 | 0.2 | 0.63 | 0.997 | 10.5 | 17.4 | 10 | 9 | 17.5 | 50 | 91.4 | 96.1 | 90.3 | 91.7 | 109.7 | 97.4 |
| JWH-200 | 0.2 | 0.63 | 0.998 | 7.9 | 10.2 | 10 | 7.3 | 10 | 50 | 90.6 | 110.2 | 99 | 98.8 | 110.1 | 96.5 |
| JWH-250 | 0.2 | 0.63 | 0.998 | 13.1 | 19.6 | 10 | 4.9 | 18.6 | 50 | 91.9 | 113.3 | 104.7 | 90.4 | 104.1 | 99.1 |
| Cannabidiol | 1 | 6.25 | 0.999 | 5.4 | 11.3 | 50 | 5.2 | 9.3 | 150 | 108.2 | 92.6 | 98.5 | 99.3 | 97.6 | 92.6 |
| Cathinone | 5 | 12.5 | 0.996 | 5.1 | 7.3 | 200 | 4.5 | 6.7 | 1000 | 123.5 | 104.6 | 122.2 | 93.6 | 101.9 | 104.8 |
| Ketamine | 5 | 12.5 | 0.995 | 5.1 | 13.9 | 200 | 4.9 | 13.8 | 1000 | 81.6 | 92.1 | 79.1 | 85.4 | 106.1 | 109.2 |
| Cocaethylene | 5 | 12.5 | 0.998 | 8.2 | 9.5 | 100 | 7.1 | 8.2 | 500 | 78.2 | 44.6 | 37.3 | 106.2 | 96.3 | 102 |
| LSD | 5 | 12.5 | 0.998 | 6.7 | 6.9 | 200 | 5.9 | 8 | 1000 | 120.5 | 105.1 | 118.2 | 104.5 | 111.4 | 97 |
| Lorazepam | 5 | 12.5 | 0.997 | 14 | 14.5 | 100 | 7.1 | 8.2 | 500 | 94.8 | 68.5 | 62.9 | 92.2 | 96.1 | 103.5 |
| MDA | 5 | 12.5 | 0.997 | 8.6 | 9 | 100 | 9.5 | 11.5 | 500 | 113.3 | 114 | 120 | 101.9 | 97.4 | 93.2 |
| MDEA | 5 | 12.5 | 0.998 | 3 | 3.9 | 100 | 3.1 | 4.1 | 500 | 102.3 | 100.3 | 102.7 | 100 | 104.4 | 99.7 |
| MDMA | 5 | 12.5 | 0.998 | 4.5 | 9.1 | 100 | 4.2 | 9.1 | 500 | 111.4 | 106.6 | 118.8 | 104.2 | 104.8 | 96.5 |
| MDMB CHIMICA | 0.2 | 0.63 | 0.999 | 17.6 | 19.1 | 10 | 12.2 | 18.4 | 50 | 96.9 | 100.7 | 97.6 | 90.5 | 117 | 108.6 |
| Methadone | 5 | 12.5 | 0.996 | 5.1 | 10.5 | 50 | 4.4 | 9.1 | 150 | 113.6 | 42.5 | 47.3 | 102.7 | 98.5 | 98.4 |
| Methylphenidate | 5 | 12.5 | 0.996 | 5.7 | 9.4 | 50 | 3.9 | 7.9 | 250 | 97.6 | 104.9 | 105.4 | 96.3 | 91.5 | 104.6 |
| Midazolam | 5 | 12.5 | 0.998 | 4.3 | 8.1 | 100 | 3.1 | 5.9 | 500 | 104.6 | 75.6 | 76.8 | 109.7 | 108.1 | 104.8 |
| Oxycodone | 5 | 12.5 | 0.995 | 7.4 | 8.8 | 100 | 6.6 | 9.1 | 300 | 99.2 | 106.9 | 103.4 | 109.4 | 107.3 | 93.2 |
| Oxymorphone | 5 | 12.5 | 0.994 | 6.3 | 7 | 100 | 6 | 7.3 | 300 | 87.5 | 76.9 | 66.5 | 109.1 | 111.7 | 106.5 |
| PB-23 | 0.2 | 0.63 | 0.997 | 9.4 | 10.6 | 10 | 5.6 | 9.4 | 50 | 78.8 | 94 | 76.1 | 70.3 | 118.5 | 98.7 |
| Phenazepam | 5 | 12.5 | 0.997 | 9.1 | 11.6 | 100 | 7.4 | 15.7 | 500 | 87.3 | 100.8 | 95.7 | 127.5 | 121.5 | 108.2 |
| Piperazine | 5 | 12.5 | 0.998 | 4.3 | 7.7 | 200 | 3.9 | 7 | 1000 | 104.3 | 78.1 | 77.5 | 102.3 | 93.6 | 102.8 |
| Pregabalin | 20 | 62.5 | 0.998 | 13.3 | 12.3 | 200 | 14.3 | 7.3 | 1000 | 121.2 | 106.6 | 118.8 | 101 | 104.5 | 103.2 |
| Pseudoephedrine | 5 | 12.5 | 0.999 | 6.8 | 12.4 | 200 | 5.6 | 7.8 | 1000 | 89.6 | 101.7 | 101.5 | 117.6 | 89.3 | 98.1 |
| RCS-5 | 0.2 | 0.63 | 0.996 | 13.6 | 18.2 | 10 | 5.9 | 19.2 | 50 | 90.2 | 108.7 | 98 | 93.9 | 107.3 | 101.1 |
| Thebaine | 1 | 6.25 | 0.995 | 12.7 | 15.7 | 50 | 7.3 | 12.4 | 150 | 88.8 | 86.5 | 79.2 | 96.3 | 99.4 | 93.9 |
| 11-OH-THC | 1 | 6.25 | 0.998 | 5.9 | 9.3 | 50 | 3.2 | 9.1 | 150 | 103.5 | 75.7 | 77.8 | 99.4 | 92.1 | 92.9 |
| THC | 1 | 6.25 | 0.998 | 7.2 | 9.6 | 50 | 5.3 | 9.7 | 150 | 102.7 | 76 | 78.5 | 97.8 | 94.2 | 93.6 |
| XLR-12 | 0.2 | 0.63 | 0.996 | 9.3 | 8.5 | 10 | 8.6 | 8.6 | 50 | 94.9 | 95.8 | 90.9 | 105.4 | 106.7 | 108.2 |
| 1-4-Chloropehnyl-piperazine | 5 | 12.5 | 0.998 | 11.1 | 13.2 | 100 | 6.5 | 11.2 | 500 | 128.9 | 104.7 | 138.9 | 123.8 | 101.4 | 94.9 |
| 4-OH-N-methyl-amphetamine | 5 | 12.5 | 0.997 | 6.1 | 8.1 | 100 | 6.8 | 11.8 | 500 | 112.6 | 97 | 109.2 | 102.6 | 127.7 | 95.3 |
-
Matrix effect% (ME%)=peak area of (post-extracted samples/un-extracted samples) * 100. Recovery of the extraction procedure% (RE%)=peak area of (pre-extracted samples/post-extracted samples) * 100. Process efficiencies% (PE%)=peak area of (pre-extracted samples/un-extracted samples) * 100.
The method was determined to be linear at nine levels. The mean regression coefficients (R2) of all parameters were greater than 0.9929. The back calculated concentrations of the calibration standards, and the CV% of the five replicates were within ±15 % of the nominal concentrations, and the LLOQ were within ±20 %.
Intra-day (CVs variable from 1.4 to 14.4 %) and inter-day (CVs variable from 3.9 to 14.7 %) reproducibility analyses were in agreement with the current criteria. The accuracy were between 85.2 and 118 % (calibrator 3), 79–122 % (calibrator 4) and 84.9–114.8 % (calibrator 5). The intra-day and inter-day precision and accuracy data were within the required limits.
The matrix effect (ME%), recovery of the extraction procedure (RE%) and process efficiencies (PE%) were determined at six levels. The reproducibility was satisfactory and within required limits (the CV was ≤15 %) for all substances. The ME%, RE% and PE% were between 78.2 and 128.9 %, 40.7–123.5 % and 38.6–138.9 %, respectively. The RE % was higher than 50 % (93.1 % of analytes) and below 50 % were noted for cocaethylene, cocaine, methadone and EDDP.
LLOQ values of the substance group were 12.5 ng/mL for amphetamine, metamphetamine, cocaine, benzodiazepines and opiates (2.5 for 6-MAM), 6.25 ng/mL for natural cannabinoids, 0.63 ng/mL for synthetic cannabinoids, and 62.5 ng/mL for pregabalin and gabapentin. The precision and accuracy results of five repeated measuements at the LLOQ levels for each substances were satisfactory according to the CLSI C62-A.
Method comparison of commercial and in-house LC-MS-MS methods
In our study, 23 and 58 parameters in urine were analysed by commercial and in-house LC-MS/MS methods, respectively. Parameters below the detection limit of the methods or when sufficient number of samples cannot be reached for comparison or analysed by only one of the methods were not included in the comparison. The results of the correlation, Passing–Bablok regression and Bland–Altman analysis of the parameters THC-COOH, morphine, codeine (amphetamine, methamphetamine, MDMA, MDA, pseudoephedrine, and oxazepam parameters were not included for the comparison, n<20) are shown in Tables 3, 4 and 5 and the plots are shown in Figure 1. The comparison were not evaluated for the amphetamine, methamphetamine, MDMA, MDA and oxazepam analysis since only 18, 14, 6, five and five measurements were used for the comparison.
The correlation results of the commercial and in-house LC-MS/MS methods.
| Analytes | n | r | p-Value | R2 |
|---|---|---|---|---|
| THC-COOH | 43 | r=0.849 | p<0.001 | R2=0.723 |
| Morphine | 39 | r=0.684 | p<0.001 | R2=0.594 |
| Codeine | 34 | r=0.702 | p<0.001 | R2=0.494 |
-
p-Value less than 0.05 were considered significant highlighted in bold.
The Passing–Bablok results of the commercial and in-house LC-MS/MS methods.
| Analytes | n | Equation | Slope (95 % CI) | Intercept (95 % CI) | p-Value |
|---|---|---|---|---|---|
| THC-COOH | 43 | y=23.7 + 0.78 x | 0.78 (0.59 – 0.99) | 23.7 (13.3 – 32.1) | 0.560 |
| Morphine | 39 | y=6.5 + 0.82 x | 0.82 (0.64 – 0.9) | 6.5 ((−16.8) – 176) | 0.130 |
| Codeine | 34 | y=(−5.4) + 0.66 x | 0.66 (0.55 – 0.76) | −5.4 ((−38.3) – 63.9) | 0.940 |
The Bland–Altman results of the commercial and in-house LC-MS/MS methods.
| Analytes | n | Bias (95 % CI) | Lower limit (95 % CI) | Upper limit (95 % CI) | p-Value |
|---|---|---|---|---|---|
| THC-COOH | 43 | −17.5 ((−31.9) − (−2.9)) | −109 ((−134) − (−84)) | 74.6 (49.7 − 99) | 0.019 |
| Morphine | 39 | 24.6 ((−0.9) − 50.1) | −129 ((−173) − (−85)) | 178 (134 − 222) | 0.058 |
| Codeine | 34 | 43.6 (18.8 − 68.5) | −95.9 ((−138) − (−53.1)) | 183 (140 − 226) | 0.001 |
-
p-Value less than 0.05 were considered significant highlighted in bold.
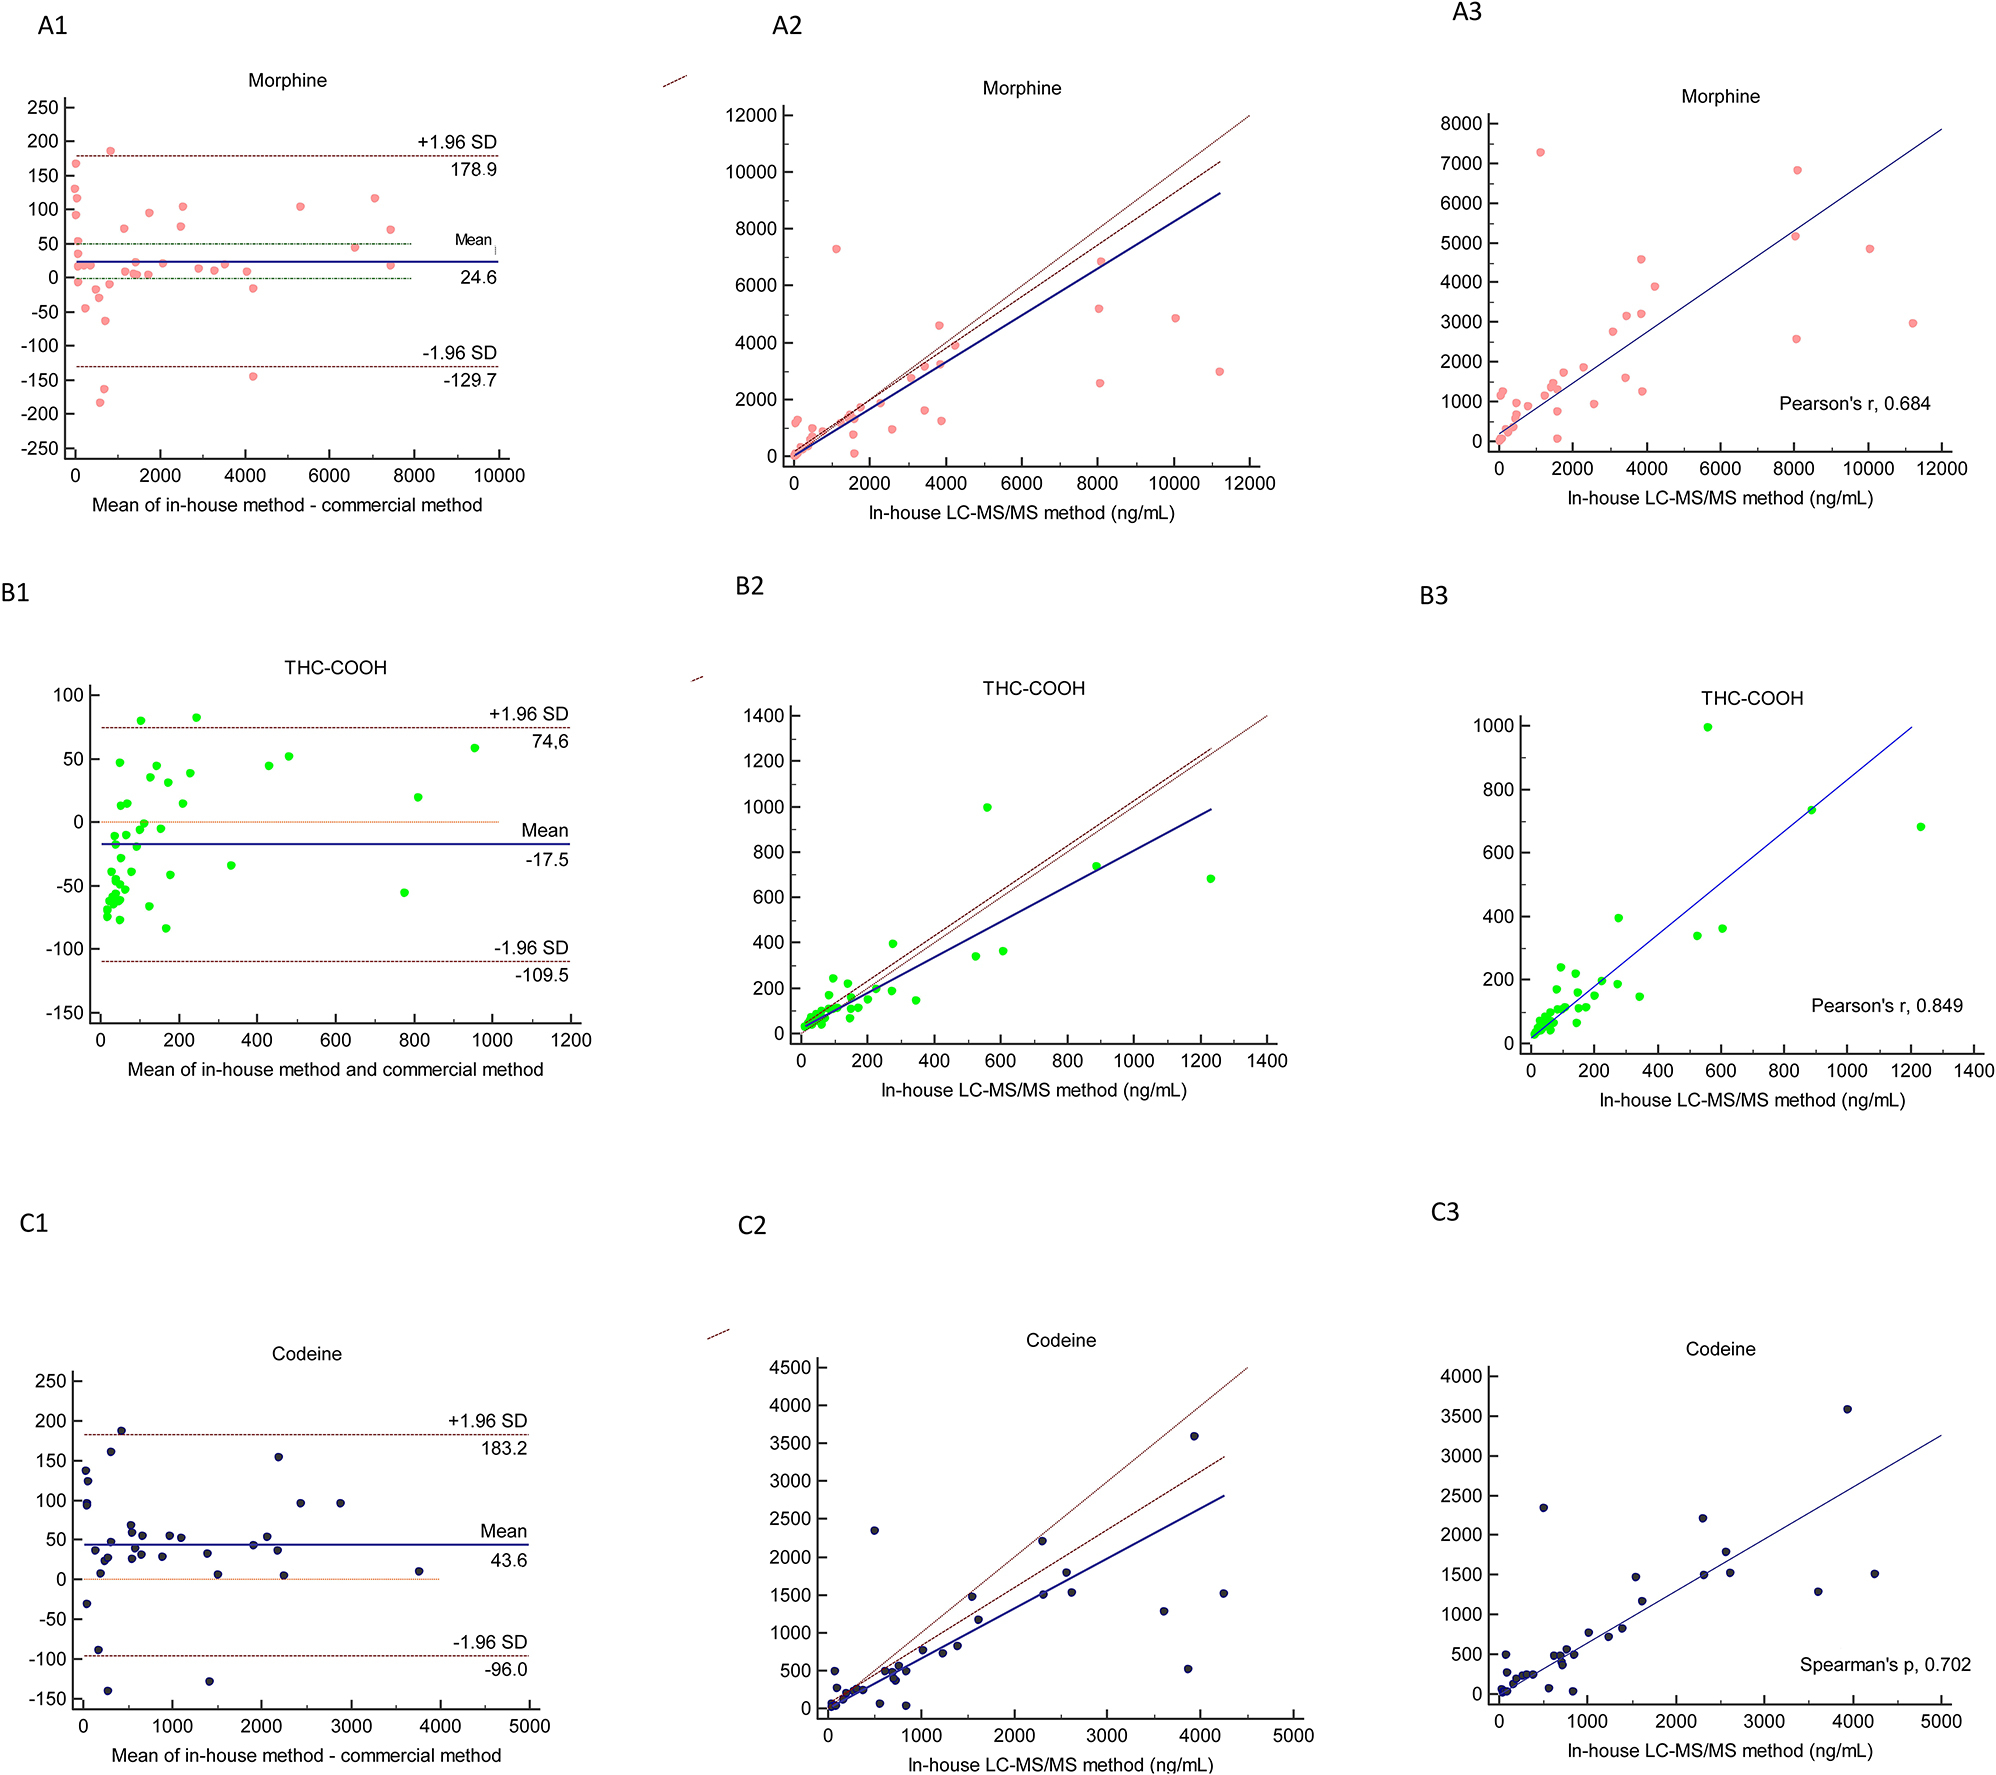
Method comparison of in-house LC–MS/MS and commercial LC–MS/MS by using Bland–Altman (1), Passing Bablok (2) and correlation (3) in the analysis of morphine (A), THC-COOH (B), codeine (C).
In-house and commercial LC-MS/MS methods were strongly correlated for the THC-COOH (r; 0.849). Both methods showed good correlation for morphine and codeine (r; 0.684 and 0.702, respectively). The correlation between the two methods for these parameters was highly significant (p<0.001), see Figure 1.
Based on Passing–Bablok regression data, there were no significant differences for any of the parameters between two LC-MS/MS methods (p>0.05). Passing and Bablok analysis indicated a proportional bias for codeine since the slope was 0.66 and the 95 % CI did not include 1. There was a constant bias for THC-COOH and the intercept was 23.7. Also for morphine a small proportional bias could be seen since the slope was 0.82 and the 95 % CI was 0.64–0.9, just outside the limits of including 1, see Figure 1.
The mean differences and the 95 % limit of agreement data and graphs of Bland–Altman analysis are presented in Table 5 and Figure 1. The negative bias was only obtained in the analysis of THC-COOH. Commercial LC-MS/MS method showed a constant bias for morphine, THC-COOH and codeine of 24.6, −17.5 and 43.6 %, respectively that compared with in-house LC-MS/MS method.
Two result of THC-COOH outside the 95 % CI had the concentrations of 63 and 144 ng/mL measured by the commercial method and 147 and 345 ng/mL by the in-house method Figure 1. The differences in THC-COOH were evenly scattered on both sides of the mean. There was a tendency of higher scatter in the upper concentration range.
Four results of morphine outside the 95 % CI and there were 6, 10, 22 and 25 times difference between both methods. The difference between the two methods was close to the mean for the analysis results obtained around 1500 ng/mL in the morphine analysis.
In the comparison of the results obtained for 23 parameters of the commercial and in-house LC-MS-MS methods, the evaluation was also made using the LOQ limits of the methods, and no clinical discrepancy was observed between the two methods in terms of diagnostic efficacy.
Discussion
The performance characteristics of the KIMS-based urine immunochemical method used in AMATEM clinics was evaluated by comparing it with the urine in-house LC-MS/MS in the present study. The in-house LC-MS/MS method was implemented for screening a total of 58 substances in urine and was further validated and applied to substance abuse analysis of 100 patient samples. The analytical performance of the screening methods used in the screening of substances for AMATEM or Probation Service in our country has a special importance. Since positive results for substance abuse testing could have medical/legal results, if deemed appropriate by the clinicians, positive immunochemical method results should be confirmed using a reference chromatographic method. The chromatographic methods are not used routinely in these services because of having disadvantages such as cost, labour, and practicality.
The KIMS-based urine immunochemical method exhibited good performance for all parameters that met the DRUID recommendation (>80 %) except benzodiazepines (Table 1). The sensitivity could not be calculated owing to having no TP and FN results. The sensitivity and specificity results of the immunochemical method except benzodiazepines were between 97–100 % and 83–100 %, respectively. Since immunochemical method results (except for benzodiazepines) are used in conjunction with data from clinical findings, positive or negative results should be confirmed as needed.
Immunochemical methods in drug testing suffer from interferences with biomolecules, other drugs or metabolites causing false positive results. Besides false positive results, adulteration risks are the crucial pitfalls leading to false negative results. Urine exchange (e.g. urine of a drug-free person), synthetic urine, urine dilution by drinking so much water before sampling or commercial adulterants are the most common adulteration techniques [19]. Substance abuse testing can be adultered in these ways which may not be determined by the immunochemical method [20]. Urine sample integrity analysis is performed to determine the possible adulteration of samples.
Amphetamine immunochemical methods are generally interacted with other cross-reacting drugs and substances that leads to FP results [21]. The structures of amphetamine and methamphetamines make it difficult to improve specific antibodies. Many drugs such as sympathomimetic, Vicks VapoInhaler™, H2 receptor blocker (ranitidine), antidepressant (fluoxetine, trazodone, bupropion), antiarrhythmic (mexiletine) have been reported to cause cross-reactions by the analysis of amphetamine immunochemical method [22, 23]. Since the sensitivity, specificity and accuracy of the KIMS assay used in our study was evaluated as 100 %, it was determined that the amphetamine performance of this method was quite good. The sensitivity and specificity of six immunochemical methods (ADx, EMIT, AxSYM, KIMS, EMIT N, KIMS X) were compared by Verstraete and Heyden in detecting amphetamines in urine and the results were confirmed by LC-MS/MS method [24]. The sensitivity for these six methods is between 93 and 95 % (excluding ADx 100 %). The specificity of the KIMS assay was found to be 88 % and the specificity of the other assays were varied between 88 and 100 %. In this study, we evaluated that FP (n=16) and FN (n=10) results might have been different from our study because the cut-off value used for amphetamine in the KIMS method was 500 ng/mL [24]. Lu and Taylor compared EMIT II and KIMS assays and they reported that the EMIT II assay had slightly better sensitivity in analysing true amphetamines positives while KIMS had slightly better specificity. The cut-off limits of the immunochemical methods used in this study were the same with our study [25].
The sensitivity and specificity of the immunochemical methods used in cocaine analysis are generally evaluated as good [26]. Our study aligned with this report that KIMS assay showed higher sensitivity and the specificity (100 and 99 %) for the cocaine. Cocaine immunochemical methods generally have lower cross reactivity since its metabolite benzoylecgonine has low structural similarity to common medications (commonly used local anaesthetics (e.g., tetracaine, lidocaine, and procaine)) or illicit drugs [27]. Coca leaves, topical and ophthalmic use of cocaine can cause false positive cocaine results in the urine [28]. Mazor et al. reported that each subject’s urine cocaine assay was positive (level exceeding 300 ng/mL) by 2 h after ingestion of coca tea. Three out of five participants’ samples stayed positive at 36 h in the study [29]. Coca tea consumption is not very common in our country and FP result is not expected due to this situation. Only one FP result obtained for cocaine immune analysis in the present study. The benzoylecgonine concentration of this urine was 82.5 ng/mL and it was below the cut-off limit of the confirmation limit (benzoylecgonine 100 ng/mL). Similar to our results, Bertholf et al. reported that the PPV value of the KIMS assay for cocaine was 100 % (number of the cases were 27) [30].
The ability of immunochemical methods to detect benzodiazepines is problematic due to variations in the efficacy, structure, metabolism and elimination of this group of drugs [31]. One of the most important limitation of immunochemical methods is the increased incidence of FP and FN results due to the different immunoreactivity of antibodies developed against benzodiazepines class drugs with different structural properties. Therefore, the sensitivity of benzodiazepines immunochemical methods is high, but the specificity varies.
In our study, the number of FP results was 10 in the analysis of the benzodiazepines by immunochemical method, and the specificity of the method was 90 %. The sensitivity could not be calculated owing to having no TP and FN benzodiazepines results. The benzodiazepines were lower than the confirmation cut-off limit in all sample by in-house LC-MS/MS method, but they were higher than the confirmation cut-off limit in two samples by commercial LC-MS/MS method. The benzodiazepines were detected in eight samples by in-house LC-MS/MS method, but the concentrations were lower than the confirmation cut-off limit (100 ng/mL).
The metabolite analysis of main substances such as alprazolam, midazolam, nitrazepam, lorazepam, flurazepam, clonazepam and phenazepam (hydroxyalprazolam, N-demethylflunitrazepam, 2-amino-5-nitrobenzophenone etc.) was not performed. Instead, oxazepam, the end product of metabolism of the frequently abused benzodiazepines such as chlordiazepoxide, diazepam, clorazepate, and prazepam, was analysed. TP results may not have been obtained because only the oxazepam metabolite was analysed. We evaluated that the 10 FP results might have been obtained because this immunochemical method showed cross-reactivity due to other benzodiazepines (whose metabolites were not analysed) or the drugs used by the volunteers (sertraline etc.). On the other hand, there was no declaration regarding the use of benzodiazepines by the volunteers according to the survey results.
The immunochemical methods for benzodiazepines also suffer from significant false negative results. The nordiazepam is generally used as a target metabolite for immune methods in benzodiazepines analysis [32]. However, benzodiazepines class drugs such as flurazepam, lorazepam, alprazolam, clonazepam and triazolam, which are not metabolized to oxazepam or nordiazepam, may not be detected by this type of immunochemical methods. False-negative results may be obtained, as an immunochemical method that can detect all metabolites is currently not available. The reason for the lack of FN immunochemical method results in this study may be that only oxazepam metabolite levels were analysed by in-house LC-MS/MS method.
The number of FN results was one and the number of FP results was 0 in cannabinoids analysis by immunochemical method and the sensitivity and the specificity of the method were 97 and 100 %, respectively in the present study.
The performance of the immunochemical method evaluated for THC analysis is successful. For the THC analysis by immunochemical method, FP results were obtained due to the interaction with the drugs in the studies, but not in this study [10]. In the study by Lyons et al., in which the KIMS method was compared with GC-MS in the cannabinoid analysis, the FN result was determined as 190 ng/mL and the number of the FP result was 2. In our study, the number of FN and FP results was found to be less, but while the number of samples analysed in our study was 100 ng/mL, it was 1689 ng/mL in that study [33]. FN with cannabinoids screening test is mainly originate from the use of synthetic cannabinoids that display psychoactive effects as cannabis when it is binding to endogenous cannabinoid receptors, but have extremely different structures [10]. Conventional cannabinoid screening immunochemical methods cannot detect synthetic cannabinoids. Recent immunochemical methods developed for specific synthetic cannabinoids were reported to have good performance at detecting JWH-018 and UR-144 [10, 34]. However, they are failed to detect new synthetic cannabinoids due to rapid change of their chemically structure. Thus, having immunochemical methods with wide cross-reactivity for synthetic cannabinoids might be useful in determining these drugs in patient samples. It is possible to detect new synthetic cannabinoids by LC-MS/MS, ultra-performance liquid chromatography-electrospray ionization tandem mass spectrometry (UPLC-MS/MS), nuclear magnetic resonance (NMR), Fourier transform infrared spectroscopy (FTIR) and quadrupole time-of-flight mass spectrometry (QTOF-MS) methodologies. The combined use of these methods constitutes a set of powerful tools, where structural elements and several compounds in a mixture can be identified, the accurate mass of the target analytes and information on functional groups in the molecule can be obtained [34, 35].
In opiate analysis by immunochemical method, the number of FN result is one and the number of FP results are 9, and the sensitivity and specificity of the method are 97 and 85 %, similar to the study of Hassan et al. (the number of FN and FP results were 0 and 9) [36]. False-positive interferences play an important role in the immunochemical method of opiates. Use of drugs such as codeine, hydrocodone, fluoroquinolone antibiotics, rifampicin, naloxone, and poppy consumption can give rise to FP test results with opiate immunochemical method screening [37].
SAMHSA recommends the use of a cut-off level of 2000 ng/mL for opiate immunochemical method screening tests to prevent false positive results due to consumption of food containing poppy seeds, which is a common interference [38]. In case the morphine concentration in the urine exceeds 2000 ng/mL, 6-MAM (cut-off 10 ng/mL) analysis is performed by immunochemical method in order to differentiate the morphine elevation due to heroin use and poppy use. In this study, 6-MAM was not detected in nine patients with FP results. Apart from 6-MAM, other markers (Thebaine, acetylated-thebaine-4-metabolite glucuronide (ATM4G), etc.) can also be used [39]. In particular, thebaine substance is detected in the urine as a result of poppy use, after heroin use, it is not detected in the urine. However, thebaine was not detected in any of the patients in our study. It was evaluated that the FP results were not related to the use of opium poppy. When 2000 ng/mL is used as the immunochemical method cut-off limit, eight of the FP results obtained result in TN. In this case, the specificity of the method increases from 85 to 98 %. Therefore, it is more appropriate to prefer 2000 ng/mL as the cut-off limit to increase the specificity of opiate analysis with this method in AMATEM.
The detection of 6-MAM in samples can play an important role in forensic purposes because of being an evident of recent use of heroin (<8 h). In this study, 6-MAM was not detected in patients with FP opiate results. It might be possible that opiates rapidly metabolized to 6-MAM with only a small amount of this metabolite secreted in urine over a very short time after drug abuse, the sampling times were exceed the 6-MAM detection limit. Another aspect might be related to the opiate dosage of volunteers were below the detection limit.
In our study, morphine, hydromorphone and codeine were detected in the urine of the volunteer whose opiate analysis found FN. Hydromorphone level was determined as 1865 by in-house LC-MS/MS method. In the study conducted by Davis et al., hydrocodone, hydromorphone and dihydrocodeine were detected in 13 FN results in the opiate analysis performed with the KIMS method. It has been stated that false negative results might be due to weak cross-reactivity with these compounds [40]. In the opiate kit insert of the Roche-Cobas 6000 analyzer we studied, it was stated that the hydromorphone cross-reactivity was 21 % for the 300 ng/mL cut-off limit [41]. It might be possible that the obtained FN result may be due to poor cross-reactivity generated by high levels of hydromorphone, similar to the study of Davis.
A method comparison study of the commercial LC-MS/MS method and in-house LC-MS/MS method showed significant correlation between THC-COOH, morphine, codeine assays (Tables 3, 4 and 5). The bias obtained for THC-COOH, morphine and codeine parameters were −17.5, 24.6 and 43.6 between two LC-MS/MS methods. The commercial method had a tendency to have a negative bias except for cannabinoids (Figure 1). The bias were not calculated for the amphetamine, methamphetamine, MDMA, MDA and oxazepam analysis since only 18, 14, 6, five and five measurements were used for the comparison. The bias for these parameters might be decreased by increasing the number of measurements. As a consequence there was an unsatisfactory agreement between both methods, for the analytical comparison. On the other hand, no clinical discrepancy was observed between the two methods when it was used for confirmation of the immunochemical method results.
In general, the advantages of LC–MS/MS consist of advanced specificity, ability to simultaneously measure multiple analytes in a large number of biological fluids, the requirement for small sample volumes for analysis, and highly flexible due to being suitable for in-house method development. Compared to the LC-MS/MS method, immunochemical methods are widely used in clinical practice due to enhanced sensitivity, easy to analyse with minimal sample preparation, fast turnaround time. However, they are susceptible to cross-reactivity by the structurally related compounds and are not able to measure different analytes simultaneously. In the analysis with the immunochemical method; if there are many substances in the sample, even if the target substance concentration remains below the detection limit, the cross-reaction of multiple substances may result in a false positive target substance. Therefore, immunochemical methods are basically used for screening, LC–MS/MS methods are used for confirmation. The LC–MS/MS methods have some disadvantages such as ion suppression/enhancement due to matrix effect, potential sources of inaccuracy due to ionization techniques, absence of stable isotope labeled internal standards, instrument cost, expertise, training, quality assurance, and lack of standardization and harmonization [42, 43].
Despite these disadvantages, substance abuse screening purposes, LC-MS/MS methods are increasingly used in routine clinical laboratories to obtain multiple analyte determination with high specificity. There may not be a clear-cut answer as to whether LC-MS/MS methods should be used instead of immunoassays as a screening method. LC-MS/MS methods can be adopted for subtance abuse screening in the clinical laboratories of the research hospitals. In terms of cost, instrumentation, expertise and training of staff, highly skilled scientists and technicians, quality assurance and assay standardization, routine LC–MS/MS procedure could be hard for all clinical laboratories. It seems very difficult to adapt the method, especially in hospitals with a small sample size, since the method is disadvantageous in terms of cost and qualified personnel.
In the present study, the in-house method has many advantages over the commercial method such as, analysis time (15 min vs. <18 min), sample preparation time, large number of parameters (n=58>n=23) and cost effective separation technique (chemical>enzymatic hydrolysis).
In-house method development is a tough issue that requires more experience than implementing a commercial method [44]. However, in-house method is easier to troubleshoot, the characteristics of the chromatographic column, mobile phase and sample preparation are known. On the other hand, the commercial method is practical for non-specialists in LC-MS/MS and allow for a faster set up for validation. Moreover, there is a standardization difficulty between LC-MS/MS methods, in those analyses for which a certified reference material is not available and performance of the devices is not similar and not all the shown data should not be relied upon without further study.
The limitation of the study was that the lack of TP and FN benzodiazepines results. For this reason the sensitivity could not be calculated for benzodiazepines. The comparison of amphetamine, methamphetamine, MDMA, MDA and oxazepam analysis were not evaluated since only 18, 14, 6, five and five measurements were obtained. More comprehensive studies are needed to analyse benzodiazepine performance with large numbers of positive samples.
Conclusions
The analytical performance of the KIMS-based urine immunochemical method was found to be suitable for the intended use, except for benzodiazepines. Adopting the cut-off limit of the immunochemical method as 2000 ng/mL for opiates, as recommended by SAMHSA, will increase the specificity of the immunochemical method. The validated in-house LC-MS/MS method was evaluated to be comprehensive option for confirmation of substance abuse in urine.
Acknowledgments
We thank the staff of the AMATEM for their assistance in the analyses performed with the immunoassay method.
-
Reseach ethics: The local Institutional Review Board deemed the study exempt from review.
-
Informed consent: Informed consent was obtained from all individuals included in this study.
-
Author contributions: All authors have accepted responsibility for the entire content of this manuscript and approved its submission.
-
Competing interests: Authors state no conflict of interest.
-
Research funding: None declared.
References
1. Markway, EC, Baker, SN. A review of the methods, interpretation, and limitations of the urine drug screen. Orthopedics 2011;34:877–81. https://doi.org/10.3928/01477447-20110922-22.Search in Google Scholar PubMed
2. Pelletti, G, Rossi, F, Garagnani, M, Barone, R, Roffi, R, Fais, P, et al.. Optimization of cloned enzyme donor immunoassay cut-offs for drugs of abuse in post-mortem whole blood. Forensic Sci Int 2020;312:110291. https://doi.org/10.1016/j.forsciint.2020.110291.Search in Google Scholar PubMed
3. Neukamm, MA, Bahrami, A, Auwarter, V, Mehne, FMP, Hoss, E. Evaluation of KIMS immunochemical methods on a cobas c 501 analyzer for drugs of abuse and ethyl glucuronide testing in urine for forensic abstinence control. Drug Test Anal 2017;9:1217–23. https://doi.org/10.1002/dta.2154.Search in Google Scholar PubMed
4. Köhler, KM, Hammer, R, Riedy, K, Auwärter, V, Neukamm, MA. Evaluation of CEDIA and DRI drugs of abuse immunoassays for urine screening on a Thermo Indiko plus analyzer. J Clin Lab Anal 2017;31:e22021. https://doi.org/10.1002/jcla.22021.Search in Google Scholar PubMed PubMed Central
5. Johnson-Davis, KL, Sadler, AJ, Genzen, JR. A retrospective analysis of urine drugs of abuse immunochemical method true positive rates at a National Reference Laboratory. J Anal Toxicol 2015;40:97–107. https://doi.org/10.1093/jat/bkv133.Search in Google Scholar PubMed
6. Colby, JM, Patel, PC, Fu, DY, Rutherford, NJ. Commonly used fluoroquinolones cross-react with urine drug screens for opiates, buprenorphine, and amphetamines. Clin Biochem 2019;68:50–4. https://doi.org/10.1016/j.clinbiochem.2019.04.009.Search in Google Scholar PubMed
7. Barroso, M, Gallardo, E. Assessing cocaine abuse using LC-MS/MS measurements in biological specimens. Bioanalysis 2015;7:1497–525. https://doi.org/10.4155/bio.15.72.Search in Google Scholar PubMed
8. Jufer, R, Walsh, SL, Cone, EJ, Sampson-Cone, A. Effect of repeated cocaine administration on detection times in oral fluid and urine. J Anal Toxicol 2006;30:458–62. https://doi.org/10.1093/jat/30.7.458.Search in Google Scholar PubMed
9. Vindenes, V, Lund, HM, Andresen, W, Gjerde, H, Ikdahl, SE, Christophersen, A, et al.. Detection of drugs of abuse in simultaneously collected oral fluid, urine and blood from Norwegian drug drivers. Forensic Sci Int 2012;219:165–71. https://doi.org/10.1016/j.forsciint.2012.01.001.Search in Google Scholar PubMed
10. Boyd, JM, Sadrzadeh, SH. Limitations of immunochemical methods for screening of drugs of abuse in urine: issues of false positive and false negative results. In: Accurate results in the clinical laboratory. Canada: Elsevier; 2019:233–42 pp.10.1016/B978-0-12-813776-5.00014-5Search in Google Scholar
11. Garg, U, Cooley, C. Testing of drugs of abuse in oral fluid, sweat, hair, and nail: analytical, interpretative, and specimen adulteration issues. In: Critical issues in alcohol and drugs of abuse testing. US: Elsevier; 2019:405–27 pp.10.1016/B978-0-12-815607-0.00028-9Search in Google Scholar
12. Armbruster, DA, Schwarzhoff, RH, Pierce, B, Hubster, EC. Method comparison of EMIT II and ONLINE with RIA for drug screening. J Forensic Sci 1993;38:1326–41. https://doi.org/10.1520/jfs13537j.Search in Google Scholar
13. ROCHE Diagnostics [01.05.21]. Available from: https://diagnostics.roche.com/us/en/eservice-overview/technical-documents.htmL.Search in Google Scholar
14. Avcioglu, G, Yilmaz, G, Sahiner, SY, Kozaci, LD, Bal, C, Yilmaz, FM. Evaluation of the diagnostic performance of an oral fluid screening test device for substance abuse at traffic controls. Clin Biochem 2021;93:112–8. https://doi.org/10.1016/j.clinbiochem.2021.04.009.Search in Google Scholar PubMed
15. Clarke, W, Molinaro, R, Bachmann, L, Botelho, J, Cao, Z, French, S, et al.. Liquid chromatography-mass spectrometry methods; approved guideline C62-A. CLSI C62-A 2014;34:1–62. https://clsi.org/media/1346/c62a_sample.pdf.Search in Google Scholar
16. Toxicology SWGF. Scientific Working Group for Forensic Toxicology (SWGTOX) standard practices for method validation in forensic toxicology. J Anal Toxicol 2013;37:452–74. https://doi.org/10.1093/jat/bkt054.Search in Google Scholar PubMed
17. Taskinen, S, Beck, O, Bosch, T, Brcak, M, Carmichael, D, Fucci, N, et al.. European guidelines for workplace drug testing in urine. Drug Test Anal 2017;9:853–65. https://doi.org/10.1002/dta.2178.Search in Google Scholar PubMed
18. Goessaert, A-S, Pil, K, Veramme, J, Verstraete, A. Analytical evaluation of a rapid on-site oral fluid drug test. Anal Bioanal Chem 2010;396:2461–8. https://doi.org/10.1007/s00216-010-3463-8.Search in Google Scholar PubMed
19. Maurer, HH. Pitfalls in drug testing by hyphenated low- and high-resolution mass spectrometry. Drug Test Anal 2020;12:172–9. https://doi.org/10.1002/dta.2744.Search in Google Scholar PubMed
20. Matriciani, B, Huppertz, B, Keller, R, Weiskirchen, R. False-negative results in the immunochemical method analysis of drugs of abuse: can adulterants be detected by sample check test? Ann Clin Biochem 2018;55:348–54. https://doi.org/10.1177/0004563217725089.Search in Google Scholar PubMed
21. Moeller, KE, Kissack, JC, Atayee, RS, Lee, KC, editors. Clinical interpretation of urine drug tests: what clinicians need to know about urine drug screens. In: Mayo Clinic Proceedings; 2017: Elsevier.10.1016/j.mayocp.2016.12.007Search in Google Scholar PubMed
22. Smith, ML, Nichols, DC, Underwood, P, Fuller, Z, Moser, MA, Flegel, R, et al.. Methamphetamine and amphetamine isomer concentrations in human urine following controlled Vicks VapoInhaler administration. J Anal Toxicol 2014;38:524–7. https://doi.org/10.1093/jat/bku077.Search in Google Scholar PubMed PubMed Central
23. Dasgupta, A. Critical issues in alcohol and drugs of abuse testing. US: Academic Press; 2019.10.1016/B978-0-12-815607-0.00001-0Search in Google Scholar
24. Verstraete, AG, Heyden, FV. Comparison of the sensitivity and specificity of six immunochemical methods for the detection of amphetamines in urine. J Anal Toxicol 2005;29:359–64. https://doi.org/10.1093/jat/29.5.359.Search in Google Scholar PubMed
25. Lu, NT, Taylor, BG. Drug screening and confirmation by GC–MS: comparison of EMIT II and Online KIMS against 10 drugs between US and England laboratories. Forensic Sci Int 2006;157:106–16. https://doi.org/10.1016/j.forsciint.2005.03.022.Search in Google Scholar PubMed
26. Schwettmann, L, Külpmann, W-R, Vidal, C. Drug screening in urine by cloned enzyme donor immunochemical method (CEDIA) and kinetic interaction of microparticles in solution (KIMS): a comparative study. Clin Chem Lab Med 2006;44:479–87. https://doi.org/10.1515/CCLM.2006.087.Search in Google Scholar PubMed
27. Krasowski, MD, Pizon, AF, Siam, MG, Giannoutsos, S, Iyer, M, Ekins, S. Using molecular similarity to highlight the challenges of routine immunoassay-based drug of abuse/toxicology screening in emergency medicine. BMC Emerg Med 2009;9:1–18. https://doi.org/10.1186/1471-227x-9-5.Search in Google Scholar PubMed PubMed Central
28. Jacobson, DM, Berg, R, Grinstead, GF, Kruse, JR. Duration of positive urine for cocaine metabolite after ophthalmic administration: implications for testing patients with suspected Horner syndrome using ophthalmic cocaine. Am J Ophthalmol 2001;131:742–7. https://doi.org/10.1016/s0002-9394(00)00945-4.Search in Google Scholar PubMed
29. Mazor, SS, Mycyk, MB, Wills, BK, Brace, LD, Gussow, L, Erickson, T. Coca tea consumption causes positive urine cocaine assay. Eur J Emerg Med 2006;13:340–1. https://doi.org/10.1097/01.mej.0000224424.36444.19.Search in Google Scholar PubMed
30. Bertholf, RL, Sharma, R, Reisfield, GM. Predictive value of positive drug screening results in an urban outpatient population. J Anal Toxicol 2016;40:726–31. https://doi.org/10.1093/jat/bkw088.Search in Google Scholar PubMed
31. Klette, KL, Wiegand, RF, Horn, CK, Stout, PR, Magluilo, JJr. Urine benzodiazepine screening using Roche Online KIMS immunochemical method with beta-glucuronidase hydrolysis and confirmation by gas chromatography-mass spectrometry. J Anal Toxicol 2005;29:193–200. https://doi.org/10.1093/jat/29.3.193.Search in Google Scholar PubMed
32. Kwong, TC, Magnani, B, Rosano, TG, Shaw, LM. The clinical toxicology laboratory: contemporary practice of poisoning evaluation. USA: AACC Press; 2013.Search in Google Scholar
33. Lyons, TP, Okano, CK, Kuhnle, JA, Bruins, MR, Darwin, WD, Moolchan, ET, et al.. A comparison of Roche kinetic interaction of microparticles in solution (KIMS®) assay for cannabinoids and GC-MS analysis for 11-nor-9-carboxy-Δ9-tetrahydrocannabinol. J Anal Toxicol 2001;25:559–64. https://doi.org/10.1093/jat/25.7.559.Search in Google Scholar PubMed
34. ElSohly, MA, Ahmed, S, Gul, SW, Gul, W. Review of synthetic cannabinoids on the illicit drug market. In: Critical issues in alcohol and drugs of abuse testing. US: Elsevier; 2019:273–319 pp.10.1016/B978-0-12-815607-0.00022-8Search in Google Scholar
35. Carlsson, A, Lindberg, S, Wu, X, Dunne, S, Josefsson, M, Åstot, C, et al.. Prediction of designer drugs: synthesis and spectroscopic analysis of synthetic cannabinoid analogues of 1H-indol-3-yl (2,2,3,3-tetramethylcyclopropyl) methanone and 1H-indol-3-yl (adamantan-1-yl) methanone. Drug Test Anal 2016;8:1015–29. https://doi.org/10.1002/dta.1904.Search in Google Scholar PubMed
36. Abou El Hassan, M, Colantonio, D, Likhodii, S, Nassar, BA. The analytical performance of six urine drug screens on cobas 6000 and ARCHITECT i2000 compared to LC-MS/MS gold standard. Clin Biochem 2021;93:99–103. https://doi.org/10.1016/j.clinbiochem.2021.04.003.Search in Google Scholar PubMed
37. Zacher, JL, Givone, DM. False-positive urine opiate screening associated with fluoroquinolone use. Ann Pharmacother 2004;38:1525–8. https://doi.org/10.1345/aph.1d632.Search in Google Scholar PubMed
38. Fraser, AD, Worth, D. Experience with a urine opiate screening and confirmation cutoff of 2000 ng/mL. J Anal Toxicol 1999;23:549–51. https://doi.org/10.1093/jat/23.6.549.Search in Google Scholar PubMed
39. Maas, A, Kraemer, M, Sydow, K, Chen, PS, Dame, T, Musshoff, F, et al.. Urinary excretion study following consumption of various poppy seed products and investigation of the new potential street heroin marker ATM4G. Drug Test Anal 2017;9:470–8. https://doi.org/10.1002/dta.2058.Search in Google Scholar PubMed
40. Johnson-Davis, KL, Thompson, CD, Clark, CJ, McMillin, GA, Lehman, CM. Method comparison of the Ortho Vitros Fusion 5, 1 chemistry analyzer and the Roche COBAS Integra 400 for urine drug screen testing in the emergency department. J Anal Toxicol 2012;36:345–8. https://doi.org/10.1093/jat/bks028.Search in Google Scholar PubMed
41. ONLINE DAT Benzodiazepines II [19.10.2019]. Available from: https://pim-eservices.roche.com/eLD_SF/gb/en/Documents/GetDocument?documentId=fdc0891b-796e-e611-4aad-00215a9b3428.Search in Google Scholar
42. Leung, KS, Fong, BM. LC-MS/MS in the routine clinical laboratory: has its time come? Anal Bioanal Chem 2014;406:2289–301. https://doi.org/10.1007/s00216-013-7542-5.Search in Google Scholar PubMed
43. Stokvis, E, Rosing, H, Beijnen, JH. Stable isotopically labeled internal standards in quantitative bioanalysis using liquid chromatography/mass spectrometry: necessity or not? Rapid Commun Mass Spectrom 2005;19:401–7. https://doi.org/10.1002/rcm.1790.Search in Google Scholar PubMed
44. Le Goff, C, Farre-Segura, J, Stojkovic, V, Dufour, P, Peeters, S, Courtois, J, et al.. The pathway through LC-MS method development: in-house or ready-to-use kit-based methods? Clin Chem Lab Med 2020;58:1002–9. https://doi.org/10.1515/cclm-2019-0916.Search in Google Scholar PubMed
Supplementary Material
This article contains supplementary material (https://doi.org/10.1515/tjb-2022-0286).
© 2023 the author(s), published by De Gruyter, Berlin/Boston
This work is licensed under the Creative Commons Attribution 4.0 International License.
Articles in the same Issue
- Frontmatter
- Review
- Metabolomics: a review of liquid chromatography mass spectrometry-based methods and clinical applications
- Opinion Papers
- Green transformation in the health sector and medical laboratories, adaptation to climate change in Türkiye
- Forward steps in green medical laboratory practices for a sustainable future
- Research Articles
- Comparison of the immunoassay method with the commercial and in-house LC-MS/MS methods for substance abuse in urine
- Peroxisome proliferator-activated receptor gamma and osteoprotegerin levels as an indicator and diagnostic predictor of endothelial dysfunction
- Gingival status and prophylactic oral hygiene measures modulate salivary amino acids’ profile in children with plaque-induced gingivitis
- FIB4 score is increased in severe preeclampsia
- The effects of a single dialysis session on serum hepcidin levels
- Gestational diabetes mellitus is associated with a low serum level of mitochondrial-derived peptide-MOTS-C
- Ideal timing of labor in terms of oxidative stress – which term period is best?
- Synergistic role of thymoquinone and 5-fluorouracil in U-251MG glioblastoma cell line
- Effect of oligosaccharides and aerobic training on hyperglycemia, growth and intestinal microbial diversity of diabetic rats
- Association of AdipoQ (G>T) gene polymorphism with obesity and hypertension in North Indian postmenopausal women of Punjab
- The attraction of paraoxonase-1 associated with the MAPK pathway on colon carcinoma cells
- Resveratrol modulates miRNA machinery proteins in different types of colon cancer cells
- The relationship between ASIC3 gene polymorphism and fibromyalgia syndrome
- Expression levels of genes involved in lipogenesis and cholesterol synthesis in adenomyosis
- Frequency of thrombophilia-associated mutations and polymorphisms in pregnant women with a history of thrombosis or pregnancy complications