Effects of topiramate on adipocyte differentiation and gene expression of certain carbonic anhydrase isoenzymes
-
Ayşegül Sümer

 ,
Eşref Edip Keha
,
Eşref Edip Keha

Abstract
Background
Topiramate, an antiepileptic drug, besides its known effects in neurons, is a carbonic anhydrase inhibitor and causes weight loss in treated subjects, but, the mechanisms of weight loss effect have not been yet identified..
Objective
In this study, effects of topiramate on 3T3-L1 adipocyte differentiation and expressions of carbonic anhydrase I, II, III, VA, VB were investigated to determine possible roles of carbonic anhydrase isoenzymes and adipocytes in weight loss effect of topiramate.
Material and methods
Adipocyte differentiation was detected by Oil Red O staining. Carbonic anhydrase I, II, III, VA, VB expressions were determined by Real-Time PCR method.
Results
It was found that topiramate induced adipogenesis at all concentrations (p < 0.0001). CA expressions increased significantly with adipogenesis (p = 0.0001). Topiramate stimulated adipogenesis in 3T3-L1 cells and reduced CA II, VA and VB and, an increased CA III expression was observed at low concentrations. CA II, VA and, VB expressions were found increased and CA III expression decreased at high topiramate concentrations.
Conclusion
It was concluded that changes in CA III expression were consistent with its reduction in obesity, alterations of CA II, VA and VB expressions could be attributed to compensation mechanism of cells.
Öz
Genel Bilgilerç
Antiepileptik bir ilaç olan topiramat, nöronlardaki bilinen etkilerinin yanı sıra, karbonik anhidraz inhibitörü olup tedavi alan kişilerde kilo kaybına neden olmaktadır, ancak ilgili mekanizmalar henüz aydınlatılamamıştır.
Amaç
Bu çalışmada, topiramatın 3T3-L1 adiposit farklılaşması üzerindeki etkileri ve karbonik anhidraz I, II, III, VA, VB ekspresyonları incelenerek bu izoenzimlerin ve adipositlerin, topiramatın kilo kaybı etkisindeki olası rollerini belirlemek amaçlanmıştır.
Gereç ve Yöntemler
Adiposit farklılaşması Oil red O boyaması ile saptanırken, karbonik anhidraz I, II, III, VA, VB’nin ekspresyonları real-time PCR tekniği ile belirlendi.
Bulgular
Topiramat tüm konsantrasyonlarda adipogenezi artırdığı bulunmuştur (p < 0.0001). Adipogenezin stimülasyonunun CA ekspresyonlarını arttırdığı görülmüştür (p = 0.0001). Topiramatın 3T3-L1 hücrelerinde, adipogenezi uyardığı, düşük konsantrasyonlarda CA II, VA ve VB ekspresyonlarını azalttığı, CA III ekspresyonunu artırdığı bulunurken, yüksek konsantrasyonlarda CA II, VA ve VB ekspresyonlarının arttırdığı, CA III ekspresyonunu ise düşürdüğü bulunmuştur.
Sonuç
CA III ekspresyonundaki değişim obez durumlarda izoenzimin sentezinin azalmasıyla uyumlu bulunurken, CA II, VA ve VB ekspresyonlarındaki değişimin hücrede bir telafi mekanizması olabileceği kanısına varılmıştır.
Introduction
Obesity is a disorder that causes fat cells to increase in number and volume with the accumulation of excessive energy intake in adipose tissue, which in turn causes clinical conditions that decrease the quality of life such as cardiovascular diseases and type II diabetes [1], [2]. The increased prevalence of obesity has led to an interest in adipose tissue and studies in this area, as well as the search for new drug targets for treatment such as antiepileptics [3].
Topiramate is an antiepileptic drug, approved by the FDA in 1996, and also used for the treatment of some neurological disorders such as migraine and excess feeding disorder. Topiramate combination with phentermine (Qysmia) was approved as an antiobesity drug by the FDA in 2012 [4]. Topiramate has actions including GABA transmission, inhibition of AMPA/kainate receptors and voltage-gated sodium and calcium channels and carbonic anhydrase inhibition. Topiramate treatment causes weight loss in individuals that were considered as an adverse effect [3], [4]. The mechanism has not been yet identified and more molecular studies are needed.
Carbonic anhydrases (CA, EC 4.2.1.1.) are zinc metalloenzymes with 16 isoforms and catalyzes the conversion of carbon dioxide and water to the bicarbonate and proton. They are found in almost all organisms and involved in the acid-base balance, bone resorption, production of body fluids and physiological processes such as gluconeogenesis, ureagenesis and lipogenesis and tumor formation [5]. CA I, CA II and CA III are cytosolic and CA VA and CA VB are mitochondrial isoenzymes. CA I is most abundant and has less activity, CA II has the most catalytic activity. CA III is found in adipose tissue. Carbonic anhydrases recently have become a target new drug development for obesity [6], [7]. CA inhibitors such as zonisamide and topiramate have been reported useful for the treatment of obesity [8].
This study aims to investigate effects of topiramate on differentiation of 3T3-L1 preadipocytes and gene expression of CA isoenzymes CA I, CAII, CA III, CA VA, CA VB and so to determine if the weight loss effect of topiramate is above adipose tissue or not, and reveal possible roles of CA isoenzymes in this process.
Materials and methods
Reagents and chemicals
Topiramate, GW9662, insulin, dexamethasone, isobutyl methyl xanthine (IBMX), biotin, [3-(4,5-dimethyl thiazole-2-yl)]-2,5-diphenyl tetrazolium bromide (MTT), Oil red O were obtained from Sigma (St. Louis, MO, USA). Fetal bovine serum was purchased from Biochrom (Berlin, Germany), Dulbecco’s Modified Eagle’s Medium (DMEM) from American Type Culture Collection (ATCC, Manassas, VA, USA), 2-propanol from J.T. Baker (PA, USA), TriPure Isolation Reagent and SYBR Green from Roche (Mannheim, Germany) and cDNA synthesis kit from Promega (Madison, WI, USA).
Cell culture and differentiation
3T3-L1 cells were seeded in six-well plates with 105 cells per well. Cells were cultured in 4 mL of DMEM with 10% fetal bovine serum and 1% penicillin/streptomycin at 37°C and 5% CO2 and allowed to grow for 6 days. After confluence, the cells were treated with the differentiation cocktail containing 10 μg/mL insulin, 0.25 μM dexamethasone, 0.5 mM, IBMX, and 100 ng/mL biotin and different concentrations of topiramate for 2 days. GW9662 was used as a negative control. The cells differentiated to adipocytes approximately in 6 days.
Oil red O staining
Oil red O staining was performed according to the method described previously [9]. The cells were washed twice with PBS and fixed with 10% formaldehyde at room temperature for 1 h and following the incubation the wells were washed twice with 60% 2-propanol. The cells were treated with Oil Red O stain for 10 min and the wells were washed with deionized water for destaining. One hundred percent 2-propanol was added to wells to remove the stain. One millilitre of the solution was taken for spectrophotometric analysis at 520 nm (Shimadzu UV1601, Australia). Photos of the cells were taken in every step of the experiments using an inverted microscope (Nikon Eclipse TS100, Tokyo, Japan).
Assessment of cell viability
MTT assay was used for cell viability. For the test, 1×10⁴ cells were cultured in 96 well plates for 24 h. Then cells were treated with 750, 500, 250, 100, 50, 25, 10, 5, 1 μM topiramate and 100, 50, 25, 10, 5, 1, 0.5, 0.1 μM GW9662 and incubated for 72 h. MTT with 0.25 mg/mL final concentration was added to all wells and DMSO was also added to dissolve the crystals. The absorbances were read at 570 nm in a microplate reader (Versamax, Molecular Devices, CA, USA). Optical densities were used to determine % cell viabilities using the formula [(OD of treated group/OD of the control group)×100] in treated cells compared to control cells with no compound exposure.
Gene expression experiments
TriPure isolation reagent was used for total RNA isolation. The quality of RNA was detected by measuring the OD260/OD280 ratio in NanoDrop (Thermo Scientific, Waltham, MA, USA). RNA was converted to cDNA by the Reverse Transcriptase method with a cDNA synthesis kit according to the manufacturer’s instructions. CA I, CA II, CA III, CA VA, CA VB expression levels in 3T3-L1 cells were determined with the SYBR green method with quantitative RT-PCR in LightCycler 480 II (Roche, Rotkreuz, Switzerland) device. The primers for analysis were listed in Table 1 [10]. For the analysis, initial incubation was performed for 5 min at 95°C, followed by 50 cycles of PCR (95°C 10 s, 72°C, 10 s) and finally at 40°C for 10 s. Results were calculated with an advance relative quantification module compared to the ß-actin expression of undifferentiated cells.
Primer pairs used in RT-PCR protocol.
| Primer | Primer sequence |
|---|---|
| Carbonic anhydrase I (CA I) | F: 5′-TTG ATG ACA GTA GCA ACC – 3′ R: 5′-CCA GTG AAC TAA GTG AAG – 3′ |
| Carbonic anhydrase II (CA II) | F: 5′-CAA GCA CAA CGG ACC AGA – 3′ R: 5′-ATG AGC AGA GGC TGT AGG – 3′ |
| Carbonic anhydrase III (CA III) | F: 5′-GCT CTG CTA AGA CCA TCC – 3′ R: 5′-ATT GGC GAA GTC GGT AGG – 3′ |
| Carbonic anhydrase VA (CA VA) | F: 5′-AAC AAA GCA AGG GCA TAC AG – 3′ R: 5′-TGG CAC AGA GAA GTC CCA CA – 3′ |
| Carbonic anhydrase VB (CA VB) | F: 5′-AAT GGC TTG GCT GTG ATA GG – 3′ R: 5′-GGC GTA GTG AGA GAC CCA GA – 3′ |
| ß-Actin | F: 5′-GAG ACC TTC AAC ACC CC – 3′ |
| R: 5′-GTG GTG GTG AAG CTG TAG CC – 3′ |
Statistical analysis
All results were given as mean±standard deviation (mean±SD). Differences between the groups were determined using the paired-samples t-test and ANOVA. p<0.05 was regarded as significant.
Results
Cell viability results
3T3-L1 preadipocytes were treated several concentrations of topiramate and GW9662. Results of % viability belong to concentrations were calculated (Tables 2 and 3).
Effect of topiramate on cell viability.
| n | 3 | 3 | 3 | 3 | 3 | 3 | 3 | 3 | 3 | 3 | 3 |
|---|---|---|---|---|---|---|---|---|---|---|---|
| TPM (μM) | 0 | 1 | 5 | 10 | 25 | 50 | 100 | 250 | 500 | 750 | 1000 |
| Viability (%) | 100 | 92 | 92 | 108 | 98 | 101 | 93 | 75 | 75 | 61 | 46 |
Effects of GW9662 on cell viability.
| n | 3 | 3 | 3 | 3 | 3 | 3 | 3 | 3 | 3 |
|---|---|---|---|---|---|---|---|---|---|
| GW9662 (μM) | 0 | 0.1 | 0.5 | 1 | 5 | 10 | 25 | 50 | 100 |
| Viability (%) | 100 | 91 | 112 | 101 | 112.2 | 95 | 78 | 44 | 13 |
1, 5, 10, 50, 100 μM concentrations of TPM and 1 μM of GW9662 were decided to be used in the experiments.
Differentiation of 3T3-L1 cells
Oil Red O staining demonstrated that 3T3-L1 cells were successfully differentiated to adipocytes (Figure 1).
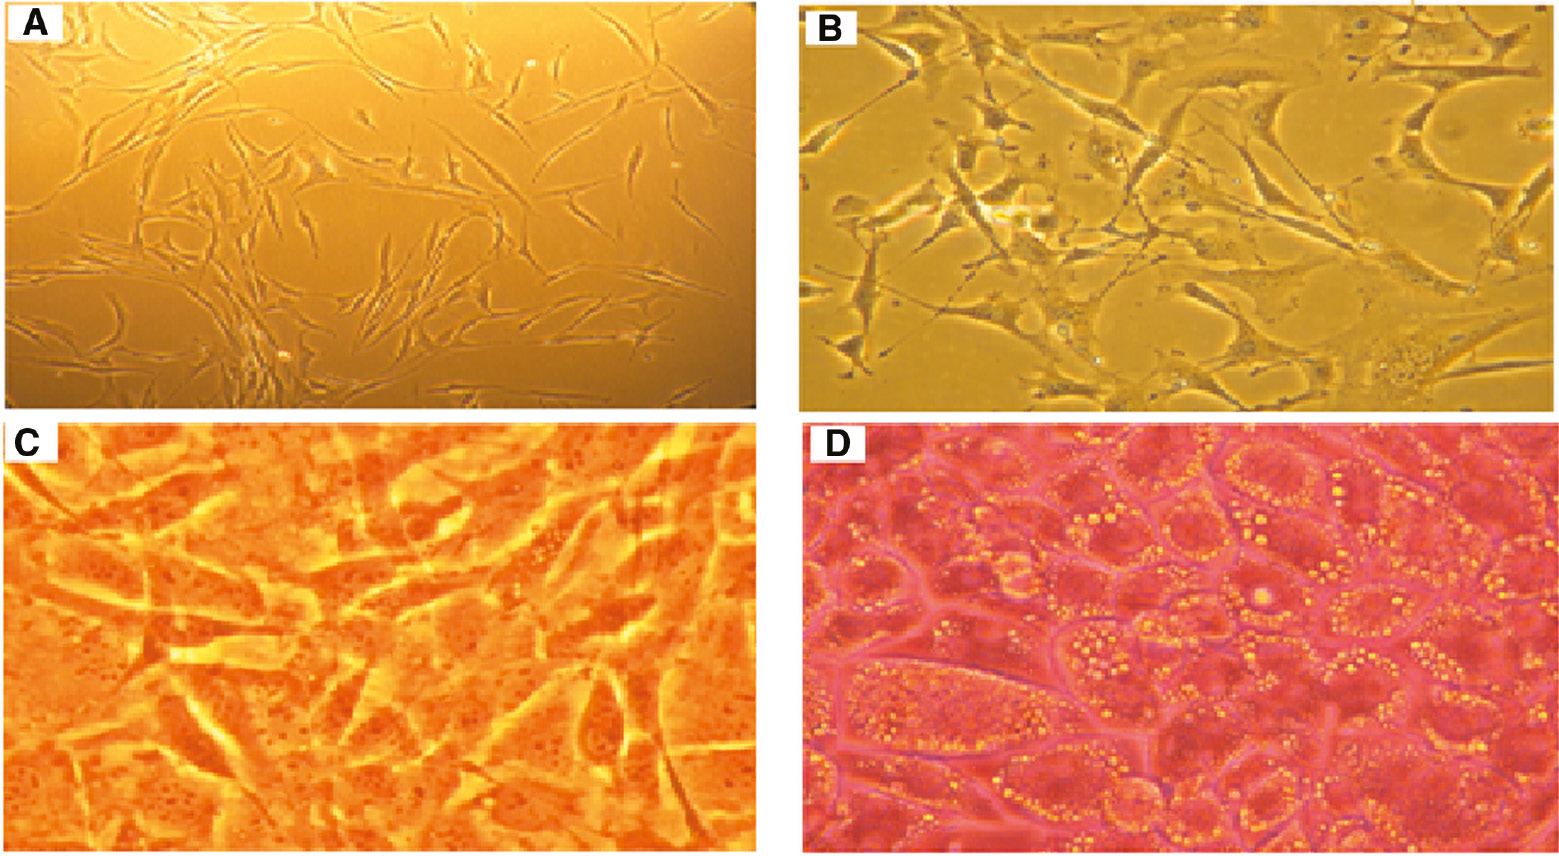
Photomicrographs of cells, (10×, Nikon Eclipse TS100).
(A) New-planted 3T3-L1 cells. (B) Growing fibroblasts. (C) Conflued preadipocytes. (D) Differentiated adipocytes. Oil Red O staining demonstrated that 3T3-L1 cells were successfully differentiated to adipocytes.
Effects of topiramate on 3T3-L1 differentiation
According to the cell viability assay with MTT test; 1, 5, 10, 50, 100 μM concentrations of TPM were decided to be used in the experiments. After Oil Red O staining, absorbances of differentiated and undifferentiated cells were measured at 520 nm and lipid contents of the cells were determined (Table 4, Figures 2 and 3). There was no significant difference between the topiramate treated groups in mature adipocytes (p>0.05).
Effects of topiramate on 3T3-L1 differentiation.
| n | Differentiation | Topiramate (μM) | Abs at 520 nm Abs±SD |
|---|---|---|---|
| 3 | − | − | 0.39±0.01 |
| 3 | + | − | 0.52±0.01 |
| 3 | + | 1 | 0.54±0.02 |
| 3 | + | 5 | 0.53±0.01 |
| 3 | + | 10 | 0.54±0.01 |
| 3 | + | 50 | 0.6±0.01 |
| 3 | + | 100 | 0.59±0.01 |
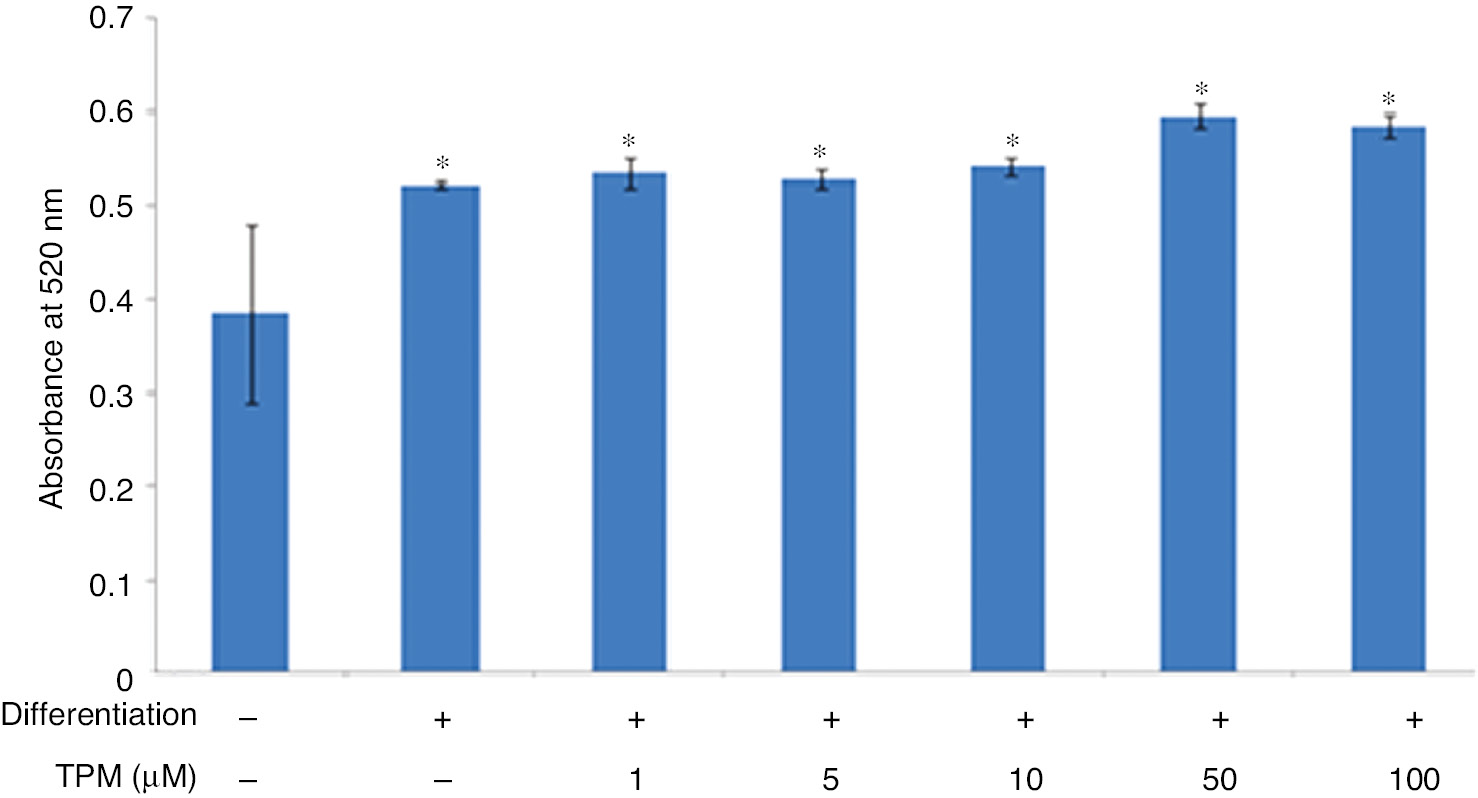
Effect of topiramate on 3T3-L1 differentiation at different concentrations.
*(p<0.01), compared with not differentiated cells.
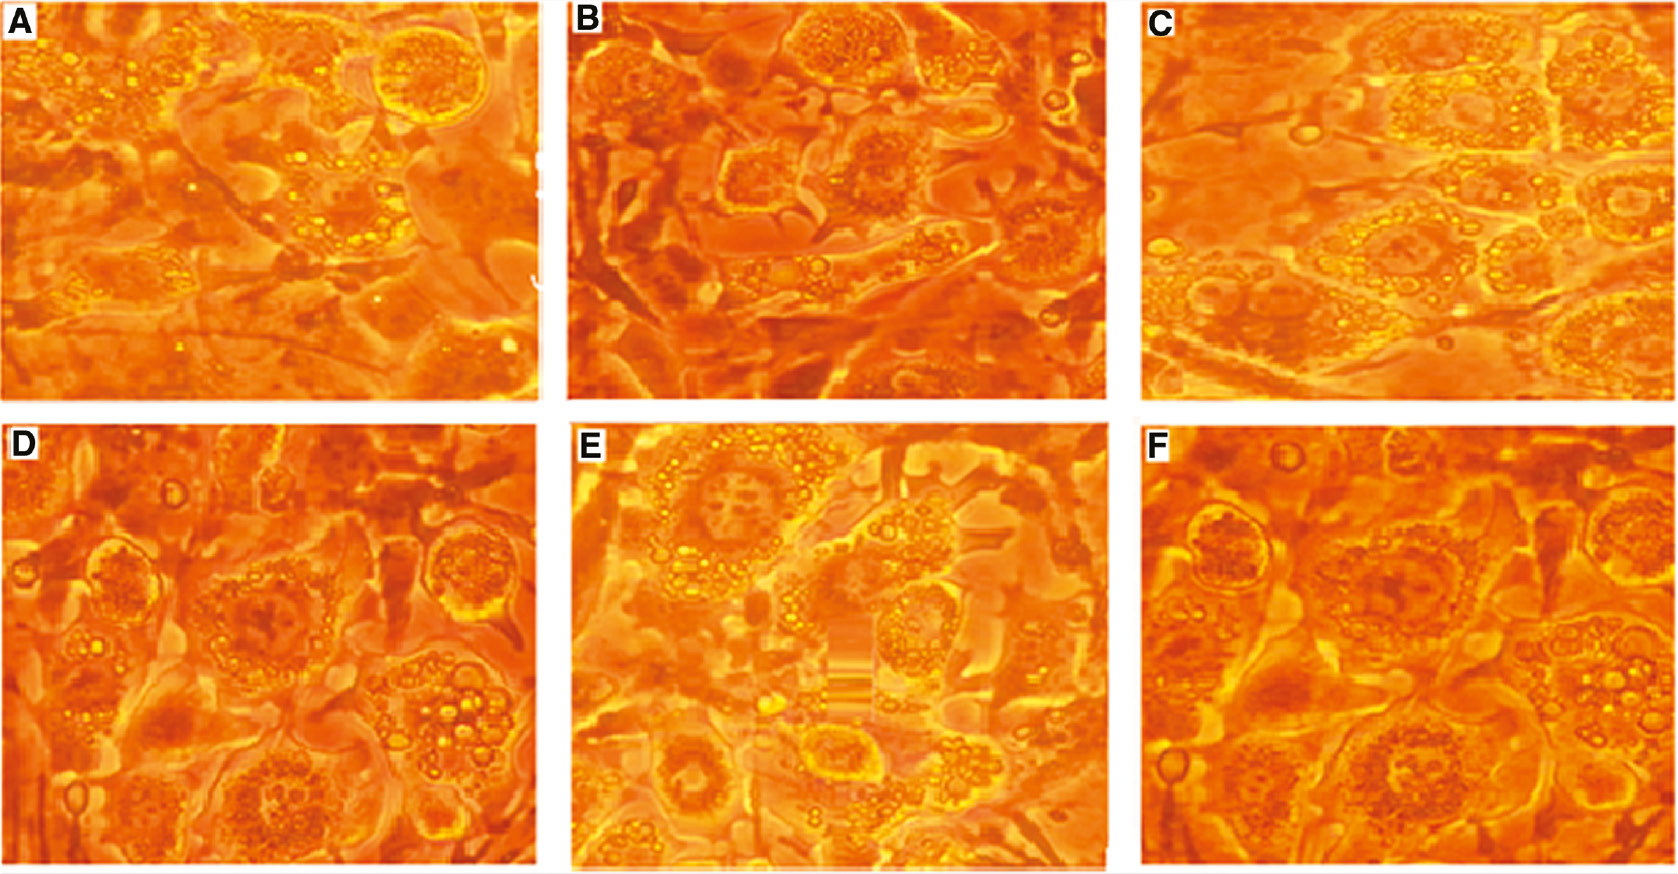
After differentiation and TPM treatment, photomicrographs of the effect of different concentrations of TPM on the differentiation of 3T3-L1 cells were determined with Oil Red O staining.
(A) 0 μM, (B) 1 μM, (C) 5 μM, (D) 10 μM, (E) 50 μM, (F) 100 μM (10×, Nikon Eclipse TS100).
Effects of GW9662
GW9662, a PPAR γ antagonist, is an inhibitor of adipocyte differentiation and was used as negative control in assays. GW9662 inhibited adipocyte differentiation significantly (Figure 4 and Table 5).
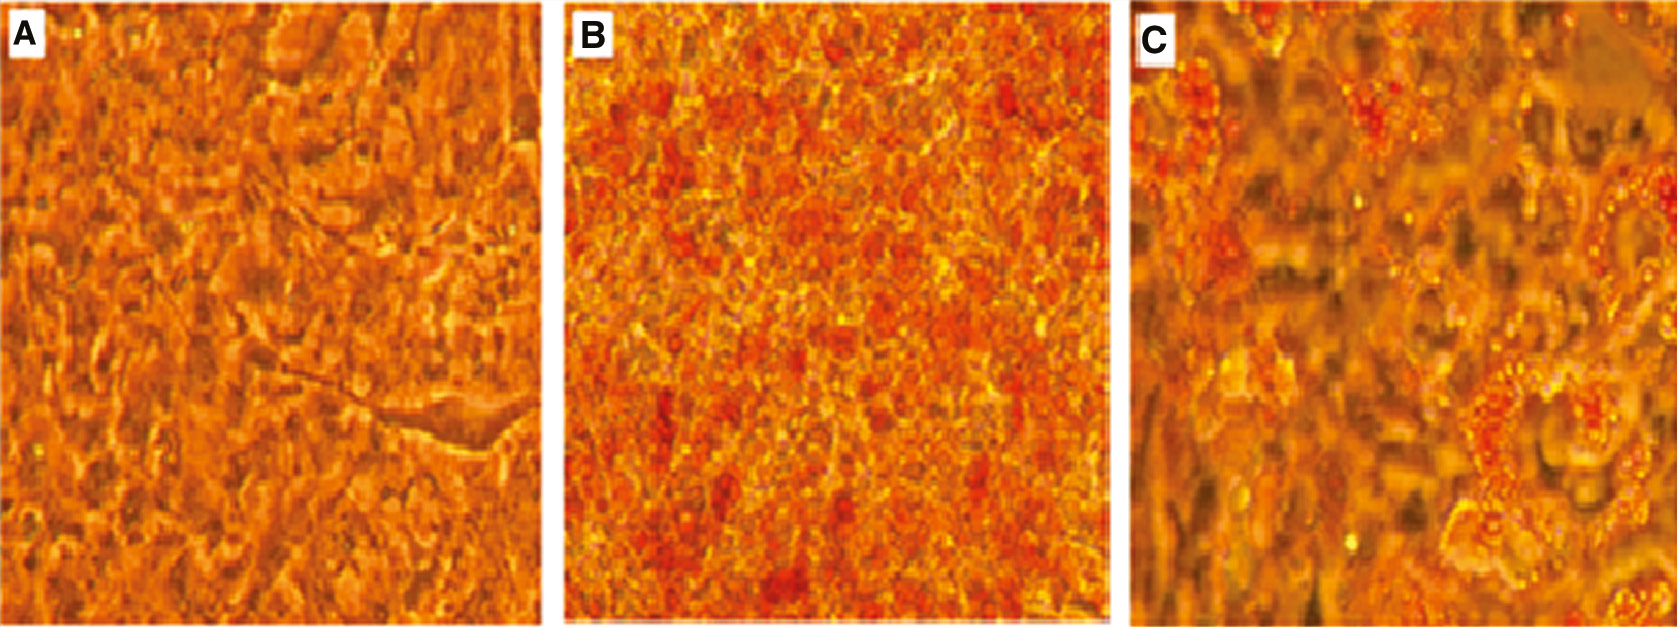
GW9662 inhibited differentiation of 3T3-L1 cells.
(A) Not differentiated cells. (B) Differentiated cells. (C) Differentiated and treated cells with 1 μM GW9662 (10×, Nikon Eclipse TS100).
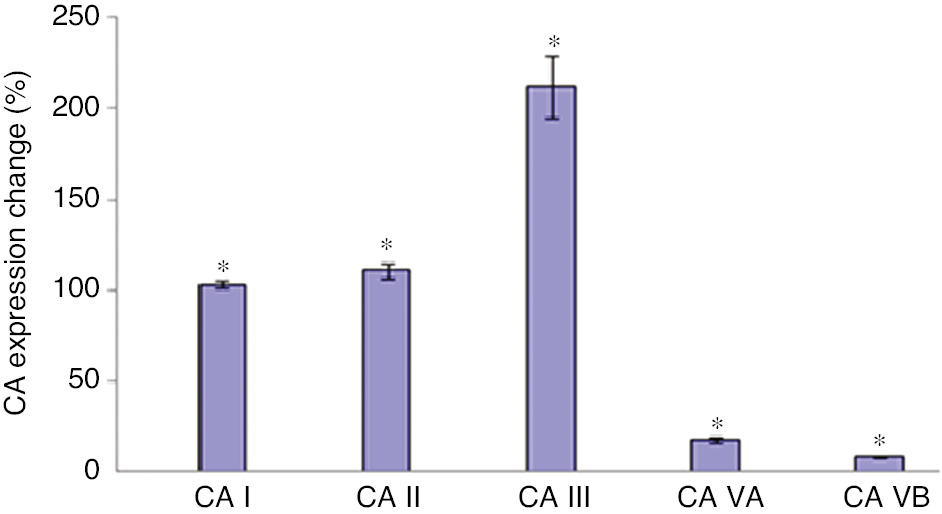
CA isoenzyme expressions in differentiated 3T3-L1 cells compared with not differentiated cells.
Carbonic anhydrase expressions found to be increased with the induction of adipogenesis (*p<0.001).
Effects of GW9662 on 3T3-L1 cell differentiation.
| n | 3 | 3 | 3 |
|---|---|---|---|
| Differentiation | − | + | + |
| GW9662 (1 μM) | − | − | + |
| Abs at 520 nm Abs±SD | 0.405±0.08 | 0.531±0.06 | 0.467±0.03a |
-
a(p<0.01), compared with GW9662 untreated cells.
Carbonic anhydrase (CA I; CA III; CA II; CA VA; CA VB) gene expressions in differentiated adipocytes
Expression levels of the isoenzymes were calculated with the relative quantitation method. CA I, II, III, VA, VB expression levels were found increased 103%, 111%, 212%, 17.3%, 8.4%, respectively compared with not differentiated cells (p<0.001).
Effects of topiramate on carbonic anhydrase expressions
CA I expressions were found significantly decreased in TPM treated cells compared with untreated cells (p=0.0001) while there was no significant difference between TPM treated cells (p=1). CA II expressions were significantly decreased with 1 and 5 μM TPM (p=0.0001), (Figure 6).
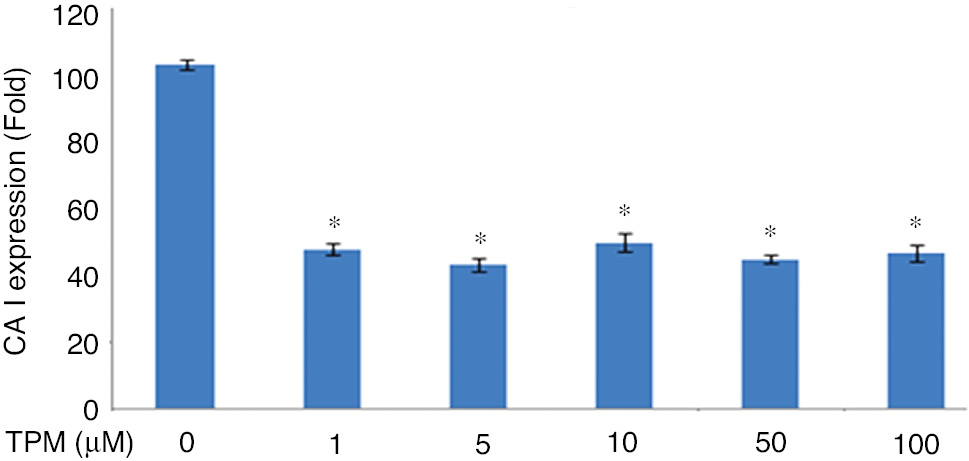
Effects on CA I expression.
(*p=0.0001), compared with no TPM treated cells. (**p=0.0001), compared with 1 and 5 μm.
CA II expression was found to be increased 10, 50 and 100 μM TPM treated cells according to 1 and 5 μM TPM treated ones (p=0.0001), (Figure 7).
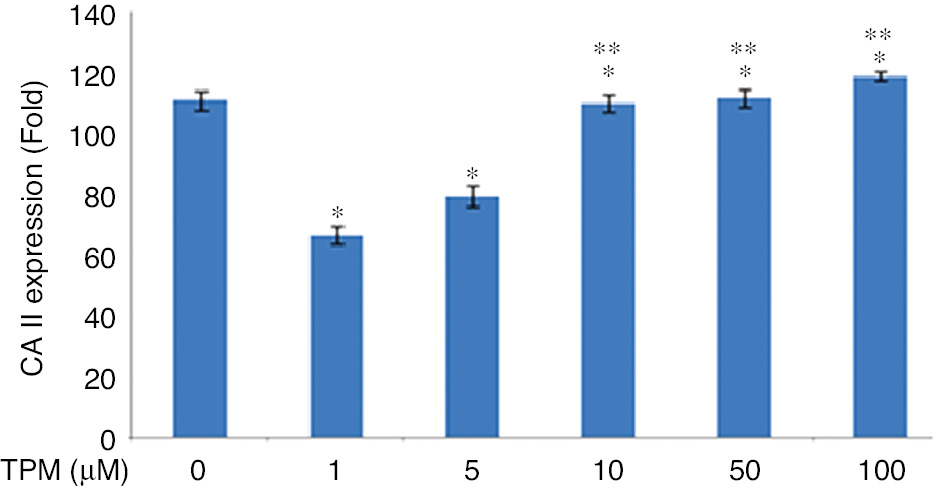
Effects on CA II expression.
*(p=0.0001) compared with no TPM treated cells. **(p=0.0001) compared with 1 and 5 μM TPM treated cells.
In cells treated with 1, 5, and 10 μM TPM, the expression of CA III was found to be increased. In cells treated with 50 and 100 μM, CA III expression was found to be decreased (p=0.009), (Figure 8).
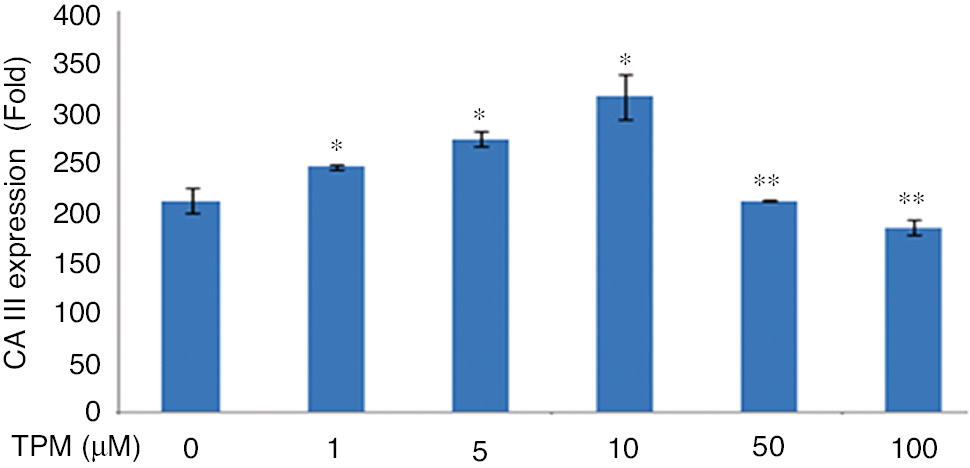
Effects on CA III expression.
(*p=0.009), compared with no TPM treated cells. **p=0.009 compared with 1 and 5 μM TPM treated cells.
While CA VA expression did not show a significant change in cells treated with 1, 5, 10 μM TPM compared to untreated cells, expression changes for 50 and 100 μM were found to be increased (p=0.0001), (Figure 9).
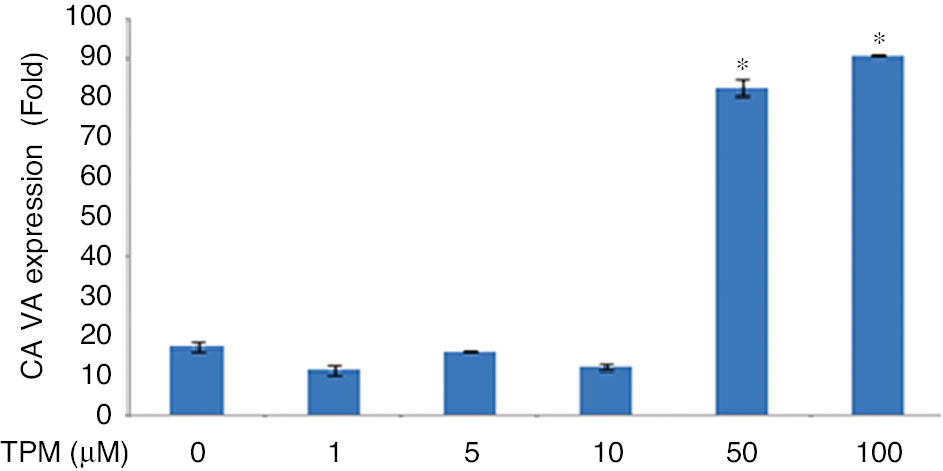
Effects on CA VA expression.
(*p=0.0001) compared with no TPM treated cells.
CA VB expression decreased significantly for 1 and 5 μM TPM (p<0.05), but the change was not significant for 10 μM (p>0.05). A significant increase was observed in cells treated with 50 and 100 μM TPM (p=0.0001), (Figure 10).
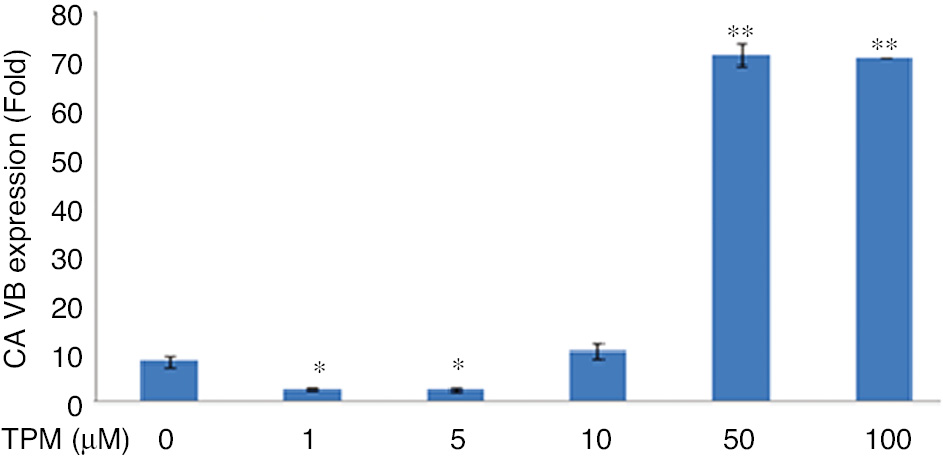
Effects on CA VB *p<0.005, compared with no TPM treated cells.
**p=0.0001, compared with no TPM treated cells.
Discussion
Obesity is the most common metabolic disease in developed countries and a significant risk factor for Type II diabetes, cardiovascular diseases and some types of cancer. The spread of the disease accelerated the studies on the subject and increased its importance. Although changes in dietary habits and lifestyle seem to be theoretically a solution in therapy, pharmacological approaches are required in case of failure. Nevertheless, the drugs used for the treatment of the disease are a limited number, their mechanisms of action are not fully understood and they have serious side effects [11]. Obesity, a complex disease in which environmental and genetic factors play a role, is defined in terms of cell biology as an increased number and volume of adipocytes in the adipose tissue. Many studies on the disease aimed at the factors affecting the proliferation and differentiation of adipocytes [12].
Topiramate is used in the treatment of epilepsy and weight loss was reported to be observed in 6–16% of the patients using this drug. Although the pharmacological effects and mechanisms of the drug are well known; the underlying cause and the mechanisms of the matter which is regarded as a side effect have not been elucidated yet. The upregulation of UCP-2 and 3 expressions in WAT and BAT seem to be involved in this weight loss [13]. Due to the biochemical/pharmacological properties of the drug, its effects on energy metabolism remains controversial [14], [15].
In this study, the effect of various topiramate concentrations on the differentiation of 3T3-L1 cells adipocytes was determined with Oil Red O staining. Topiramate was added to cells at the same time with the differentiation cocktail. According to Oil Red O staining results, preadipocytes were successfully differentiated to adipocytes but topiramate did not affect adipogenesis in a dose-dependent manner. There was no significant difference in the amount of lipid accumulation in cells where the different concentration of topiramate was applied (p>0.05). These findings were not compatible with the weight loss effect of topiramate. Administering topiramate to 3T3-L1 cells at the same time with the differentiation cocktail may be one of the reasons explaining this fact. This solution contains supraphysiological levels of insulin, dexamethasone (glucocorticoid agonist) and 3-isobutyl-1-methylxanthine (phosphodiesterase inhibitor), so topiramate concentrations might be insufficient to reduce adipogenesis and could not affect differentiation of preadipocytes to adipocytes. Topiramate is known to induce greater weight loss in obese than thin individuals [15]. It would be more effective if it was administered after the induction of adipogenesis. Martins et al. reported that TPM induced lipolysis in 3T3-L1 cells, and reduce lipogenesis. They treated the cells with topiramate for 30 min on day 10 after differentiation [16]. These results show the effect of different application times of the drug. They mentioned that one of the proposed mechanisms for lipogenesis reduction can be the carbonic anhydrase enzyme inhibition, which performs the first step of de novo lipogenesis. Since topiramate is an antiepileptic drug, in vitro studies on the drug were mostly done in neurons and neuroprotective effects of topiramate were shown in the investigations [17]. Lee et al. demonstrated its proliferative effect on chondrocytes [18]. In an in vivo study, its damage-reducing effect was shown when administered after hypoxic-ischemic damage in newborn rats [19]. Similarly, the neuroprotective effects of topiramate were demonstrated in a study on newborn piglets [20]. Moreover, topiramate was suggested to exhibit antiapoptotic feature by inhibiting caspase-3 activity in kainate-induced cell death in the mouse hippocampus [21]. Besides, topiramate may show more systemic and complex effects when taken as a drug. However, we have the conviction that the results obtained were because one single type of cells was used in in vitro tests and their interaction with other cells in the adipose tissue as well with the cells in the other tissues and also the effect of the drug in other tissues were ruled out.
This is the first study that evaluated carbonic anhydrase expressions in undifferentiated cells and differentiated but not topiramate-treated cells. As a result, an increase was observed in the expression of CA I, II, III, VA and VB isoenzymes (p=0.0001) along with differentiation, but the highest increase was in the CA III isoenzyme. CA III is an isoenzyme with high expression in muscle tissue and adipose tissue, with an activity of up to 3% of CA II activity. This attracts attention to the cellular functions of the isoenzyme rather than its catalytic function. CA III expression is known to be induced by adipogenesis. In obese cases, a decrease in the amount despite increased fatty acid biosynthesis suggests its possible role in substrate metabolism. CA III is known to regulate adipogenesis at the level of PPARγ2 gene expression. The negative effect of CA III on PPARγ2 expression was demonstrated by the study indicating the increase in adipogenesis in CA III knock-out mice, which was attributed to a 1000-fold increase in PPARγ2 expression. The increase in CA III expression by adipogenesis is not necessary for terminal differentiation and may play a role in the early phase of differentiation [22].
The increase in CA II expression can be explained by the fact that carbonic anhydrase enzyme was the single source of bicarbonate anion the cells required in this whole process of forming the adipocyte phenotype after the cells were stimulated for adipogenesis because the cells treated with high glucose content media and supraphysiologic concentrations of insulin would increase lipogenesis to form lipid droplets. CA II is a highly active isoenzyme, creating metabolons with carriers on cell membranes [22]. Since the cells are in an active process, increasing expressions of the relevant proteins are necessary for the continuation of such metabolic events.
Although the functions of CA I in fat tissue and other tissues are not fully known, its increased expression with the induction of adipogenesis indicates possible involvement in cellular events. Because CA VA and VB are mitochondrial isoforms, it is concluded that the increase in their expression is normally less than other isozymes and that the expression of those isoenzymes increased to provide bicarbonate resources to the mitochondrial synthesis pathways.
Adipocytes are specialized for the storage of excess energy in the form of triacylglycerols and the hydrolysis of these molecules whenever necessary, and they also have important roles in the regulation of energy metabolism [23]. Topiramate is an antiepileptic. Its weight loss effect was initially seen as a side effect and the mechanism was not fully explained. FDA approved topiramate for obesity treatment in 2012. Its effect on energy metabolism was also investigated but clear results could not be obtained. Topiramate was shown to have anorectic effects in a study on Zucker rats and to induce thermogenesis in another study on Wistar rats, while the mechanism is still undetermined. It was also shown to reduce plasma leptin levels in a study on Sprague-Dawley rats. Besides, Picard et al. examined its effects on energy metabolism showing that it decreased circulating glucose and insulin levels [24]. Although there is a limited number of studies in the literature examining the effect of topiramate on adipose tissue and its correlation with carbonic anhydrase inhibition, there is no study investigating its relation with CA gene expression. Supuran et al. investigated CA inhibition extensively and reported several studies about the mechanism of inhibition and inhibitor designs [11].
CA II was shown to be associated with differentiation in osteoclasts and its expression was induced by 1.25 (OH2) Vit D3 [25]. CA II is induced by thyroid hormone in erythroid cells, and all-trans retinoic acid increase CA II expression in monocytes and macrophages, suggesting different hormonal sensitivities in different cell types [26]. In this study, CA II expression decreased with 1 and 5 μM while increased to basal levels again with 10, 50 and 100 μM of topiramate. It was interpreted as topiramate might induce expression of CA II along with adipogenesis or the cell might develop a compensation mechanism with inhibition. In obese individuals, despite increased biosynthesis of fatty acids, adipogenesis-induced expression of CA III is known to decrease [6]. Topiramate-induced adipogenesis increased the expression of CA III first. In the cells treated with 50 and 100 μM TPM, the expression of CA III was lower in parallel to the lipid content of the cells, which was compatible with literature. The change in CA VA and VB expressions can be explained by a mechanism similar to that of CA II. However, a considerably higher increase detected in expression concerning the basal levels suggests different contributing factors.
In conclusion, we determined that topiramate did not affect adipogenesis significantly in the differentiated 3T3-L1 cells, and the expression of CA I, II, III, VA, and VB increased along with the induction of differentiation, and the changes of expression of isoenzymes showed variances in topiramate-treated cells. We have the conviction that the effects of topiramate on adipose tissue may be mediated through other factors rather than adipocytes. The change in CA III expression was consistent with the literature while the change in the expressions of CA II, VA and VB were interpreted as a compensation mechanism in the cells.
-
Conflict of interest: The authors have no conflict of interest.
References
1. Khan Md Y, Gubta P, Bihari B, Misra A, Pathak A, Verma VK. A review on obesity and its management. Intl J Sci Eng Res 2012;3:11.Search in Google Scholar
2. Bays HE. Current and investigational antiobesity agents and obesity treatment targets. Obes Res 2004;12:1197–211.10.1038/oby.2004.151Search in Google Scholar PubMed
3. Dias S, Paredes S, Ribeiro L. Drugs involved in dyslipidemia and obesity treatment: focus on adipose tissue. Int J Endocrinol 2018:2637418.10.1155/2018/2637418Search in Google Scholar PubMed PubMed Central
4. Shin JH, Gadde KM. Clinical utility of phentermine/topiramate (Qsymia™) combination for the treatment of obesity. Diabetes Metab Syndr Obes 2013;6:131–9.10.2147/DMSO.S43403Search in Google Scholar PubMed PubMed Central
5. Supuran CT. Carbonic anhydrase inhibitors as emerging drugs for the treatment of obesity. Expert Opin Emerg Drugs 2012;17:11–5.10.1517/14728214.2012.664132Search in Google Scholar PubMed
6. Frost SC, McKenna R. Carbonic anhydrase: mechanism, regulation, link to disease, and industrial applications. Dordrecht Heidelberg New York London: Springer, 2014;9:291–325.10.1007/978-94-007-7359-2Search in Google Scholar
7. Novakofski J. Adipogenesis: usefulness of in vitro and in vivo experimental models. J Anim Sci 2004;82:905–15.10.2527/2004.823905xSearch in Google Scholar PubMed
8. Supuran CT. Carbonic anhydrase inhibitors in the treatment and prophylaxis of obesity. Expert Opin Ther Patents 2003;13:1545–50.10.1517/13543776.13.10.1545Search in Google Scholar
9. Ramirez-Zacarias JL, Castro-Munozledo F, Kuri-Harcuch W. Quantitation of adipose conversion and triglycerides by staining intracytoplasmic lipids with Oil Red O. Histochemistry 1992;97:493–7.10.1007/BF00316069Search in Google Scholar PubMed
10. Pan PW, Rodriguez A, Parkkila S. A systematic quantification of carbonic anhydrase transcripts in the mouse digestive system. BMC Mol Biol 2007;8:22.10.1186/1471-2199-8-22Search in Google Scholar PubMed PubMed Central
11. Supuran CT, Winum JY. Drug design of zinc enzymes. New Jersey: John, Wiley & Sons, 2009:241–51.10.1002/9780470508169.ch10Search in Google Scholar
12. Gensel JC, Tovar CA, Bresnahan JC, Beattie MS. Topiramate treatment is neuroprotective and reduces oligodendrocyte loss after cervical spinal cord injury. PLoS One 2003;7:e33519.10.1371/journal.pone.0033519Search in Google Scholar
13. York DA, Singer L, Thomas S, Bray GA. Effect of topiramate on body weight and body composition of Osborne-Mendel rats fed a high-fat diet: alterations in hormones, neuropeptide, and uncoupling-protein mRNAs. Nutrition 2000;16:967–75.10.1016/S0899-9007(00)00451-2Search in Google Scholar
14. Moradi S, Kerman SR, Mollabashi M. The effect of topiramate on weight loss in patients with type 2 diabetes. J Res Med Sci 2013;18:297–302.Search in Google Scholar
15. Verrotti A, Scaparrotta A, Agostinelli S, Di Pillo S, Chiarelli F, Grosso S. Topiramate-induced weight loss: a review. Epilepsy Res 2011;95:189–99.10.1016/j.eplepsyres.2011.05.014Search in Google Scholar
16. Martins GP, Souza CO, Marques SD, Luciano TF, Pieri BL, Rosa JC, et al. Topiramate effects lipolysis in 3T3-L1 adipocytes. Bıomed Rep 2015;3:827–30.10.3892/br.2015.514Search in Google Scholar
17. Angehagen M, Ben-Menachem E, Rönnbäck L, Hansson E. Topiramate protects against glutamate- and kainate-induced neurotoxicity in primary neuronal-astroglial cultures. Epilepsy Res 2003;54:63–71.10.1016/S0920-1211(03)00039-1Search in Google Scholar
18. Lee HS, Wang SY, Salter DM, Wang CC, Chen SJ, Fan HC. The impact of the use of antiepileptic drugs on the growth of children. BMC Pediatr 2013;13:211–6.10.1186/1471-2431-13-211Search in Google Scholar PubMed PubMed Central
19. Ozyener F, Çetinkaya M, Alkan T, Gören B, Kafa IM, Kurt MA, et al. Neuroprotective effects of melatonin administered alone or in combination with topiramate in the neonatal hypoxic-ischemic rat model. Restor Neurol Neurosci 2012;30:435–44.10.3233/RNN-2012-120217Search in Google Scholar PubMed
20. Schubert S, Brandl U, Brodhun M, Ulrich C, Spaltmann J, Fiedler N, et al. Neuroprotective effects of topiramate after hypoxia-ischemia in newborn piglets. Brain Res 2005;1058:129–36.10.1016/j.brainres.2005.07.061Search in Google Scholar PubMed
21. Park HJ, Kim HJ, Park HJ, Ra J, Zheng LT, Yim SV, et al. Protective effect of topiramate on kainic acid-induced cell death in mice hippocampus. Epilepsia 2008;49:163–7.10.1111/j.1528-1167.2007.01308.xSearch in Google Scholar PubMed
22. Trayhurn P, Beattie JH. Physiological role of adipose tissue: white adipose tissue as an endocrine and secretory organ. Proc Nutr Soc 2001;60:329–39.10.1079/PNS200194Search in Google Scholar PubMed
23. Richard D, Ferland J, Lalonde J, Samson P, Deshaies Y. Influence of topiramate in the regulation of energy balance. Nutrition 2000;16:961–6.10.1016/S0899-9007(00)00452-4Search in Google Scholar
24. Picard F, Deshaies Y, Lalonde J, Samson P, Richard D. Topiramate reduces energy and fat gains in lean (Fa/?) and obese (fa/fa) Zucker rats. Obes Res 2000;8:656–63.10.1038/oby.2000.84Search in Google Scholar PubMed
25. Lomri A, Baron R. 1 alpha,25-dihydroxyvitamin D3 regulates the transcription of carbonic anhydrase II mRNA in avian myelomonocytes. Proc Nat Acad Sci USA 1992;89:4688–92.10.1073/pnas.89.10.4688Search in Google Scholar PubMed PubMed Central
26. Quélo I, Jurdic P. Differential regulation of the carbonic anhydrase II gene expression by hormonal nuclear receptors in monocytic cells: identification of the retinoic acid response element. Biochem Biophys Res Commun 2000;271:481–91.10.1006/bbrc.2000.2654Search in Google Scholar PubMed
©2020 Walter de Gruyter GmbH, Berlin/Boston
Articles in the same Issue
- Frontmatter
- Review Article
- Lipidomics and cognitive dysfunction – A Narrative review
- Research Articles
- Effects of topiramate on adipocyte differentiation and gene expression of certain carbonic anhydrase isoenzymes
- Heterologous expression of a plant WRKY protein confers multiple stress tolerance in E. coli Bir bitkinin heterolog ifadesi WRKY proteini çoklu stres yaratır E. coli’de tolerans
- Cytogenetic impact of sodium chloride stress on root cells of Vigna radiata L. seedlings
- Understanding the impacts of self-shuffling approach on structure and function of shuffled endoglucanase enzyme via MD simulations
- Evaluation ofTrichoderma atroviride and Trichoderma citrinoviride growth profiles and their potentials as biocontrol agent and biofertilizer
- Physio-biochemical analyses in seedlings of sorghum-sudangrass hybrids that are grown under salt stress under in vitro conditions
- The structural diversity of ginsenosides affects their cholinesterase inhibitory potential
- Extracellular acidity and oxygen availability conjointly control eukaryotic cell growth via modulation of cytoplasmic translation
- Genome-wide identification, phylogeny and expression analysis of G6PC gene family in common carp, Cyprinus carpio
- The effect of Diplotaenia turcica root extract in streptozotocin-induced diabetic rats
- Letter to the Editor
- Metabolomics analysis of medicinal insect Protaetia brevitarsis after Bacillus subtilis fermentation
- Opinion Paper
- Identifying and solving scientific problems in the medicine: key to become a competent scientist