Soft Regulation for Financial Advisors
-
Fabian Veittinger
 ,
Tim Lohse
,
Tim Lohse

Abstract
Our paper experimentally tests whether ‘soft regulatory devices’ that rely on advisor identifiability and reciprocity are able to reduce misconduct by financial advisors. We also test whether advisor ability is negatively related to misconduct. We indeed find that low ability advisors are more likely to engage in misconduct in all treatments including the Baseline. Interestingly, a subset of advisors strategically exploits the identifiability mechanism in order to ‘game the system’, which undermines the effectiveness of the treatment. Furthermore, we find that reciprocity affects advisors heterogeneously, which causes a group of advisors to increase their misconduct and leads to a significant loss in efficiency in comparison to the Baseline treatment. Additionally, we discuss how low ability advisors have different incentives within each treatment compared to high ability advisors. Our analysis reveals substantial disparities in advisor misconduct across various contexts as interventions influence misconduct in a nuanced manner. Finally, we argue for the use of segmented policy approaches in order to respond to complex market environments involving heterogeneous advisors.
1 Introduction
Even though financial advisors have been under increased scrutiny since the financial crisis of 2007 they still play a major role in guiding the investment process of retail investors and continue to be involved in misconduct cases. Egan et al. (2019) state that 56 % of American households consult professional financial advisors while over 7 % of these advisors are estimated to have at least one record that is indicative of misconduct. This is further worsened by the fact that fraud is detectable only to varying degrees, meaning the actual misconduct numbers could be much higher (Ashton et al. 2021).
In order to support investor welfare, the literature on misconduct has attempted to find mechanisms that are able to significantly reduce misconduct without limiting the benefits of financial advice. Classical attempts at reducing misconduct follow the Becker (1968) model of crime, which postulates that advisors act purely out of self-interest and are willing to misconduct whenever the expected monetary benefits outweigh the expected monetary costs. For this reason, the focus has been on increasing monetary punishment in order to reduce misconduct, however, this has had limited success (Amiram et al. 2020; Klimczak et al. 2022). Since these classical methods have failed to provide adequate solutions, the literature has suggested that alternative methods may be necessary to combat misconduct (Camarda et al. 2023; Lausen et al. 2020). The literature on behavioral economics may provide insights for such alternatives by relaxing the assumption of having completely self interested advisors who only care about their own payout.
A key finding in behavioral economics is that people lie less than completely selfish players would and that they have strong preferences for being honest and being seen as honest (Abeler et al. 2019). Additionally, it has been suggested that people lie less when their lie is harmful to the other party (Gneezy 2005) and that there is significant heterogeneity in how people lie (Gneezy et al. 2013). Also, it has been found that people respond to positive gestures with reciprocity by reducing their lying behavior even if this causes them to forgo monetary benefits (Angelova and Regner 2013, 2018). The literature therefore suggests that people take behavioral and moral factors into account when making decisions on whether to lie (Fischbacher and Föllmi-Heusi 2013; Gneezy 2005; Mazar et al. 2008). Furthermore, there is evidence that interventions which target behavioral or moral factors can be used to systematically reduce lying behavior (Alempaki et al. 2019; Cubitt et al. 2011; Ditto et al. 2009).
Motivated by these findings, we develop a framework to experimentally investigate two ‘soft regulatory devices’ relying partly on behavioral mechanisms to test whether they reduce misconduct and increase market efficiency. Our first regulatory device increases the identifiability of advisor truthfulness in past recommendations. This is done by providing investors with a so called truthfulness rate that partly discloses how honest advisors were in previous rounds. The mechanism leverages the desire of advisors to be seen as honest and the increased likelihood that trustworthy advisors will attract future investment. Our second regulatory device gives investors the opportunity to pay a small up-front fee to advisors in order to receive an investment recommendation. With this regulatory device we conjecture that a prior positive act by the one player (investor who paid the voluntary fee) can increase the moral lying cost of the other player (advisor who received the fee), as proposed in the literature on reciprocity (Alempaki et al. 2019). Therefore, we essentially hypothesize that advisors reciprocate to the voluntary fee by reducing their misconduct. While the fee is modest compared to the commission advisors receive, it is intended to convey an act of trust, that advisors may positively respond to. By using a prior exchange between players to reduce lying behavior, we build on evidence which suggests that reciprocity can reduce lying behavior in similar contexts (Alempaki et al. 2019; Angelova and Regner 2018).
Both devices emulate real life mechanisms that attempt to reduce misconduct. The identifiability device resembles a voluntary audit by a third party (e.g. rating agency) while the reciprocity device mirrors a fee based compensation structure in which advisors are paid for their expertise regardless of whether their advice was followed but still receive a commission in case of an investment.
Additionally this paper explores how advisor ability affects misconduct choices. In our setting, we divide advisors into high and low ability, whereas high ability advisors are more likely to receive a project that is profitable for the investor. We then conjecture that advisors compare their commissions across ability types, which leads to a loss of utility due to factors such as inequity aversion (Fehr and Schmidt 1999). Given this, we hypothesize that low ability advisors increase their misconduct behavior compared to high ability advisors in order to make up at least some of the income disparity.
We indeed find that high ability advisors engage in less misconduct compared to low ability advisors in all regulatory settings, including the Baseline. Concerning overall misconduct, we find that misconduct rates are similar in the three treatments on average. However, these averages disguise the substantial heterogeneity in the two regulatory devices. For example, we find that some advisors ‘game the system’ of the transparency device by exploiting their good track record by increasing misconduct in later rounds of the game. The evidence of partially elevated levels of misconduct is also present in the fee device. We therefore emphasize that effective policy has to consider the behavioral dynamics within a particular market.
Our results connect to the literature on misconduct which emphasizes that the current regulatory framework is overly reliant on simple fines, which have been shown to inadequately deter misconduct (Klimczak et al. 2022). This is particularly problematic given the low detection rates of misconduct (Amiram et al. 2020). It has also been noted that under the current regulatory framework many advisors are repeat offenders of misconduct (Egan et al. 2019, 2022) and frequently act on misguided beliefs by recommending sub-optimal investment strategies (Linnainmaa et al. 2021). Additionally, active financial advice may actually lead to higher risk without increased returns due to advisor fees (Chalmers and Reuter 2020). Given these findings, regulatory changes seem necessary so that investors are able to benefit from qualified financial advice while the influence of advisors who engage in misconduct or provide sub-optimal recommendations is minimized.
Despite this need for change there is no consensus in the literature on the steps necessary to achieve greater adaptability in regulation. Proposals include simple scoring systems for advisors (Camarda et al. 2023) and automated detection methods (Lausen et al. 2020). Some authors advocate for a more ethical approach, encouraging advisors to act with integrity through training, personal development and self-regulation within firms (McGrath and Walker 2023). However, other authors argue that relying on self-regulation has led to major misconduct scandals in the past (Jo et al. 2021). Overall, there is a clear demand for more adaptive regulatory measures though the direction of this change remains uncertain. Our paper contributes to this debate by incorporating new findings on potential regulatory interventions as well as advisor ability. Specifically, our paper shows that advisor misconduct varies within specific market structures and that regulatory interventions have heterogeneous effects on financial misconduct as aspects like advisor ability determine strategic incentives. Therefore, our findings could have practical implications for policymakers who seek to design effective frameworks that account for advisor heterogeneity.
The remainder of this paper is organized as follows. Section 2 explains the experimental setup, while Section 3 states the hypotheses. Section 4 presents the results while Section 5 provides a discussion and conclusion.
2 Experimental Setup
2.1 Introduction to the Game
This section first explains the setup of the Baseline treatment and then further elaborates on the treatment variations of the Transparency and Fee treatments. In each of the 18 rounds of the game, the advisor will initially be assigned a project type. Projects differ in their quality type and we refer to low quality projects as ‘unfavorable’ and to high quality projects as ‘favorable’. Favorable projects are defined as having a high probability of being successful while unfavorable projects are defined as having a low probability of being successful. The project type is private information of the advisor. Advisors are then randomly assigned to an investor in each round of the game. If the investor invests in a project that was recommended by the advisor, the advisor will receive a commission. The investor can decide to invest in the project of the advisor, invest herself or not invest at all. The incentives of the two parties are not aligned when the advisor receives an unfavorable project.
At the beginning of the game, advisors are divided into high and low ability types, where high ability types are more likely to receive the favorable project. Investors receive information on the past number of successful and failed projects of the advisor.[1] Investors receive this information along with the advisor recommendation before choosing whether to invest with the advisor. This is meant to represent the most basic information that investors have access to, such as the past performance of a managed fund for example. This can give the investor some indication about the ability of the advisor. However, a random element remains as returns are stochastic, meaning that the advisor ability type is never fully revealed. This is meant to emulate a real life setting in which the ability of the advisor can be estimated after looking at his history of investment projects but is never truly known.
This setup leads to two problems for the regulator. On the one hand, malicious advisors are able to exploit their informational advantage to the detriment of investors by recommending the unfavorable project. On the other hand, investors are unaware of the true project type, meaning that they may decline the opportunity to invest even if it would be in their best interest. This leads to the over-funding of unfavorable projects, under-funding of favorable projects and a net loss of expected utility for the investor from a regulatory perspective.
2.2 Experimental Overview
The experiment was conducted through the WZB laboratory in Berlin, Germany in September of 2021. Participants were allocated to a random treatment and all instructions for the game were provided before the game began. For the Baseline and Fee treatment there are 1728 observations (8 sessions), for the Transparency treatment there are 1512 (7 sessions). One session in the Transparency treatment in which we did not have the full participant number was dropped. This amounts to a total of 23 sessions with 12 participants per session, leading to a total of 276 participants. Half of the participants are investors, while the other half are advisors.
The experiment was programmed on o-tree (Chen et al. 2016) while participants were recruited using ORSEE (Greiner 2015). On average, the payout of the experiment was 15.04 Euros while sessions lasted between 45 and 55 minutes. After the main game, subjects additionally completed a trust game (Berg et al. 1995), a multiple price list procedure (Holt and Laury 2002) as well as a Big 5 measure and a survey. The final payoffs were determined after the completion of the experiment and paid to subjects via pay-pal. Table 1 provides a summary of the observations and payouts of the experiment.
Experiment overview.
| Treatment | Player role | Observations | Participants | Payoff (€) | Number of sessions |
|---|---|---|---|---|---|
| Baseline | Advisor | 864 | 48 | 14.44 | 8 |
| Baseline | Investor | 864 | 48 | 15.02 | |
| Transparency | Advisor | 756 | 42 | 15.53 | 7 |
| Transparency | Investor | 756 | 42 | 16.73 | |
| Fee | Advisor | 864 | 48 | 13.23 | 8 |
| Fee | Investor | 864 | 48 | 15.54 |
2.3 Players and Timing of the Game
Before the game starts, participants are split into advisors (A) and investors (I) wherein half the participants are investors and half are advisors. Advisors are further split equally into two types: low ability (A L ) and high ability (A H ). Subjects are informed that they are going to play between 15 and 20 rounds, while the actual round number is 18.[2] This was done to avoid end game effects. In the Baseline treatment each round t has the following timing, which is again shown in Figure 1 below:
Each investor I is randomly matched to an advisor A. Nature assigns A a project pro t ∈ {Fav, UnFav} where A H is assigned a favorable project (Fav) with high probability p H = 0.6 and A L is assigned a favorable project with low probability p L = 0.37. Both ability type and project type are private information of the advisor.
The advisor decides whether to recommend (1) or not recommend (0) the project, knowing its type (r t ∈ {1, 0}). If there was a recommendation, the investor gets information on the number of past successes and failures of the advisor.
The investor makes her investment decision, inv t ∈ {Adv, Self, Not}. In cases of a recommendation the investor can invest in the project of the advisor (Adv), invest herself (Self) or not invest (Not). In cases without a recommendation the investor can invest herself or not invest.
The success (1) or failure (0) of the project, suc t ∈ {1, 0} is stochastically determined according to the corresponding success probabilities. Payoffs are subsequently determined according to the outcome of the game.
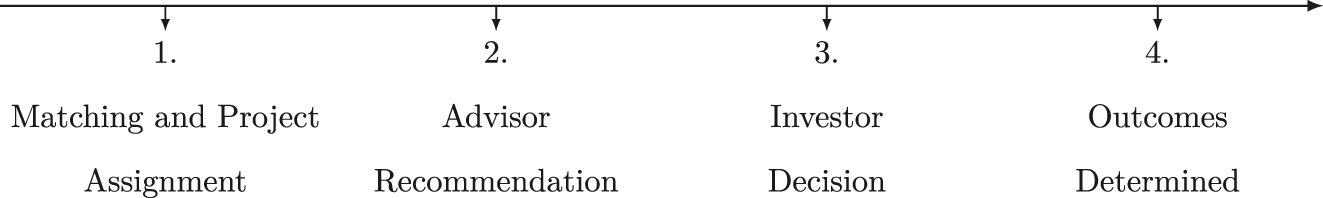
Baseline timing of the game.
An experimental session consists of 12 participants: 6 investors and 6 advisors. Participants are matched randomly in each round with repeated re-matching. The probability of being re-matched with the same participants again in the next round is thus
2.4 Payoffs and Probabilities
The payoff function of the advisor is as follows:
The advisor receives a base salary of 2000 points and additionally receives a commission of 3500 points if the investor decides to invest in his project. Since the investor can only invest after a recommendation, the advisor always has a financial incentive to recommend the project no matter what type it is. The payoff function of the investor is the following:
If the investor does not invest, she receives a constant payoff of 3000 points. In cases of investment, either with the advisor or by herself, the payoff depends on whether the project is successful. A successful project rewards the investor with 5500 points whereas an unsuccessful project only rewards her with 2000 points. Investors are thus best off if they invest in a successful project and worst off if they invest in an unsuccessful project.
High ability advisors have a high probability of getting the favorable project (p H = 0.6), whereas low ability advisors have a low probability of receiving the favorable project (p L = 0.37). The probability of success given the advisor and project type is given in Figure 2 below. The success probability in a self investment is constant at 0.5. This means that investors are strictly better off investing in a favorable project than investing themselves but worse off investing in an unfavorable project than investing themselves. Advisors thus know that they are harming the investor if they recommend the unfavorable project. Misconduct is then defined as recommending the unfavorable project.
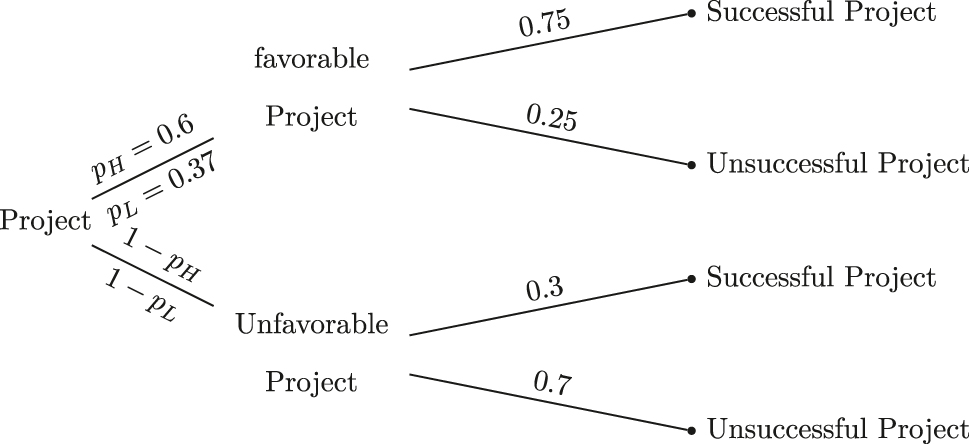
Assignment of projects to advisor types.
Given the probabilities of the advisor types, investors are better off investing with a high ability advisor compared to self investing but worse off investing with a low ability advisor compared to self investing. All players are made aware of this and are given the probabilities for each advisor type to receive a successful and unsuccessful project.[3] This way, investors do not need to make complex calculations about each advisor type.
This complex setting is meant to emulate real life investment scenarios in which retail investors also have to form intuitive beliefs about their investment strategies. The goal of our experimental instructions was to give participants an intuitive understanding of the game rather than expecting them to perform exact calculations. Probabilities and payoffs were explicitly provided in the instructions and in each round giving participants the opportunity to perform exact calculations. However, participants were primarily encouraged to recognize that more successful projects compared to unsuccessful ones would imply a greater probability that the advisor is a high ability type. The experimental results indicate that participants understood this.[4]
At the end of the game, 3 randomly selected rounds are paid out to the subjects where 1000 points amounted to one Euro.
2.5 Transparency Treatment
A Transparency treatment and a Fee treatment were introduced in order to test changes in misconduct and investment behavior across different regulatory environments. In the Transparency treatment advisors are able to pay a small sum of 100 points in order to provide a track record of their honesty after the first round of the game. This track record is shown through a ‘truthfulness rate’ which will be provided to investors before they make their investment decision if advisors decide to use the transparency option. If advisors do not use the transparency option, investors will not be informed about the truthfulness rate. The rate is an imperfect measure of past misconduct behavior that is meant to represent a voluntary external audit of the advisor by a third party. It is calculated as follows:
where N represents the number of past rounds in which the specified set up occurred. This measure captures the alignment between recommendations of advisors and the actual project outcomes. Intuitively, the truthfulness rate rises when the advisor either recommends a project that turns out to be successful or if he does not recommend a project that ends up being unsuccessful. Favorable projects are likely to be successful while unfavorable projects are unlikely to be successful. For this reason, the truthfulness rate rises on average if the advisor recommends a favorable project or if he does not recommend an unfavorable project. All players in this treatment were given an intuitive explanation of how the truthfulness rate works. They were asked to primarily understand that, on average, a higher truthfulness rate is indicative of past truthfulness.[5]
The transparency option was only available after the first round, as no prior decisions have been made in the first round. Investors are aware that advisors are given this transparency option. If the advisor does not use this option for any given round other than the first round, investors are told that the advisor chose to not use this option for the current round.
This additional reputational component gives the advisor an incentive to tell the truth as well as let the investor know about the truthfulness of the advisor in the past, allowing her to select the investments with advisors that have a better reputation. This imperfect measure of truthfulness was chosen as it best reflects a real world situation in which external parties like auditors have limited information about advisor behavior. In such a setting, they are not able to provide investors with a perfect measure of misconduct. Transparency may for example represent a voluntary advisor paid audit that is used to increase transparency as well as provide incentives for truth telling through reputation. The advisor decides whether to pay the transparency payment after recommending the project in step 3 (see Section 2.3). If the advisor does not recommend the project, there is no way to present the track record for the advisor, i.e. the transparency option is not available as investors cannot invest with the advisor. Figure 3 below shows the timing of the Transparency treatment.
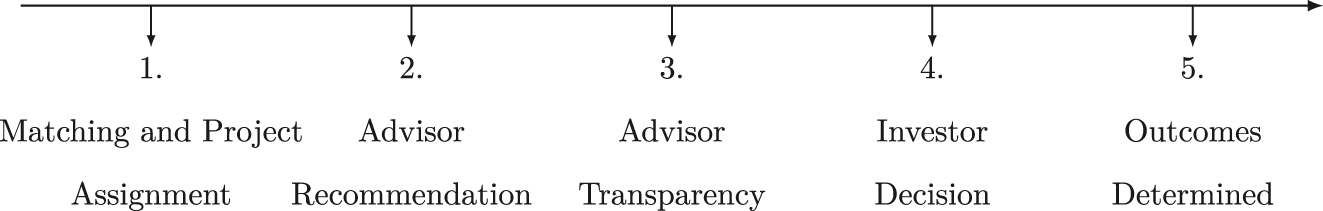
Transparency timing of the game.
2.6 Fee Treatment
In the Fee treatment investors decide whether to pay a small fee of 200 points to the advisor in order to receive information about the project. This fee was deducted from the final payoff of investors. If an investor does not pay the fee, the advisor cannot make a recommendation and investors can only self invest or not invest.
The mechanism is designed to foster goodwill or trust in those advisor-investor pairs in which the fee was paid and thereby hopes to reduce advisor misconduct. This treatment is meant to represent a fee based business model, in which advisors receive a fixed payment for their service in addition to the income from their commission. Advisors are aware that investors have to pay the fee and that they will not be given the option to recommend their project if the fee is not paid. They are also specifically told again that investors paid their fee in each round if this was the case. This is meant to foster reciprocity and potentially induce advisors to act more truthfully. The timeline of the Fee treatment when the fee is not paid is shown in Figure 4 below.
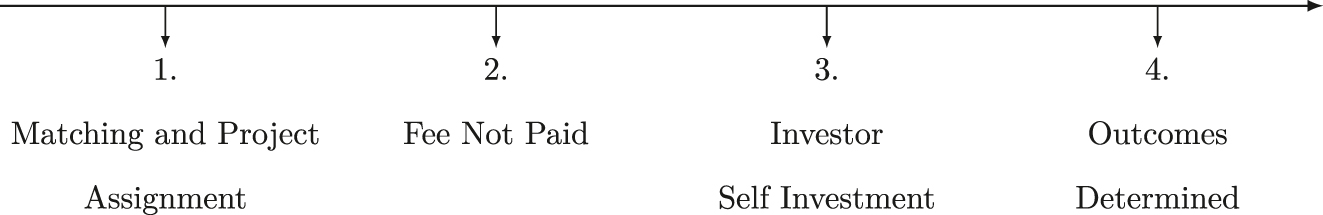
Fee treatment timing when the fee is not paid.
If the fee is not paid, advisors are unable to receive a commission since investors cannot invest with the advisor. If the fee is paid, the timing can be seen in Figure 5 below. This timing is now similar to the Baseline game except that the fee is paid before the recommendation, which is meant to influence both advisor and investor decisions.
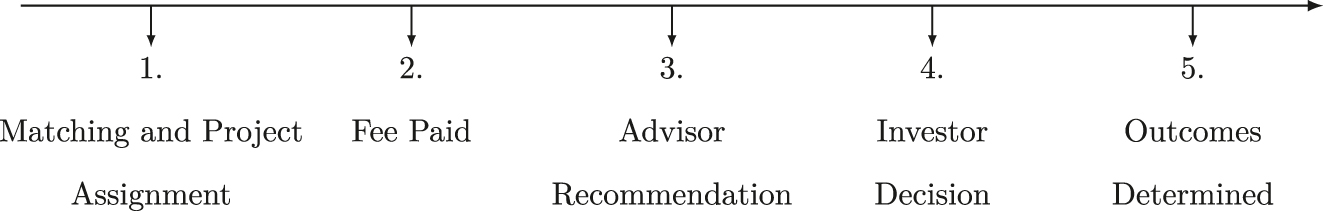
Fee treatment timing when the fee is paid.
3 Hypotheses
Based on the experimental design outlined above, this section outlines our hypotheses. When making our hypotheses we argue that players systematically deviate from the behavior of completely selfish players that only care about their own payoff. We further assume that players have behavioral or moral lying costs that can be increased through treatment interventions, as suggested by some of the literature (Alempaki et al. 2019; Cubitt et al. 2011; Ditto et al. 2009). Below we outline our hypotheses given theories from behavioral economics that have been successfully applied in other settings.
Our first hypothesis compares the likelihood of misconduct between the different advisor ability types across all settings. Given that advisors are aware of their assigned ability type and the characteristics of both types, we conjecture that they will compare their expected earnings across ability types. High ability advisors are expected to earn more commission as their history of past successes outperforms that of low ability advisors on average. According to theories on inequity aversion (Fehr and Schmidt 1999) this comparison will lead to dis-utility for both high and low ability advisors.[6] We postulate that low ability advisors will increase their misconduct compared to high ability advisors in order to offset this inequity in income. We therefore propose the following hypothesis:
H1:
There will be less misconduct by high ability advisors compared to low ability advisors.
In our second hypothesis, we examine whether the treatments lead to increased investment in favorable project recommendations and decreased investment in unfavorable ones. A favorable investment is defined as a scenario where the advisor is assigned a favorable project, recommends it and the investor decides to invest in it. Conversely, an unfavorable investment occurs when an unfavorable project is assigned, recommended by the advisor and subsequently invested in by the investor. For the analysis of favorable investments, we focus exclusively on instances where the project assigned is favorable. We define a binary variable for favorable investment that takes the value 1 if the project is recommended and receives investment, and 0 otherwise. The same methodology applies to unfavorable investments, where we consider only unfavorable projects and define the binary variable accordingly.
We are thus introducing a measure of efficiency that includes both the recommendation decision of advisors and the investment decision of investors. This is relevant as a mechanism that fails to lower misconduct may still be efficient if investors are able to correctly identify favorable and unfavorable projects, leading them to invest more selectively. Obviously regulators would want to maximize the number of favorable investments and minimize the number of unfavorable investments as this leads to higher expected investor payoffs. Identifiability is used to reduce the overall misconduct incentives of advisors and gives investors the ability to identify advisors who frequently engage in misconduct. Reciprocity is aimed at reducing misconduct and creating more trust in the recommendations of advisors once it is made. We therefore postulate the following hypothesis:
H2:
There will be an increase in investments into favorable projects and a decrease in investments into unfavorable projects in the Transparency and Fee treatments compared to the Baseline treatment.
Our last hypothesis concerns the effects of the treatments on misconduct rates of advisors. In both cases we expect the treatments to reduce misconduct rates by attempting to increase lying costs of advisors. In the Transparency treatment advisors are given a truthfulness rate that partly reflects how truthful advisors were over the past rounds of the game. The literature on lying advocates that people prefer to be seen as honest (Abeler et al. 2019) and that they have a reputational cost to lying (Erat and Gneezy 2012; Tergiman and Villeval 2023). We then hypothesize that advisors will have increased reputational costs to lying since liars can be partly identified through the truthfulness rate. This may occur both because advisors naturally want to be seen as honest and because they believe they are more likely to attract investment if they display a higher truthfulness rate. In this way, we follow the literature on lying and identifiability, which generally advocates that higher levels of transparency or identifiability lead to a reduction in lies (Gneezy et al. 2018; Huck et al. 2012).
In the Fee treatment, only those advisors who had their fee paid are able to make recommendations. For completely selfish players, the fee would not impact the misconduct decision since it is not in any way binding. However, we expect that real players have behavioral or moral lying costs as previously suggested (Fischbacher and Föllmi-Heusi 2013; Gneezy 2005; Mazar et al. 2008). Furthermore, as proposed in the literature (Alempaki et al. 2019; Angelova and Regner 2013, 2018), we conjecture that these lying costs are increased for players who previously experienced an act of kindness or trust (having their voluntary fee paid), leading to a reduction in misconduct. While the fee is modest compared to the commission advisors receive, it is intended to convey this act of trust and therefore encourage advisors to positively reciprocate. Therefore, we essentially hypothesize that advisors reciprocate to the voluntary fee by reducing their misconduct. We thus propose the following hypothesis:
H3:
There will be a reduction in misconduct rates in the Transparency and Fee treatments compared to the Baseline treatment.
4 Results
4.1 Data Overview
Our data shows that the distribution of favorable and unfavorable projects is very similar across the treatments,[7] which allows us to look at the efficiency of each treatment and underscores the effective randomization of each treatment. The allocation of favorable projects across advisor ability is also similar to the predicted ratios, as high ability advisors receive favorable projects in 62 % of all cases while low ability advisors receive favorable projects in 36 % of all cases.
Next, we provide an overview of the Fee and Transparency treatments individually to highlight some key insights that are relevant for the rest of the analysis. For the Fee treatment, investor fees were paid only approximately 50 % of the time, meaning that the number of projects that investors could invest in was cut in half. Furthermore, high ability advisors had their fee paid in 59 % of all cases while low ability advisors only had their fee paid in 40 % of all cases. As a result, the number of project recommendations for the Fee treatment is significantly reduced, especially for low ability advisors.
We then shift to the Transparency treatment and examine the use of the transparency option. Our data show that high ability advisors were 9 percentage points more likely to use the transparency option.[8] The transparency option can also be linked to greater honesty. On average, a recommendation of a project was favorable in 68 % of all cases when the advisor used the transparency option. If the transparency option was not used, only 57 % of projects were favorable. This highlights that advisors who use the transparency option tend to be more truthful and that the use of the transparency option signals truthfulness to investors.
As a final point in our overview, we analyze investment rates of investors after a recommendation by the advisor. The investment rate of the Fee treatment stands out at 92 % compared to 57 % in the Baseline and 54 % in the Transparency treatment. These results indicate that investors almost always invest after a recommendation in the Fee treatment. This can be explained by two reasons. First, completely rational investors would only pay the fee if they plan to invest after a recommendation. The choice to invest should thus have already been made before the fee was paid and the recommendation was even possible. Second, the reason behind the high investment rate could involve investors acting irrationally or in a behavioral manner. Investors might, for instance, fail to regard the fee they have already paid as a sunk cost. Alternatively they may begin trusting the advisor more once they paid the fee, expecting some form of reciprocity and therefore lower misconduct. Either way, the findings imply that a recommendation in the Fee treatment is very likely to receive investment, which would also mean that misconduct is likely to receive investment. The investment rates in the Baseline and Transparency treatments are very similar.
4.2 Misconduct by Advisor Ability
We initially investigate whether high ability advisors engage in less misconduct compared to low ability advisors as conjectured in hypothesis H1. Misconduct is a dummy variable which is equal to 1 if the advisor recommended the unfavorable project and 0 otherwise. The descriptive statistics are in line with H1, since high ability advisors misconduct with a probability of around 40 % while low ability advisors misconduct with a probability of around 50 %. This misconduct gap in ability types is largest in the Transparency treatment at 13 percentage points, compared to around 9 percentage points in the Baseline treatment and 8 percentage points in the Fee treatment.[9]
In order to take the panel structure (repeated decisions of the same subject) and the possible correlation within sessions into account, we will (in this and the following subsections) employ multilevel models with clustering at both the subject- and session-level. Regression Table 2 provides the results of a multilevel logit model using misconduct as the dependent variable. This regression shows that advisor ability has a statistically significant effect on the likelihood of misconduct. In the regression, the advisor ability dummy is significant at the 10 percent level without controls and becomes significant at 5 percent when adding controls. This indicates a negative relationship between high ability advisors and the likelihood of misconduct. The most important significant controls are the age of the participants, which is negatively linked to misconduct, and the round number which is positively linked to misconduct. Therefore there is more misconduct by younger participants and in later rounds of the game.
Multilevel regression of misconduct on advisor ability.
| Dependent variable: misconduct | |||
|---|---|---|---|
| (1) | (2) | (3) | |
| Ability | −0.532* | −0.695** | −0.844** |
| (0.284) | (0.305) | (0.373) | |
| Age | −0.074* | −0.108* | |
| (0.045) | (0.056) | ||
| Round number | 0.139*** | 0.169*** | |
| (0.016) | (0.019) | ||
| Constant | 0.008 | 0.250 | 0.103 |
| (0.195) | (1.104) | (1.456) | |
| Additional controls | No | Yes | Yes |
| Risk measure | No | No | Yes |
| Observations | 1036 | 1036 | 893 |
| Number of subjects | 137 | 137 | 116 |
| Number of sessions | 23 | 23 | 23 |
-
Note: The regression table shows a multilevel logit model with clustering at both the subject- and session-level. The dependent variable is misconduct of advisors (binary variable with 0 being no misconduct and 1 being misconduct). This analysis examines all the unfavorable projects that advisors received and examines in how many of these cases advisors recommend the project, as a recommendation of an unfavorable project is defined as misconduct. The probability of misconduct is thus the likelihood that an advisor recommends an unfavorable project, given that he was assigned such a project. Ability is a dummy variable to show the ability of the advisor, which takes on the value 1 if the advisor is of high ability and the value 0 when the advisor is of low ability. Low ability is the baseline group. Age and Round Number are variables to show the age of the advisor and the round number of the game, both shown as integers. Additional control variables include the study field and academic degree as well as a measure of risk aversion which was elicited through a multiple price list switching point using the multiple price list procedure of Holt and Laury (2002). Model (1) includes just the advisor ability dummy, whereas model (2) includes additional controls such as treatment, age, field of study, the round number and number of successes. Model (3) additionally includes the measure of risk aversion. The lower observations in model 3 occur because participants were inconsistent in our multiple price list and therefore did not have a measure of risk aversion. Standard errors are in parentheses and * p
The average partial effect of advisor ability on misconduct in the regression model (1) without controls is around −0.1. This negative effect becomes slightly larger (−0.124) when participant characteristics and round numbers are added in model (2). Finally, when also controlling for a risk measure in model (3), the average partial effect of advisor ability is even stronger (−0.138). These effects imply that being classified as a high ability advisor reduces the propensity to engage in misconduct by approximately 10–14 percentage points. Considering that high ability advisors misconduct approximately 40 % of the time, these reductions represent a substantial relative decrease in the likelihood of misconduct.
To check the robustness of these findings, several other regression models were run, in particular logit models with standard errors clustered at the subject-level[10] (see regression Table 2 in Section A.2 of the Online Appendix), models with random-effects at the subject-level and models with random-effects at the session-level (these models are additionally available on request). All models provide similar findings concerning both statistical significance and magnitude of the coefficients.
4.3 Favorable Investments
In our next step, we evaluate the efficiency of each treatment by analyzing the distribution of favorable and unfavorable investments. We conjecture in H2 that the treatments lead to an increase in the number of favorable investments and a decrease in the number of unfavorable investments. For the analysis of favorable investments, we focus exclusively on instances where the project assigned is favorable. We define a binary variable for favorable investment that takes the value 1 if a favorable project is recommended and receives investment, and 0 otherwise. The same methodology applies to unfavorable investments, where we consider only unfavorable projects and define the binary variable accordingly.
The fraction of favorable investments is 60 % in Baseline, 58 % in Transparency and 48 % in the Fee treatment, highlighting a significant reduction of such investments in the Fee treatment. To formally test this hypothesis we regressed this favorable investment indicator on the treatment dummies as well as controls.
Regression Table 3 shows the results from a multilevel logit model to estimate the treatment effects for favorable investments; once again, clustering occurs at both the subject and session level. These regression results clearly indicate that favorable investment rates are lower in the Fee treatment compared to the Baseline treatment.[11] Additionally, the round number as well as the number of successful projects of the advisor influence the favorable investment choice. The number of successful projects is positively linked to favorable investments while the round number is negatively linked to favorable investment. The average partial effects for the Fee treatment in regression Table 3 are −0.105, −0.174, and −0.185 for models (1), (2) and (3) respectively. This implies that the Fee treatment led to a reduction in favorable investments of around 10–18 percentage points compared to Baseline. From a regulatory perspective this outcome highlights a considerable loss in efficiency. This reduction in efficiency is of course strongly driven by the lower amount of project recommendations in the Fee treatment, as the fee was paid only in around half of all cases. Nevertheless, this resulted in a lower total amount of favorable projects that received investment, which would make investors worse off. Robustness checks using models with clustered standard errors at the subject level, as well as models with individual random effects for subject and session levels, confirm these results (results are available upon request). The regression results for the model with clustered standard errors at the subject level are shown in regression Table 3 in Section A.2 of the Online Appendix.
Multilevel regression of favorable investments by treatment.
| Dependent variable: favorable investment | |||
|---|---|---|---|
| (1) | (2) | (3) | |
| Transparency | −0.06 | −0.11 | −0.20 |
| (0.25) | (0.22) | (0.23) | |
| Fee | −0.47* | −0.89*** | −0.96*** |
| (0.24) | (0.21) | (0.23) | |
| Round number | −0.48*** | −0.48*** | |
| (0.04) | (0.04) | ||
| Constant | 0.33 | 1.63** | 1.55* |
| (0.17) | (0.56) | (0.66) | |
| Additional controls | No | Yes | Yes |
| Risk measure | No | No | Yes |
| Observations | 1211 | 1211 | 1014 |
| Number of subjects | 138 | 138 | 117 |
| Number of sessions | 23 | 23 | 23 |
-
Note: The regression table shows a multilevel logit model with clustering at both the subject- and session-level. The dependent variable is favorable investment of investors (binary variable with 0 being no investment and 1 being an investment into a favorable project). This analysis examines all favorable projects assigned to advisors and examines the frequency with which there was an investment into such a project. A favorable investment thus occurs when the investor decides to invest in a project that is favorable. Transparency and Fee are treatment dummies for the Transparency and Fee treatments respectively, where the Baseline treatment is the baseline group. Round Number is a variable to account for the round number in the experiment. Additional control variables include the gender, study field and academic degree as well as a measure of risk aversion which was elicited through a multiple price list switching point using the multiple price list procedure of Holt and Laury (2002). Model (1) includes just the treatment dummies, whereas model (2) includes additional controls such as treatment, age, field of study, the round number and number of successes. Model (3) additionally includes the measure of risk aversion. The lower observations in model 3 occur because participants were inconsistent in our multiple price list and therefore did not have a measure of risk aversion. Standard errors are in parentheses and * p
Unfavorable investments are almost identical in the different treatments, which highlights the inability of the Transparency and Fee treatments to increase efficiency. The Baseline treatment had 23 % investment in unfavorable projects, whereas the Transparency and Fee treatments had unfavorable investments of 21 % and 20 % respectively. Various regression analyses all indicate that there is no significant difference between the treatments in terms of unfavorable investments.[12]
The inability of the Fee treatment to decrease unfavorable investments is particularly interesting as investors were already limiting the number of available projects by only paying the fee in approximately half of all rounds. Nonetheless, the number of investments in unfavorable projects remains almost the same. A possible drawback of the Fee treatment is that advisors who get their fee paid are very likely to receive investment after engaging in misconduct due to the high investment rates after recommendation. In the Fee treatment, investors invested in an unfavorable project that was recommended in 90 % of all cases compared to just 52 % in the Baseline treatment. This means that high ability advisors with low behavioral or moral lying cost may be very successful at engaging in misconduct, as they have their fee paid more often. In real life scenarios, this could lead to self-selection of such advisors into a fee based structure and therefore result in increasing investment in unfavorable projects. Thus, malicious high ability advisors with low moral lying costs are able to exploit a fee based environment to increase their successful misconduct behavior to the detriment of investors.
4.4 Treatment Differences in Misconduct
Lastly we examine misconduct rates across treatments in order to evaluate whether the treatments are able to reduce misconduct as hypothesized in H3. Surprisingly, misconduct rates are very similar across the treatments and actually slightly higher in the Transparency and Fee treatments. The Baseline treatment shows a misconduct rate of 44 %, while the Transparency and Fee treatments have rates of 48 % and 49 %, respectively. This suggests that neither treatment significantly reduces misconduct and may even slightly increase it. A multitude of regression analyses confirm that there are no statistically significant differences between the misconduct rates of the Baseline treatment and the misconduct of the other treatments at the 5 % significant level for any of our regressions.[13] This is to be expected given that the changes in overall misconduct rates are rather small.
Regression Table 4 demonstrates this result for a multilevel logit model using misconduct as its dependent variable. Once again, clustering occurs at both the subject and session level. We confirm this result in various other regression specifications. Most importantly, logit models with standard errors clustered at the subject level as well as random effects models with random effects at the subject and session level individually. Regression Table 4 in Section A.2 the Appendix shows the specification using clustered standard errors at the subject level.
Multilevel regression of misconduct by treatment.
| Dependent variable: misconduct | |||
|---|---|---|---|
| (1) | (2) | (3) | |
| Transparency | 0.167 | 0.336 | 0.404 |
| (0.338) | (0.358) | (0.441) | |
| Fee | 0.420 | 0.724* | 0.768 |
| (0.355) | (0.377) | (0.479) | |
| Round number | 0.139*** | 0.169*** | |
| (0.016) | (0.019) | ||
| Constant | −0.418* | 0.250 | 0.103 |
| (0.231) | (1.104) | (1.456) | |
| Additional controls | No | Yes | Yes |
| Risk measure | No | No | Yes |
| Observations | 1036 | 1036 | 893 |
| Number of subjects | 137 | 137 | 116 |
| Number of sessions | 23 | 23 | 23 |
-
Note: The regression table shows a multilevel logit model with clustering at both the subject- and session-level. The dependent variable is misconduct of advisors (binary variable with 0 being no misconduct and 1 being misconduct). This analysis examines all the unfavorable projects that advisors received and examines in how many of these cases advisors recommend the project, as a recommendation of an unfavorable project is defined as misconduct. The probability of misconduct is thus the likelihood that an advisor recommends an unfavorable project, given that he was assigned such a project. Transparency refers to the treatment where advisor actions were made visible, and Fee refers to the treatment where advisors were compensated through a fixed fee. Round Number shows the progression in the game. Additional control variables include the gender, study field and academic degree as well as a measure of risk aversion which was elicited through a multiple price list switching point using the multiple price list procedure of Holt and Laury (2002). Model (1) includes just the treatment dummy, whereas model (2) includes additional controls such as treatment, age, field of study, the round number and number of successes. Model (3) additionally includes the measure of risk aversion. The lower observations in model 3 occur because participants were inconsistent in our multiple price list and therefore did not have a measure of risk aversion. Standard errors are in parentheses and * p
In order to gain further insight into why there were no changes in misconduct we start by splitting the treatment data by round number and advisor ability. While the Baseline and Fee treatments have minor increases in misconduct in the last rounds, the misconduct increase in the Transparency treatment is drastic. This increase in misconduct in the last rounds can be clearly seen in Figure 6 using a 3 round split of the data. The increase in misconduct in the Transparency treatment is equal to 28 percentage points, whereas the increase in the Baseline and Fee treatment is 7 and 9 percentage points respectively. Other splits show the same trend. While increases in the Baseline and Fee treatment can be attributed to decreased sensitivity as well as learning effects, the comparatively drastic increase in the Transparency treatment points to other factors playing a role.
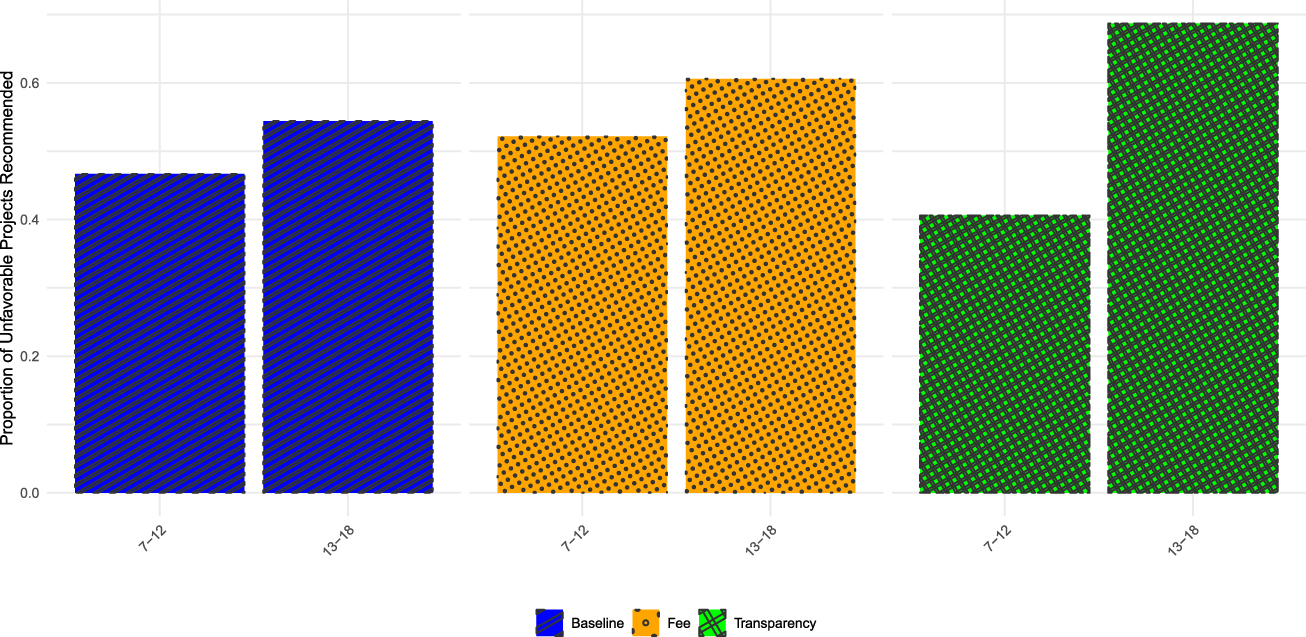
Misconduct increase in later rounds. Note: This figure illustrates the increase in misconduct from rounds 7–12 to rounds 13–18 of the game. Each bar represents the proportion of the unfavorable projects that were recommended by advisors for the various treatments.
Various regression analyses reveal that the increase in misconduct from periods 7–12 to periods 13–18 is only statistically significant in the Transparency treatment and not in the other two treatments. This result is obtained by splitting the round numbers into three separate groups (1–6, 7–12 and 13–18) and entering corresponding dummy variables into the regression model. Regression Tables 5 and 6 in Section A.2 of the Appendix show models with interaction terms between the round number and the treatment dummies. Subsequent Wald test of significance between rounds 7–12 and 13–18 for each treatment reveal that there is only a significant difference at the 5 % level for the Transparency treatment (p-value < 0.01).
A possible explanation for this is that advisors strategically exploit their truthfulness rate in order to engage in misconduct in the final periods. We next look specifically into the Transparency treatment and examine the misconduct of advisors with above average truthfulness rates, who would be seen as being more truthful by investors. For these advisors, misconduct rates are constant at roughly 35 % for the first 12 rounds, however, misconduct rises drastically for the later rounds of the game. For the rounds 13–18 these advisors increase their misconduct to 61 % (see Table 1 in the Appendix Section A.2). It can thus be seen that advisors who were particularly honest in their initial periods almost double their misconduct in the last periods. Our interpretation of these results is that advisors used the transparency option in order to build up a reputation for additional investments in the final rounds and thereby ‘game the system’. This essentially undermines the effectiveness of the identifiability mechanism, as misconduct numbers drastically increase in later rounds.
Next, we examine the Fee treatment individually and find that a form of negative reciprocity might be at play which leads to greater misconduct numbers among advisors that did not receive their fee frequently. Figure 7 shows average misconduct ratios in the Fee treatment, segmented by round number and whether the frequency of fees paid in the first nine rounds was above or below the overall participant average for those rounds. The figure shows that advisors who received less than the average amount of fee payments in the first half of the experiment had a more pronounced increase in misconduct compared to their counterparts who were paid more frequently. Despite similar levels of misconduct in the early rounds, this later divergence suggests a form of negative reciprocity from advisors receiving lower fees. Such a response undermines the intended effect of the voluntary fee mechanism, indicating that a failure to ‘meet the expectations of advisors’ in terms of fees can lead to increased misconduct behavior.
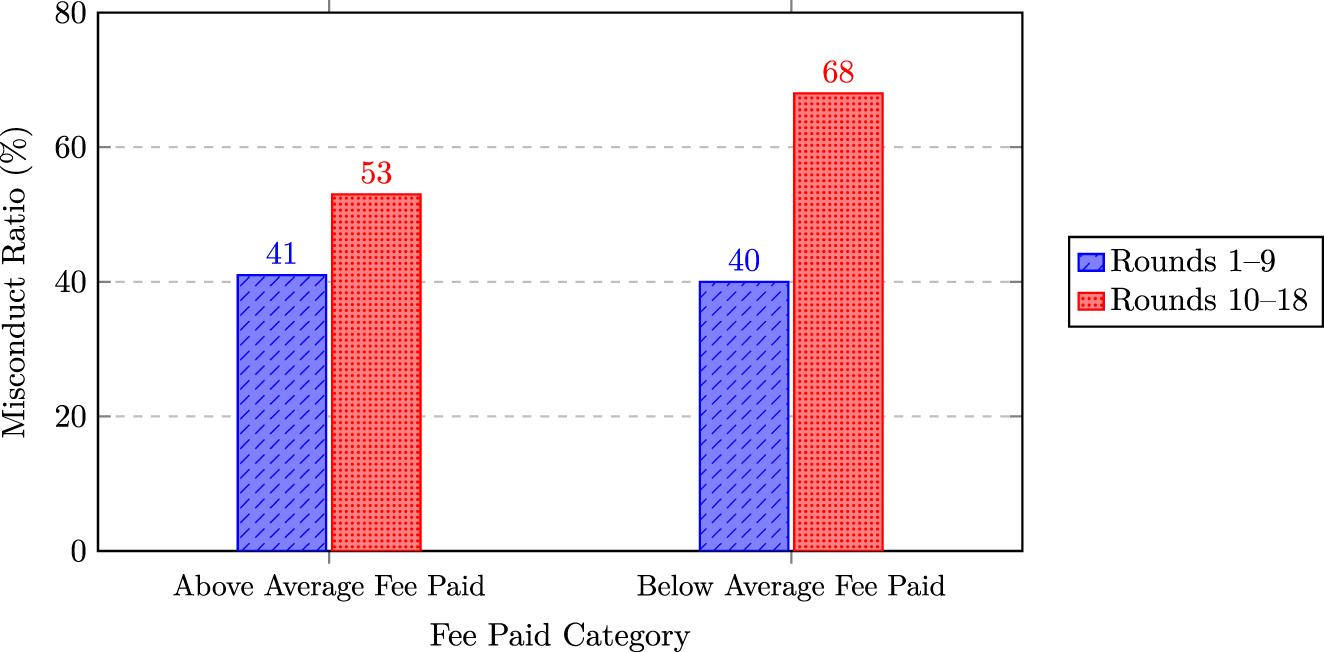
Misconduct by fee paid in the fee treatment. Note: Figure 7 shows average misconduct ratios in the fee treatment, segmented by round number and whether the frequency of fees paid in the first nine rounds was above or below the overall participant average for those rounds. The bars on the left indicate the number of project recommendations of unfavorable projects (misconduct) for advisors who had their fee paid above average for the first 9 rounds while the bars on the right show the same for those advisors who had their fee paid less than average in the first 9 rounds. It can be seen that the initial recommendations are almost identical. However, those who had their investor fee paid less than average strongly increased their misconduct in later rounds compared to those who had their fee paid more frequently.
We can thus see that both the identifiability and the reciprocity mechanisms experience significant shortcomings in settings with different advisor types. Also, the incentives or behavioral influence factors of advisors may be altered depending on the advisor type. This leads to the current situation in which neither mechanism is able to reduce misconduct.
5 Discussion and Conclusion
This paper explores how two ‘soft regulatory’ devices as well as advisor ability affect misconduct probabilities of advisors. We find that high ability advisors engage in less misconduct compared to low ability advisors in all regulatory settings, including the Baseline. This finding may be driven by several factors. In particular, high ability advisors likely face greater reputational losses from misconduct than low ability advisors. Meanwhile, low ability advisors might try to compensate for their lower earnings (due to fewer project sales) by engaging in more misconduct.
The larger reputational concerns of high ability advisors compared to low ability advisors constitute a significant weakness of reputation-based regulation. In fact, our data shows that the misconduct gap between high and low ability advisors is particularly large in the Transparency treatment. This suggests that reputation-based regulatory devices can be successful for high ability advisors, but may have a weaker effect on low ability advisors. Due to this discrepancy, real low ability advisors might self-select out of market settings that enforce reputation if this is possible. If the mechanism therefore only applies to high ability advisors, it might not be as effective, as high ability advisors will naturally have higher truthfulness rates, since they receive the favorable project more often.
A real life consequence of this discrepancy in advisor behavior could be that firms offering poor performing investment projects might employ more advisors who tend to misconduct frequently. In fact, Egan et al. (2019) argue that some firms may even ‘specialize’ in misconduct, which could be partly explained by our findings. From a regulatory perspective, it is essential to place further emphasis on these firms. Egan et al. (2019) argue that these firms usually target customers with low levels of financial sophistication that may not be able to spot misconduct. One policy recommendation could thus be to specifically target firms that have recently under performed.
Interestingly, both our treatment interventions were ineffective in reducing misconduct, as a subset of advisors increased their misconduct due to strategic or behavioral reasons. In the Transparency treatment, a subset of advisors exploited the mechanism by initially building up a positive reputation in earlier rounds. Later, when they had built up a high truthfulness rate and could attract more investment, these advisors decided to increase their misconduct in the final rounds. This way, they were essentially ‘gaming the system’. In real life settings, these types of advisors have an incentive to exploit transparency measures by building up reputations early on in their careers and using them to engage in misconduct later on, when a reputation is established. Another issue is that different advisor types will self select into the environment that offers them the highest payoff, which is not in the best interest of investor welfare.
In real world settings, reputation based mechanisms may therefore attract more high ability advisors. This provides the advantage of raising the number of favorable investment projects that are available for recommendation. However it may lead to long term consequences that could also be problematic. Specifically, high ability advisors have a financial incentive to use their reputation in order to engage in successful misconduct once their reputation is built up. This is concerning since these types of advisors would be seen as credible due to both their good history as well as truthfulness rate. They would thus attract investment even when engaging in misconduct. Malicious high ability advisors thus have an incentive to self-select into such a setting and are likely to attract considerable investments from unsuspecting investors. Therefore, while such mechanisms can improve the market outcome by attracting high ability advisors, they may also allow misconduct to persist and go undetected for those advisors.
Possible alternative mechanisms could try to adjust reputation-building in such a way that more recent behavior is weighted much more strongly. This should deter advisory firms from using their reputation in order to take advantage of investors. Such an adjustment would ensure that advisors are continually incentivized to maintain honest behavior throughout their careers, as recent misconduct would significantly damage their standing. This would also reduce the incentives of malicious high ability advisors to self-select into this project structure and mislead investors with their track records.
The Fee treatment was also unable to reduce misconduct and actually led to a reduction in the number of favorable projects that received investment. This result is driven by advisors who did not attract investment in the first half of the game and thereby received a lower payoff from both investment commission and fee payments. This group of advisors, consisting primarily of low ability advisors, had a tendency to increase their misconduct more strongly in the second half of the game. Regulatory bodies that aim to reduce misconduct in fee based environments may thus need to pay special attention to these types of advisors. Possible regulatory mechanisms to counter this include having a disclosure for the frequency of fees paid and greater regulatory checks for advisors that did not have their fee paid frequently, as well as performance based regulation.
A major reason for the ineffectiveness of the Fee treatment may be the reductions in interactions between investors and advisors since the fee is only paid around half the time. Advisors thus have less opportunities to earn a commission by recommending favorable projects. As a result, they may try to make up for lost income by increasing misconduct, which could negate the positive effects of reciprocity. This downside is also present in real-life fee based business models, as there is significantly less demand for financial advice in such settings, especially by low income households (West 2012; Dean and Finke 2011). High ability advisors might still be able to attract clients because of their superior investment histories. This would even enable them to supplement their commission based income with additional income through investor fees. In contrast, low ability advisors may struggle to attract clients and might subsequently resort to additional misconduct to compensate for lost income.
A further downside of the fee device is the creation of misconduct incentives for high ability advisors. Advisors learn that investors almost always follow their recommendations once the fee is paid. Since high ability advisors have their fee paid frequently, and investors usually follow their advice, these advisors are able to gain substantial investment, even from unfavorable investment projects. These high ability advisors pose a particular challenge for regulators. On the one hand, these types of advisors are high performing and therefore often provide efficiency-increasing advice to the investors. On the other hand, when these high performing advisors do engage in misconduct by recommending an unfavorable project, that project is far more likely to receive investment than it would in the Baseline setting (where advice is not always followed). Future research should analyze why investors follow recommendations so often. It is possible that investors wrongfully interpret the payment of fees as a device to generate a high degree of trust, which is in turn exploited by the advisors.
Because of the high investment rates after the fee is paid, there are also incentives for malicious high ability advisors to self-select into a fee based market structure. While high ability advisors are generally less likely to misconduct, a subset of such advisors may exploit the regulatory environment to increase their misconduct, thereby gaming the system. This is particularly concerning since high ability advisors are likely to attract investment. Due to the high number of successful projects in the history of these advisors, they can continue to exploit this market structure in which they get their fee paid and are able to receive investment from a recommendation of an unfavorable project. Therefore, even in the long run, a subset of high ability advisors remains within this market structure which is able to exploit investor trust.
A potential policy measure could be to link fees, as well as other compensation, to greater ethical compliance or voluntary transparency within fee type environments. Another possible approach would be to enforce mandatory ethical training, which has been successful in other domains (Fagan 2019). Also, fines for repeated offenses could exponentially increase in a fee based structure. These regulatory interventions aim to reduce the number of malicious high ability advisors and lessen their incentives to self-select into this market structure.
While these regulatory insights might have practical implications for policy, a note of caution is necessary when generalizing our experimental findings to real life investment applications. We analyze misconduct among financial advisors in a controlled laboratory setting. By and large, this corresponds to an impersonal consulting setting, for example on the Internet. However, in real-world interactions, advisors and investors may also engage face-to-face. This distinction may be crucial as face-to-face interactions can significantly influence advisors’ propensity to engage in dishonest behavior. Research by Konrad et al. (2014) suggests that in face-to-face settings, individuals perceived as honest may still be more prone to misconduct. For advisors who are aware of their honest appearance, this would mean a strategic advantage and could lead to more misconduct than with advice via the Internet. Moreover, gender plays a role in these perceptions, with men generally perceived as less honest compared to women (Lohse and Qari 2021). These insights highlight the complexity of real-world advisory environments, suggesting that personal perceptions and biases could further impact misconduct dynamics beyond those observed in our laboratory experiment.
Despite these limitations, our paper shows that soft regulatory interventions have heterogeneous effects on financial misconduct as factors such as advisor ability shape financial incentives and therefore misconduct choices. Furthermore there are also interactions between the intervention, advisor ability and the dynamics of advisor behavior. Our analysis thus demonstrates the complexity of behavioral responses to interventions and highlights that sophisticated regulatory mechanisms are necessary to adequately deal with the heterogeneous responses of advisors. This underscores the need for regulators to have a nuanced understanding of misconduct dynamics in various regulatory settings and adopt a proactive, adaptive role in financial legislation. The most effective policy could thus be a segmented strategy that tailors regulatory responses to different advisor types within each market context.
References
Abeler, J., D. Nosenzo, and C. Raymond. 2019. “Preferences for Truth-Telling.” Econometrica 87 (4): 1115–53. https://doi.org/10.3982/ecta14673.Suche in Google Scholar
Alempaki, D., G. Doğan, and S. Saccardo. 2019. “Deception and Reciprocity.” Experimental Economics 22: 980–1001. https://doi.org/10.1007/s10683-018-09599-3.Suche in Google Scholar
Amiram, D., S. Huang, and S. Rajgopal. 2020. “Does Financial Reporting Misconduct Pay Off Even when Discovered?” Review of Accounting Studies 25 (3): 811–54. https://doi.org/10.1007/s11142-020-09548-7.Suche in Google Scholar
Angelova, V., and T. Regner. 2013. “Do Voluntary Payments to Advisors Improve the Quality of Financial Advice? An Experimental Deception Game.” Journal of Economic Behavior & Organization 93: 205–18. https://doi.org/10.1016/j.jebo.2013.03.022.Suche in Google Scholar
Angelova, V., and T. Regner. 2018. “Can a Bonus Overcome Moral Hazard? Experimental Evidence from Markets for Expert Services.” Journal of Economic Behavior & Organization 154: 362–78. https://doi.org/10.1016/j.jebo.2018.07.016.Suche in Google Scholar
Annan, F. 2022. “Gender and Financial Misconduct: A Field Experiment on Mobile Money.” Available at SSRN 3534762.Suche in Google Scholar
Ashton, J., T. Burnett, I. Diaz-Rainey, and P. Ormosi. 2021. “Known Unknowns: How Much Financial Misconduct is Detected and Deterred?” Journal of International Financial Markets, Institutions and Money 74: 101389. https://doi.org/10.1016/j.intfin.2021.101389.Suche in Google Scholar
Becker, G. S. 1968. “Crime and Punishment: An Economic Approach.” In The Economic Dimensions of Crime. Springer.10.1007/978-1-349-62853-7_2Suche in Google Scholar
Berg, J., J. Dickhaut, and K. McCabe. 1995. “Trust, Reciprocity, and Social History.” Games and Economic Behavior 10 (1): 122–42. https://doi.org/10.1006/game.1995.1027.Suche in Google Scholar
Camarda, J., S. J. Lee, P. de Jong, and J. Lee. 2023. “Badges of Misconduct: Consumer Rules to Avoid Abusive Financial Advisers.” Journal of Financial Regulation 9 (2): 210–24. https://doi.org/10.1093/jfr/fjac012.Suche in Google Scholar
Chalmers, J., and J. Reuter. 2020. “Is Conflicted Investment Advice Better Than No Advice?” Journal of Financial Economics 138 (2): 366–87. https://doi.org/10.1016/j.jfineco.2020.05.005.Suche in Google Scholar
Chen, D. L., M. Schonger, and C. Wickens. 2016. “Otree – An Open-Source Platform for Laboratory, Online, and Field Experiments.” Journal of Behavioral and Experimental Finance 9: 88–97. https://doi.org/10.1016/j.jbef.2015.12.001.Suche in Google Scholar
Cubitt, R. P., M. Drouvelis, S. Gächter, and R. Kabalin. 2011. “Moral Judgments in Social Dilemmas: How Bad is Free Riding?” Journal of Public Economics 95 (3–4): 253–64. https://doi.org/10.1016/j.jpubeco.2010.10.011.Suche in Google Scholar
Dean, L., and M. S. Finke. 2011. “Compensation and Client Wealth Among Us Investment Advisors.” Available at SSRN 1802628.10.2139/ssrn.1802628Suche in Google Scholar
Ditto, P. H., D. A. Pizarro, and D. Tannenbaum. 2009. “Motivated Moral Reasoning.” Psychology of Learning and Motivation 50: 307–38.10.1016/S0079-7421(08)00410-6Suche in Google Scholar
Egan, M., G. Matvos, and A. Seru. 2019. “The Market for Financial Adviser Misconduct.” Journal of Political Economy 127 (1): 233–95. https://doi.org/10.1086/700735.Suche in Google Scholar
Egan, M., G. Matvos, and A. Seru. 2022. “When Harry Fired Sally: The Double Standard in Punishing Misconduct.” Journal of Political Economy 130 (5): 1184–248. https://doi.org/10.1086/718964.Suche in Google Scholar
Erat, S., and U. Gneezy. 2012. “White Lies.” Management Science 58 (4): 723–33. https://doi.org/10.1287/mnsc.1110.1449.Suche in Google Scholar
Fagan, F. 2019. “Reducing Ethical Misconduct of Attorneys with Mandatory Ethics Training: A Dynamic Panel Approach.” Review of Law & Economics 15 (3): 20170049. https://doi.org/10.1515/rle-2017-0049.Suche in Google Scholar
Fehr, E., and K. M. Schmidt. 1999. “A Theory of Fairness, Competition, and Cooperation.” Quarterly Journal of Economics 114 (3): 817–68. https://doi.org/10.1162/003355399556151.Suche in Google Scholar
Fischbacher, U., and F. Föllmi-Heusi. 2013. “Lies in Disguise – An Experimental Study on Cheating.” Journal of the European Economic Association 11 (3): 525–47. https://doi.org/10.1111/jeea.12014.Suche in Google Scholar
Gneezy, U. 2005. “Deception: The Role of Consequences.” The American Economic Review 95 (1): 384–94. https://doi.org/10.1257/0002828053828662.Suche in Google Scholar
Gneezy, U., A. Kajackaite, and J. Sobel. 2018. “Lying Aversion and the Size of the Lie.” The American Economic Review 108 (2): 419–53. https://doi.org/10.1257/aer.20161553.Suche in Google Scholar
Gneezy, U., B. Rockenbach, and M. Serra-Garcia. 2013. “Measuring Lying Aversion.” Journal of Economic Behavior & Organization 93: 293–300. https://doi.org/10.1016/j.jebo.2013.03.025.Suche in Google Scholar
Greiner, B. 2015. “Subject Pool Recruitment Procedures: Organizing Experiments with Orsee.” Journal of the Economic Science Association 1 (1): 114–25. https://doi.org/10.1007/s40881-015-0004-4.Suche in Google Scholar
Holt, C. A., and S. K. Laury. 2002. “Risk Aversion and Incentive Effects.” The American Economic Review 92 (5): 1644–55. https://doi.org/10.1257/000282802762024700.Suche in Google Scholar
Huck, S., G. K. Lünser, and J.-R. Tyran. 2012. “Competition Fosters Trust.” Games and Economic Behavior 76 (1): 195–209. https://doi.org/10.1016/j.geb.2012.06.010.Suche in Google Scholar
Jo, H., A. Hsu, R. Llanos-Popolizio, and J. Vergara-Vega. 2021. “Corporate Governance and Financial Fraud of Wirecard.” European Journal of Business and Management Research 6 (2): 96–106. https://doi.org/10.24018/ejbmr.2021.6.2.708.Suche in Google Scholar
Klimczak, K. M., A. J. G. Sison, M. Prats, and M. B. Torres. 2022. “How to Deter Financial Misconduct if Crime Pays?” Journal of Business Ethics 179 (1): 205–22. https://doi.org/10.1007/s10551-021-04817-0.Suche in Google Scholar
Konrad, K. A., T. Lohse, and S. Qari. 2014. “Deception Choice and Self-Selection–The Importance of Being Earnest.” Journal of Economic Behavior & Organization 107: 25–39. https://doi.org/10.1016/j.jebo.2014.07.012.Suche in Google Scholar
Lausen, J., B. Clapham, M. Siering, and P. Gomber. 2020. “Who is the Next “Wolf of Wall Street”? Detection of Financial Intermediary Misconduct.” Journal of the Association for Information Systems 21 (5): 7. https://doi.org/10.17705/1jais.00633.Suche in Google Scholar
Linnainmaa, J. T., B. T. Melzer, and A. Previtero. 2021. “The Misguided Beliefs of Financial Advisors.” Journal of Finance 76 (2): 587–621. https://doi.org/10.1111/jofi.12995.Suche in Google Scholar
Lohse, T., and S. Qari. 2021. “Gender Differences in Face-to-Face Deceptive Behavior.” Journal of Economic Behavior & Organization 187: 1–15. https://doi.org/10.1016/j.jebo.2021.03.026.Suche in Google Scholar
Lohse, T., S. Qari, and F. Veittinger. 2024. “Reducing Financial Misconduct: The Impact of Punishment and Gender Anonymity.” Manuscript submitted for publication.Suche in Google Scholar
Mazar, N., O. Amir, and D. Ariely. 2008. “The Dishonesty of Honest People: A Theory of Self-Concept Maintenance.” Journal of Marketing Research 45 (6): 633–44. https://doi.org/10.1509/jmkr.45.6.633.Suche in Google Scholar
McGrath, J., and C. Walker. 2023. “Regulating Ethics in Financial Services: Engaging Industry to Achieve Regulatory Objectives.” Regulation & Governance 17 (3): 791–809. https://doi.org/10.1111/rego.12482.Suche in Google Scholar
Tergiman, C., and M. C. Villeval. 2023. “The Way People Lie in Markets: Detectable vs. Deniable Lies.” Management Science 69 (6): 3340–57. https://doi.org/10.1287/mnsc.2022.4526.Suche in Google Scholar
West, J. 2012. “Financial Advisor Participation Rates and Low Net Worth Investors.” Journal of Financial Services Marketing 17: 50–66. https://doi.org/10.1057/fsm.2012.4.Suche in Google Scholar
Supplementary Material
This article contains supplementary material (https://doi.org/10.1515/rle-2024-0064).
© 2025 the author(s), published by De Gruyter, Berlin/Boston
This work is licensed under the Creative Commons Attribution 4.0 International License.
Artikel in diesem Heft
- Frontmatter
- Articles
- The Impact of Online Dispute Resolution on the Judicial Outcomes in India
- Legal Compliance and Detection Avoidance: Results on the Impact of Different Law-Enforcement Designs
- Women in Piracy. Experimental Perspectives on Copyright Infringement
- Is Investment in Prevention Correlated with Insurance Fraud? Theory and Experiment
- Bias, Trust, and Trustworthiness: An Experimental Study of Post Justice System Outcomes
- Do Sanctions or Moral Costs Prevent the Formation of Cartel Agreements?
- Efficiency and Distributional Fairness in a Bankruptcy Procedure: A Laboratory Experiment
- Soft Regulation for Financial Advisors
- Conciliation, Social Preferences, and Pre-Trial Settlement: A Laboratory Experiment
- The Impact of Tax Culture on Tax Rate Structure Preferences: Results from a Vignette Study with Migrants and Non-Migrants in Germany
- Perceptions of Justice: Assessing the Perceived Effectiveness of Punishments by Artificial Intelligence versus Human Judges
- Judged by Robots: Preferences and Perceived Fairness of Algorithmic versus Human Punishments
- The Hidden Costs of Whistleblower Protection
- The Missing Window of Opportunity and Quasi-Experimental Effects of Institutional Integration: Evidence from Ukraine