Conciliation, Social Preferences, and Pre-Trial Settlement: A Laboratory Experiment
-
Matthieu Belarouci


Abstract
We experimentally study whether conciliation, a dispute resolution mechanism where a neutral third party makes non-binding suggestions of resolution to the parties, can improve bargaining efficiency. In conciliation, a neutral third party collaborates with the parties by suggesting resolutions to promote agreements. Unlike delegation or arbitration, conciliation fully preserves the autonomy of the parties. Unlike mediation, the conciliator cannot filter information. Whether conciliation can improve bargaining efficiency is an open question. In our laboratory experiment, two “litigants” bargain over the split of a loss in an unstructured protocol. In case of failure, a random split is implemented. In some conditions, a third party, the conciliator takes part in the bargaining by submitting non-binding suggestions to the litigants. We find that, on average, conciliation does not reduce the likelihood of failure, and does not affect the splits that are agreed upon by litigants. However, conciliation reduces bargaining delays: the time and the number of offers necessary to converge to an agreement are significantly reduced in the presence of a conciliator. In addition, conciliation has a heterogeneous effect: while its average effect is null, for bargaining pairs composed of selfish litigants, it results in more equal agreements. The social preferences of the conciliator matter too, both for the likelihood and nature of agreements.
Funding source: Institut des études et de la recherche sur le droit et la justice
Acknowledgements
We thank the editors and anonymous referees for their suggestions, which have contributed to improving this paper.
-
Research funding: This work was supported by GIP Institut des études et de la recherche sur le droit et la justice (IERDJ), borne by the French Ministry of Justice and CNRS, and by la Fondation de la Catho. We are grateful to Antoine Deplancke for help setting up the experiment, and to Julien Benistant, Bruno Deffains, Yannick Gabuthy and Nicolas Vaillant for detailed comments and suggestions, as well as the audiences at NeuroPSY 2022 in Lille, ASFEE 2022 in Lyon, Journées de Microéconomie Appliquée 2024 in Lille, and seminar participants at CRED (Paris 2) and EconomiX (Paris 10).
A Power Analysis and Sample Size Determination
To determine the necessary sample size, we adopted a simulation-based power calculation. We focus on the effect of conciliation on the failure rate between two treatments (for instance NoConcil_Uniform and Concil_Uniform). We simulated 100 samples for each possible combination of parameters. The parameters include the treatment effect (or effect size, i.e. a difference in failure rate expressed in percentage points), session effect, number of sessions, number of participants, and a variance parameter. We ran regressions on each of these samples independently and counted how many times the coefficient estimated for the treatment effect was significantly different from 0. This gives us the simulation-based estimate of power for the given vector of parameters. Table A.1 reports the power for a subset of the tested parameters. Given our sample with 6 sessions per treatment, and between 60 and 70 observations per treatment, we have an estimated power of 80 % to detect an effect of 15 percentage points, assuming a moderate session effect.
Power calculation.
| Power | Treatment effect | Session effect | Size session | Sessions per treatment |
|---|---|---|---|---|
| 0.77 | 0.1 | 0.05 | 70 | 6 |
| 0.78 | 0.15 | 0.1 | 60 | 6 |
| 0.8 | 0.15 | 0.1 | 70 | 6 |
| 0.95 | 0.15 | 0.05 | 60 | 6 |
| 0.97 | 0.15 | 0.05 | 70 | 6 |
-
Note: The agreement rate in the baseline is set at 50 %. Treatment effect is the difference from the baseline in percentage points, the session effect is measured in percentage point, Size Session is the number of observations in a session.
B Results on the Effect of Judgment and Information on Bargaining Outcomes
B.1 The Effect of the Judgment
We test whether the judgment impacts the likelihood and the nature of the agreement. Table B.2 reports the rate of failure and the distance from equality when an agreement is reached, by treatment. We separate the Judgement in 5 brackets, depending on their distance from equality. We exclude interactions in which none of the litigants is informed of the judgment because the judgment could not matter in these situations. Note however that the following results hold if we include these data.
Agreement across treatments and judgement bins.
| Judgement distance bracket | |||||
|---|---|---|---|---|---|
| [0; 1] | [1; 2] | [2; 3] | [3; 4] | [4; 5] | |
| Treatment: | |||||
| NoConcil_Uniform | |||||
| % Of failed bargaining | 0.232 | 0.273 | 0.362 | 0.463 | 0.343 |
| Distance from the equal split | 0.636 | 0.79 | 1.59 | 1.15 | 1.92 |
| Concil_Uniform | |||||
| % Of failed bargaining | 0.245 | 0.266 | 0.31 | 0.421 | 0.408 |
| Distance from the equal split | 0.51 | 0.715 | 0.94 | 1.19 | 2.14 |
| NoConcil_Extreme | |||||
| % Of failed bargaining | 0.284 | ||||
| Distance from the equal split | 1.45 | ||||
| Concil_Extreme | |||||
| % Of failed bargaining | 0.329 | ||||
| Distance from the equal split | 1.36 | ||||
-
We dropped observations in which none of the parties is informed about the judgment, since in these situations, judgment cannot matter.
The frequency of failure is lowest when the judgment is closer to equality (in the first bracket) and highest when it is far from equality. This relationship is significant in a Logit model with session fixed-effects and standard errors clustered at the session level (marginal effect = 0.042, p = 0.02, Column (1) in Table B.3).
The effect of judgement on bargaining outcomes.
| (1) | (2) | |
|---|---|---|
| Failure = 1 | Dist. | |
| Distance judgement | 0.038 ** | 0.380*** |
| (0.010) | (0.043) | |
| Sessions FE | Yes | Yes |
| Controls | Yes | Yes |
| Sessions (Nb clusters) | 24 | 24 |
| Observations | 1265 | 867 |
-
Notes: Model 1 is a Logit model. Model 2 is a Tobit model. Standard errors are clustered at the session level. Controls include a dummy variable indicating the “extreme” condition, period, a categorical variable indicating the number of risk-seekers in the pair, the value of the judgment, a categorical indicating the number of loss-averse in the pair, a categorical variable indicating the number of informed parties and the interactions of these last two variables. +p < 0.10, *p < 0.05, **p < 0.01, ***p < 0.001.
Similarly, agreements are closer to equality when judgments are more equal. This relationship is significant in a Tobit model with session fixed-effects and standard errors clustered at the session level (marginal effect = 0.499, p < 0.001, see Column (2) in Table B.3). Thus, our data are consistent with the classical results that participants exploit their bargaining power, but not to the full extent (see e.g. Anbarci and Feltovich 2018).
B.2 The Effect of Information
In Table B.4, we report the outcomes of some regressions in which the effect of information is estimated across treatments.
The effect of information on bargaining outcomes.
| (1) | (2) | |
|---|---|---|
| Failure = 1 | Dist. | |
| Effect of having 1 participant informed in: | ||
| NoConcil_Uniform | 0.136 | 0.980* |
| (0.123) | (0.011) | |
| Concil_Uniform | 0.132* | 1.034* |
| (0.012) | (0.014) | |
| NoConcil_Extreme | 0.019 | 0.035 |
| (0.675) | (0.875) | |
| Concil_Extreme | 0.098* | 0.503+ |
| (0.037) | (0.068) | |
| Effect of having 2 participant informed in: | ||
| NoConcil_Uniform | 0.027 | 2.627*** |
| (0.832) | (0.000) | |
| Concil_Uniform | 0.041 | 2.294*** |
| (0.663) | (0.000) | |
| NoConcil_Extreme | 0.074+ | 0.727* |
| (0.090) | (0.043) | |
| Concil_Extreme | 0.203*** | 1.431*** |
| (0.000) | (0.000) | |
| Controls | Yes | Yes |
| Sessions (Nb clusters) | 24 | 24 |
| Observations | 1670 | 1184 |
-
Notes: The reference category to compute the marginal effect is “none of the parties is informed”. Model 1 is a Logit model. Model 2 is a Tobit model. Standard errors are clustered at the session level. +p < 0.10, *p < 0.05, **p < 0.01, ***p < 0.001.
Figure B.1 represents the distribution of the agreements, depending on the treatment and the information situations (i.e. whether 0, 1 or 2 parties are informed). A salient pattern is that the equal split is most likely when none of the parties is informed, and becomes less likely as the number of informed individuals increases.
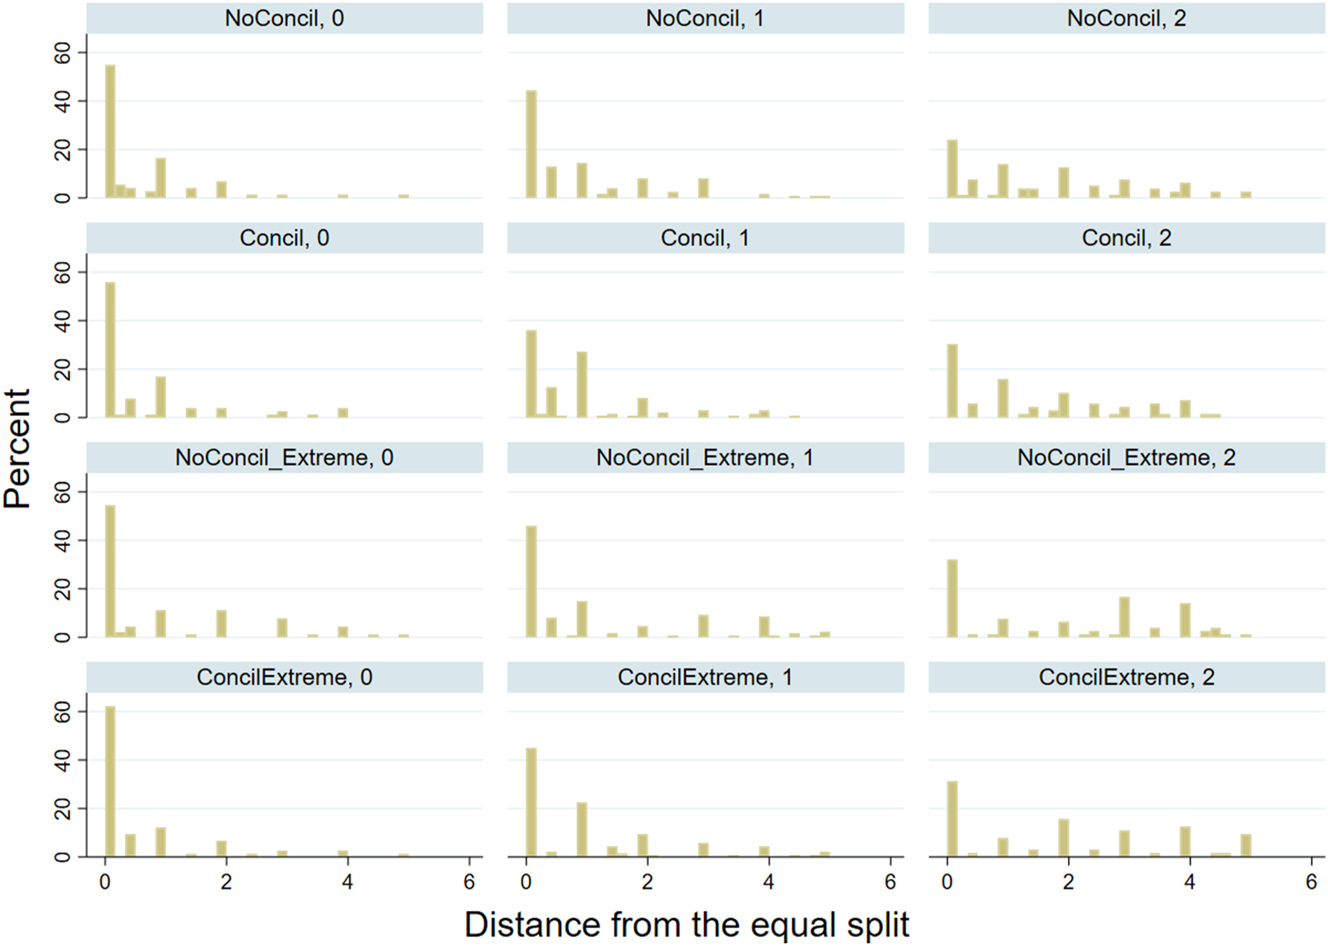
Distribution of the distance from the equal split depending on the treatment and information situation.
This is confirmed by regressions that explain the occurrence of equal splits with respect to the number of informed parties, where treatments and individual characteristics are controlled for and standard errors are clustered at the session level. Table B.5 reports the marginal effects of having 1 or 2 parties informed on the occurrence of the equal split, both marginal effects being negative and highly significant.
Marginal effect of the number of informed parties on the likelihood of an equal-split.
| (1) | |
|---|---|
| Equal split = 1 | |
| Number of informed party = 1 | −0.139*** |
| (0.0296) | |
| Number of informed party = 2 | −0.237*** |
| (0.0386) | |
| Controls | Yes |
| Sessions (Nb clusters) | 24 |
| N | 1670 |
-
t Standard errors clustered at the session level in parentheses. *p < 0.05, **p < 0.01, ***p < 0.001.
C Regressions Omitted from the Main Text
C.1 Support for Result 1
Table C.6 reports the outcomes of regressions supporting Result 1. Columns (1) and (2) report the marginal effects of conciliation on the failure rate over the distribution of judgments. The underlying models are Logit models. Columns (3) to (6) report the marginal effects of conciliation on the nature of agreements: in Columns (3) and (4), the dependent variable is the distance from the equal split; and in Columns (5) and (6) the dependent variable is the distance from the judgement. The underlying models are Tobit models. None of the marginal effects of interest are statistically significant, which confirms the conclusion that conciliation has no effect on the nature of agreements on average. We reproduce the same analyses in Columns (7) to (12), excluding negotiations in which the conciliator was inactive. The results are very similar.
The effect of conciliation on failures/nature of agreements.
| (1) | (2) | (3) | (4) | (5) | (6) | (7) | (8) | (9) | (10) | (11) | (12) | |
|---|---|---|---|---|---|---|---|---|---|---|---|---|
| Failure = 1 | Failure = 1 | Dist. Eq. | Dist. Eq. | Dist. Judg. | Dist. Judg. | Failure = 1 | Failure = 1 | Dist. Eq. | Dist. Eq. | Dist. Judg. | Dist. Judg. | |
| Effect of conciliation for: | ||||||||||||
| Uniform | 0.002 | −0.009 | −0.067 | −0.123 | 0.046 | −0.063 | 0.014 | 0.002 | −0.055 | −0.126 | 0.002 | −0.118 |
| (0.034) | (0.030) | (0.117) | (0.108) | (0.131) | (0.074) | (0.033) | (0.031) | (0.110) | (0.103) | (0.139) | (0.076) | |
| Extreme | 0.020 | 0.020 | −0.160 | −0.143 | 0.156 | 0.152 | 0.056 | 0.053 | −0.039 | −0.058 | 0.120 | 0.152 |
| (0.045) | (0.049) | (0.154) | (0.151) | (0.180) | (0.161) | (0.046) | (0.050) | (0.187) | (0.186) | (0.194) | (0.170) | |
| Observations | 1670 | 1670 | 1184 | 1184 | 1176 | 1176 | 1603 | 1603 | 1119 | 1119 | 1112 | 1112 |
| Controls | No | Yes | No | Yes | No | Yes | No | Yes | No | Yes | No | Yes |
| Clusters (N sessions) | 24 | 24 | 24 | 24 | 24 | 24 | 24 | 24 | 24 | 24 | 24 | 24 |
-
Marginal effects of reported. Columns (1), (2), (7), and (8) are Logit models. Columns (3), (4), (9), and (10) are Tobit models. In Column (7) to (12), we exclude observations in which the conciliator was inactive. Standard errors clustered at the session level in parentheses. Controls include a dummy variable indicating the “extreme” condition, period, a categorical variable indicating the number of risk-seekers in the pair, a categorical indicating the number of loss-averse in the pair, the value of the judgment, a categorical variable indicating the number of informed parties and the interactions of these last two variables. *p < 0.05, **p < 0.01, ***p < 0.001.
C.2 The Effect of Conciliation on the First Offers of the Parties
The effect of conciliation on first offers.
| (1) | (2) | |
|---|---|---|
| Distance first offers | Distance first offers | |
| Marginal effect: | ||
| Conciliation | −0.498+ | |
| (0.260) | ||
| Marginal effect of conciliation for: | ||
| Uniform | −0.431 | |
| (0.300) | ||
| Extreme | −0.561 | |
| (0.424) | ||
| Observations | 1469 | 1469 |
| Clusters (N Session) | 24 | 24 |
| Controls | Yes | Yes |
-
Marginal effects are reported. Columns (1) and (2) are Tobit models. Standard errors are clustered at the session level in parentheses. Controls include a dummy variable indicating the “extreme” condition, period, a categorical variable indicating the number of risk-seekers in the pair, a categorical variable indicating the number of loss-averse in the pair, the value of the judgment, a categorical variable indicating the number of informed parties and the interactions of these last two variables. +p < 0.10, *p < 0.05, **p < 0.01, ***p < 0.001.
D Elicitation of Social Preferences and Classification
To elicit social preference, we adapt the method of Fehr et al. (2023, 2024). In this method, participants make 56 allocation decisions between them and an anonymous recipient. Each allocation decision includes 7 interpersonal allocations, from which the decision maker has to pick one. Based on their decisions, participants are then classified into 3 meaningful social preference types thanks to a classification algorithm: Inequality-averse, Selfish, and Altruist.
We selected a subset of 14 among the 56 allocation decisions used in Fehr et al. (2023, 2024).[35] We chose this subset of allocation decisions because we wanted to keep the experiment short and because Fehr et al. (2023, 2024) found that the choices made in these 14 allocation decisions were robust predictors of participant choices in the remaining decisions. Hence, we deemed that the inclusion of the other allocation decisions would be redundant.
Table D.8 summarizes the 14 different allocation decisions. Each row represents an allocation decision. For each allocation decision, there is one allocation that maximizes the decision maker’s payoff (Allocation Max), one Allocation that minimizes the decision maker’s payoff (Allocation Min), and one allocation that equalizes payoffs (Allocation Equ). Allocation Equ is always the fourth possible allocation, midway between the two extremes Min and Max. In addition, a Slope is reported for each allocation, which is the number of euros the decision maker has to sacrifice to increase the recipient’s payoff by €1. There are 2 intermediate allocations between Allocation Max and Allocation Equ., and two intermediate allocations between Allocation Equ. and Allocation Min, which can be deducted from the fact that, to go from one allocation to the next in a given allocation decision, the decision-maker has to give up a fixed amount.
Allocation decisions in the dictator game.
| Allocation min | Allocation equ | Allocation max | |||||
|---|---|---|---|---|---|---|---|
| Allocation decision | DM | Recipient | DM | Recipient | DM | Recipient | Slope |
| 1 | 4.5 | 7.5 | 6 | 6 | 7.5 | 4.5 | −1 |
| 2 | 7.5 | 10.5 | 9 | 9 | 10.5 | 7.5 | −1 |
| 3 | 4.5 | 7.5 | 7.5 | 7.5 | 10.5 | 7.5 | 0 |
| 4 | 5 | 8 | 7.5 | 7.5 | 10 | 7 | −0.2 |
| 5 | 5.5 | 8.5 | 7.5 | 7.5 | 9.5 | 6.5 | −0.5 |
| 6 | 6 | 9 | 7.5 | 7.5 | 9 | 6 | −1 |
| 7 | 6.5 | 9.5 | 7.5 | 7.5 | 8.5 | 5.5 | −2 |
| 8 | 7 | 10 | 7.5 | 7.5 | 8 | 5 | −5 |
| 9 | 7.5 | 10.5 | 7.5 | 7.5 | 7.5 | 4.5 | −∞ |
| 10 | 7 | 5 | 7.5 | 7.5 | 8 | 10 | 5 |
| 11 | 6.5 | 5.5 | 7.5 | 7.5 | 8.5 | 9.5 | 2 |
| 12 | 6 | 6 | 7.5 | 7.5 | 9 | 9 | 1 |
| 13 | 5.5 | 6.5 | 7.5 | 7.5 | 9.5 | 8.5 | 0.5 |
| 14 | 5 | 7 | 7.5 | 7.5 | 10 | 8 | 0.2 |
As an illustration, Figure D.2 shows the Allocation Decision 1 as presented to the participants. In this scenario, at one extreme, the Allocation Min gives €4.5 to the decision-maker and €7.5 to the recipient. The opposite extreme allocation, the Allocation Max, gives €7.5 to the decision maker and €4.5 to the recipient. The allocation Equ gives both the decision maker and the recipient €6. Given the slope of −1, the decision-maker sacrifices €1 for every €1 increase in the recipient’s payoff.
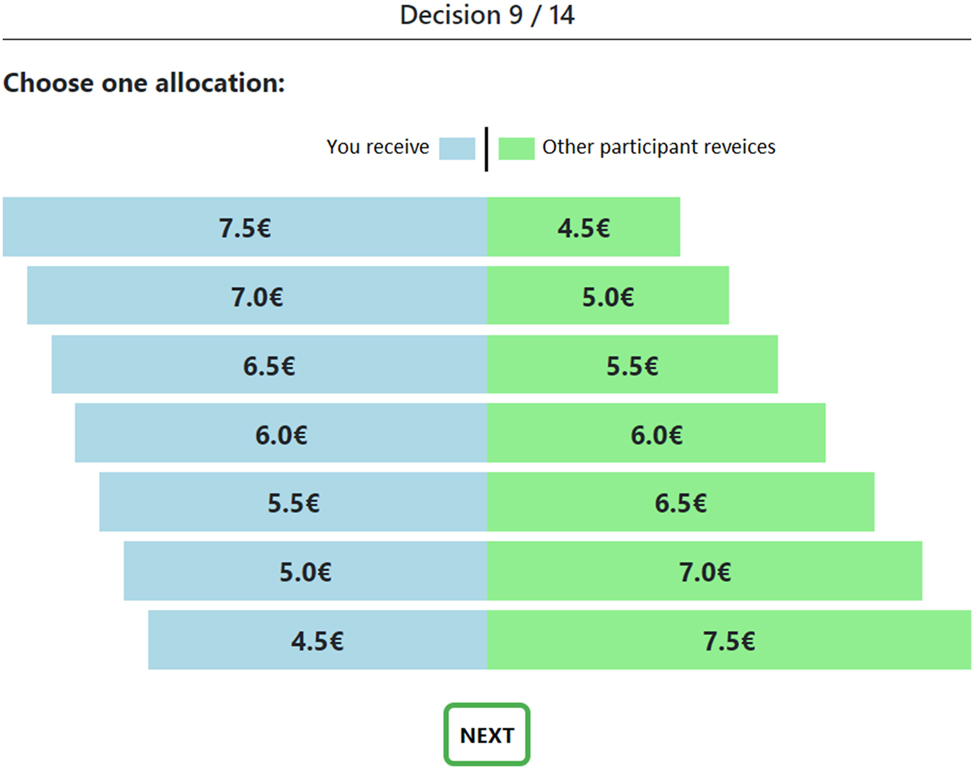
An example of an allocation decision (Allocation decision 1). This is based on Fehr et al. (2024).
Allocation decisions with negative slopes depict situations in which one has to sacrifice some of his/her earnings to increase the recipient’s payoff. For instance, with a slope of −2, the decision maker has to sacrifice €2 to increase the recipient payoff by €1. A positive slope means that the decision-maker can increase both payoffs at the same time, and there is no tension between the decision-maker and the recipient’s payoff. Note that a slope greater than one means that the recipient’s payoff increases more than the decision maker’s. A null (resp −∞) slope means that the recipient (resp. decision maker) payoff is fixed and is not impacted by the choice of the decision maker.
Figure D.3 plots the median choices of participants in the allocation decisions with positive slopes and negative slopes. For the sake of readability, we normalize the choices in the following way to allow for representation: We set choice = 0 when the decision maker chooses Allocation Min, choice = 1 when the decision maker chooses Allocation Max, and choice = 0.5 when the decision maker chooses the payoff equalizing allocation.
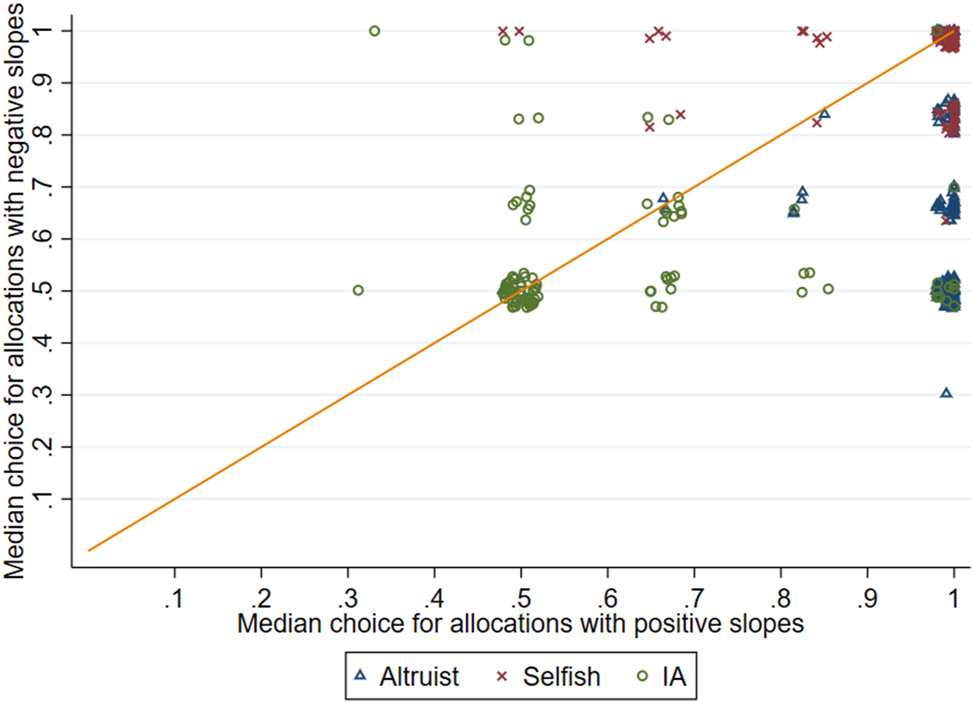
Median choice in the Allocation decision.
Schematically, perfectly selfish decision-makers will always choose the allocation Max, which is located at (1, 1), in the upper-left corner of Figure D.3. Perfectly inequality-averse decision-makers will always choose the payoff equalizing allocation for every decision and would be located at (0.5, 0.5) of Figure D.3. Altruistic decision-makers choose the payoff equalizing allocation in decisions with negative slopes, thus they sacrifice some of their endowment to increase the recipients’ payoff. In contrast with purely inequality-averse individuals, they maximize their payoff for positive slope allocation, i.e. when doing so does not reduce the recipient’s payoff. Thus, their concern for the recipient’s payoff is not mainly driven by inequality aversion.
Of course, the choices of actual decision-makers are less clear-cut. To account for this and to avoid arbitrary classification, we use a K-median algorithm to determine the social preference type of each participant.[36] K-median is a popular and widely used method for clustering, that is, partitioning a dataset into homogeneous groups. This technique attempts to divide a set of N observations into K clusters, where each observation belongs to the cluster with the closest median. We set 3 clusters corresponding to the 3 social preference types elicited in Fehr et al. (2023, 2024). We apply the clustering algorithm to the 14 decisions of the participants. In Figure D.3, the different social preference types are represented by different markers and different colors.
E Suggestions of the Conciliator
E.1 Distribution of the Number of Suggestions
Figure E.4 presents the cumulative distribution of suggestions, separated by treatment. It shows that, in most cases, the conciliator made at least one suggestion. It also shows that in most cases, the conciliator made less than 5 suggestions.
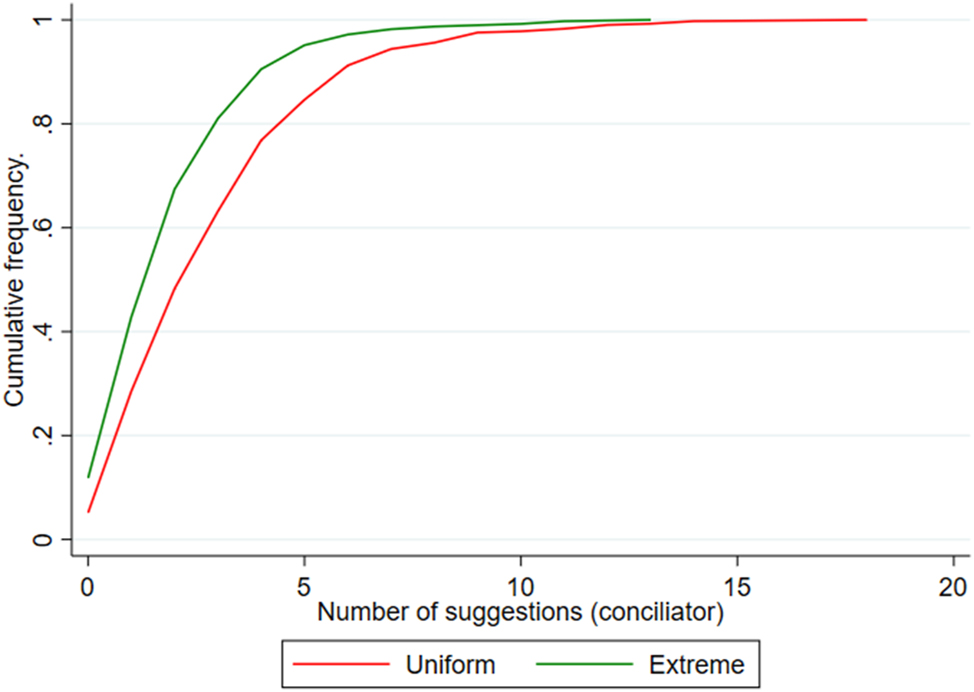
Cumulative distribution of the number of suggestions, by treatment.
We computed for each individual conciliator the number of periods in which they remained inactive. The Table E.9 below gives the distribution of the number of periods of inactivity for each conciliator.
Frequency and percentage of periods in which conciliators made no suggestions.
| Number of periods with no suggestion | Frequency | Percentage | Cumulative percentage |
|---|---|---|---|
| 0 | 40 | 50 % | 50 % |
| 1 | 20 | 25 % | 75 % |
| 2 | 15 | 18.75 % | 93.75 % |
| 3 | 3 | 3.75 % | 97.50 % |
| 4 | 2 | 2.5 % | 100 % |
No conciliator remained inactive for more than 4 periods, and 93.75 % of the conciliators were inactive for 2 or fewer periods.
E.2 First Suggestion of the Conciliators
Figure E.5 plots the suggestions of the conciliator as a function of the judgment. Both variables are expressed as deviation from equality. We only use observations in which the suggestion of the conciliator is the first communication in the chat. We focus on these observations to avoid endogeneity: the suggestions made later by the conciliator may potentially be impacted by the offers made by the parties.
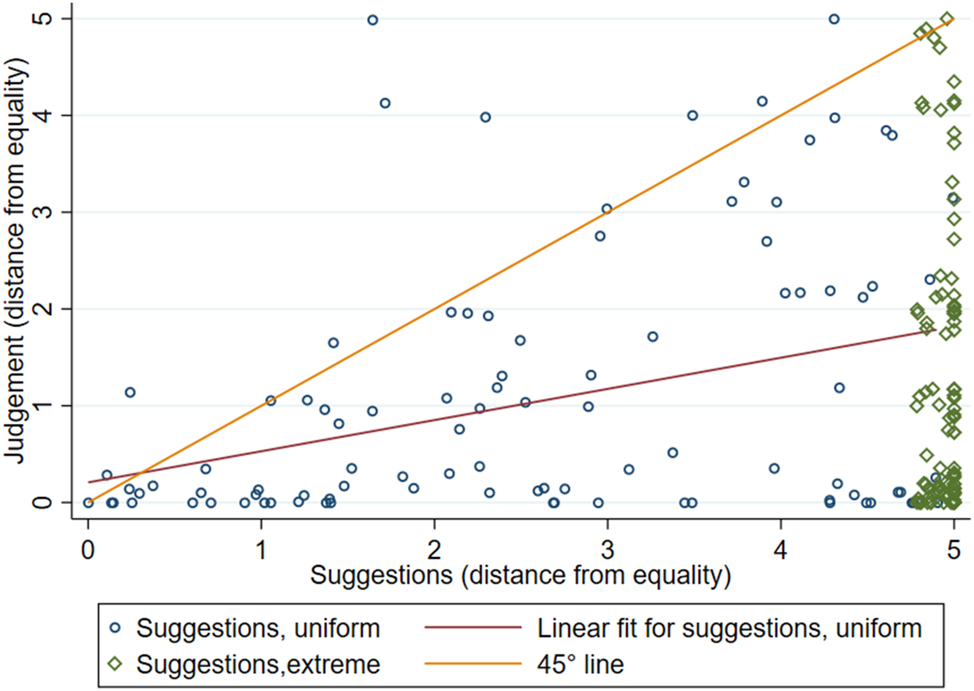
First suggestions of the conciliator as a function of judgment.
Figure E.5 shows a clear positive relation between the judgment and the suggestions of the conciliators. Table E.10 reports the marginal effect of the distance from equality of the judgment on the distance from equality of the first suggestion of the conciliator. The marginal effect is positive (m.e. = 0.46, p = 0.02), significant, but also smaller than 1 (p < 0.001). This suggests that the first suggestions of the conciliators lie between equality and what would prevail in case of failed bargaining.
The effect of judgment on the first suggestion of the conciliator.
| (1) | |
|---|---|
| Suggestion (distance from equality) | |
| Judgment (distance from equality). | 0.467** |
| (0.130) | |
| Controls | Yes |
| Sessions (Nb clusters) | 12 |
| Observations | 201 |
-
Tobit model with standard errors clustered at the session level. *p < 0.05, **p < 0.01, ***p < 0.001.
E.3 The Number of Suggestions Across Periods
See Figure E.6.
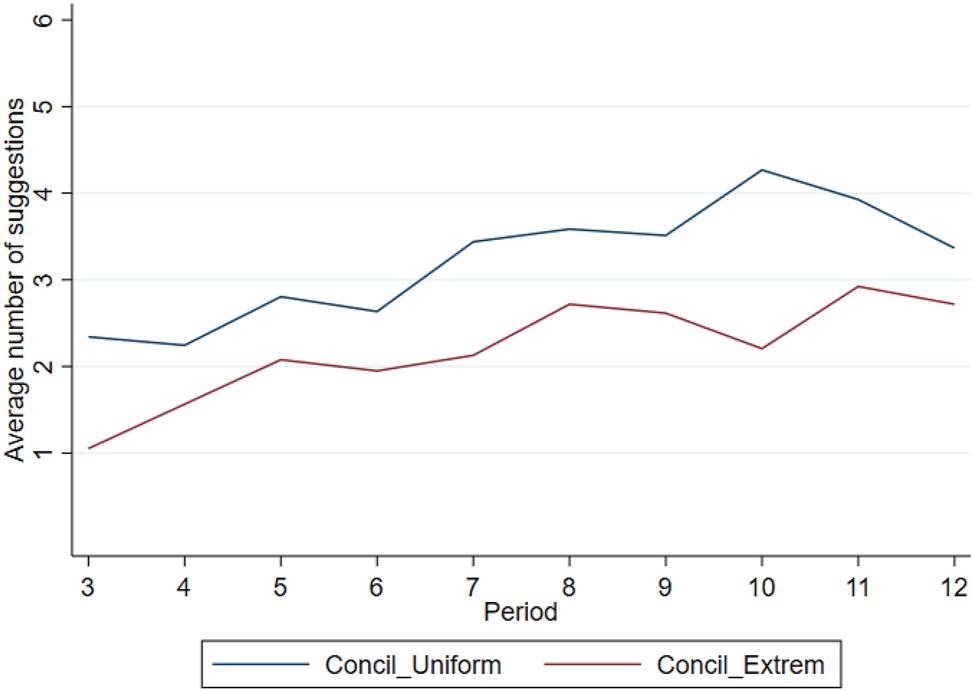
The number of suggestions (from the conciliator) across periods.
F Demographics and Individual Characteristics
F.1 Demographics
Table F.11 reports the demographics of the participants, by experimental condition. The sample is composed of a majority of students and of women. Importantly, no significant differences emerge between treatments, except for the number of participations.
Demographics by treatment.
| % Woman | % student | Age | Monthly expenses (€) | Nb. Experiences | |
|---|---|---|---|---|---|
| NoConcil_Uniform | 0.8 | 1 | 20 | 1582 | 1.7 |
| Concil_Uniform | 0.78 | 0.96 | 21 | 619 | 2.9 |
| NoConcil_Extreme | 0.82 | 0.93 | 21 | 765 | 1.9 |
| Concil_Extreme | 0.71 | 0.95 | 21 | 627 | 1.8 |
| p − value | 0.240 | 0.112 | 0.743 | 0.575 | 0.001 |
-
p-values are from chi-squared tests for Gender and Student status and from Kruskal-Wallis tests for age, monthly expenses and experiences.
F.2 Risk Preferences
We use the method of Eckel and Grossman (2008) to elicit risk preferences. Participants had to choose one lottery in two consecutive sets of five binary lotteries displayed on their screen. The expected payoff of the lotteries ranged from €4 to €6, and variance increased with the expected payoff. Choosing a lottery with a higher expected payoff and variance reveals a higher risk tolerance. The first set is used to elicit risk attitudes in the gain domain since expected payoffs are always positive. The second set elicits risk attitudes in the loss domain. In order to keep the expected payoff equal, for the second set of lotteries participants were endowed with €8. A screenshot of the lottery is presented in Appendix G.
Table F.12 reports the choices of participants in the risk preferences elicitation task. The upper panel reports choices in the gain domain. The bottom panel reports choices in the loss domain. No significant difference emerges between treatments (Chi-squared test: p = 0.931 in the gain domain, and 0.649 in the loss domain).
Loterie choice in the Eckel Grossman risk preference elicitation task.
| Gain domain | |||||
|---|---|---|---|---|---|
| 0 | 1 | 2 | 3 | 4 | |
| NoConcil_Uniform | 25 | 21 | 8 | 8 | 18 |
| Concil_Uniform | 49 | 29 | 13 | 14 | 18 |
| NoConcil_Extreme | 28 | 23 | 12 | 9 | 22 |
| Concil_Extreme | 43 | 27 | 14 | 10 | 23 |
| Loss domain | |||||
| 0 | 1 | 2 | 3 | 4 | |
| NoConcil_Uniform | 19 | 18 | 9 | 11 | 23 |
| Concil_Uniform | 37 | 18 | 13 | 15 | 40 |
| NoConcil_Extreme | 23 | 17 | 6 | 9 | 39 |
| Concil_Extreme | 25 | 21 | 11 | 20 | 40 |
G Screenshots from the Experimental Software
See Figures G.7–G.11.
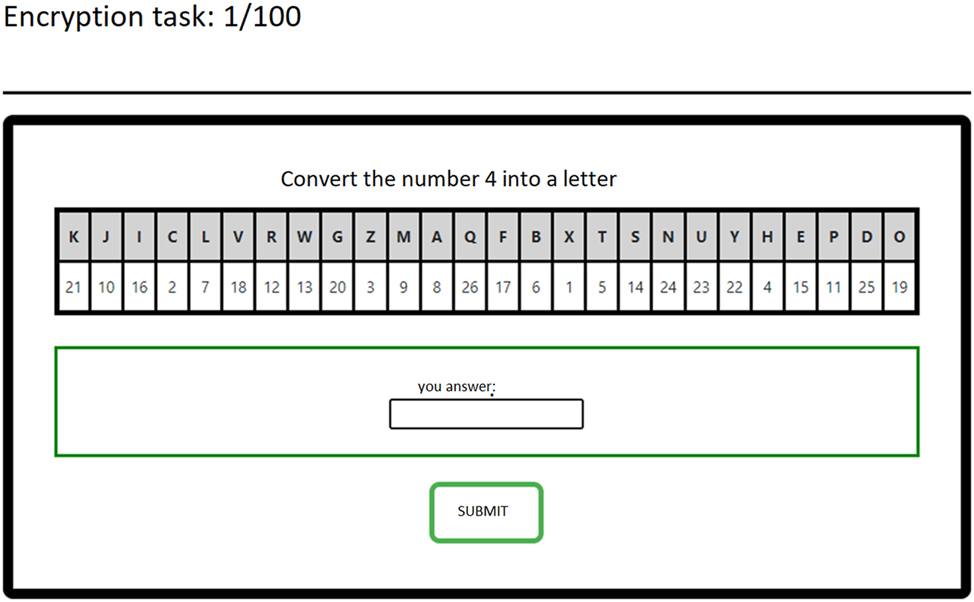
Screenshot of the encryption task.
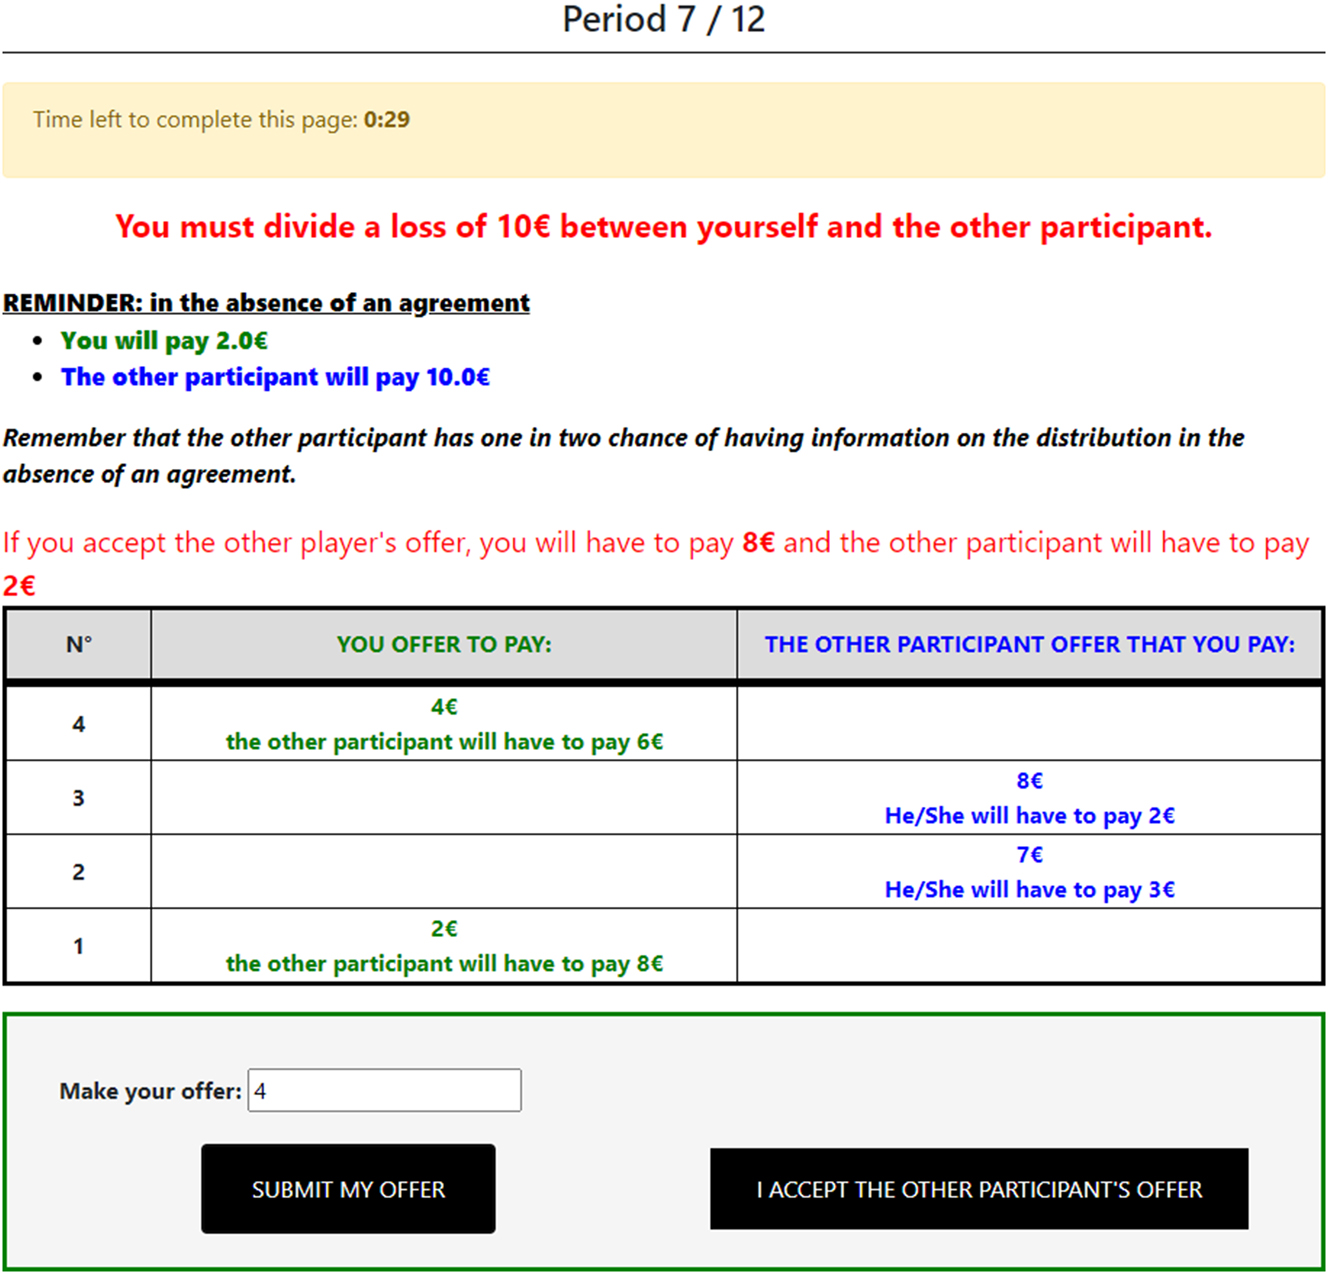
Screenshot of the bargaining interface without a conciliator.
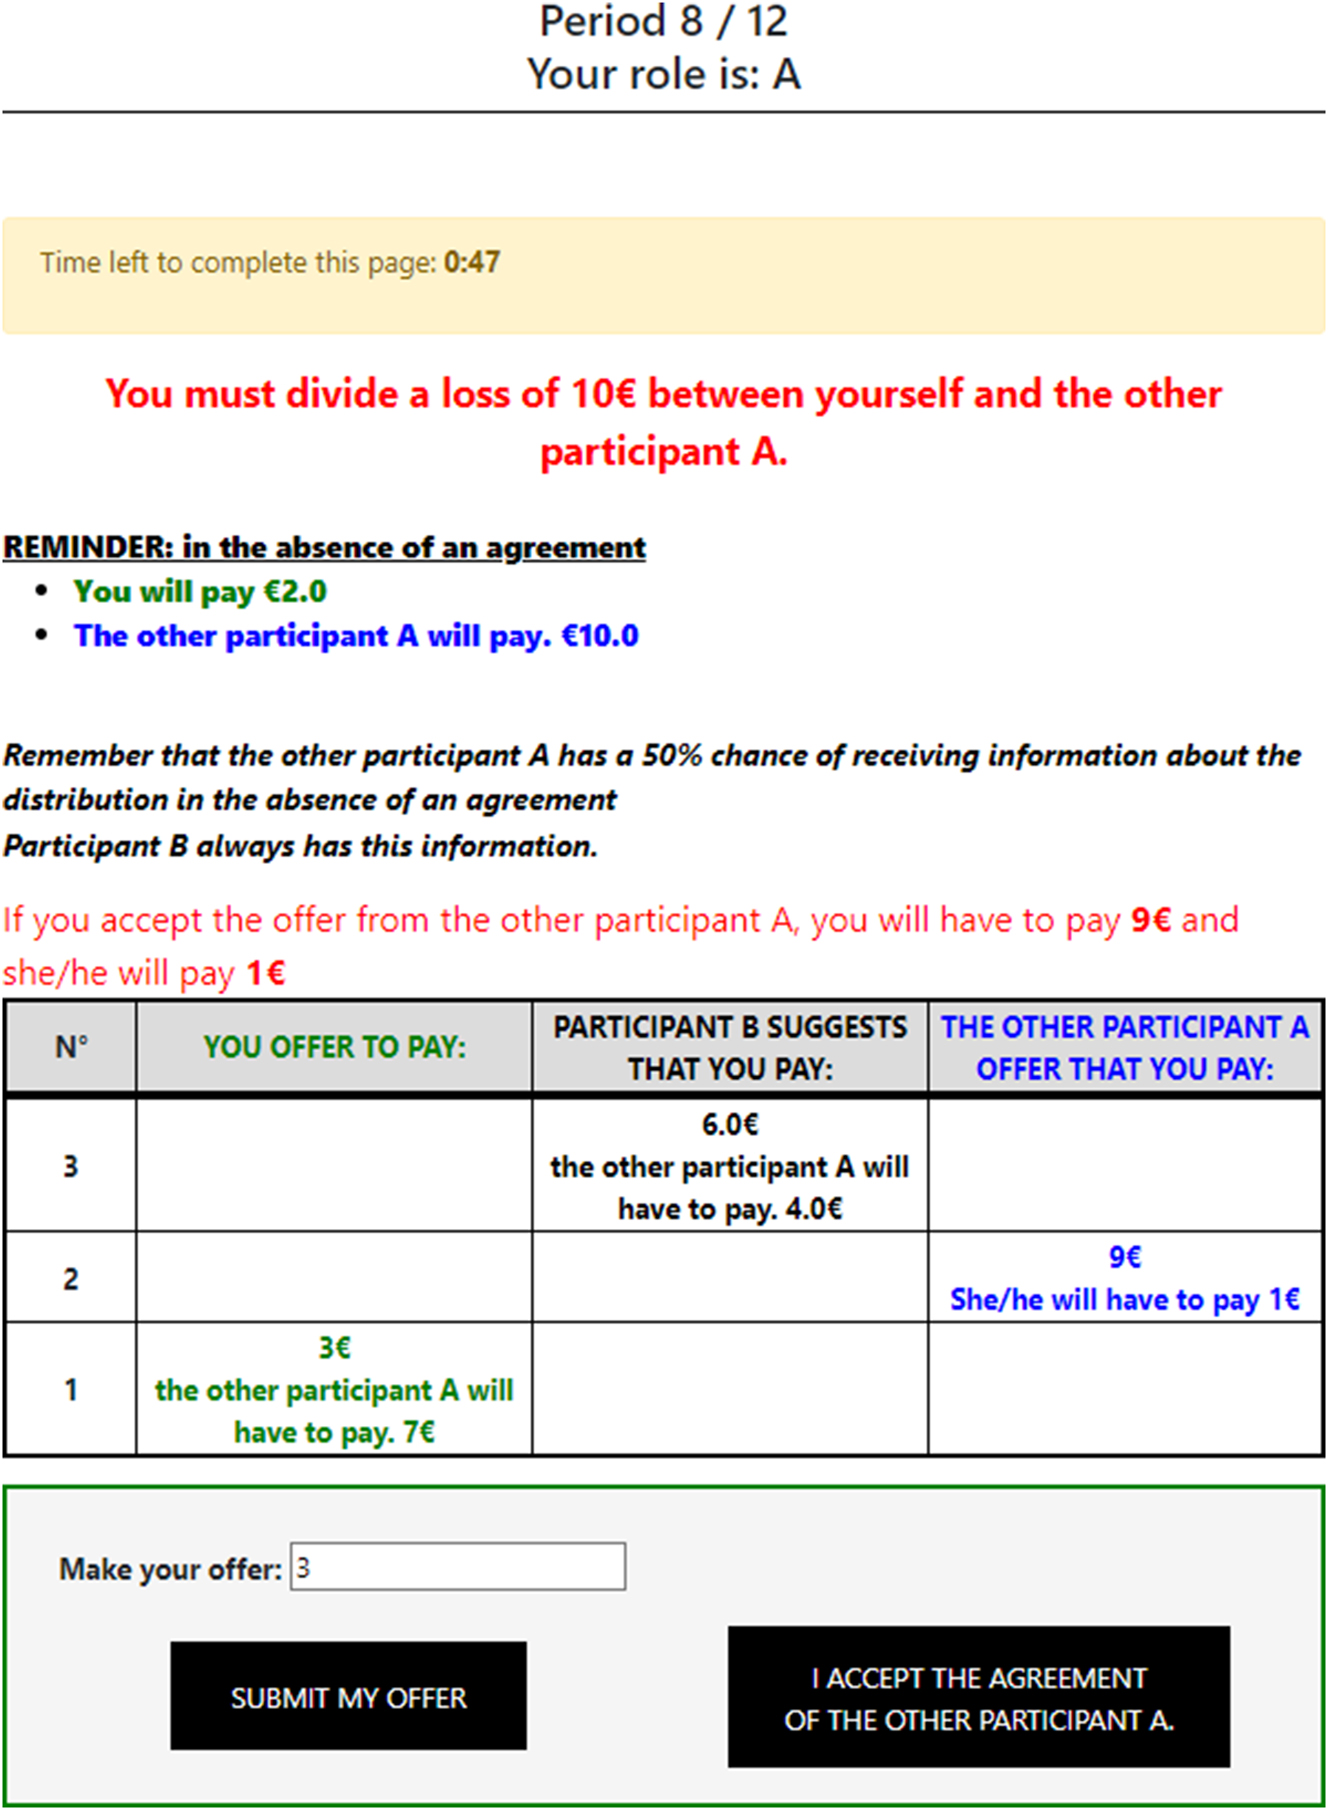
Screenshot of the bargaining interface (with a conciliator, called “participant B”).
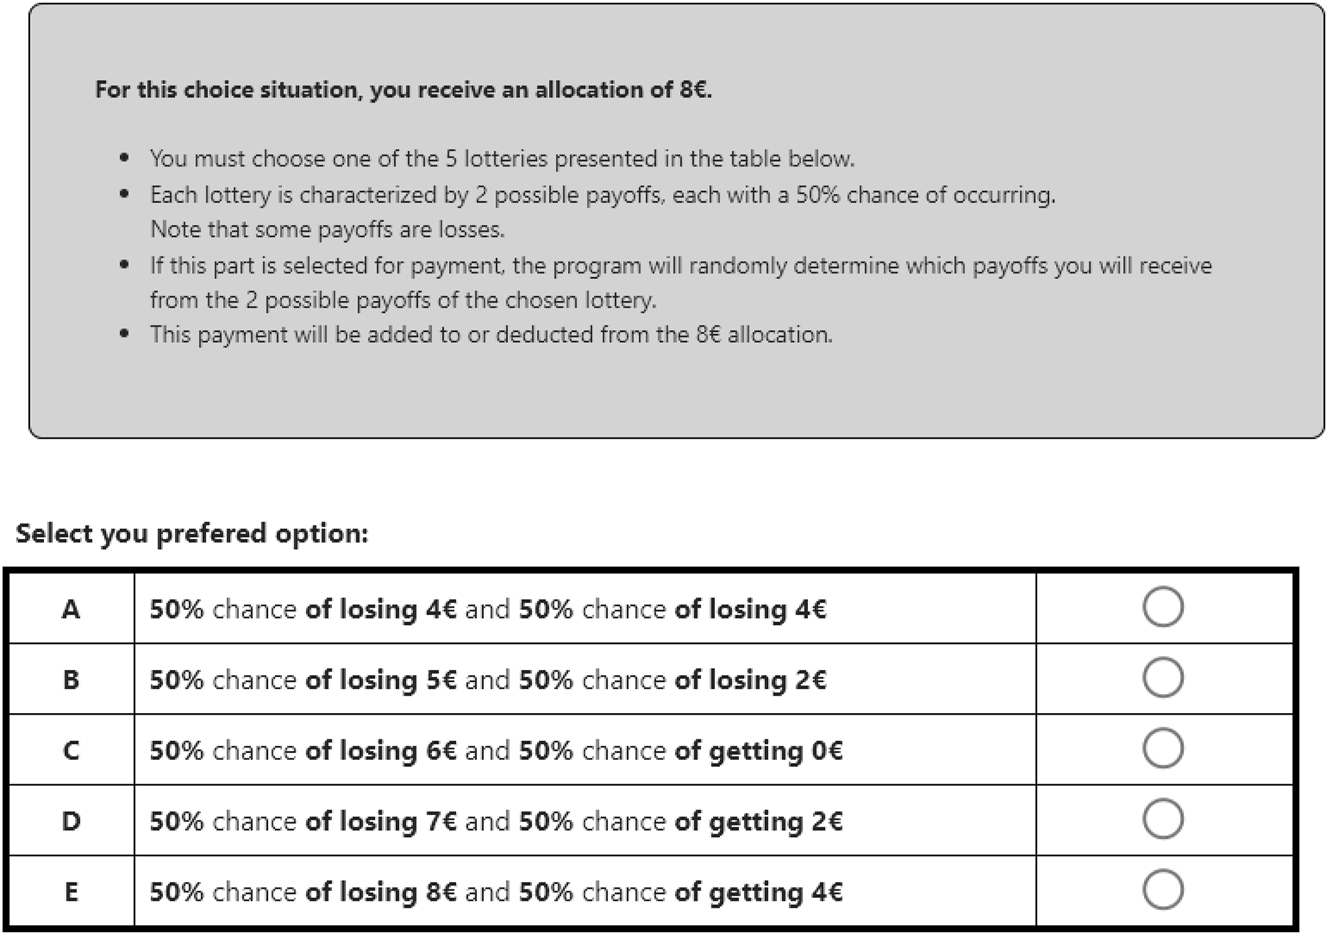
Screenshot of the risk preferences elicitation in the loss domain.
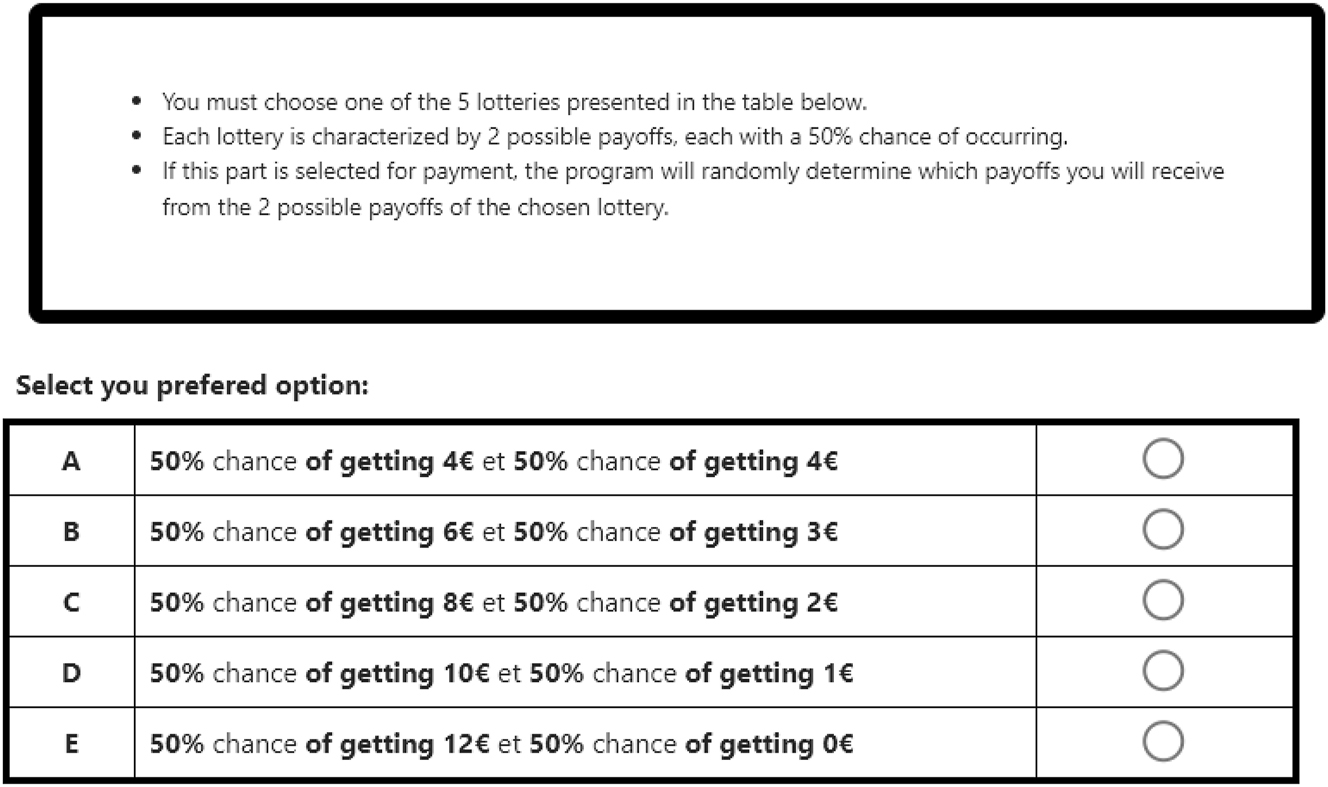
Screenshot of the risk preferences elicitation in the gain domain.
H Instructions Sample
H.1 Part 1 (Common to all Experimental Conditions)
Thank you for participating in this decision-making experiment. You are not allowed to communicate with other participants during the entire session. All your decisions are anonymous. Your decisions can earn you money. Your earnings will be paid to you via Lydia, according to the usual Anthropo-Lab procedure. The experiment is composed of 3 parts. The instructions below describe the content of Part 1. The instructions for Part 2 and Part 3 will be distributed to you at the end of the previous parts. We will read these instructions together. If you have any questions, raise your hand and an experimentalist will come and answer you privately.
Part 1:
In this part, you must perform a conversion task 100 times. The task is to convert a number into a letter of the alphabet. The figure below[37] represents the interface of the conversion task. To find out the letter corresponding to the number displayed, you must refer to a conversion table that will be presented on your screen. After entering the letter corresponding to the number displayed in the “your answer” field, you must validate your answer. If your answer is correct, you will move on to the next task, otherwise, you will have to enter a new letter. With each new number, the conversion table changes. For this game you receive a €15 prize, which is your prize for the next game.
H.2 Part 2
H.2.1 NoConcilUniform
In this section, you will participate in 12 rounds of a game. In each round of the game, you will be randomly and anonymously paired with another participant in the session. You cannot be paired with the same participant in two consecutive rounds. The first two rounds are for training purposes and will have no impact on payment. One of the 10 subsequent rounds (rounds 3–12) will be randomly selected by the program at the end of the experiment to determine your payment.
Game description:
In this game, you must allocate a loss of €10 between you and your co-participant. This loss will be deducted from the endowment that you acquired in the previous part, based on the allocation you agree upon. You have 60 s to reach an agreement. To do this, you use the interface described below.
In the absence of an agreement at the end of the 60 s, the program will select an allocation at random. All possible allocations (in steps of 10 cents) have an equal chance of being selected by the program. In the absence of an agreement, in addition to the loss involved in the allocation selected by the program, you and your co-participant will each lose an additional €1.
Before the start of each round, you have a 1 in 2 chance of being informed of the allocation selected by the program in the event of a disagreement. Your co-participant also has a 1 in 2 chance of being informed. You do not know if your co-participant is informed.
Interface description:
Using the interface shown on the second sheet,[38] you can propose a possible allocation of the loss to your co-participant. To do this, you enter the amount you propose to bear if this allocation is accepted by your co-participant in the dedicated field. You can enter any proposal from €0 to €10, in steps of 10 cents. This proposal is communicated to your co-participant through the table. For example, if you enter “3” in the field, your co-participant is informed that you propose to bear €3 of the loss and that they will bear €7. If you enter “8”, your co-participant is informed that you propose to bear €8 of the loss and they will bear €2.
Symmetrically, your co-participant can also make allocation proposals. You are informed of their proposals through the right column of the table. Note that the sum of the losses borne by you and your co-participant always equals €10.
When you receive a proposal, you can either make an alternative proposal or accept it. To accept a proposal, you click on the “I accept the other participant’s proposal” button. Note that clicking this button means you agree with your co-participant’s last proposal, even if you made a proposal in the meantime. Clicking the agreement button leads to the application of your co-participant’s last proposal and ends the round.
If, at the end of the 60 s, no proposal is accepted, then the allocation selected by the computer is applied. You and your co-participant will also have to pay an additional €1 each.
H.3 ConcilUniform
In this part, you will participate in 12 rounds of a game. Before the first round of the game, you will be assigned a role:
2 out of 3 participants will be “participant A.”
1 out of 3 participants will be “participant B.”
Roles are randomly determined for the entire Part 2. You will be informed of your role on the screen. In each round of this game, you will be randomly and anonymously grouped with two other participants from the session. In each group, there will be two participants A and one participant B. You cannot be grouped with the same participants in two consecutive rounds. The first two rounds serve as practice and will have no impact on payment. One of the next 10 rounds (rounds 3 to 12) will be randomly selected by the program at the end of the experiment to determine your payment.
Game description:
If you are one of the two “participants A”: you must allocate a loss of €10 between you and the other participant A in your group. This loss will be deducted from the endowment you acquired in the previous part, depending on the allocation on which you agree. You have 60 s to reach an agreement. To do so, you use the interface described below. In the absence of an agreement after 60 s, the program will select an allocation at random. All possible allocations (with a step of 10 cents) have an equal chance of being drawn by the program. In the absence of an agreement, in addition to the loss involved in the allocation selected by the program, you and the other participant A in your group each lose an additional €1. Before the start of each round, you have a 1 in 2 chance of being informed of the allocation selected by the program in the event of disagreement. The other participant A also has a 1 in 2 chance of being informed. You do not know if the other participant A is informed. If you are the “participant B”: you can suggest allocations to the 2 participants A in your group. Note that the conclusion of an agreement or the final allocation has no impact on your earnings. You keep the entire €15 earned in the previous part. Participant B is always informed of the allocation randomly selected by the computer program, which is applied in the absence of an agreement between participants A.
Interface description:
You interact through the interface represented on the second sheet.[39] If you are one of the two “participants A”: you enter in the dedicated field the amount that you propose to bear if this distribution is accepted by the other participant A. You can enter any proposal from 0 to €10, in steps of 10 cents. This proposal is communicated to the other two participants in your group through the table. For example, if you enter “3” in the field provided for this purpose, the other two participants in your group are informed that you propose to bear €3 of losses and that the other participant A bears €7 of losses. If you enter “8”, they are informed that you propose to bear €8 of losses and that the other participant A bears €2. Symmetrically, the other participant A can also make proposals for distribution. You are informed of their proposals via the right column of the table. Note that the sum of the losses borne by you and the other participant A is always equal to €10. When you receive a proposal from the other participant A, you can either make an alternative proposal or accept it. To accept a proposal, you click on the button “I accept the proposal of the other participant A”. Note that clicking on this button means you agree with the last proposal of the other participant A, even if, in the meantime, you have made a proposal or the participant B has made a suggestion. Clicking on the agreement button leads to the application of the last proposal of the other participant A and ends the period. Note that it is not possible to accept a suggestion from participant B.
If, at the end of the 60 s, no proposal is accepted, then the split selected by the computer is applied. You and the other participant A will have to pay an additional €1 each.
At the end of the 12 periods, one of the periods from the 3rd to the 12th period will be randomly selected by the program to determine your payment. If you are one of the two “participants A”, your payment will depend on the split you have agreed upon with the other participant A during this selected period. If you are “participant B”, your payment will not depend on the agreements made by the two “Participants A” in your group during this selected period.
References
Anbarci, N., and N. Feltovich. 2013. “How Sensitive Are Bargaining Outcomes to Changes in Disagreement Payoffs?” Experimental Economics 16 (4): 560–96. https://doi.org/10.1007/s10683-013-9352-1.Search in Google Scholar
Anbarci, N., and N. Feltovich. 2018. “How Fully Do People Exploit Their Bargaining Position? the Effects of Bargaining Institution and the 50–50 Norm.” Journal of Economic Behavior Organization 145: 320–34. https://doi.org/10.1016/j.jebo.2017.11.020.Search in Google Scholar
Andreoni, J., and B. D. Bernheim. 2009. “Social Image and the 50-50 Norm: A Theoretical and Experimental Analysis of Audience Effects.” Econometrica 77 (5): 1607–36.10.3982/ECTA7384Search in Google Scholar
Andreoni, J., and J. Miller. 2002. “Giving According to Garp: An Experimental Test of the Consistency of Preferences for Altruism.” Econometrica 70 (2): 737–53. https://doi.org/10.1111/1468-0262.00302.Search in Google Scholar
Ashenfelter, O., and D. E. Bloom. 1984. “Models of Arbitrator Behavior: Theory and Evidence.” The American Economic Review 74 (1): 111–24.10.3386/w1149Search in Google Scholar
Ashenfelter, O., J. Currie, H. S. Farber, and M. Spiegel. 1992. “An Experimental Comparison of Dispute Rates in Alternative Arbitration Systems.” Econometrica 60 (6): 1407–33. https://doi.org/10.2307/2951527.Search in Google Scholar
Babcock, L., and C. M. Landeo. 2004. “Settlement Escrows: An Experimental Study of a Bilateral Bargaining Game.” Journal of Economic Behavior & Organization 53 (3): 401–17.10.1016/S0167-2681(03)00090-8Search in Google Scholar
Babcock, L., and G. Loewenstein. 1997. “Explaining Bargaining Impasse : The Role of Self-Serving Biases.” Journal of Economic Perspectives 11 (1): 109–26. https://doi.org/10.1257/jep.11.1.109.Search in Google Scholar
Babcock, L., G. Loewenstein, S. Issacharoff, and C. Camerer. 1995. “Biased Judgments of Fairness in Bargaining.” American Economic Review 85 (5): 1337–43.Search in Google Scholar
Bartling, B., and U. Fischbacher. 2011. “Shifting the Blame: On Delegation and Responsibility.” The Review of Economic Studies 79 (1): 67–87. https://doi.org/10.1093/restud/rdr023.Search in Google Scholar
Bazerman, M. H., and M. A. Neale. 1993. Negotiating Rationally. Simon and Schuster.Search in Google Scholar
Bebchuk, L. A. 1984. “Litigation and Settlement under Imperfect Information.” The RAND Journal of Economics 15 (3): 404–15. https://doi.org/10.2307/2555448.Search in Google Scholar
Belarouci, M., R. Suchon, N. G. Vaillant, V. Lenglin, M. Bobin, F.-C. Wolff, et al.. 2022. Production et performance de l’activité de conciliation civile en France : approches quantitatives, qualitatives et expérimentales. Institut des Études et de la Recherche sur le Droit et la Justice. Technical report.Search in Google Scholar
Belarouci, M., N. Vaillant, and F.-C. Wolff. 2023. “An Efficiency Analysis of Conciliation Activities in French Courts.” Revue d’économie politique 133 (2): 301–31. https://doi.org/10.3917/redp.332.0301.Search in Google Scholar
Benistant, J., and R. Suchon. 2021. “It Does (Not) Get Better: Reference Income Violation and Altruism.” Journal of Economic Psychology 85: 102380. https://doi.org/10.1016/j.joep.2021.102380.Search in Google Scholar
Berleman, M., and R. Christmann. 2019. “Determinants of In-Court Settlements: Empirical Evidence from a German Trial Court.” Journal of Institutional Economics 15 (1): 143–62. https://doi.org/10.1017/s1744137417000637.Search in Google Scholar
Bolton, G. E., and E. Katok. 1998. “Reinterpreting Arbitration’s Narcotic Effect: An Experimental Study of Learning in Repeated Bargaining.” Games and Economic Behavior 25 (1): 1–33. https://doi.org/10.1006/game.1997.0633.Search in Google Scholar
Boun My, K., N. Lampach, M. Lefebvre, and J. Magnani. 2018. “Effects of Gain-Loss Frames on Advantageous Inequality Aversion.” Journal of the Economic Science Association 4 (2): 99–109. https://doi.org/10.1007/s40881-018-0057-2.Search in Google Scholar
Breitmoser, Y., and J. H. Tan. 2013. “Reference Dependent Altruism in Demand Bargaining.” Journal of Economic Behavior and Organization 92: 127–40. https://doi.org/10.1016/j.jebo.2013.06.001.Search in Google Scholar
Brunin, L., and P. Pirot. 2017. “L’activité des conciliateurs de justice en 2015.” Infostat Justice 148.Search in Google Scholar
Buchan, N., R. Croson, E. Johnson, and G. Wu. 2005. “Gain and Loss Ultimatums.” In Experimental and Behavioral Economics, Volume 13 of Advances in Applied Microeconomics, edited by J. Morgan, 1–23. Leeds: Emerald Group Publishing Limited.10.1016/S0278-0984(05)13001-6Search in Google Scholar
Buchen, C., B. Deffains, and A. Palermo. 2019. “Stigmatization, Liability and Public Enforcement of Law.” Revue d’économie politique 129 (2): 235–59. https://doi.org/10.3917/redp.292.0235.Search in Google Scholar
Camerer, C. F. 2011. Behavioral Game Theory: Experiments in Strategic Interaction. Princeton university press.10.2307/j.ctvcm4j8j.18Search in Google Scholar
Camerer, C. F., G. Nave, and A. Smith. 2019. “Dynamic Unstructured Bargaining with Private Information: Theory, Experiment, and Outcome Prediction via Machine Learning.” Management Science 65 (4): 1867–90. https://doi.org/10.1287/mnsc.2017.2965.Search in Google Scholar
Cardella, E., and C. Kitchens. 2017. “The Impact of Award Uncertainty on Settlement Negotiations.” Experimental Economics 20 (2): 333–67, https://doi.org/10.1007/s10683-016-9486-z.Search in Google Scholar
Casella, A., E. Friedman, and P. A. Manuel. 2020. “Mediating Conflict in the Lab.” National Bureau of Economic Research Working Paper Series VL - No. 28137.10.3386/w28137Search in Google Scholar
Charness, G., U. Gneezy, and M. A. Kuhn. 2012. “Experimental Methods: Between-Subject and Within-Subject Design.” Journal of Economic Behavior Organization 81 (1): 1–8. https://doi.org/10.1016/j.jebo.2011.08.009.Search in Google Scholar
Charness, G., D. Masclet, and M. C. Villeval. 2014. “The Dark Side of Competition for Status.” Management Science 60 (1): 38–55. https://doi.org/10.1287/mnsc.2013.1747.Search in Google Scholar
Chen, D. L., M. Schonger, and C. Wickens. 2016. “oTree-An Open-Source Platform for Laboratory, Online, and Field Experiments.” Journal of Behavioral and Experimental Finance 9 (1): 88–97, https://doi.org/10.1016/j.jbef.2015.12.001.Search in Google Scholar
Cherry, T. L., P. Frykblom, and J. F. Shogren. 2002. “Hardnose the Dictator.” American Economic Review 92 (4): 1218–21. https://doi.org/10.1257/00028280260344740.Search in Google Scholar
Croson, R. 2009. “Experimental Law and Economics.” Annual Review of Law and Social Science 5 (1): 25–44. https://doi.org/10.1146/annurev.lawsocsci.093008.131609.Search in Google Scholar
De Dreu, C. K., P. J. Carnevale, B. J. Emans, and E. Van De Vliert. 1994. “Effects of Gain-Loss Frames in Negotiation: Loss Aversion, Mismatching, and Frame Adoption.” Organizational Behavior and Human Decision Processes 60 (1): 90–107. https://doi.org/10.1006/obhd.1994.1076.Search in Google Scholar
Deck, C., A. Farmer, and D. Z. Zeng. 2007. “Amended Final-Offer Arbitration over an Uncertain Value: A Comparison with CA and FOA.” Experimental Economics 10 (4): 439–54. https://doi.org/10.1007/s10683-006-9146-9.Search in Google Scholar
Deffains, B., D. Demougin, and C. Desrieux. 2017. “Choosing Adr or Litigation.” International Review of Law and Economics 49 (C): 33–40, https://doi.org/10.1016/j.irle.2016.11.002.Search in Google Scholar
Deffains, B., and M. Doriat. 1999. “The Dynamics of Pretrial Negotiation in france: Is There a Deadline Effect in the French Legal System?” International Review of Law and Economics 19 (4): 447–70.10.1016/S0144-8188(99)00023-XSearch in Google Scholar
Deffains, B., R. Espinosa, and C. Fluet. 2019. “Laws and Norms: Experimental Evidence with Liability Rules.” International Review of Law and Economics 60 (C): 105858, https://doi.org/10.1016/j.irle.2019.105858.Search in Google Scholar
Deffains, B., and C. Fluet. 2012. “Legal Liability when Individuals Have Moral Concerns.” The Journal of Law, Economics, and Organization 29 (4): 930–55. https://doi.org/10.1093/jleo/ews002.03Search in Google Scholar
Dickinson, D. L. 2005. “Bargaining Outcomes with Double-Offer Arbitration.” Experimental Economics 8 (2): 145–66. https://doi.org/10.1007/s10683-005-1469-4.Search in Google Scholar
Dickinson, D. L., and L. Hunnicutt. 2005. “Does Fact-Finding Promote Settlement? Theory and a Test.” Economic Inquiry 43 (2): 401–16. https://doi.org/10.1093/ei/cbi027.Search in Google Scholar
Dohmen, T., and A. Falk. 2011. “Performance Pay and Multidimensional Sorting: Productivity, Preferences, and Gender.” American Economic Review 101 (2): 556–90. https://doi.org/10.1257/aer.101.2.556.Search in Google Scholar
Eckel, C. C., and P. J. Grossman. 2008. “Forecasting Risk Attitudes: An Experimental Study Using Actual and Forecast Gamble Choices.” Journal of Economic Behavior and Organization 68 (1): 1–17. https://doi.org/10.1016/j.jebo.2008.04.006.Search in Google Scholar
Eisenberg, T., and C. Lanvers. 2009. “What Is the Settlement Rate and Why Should We Care?” Journal of Empirical Legal Studies 6 (1): 111–46. https://doi.org/10.1111/j.1740-1461.2009.01139.x.Search in Google Scholar
Fanning, J. 2021. “Mediation in Reputational Bargaining.” American Economic Review 111 (8): 2444–72. https://doi.org/10.1257/aer.20191321.Search in Google Scholar
Fehr, Ernst, and Gary Charness. 2025. “Social Preferences: Fundamental Characteristics and Economic Consequences.” Journal of Economic Literature 63 (2): 440–514.10.1257/jel.20241391Search in Google Scholar
Fehr, E., T. Epper, and J. Senn. 2023. The Fundamental Properties, Stability and Predictive Power of Distributional Preferences. Technical Report 439. “The ? symbol indicates that the authors? names are in certified random order”.10.2139/ssrn.4622023Search in Google Scholar
Fehr, Ernst, Thomas Epper, and Julien Senn. 2024. “Social Preferences and Redistributive Politics.” The Review of Economic and Statistics 1–45. https://doi.org/10.1162/rest_a_01511.Search in Google Scholar
Fershtman, C., and U. Gneezy. 2001. “Strategic Delegation: An Experiment.” The RAND Journal of Economics 32 (2): 352–68. https://doi.org/10.2307/2696414.Search in Google Scholar
Fiedler, S., and A. Hillenbrand. 2020. “Gain-loss Framing in Interdependent Choice.” Games and Economic Behavior 121: 232–51. https://doi.org/10.1016/j.geb.2020.02.008.Search in Google Scholar
Fisher, T. 2017. “280Law and Economics of Alternative Dispute Resolution.” In The Oxford Handbook of Law and Economics: Volume 3: Public Law and Legal Institutions. Oxford University Press.10.1093/oxfordhb/9780199684250.013.008Search in Google Scholar
Fréchette, G. R. 2012. “Session-effects in the Laboratory.” Experimental Economics 15 (3): 485–98. https://doi.org/10.1007/s10683-011-9309-1.Search in Google Scholar
Gabuthy, Y., and E. A. Lambert. 2013. “Freedom to Bargain and Disputes’ Resolution.” European Journal of Law and Economics 36 (2): 373–88. https://doi.org/10.1007/s10657-013-9382-3.Search in Google Scholar
Goltsman, M., J. Hörner, G. Pavlov, and F. Squintani. 2009. “Mediation, Arbitration and Negotiation.” Journal of Economic Theory 144 (4): 1397–420. https://doi.org/10.1016/j.jet.2008.08.010.Search in Google Scholar
Gottardi, P., and C. Mezzetti. 2024. “Shuttle Diplomacy.” Journal of Economic Theory 216: 105794. https://doi.org/10.1016/j.jet.2023.105794.Search in Google Scholar
Greiner, B. 2015. “Subject Pool Recruitment Procedures: Organizing Experiments with ORSEE.” Journal of the Economic Science Association 1 (1): 114–25. https://doi.org/10.1007/s40881-015-0004-4.Search in Google Scholar
Guha, B. 2016. “Malicious Litigation.” International Review of Law and Economics 47: 24–32. https://doi.org/10.1016/j.irle.2016.04.001.Search in Google Scholar
Guha, B. 2019. “Malice in Pretrial Negotiations.” International Review of Law and Economics 58: 25–33. https://doi.org/10.1016/j.irle.2019.01.001.Search in Google Scholar
Hamman, J. R., G. Loewenstein, and R. A. Weber. 2010. “Self-interest through Delegation: An Additional Rationale for the Principal-Agent Relationship.” American Economic Review 100 (4): 1826–46. https://doi.org/10.1257/aer.100.4.1826.Search in Google Scholar
Hanna, R., and S.-Y. Wang. 2017. “Dishonesty and Selection into Public Service: Evidence from india.” American Economic Journal: Economic Policy 9 (3): 262–90. https://doi.org/10.1257/pol.20150029.Search in Google Scholar
Hennig-Schmidt, H., B. Irlenbusch, R. M. Rilke, and G. Walkowitz. 2018. “Asymmetric outside Options in Ultimatum Bargaining: A Systematic Analysis.” International Journal of Game Theory 47 (1): 301–29, https://doi.org/10.1007/s00182-017-0588-4.Search in Google Scholar
Hippel, S., and S. Hoeppner. 2019. “Biased Judgements of Fairness in Bargaining: A Replication in the Laboratory.” International Review of Law and Economics 58: 63–74. https://doi.org/10.1016/j.irle.2019.02.001.Search in Google Scholar
Hoffman, E., and M. Spitzer. 1985. “Entitlements, Rights, and Fairness: An Experimental Examination of Subjects’ Concepts of Distributive Justice.” Journal of Legal Studies 14 (2): 259–97. https://doi.org/10.1086/467773.Search in Google Scholar
Hörner, J., M. Morelli, and F. Squintani. 2015. “Mediation and Peace.” The Review of Economic Studies 82 (4): 1483–501. https://doi.org/10.1093/restud/rdv022.Search in Google Scholar
Inspection Générale des Services Judiciaires. 2015. Développement des modes amiables de règlement des différends. Inspection Générale des Services Judiciaires.Search in Google Scholar
Karagözoğlu, E. 2019. “On “Going Unstructured” in Bargaining Experiments.” In The Future of Economic Design, edited by J.-F. Laslier, H. Moulin, R. Sanver, and W. Swicker, 295–304. Springer.10.1007/978-3-030-18050-8_40Search in Google Scholar
Karagözoğlu, E., and M. G. Kocher. 2019. “Bargaining under Time Pressure from Deadlines.” Experimental Economics 22 (2): 419–40. https://doi.org/10.1007/s10683-018-9579-y.Search in Google Scholar
Kessler, D. 1996. “Institutional Causes of Delay in the Settlement of Legal Disputes.” The Journal of Law, Economics, and Organization 12 (2): 432–60. https://doi.org/10.1093/oxfordjournals.jleo.a023370.10Search in Google Scholar
Krawczyk, M., and F. Le Lec. 2010. “‘Give Me a Chance!’ an Experiment in Social Decision under Risk.” Experimental Economics 13 (4): 500–11, https://doi.org/10.1007/s10683-010-9253-5.Search in Google Scholar
Kroll, E. B., R. Morgenstern, T. Neumann, S. Schosser, and B. Vogt. 2014. “Bargaining Power Does Not Matter when Sharing Losses – Experimental Evidence of Equal Split in the Nash Bargaining Game.” Journal of Economic Behavior Organization 108: 261–72. https://doi.org/10.1016/j.jebo.2014.10.009.Search in Google Scholar
Lambert, E. A., E. Peterle, and J. C. Tisserand. 2019. “Pretrial Settlement and Coercion: An Experiment.” International Review of Law and Economics 60: 105849. https://doi.org/10.1016/j.irle.2019.06.002.Search in Google Scholar
Larsen, B., C. H. Lu, and A. L. Zhang. 2021. Intermediaries in Bargaining: Evidence from Business-To-Business Used-Car Inventory Negotiations. National Bureau of Economic Research. Working Paper 29159.10.3386/w29159Search in Google Scholar
Mnookin, R. H., L. Susskind, and P. C. Foster, eds. 1999. Negotiating on Behalf of Others: Advice to Lawyers, Business Executives, Sports Agents, Diplomats, Politicians, and Everybody Else. Thousand Oaks, CA: Sage Publications.10.4135/9781452225524Search in Google Scholar
Neumann, T., S. Kierspel, I. Windrich, R. Berger, and B. Vogt. 2018. “How to Split Gains and Losses? Experimental Evidence of Dictator and Ultimatum Games.” Games 9 (4). https://doi.org/10.3390/g9040078.Search in Google Scholar
Neumann, T., S. Schosser, and B. Vogt. 2017. “Ultimatum Bargaining over Losses and Gains – an Experimental Comparison.” Social Science Research 67: 49–58. https://doi.org/10.1016/j.ssresearch.2017.08.009.Search in Google Scholar
Page, L., and Y. Engler. 2021. “Driving a Hard Bargain Is a Balancing Act: How Social Preferences Constrain the Negotiation Process.” Theory and Decision 93 (1): 7–36. https://doi.org/10.1007/s11238-021-09835-y.Search in Google Scholar
Pecorino, P., and M. Van Boening. 2001. “Bargaining and Information: An Empirical Analysis of a Multistage Arbitration Game.” Journal of Labor Economics 19 (4): 922–48. https://doi.org/10.1086/322825.Search in Google Scholar
Pecorino, P., and M. Van Boening. 2014. “Bargaining with Asymmetric Dispute Costs.” Review of Law Economics 10 (1): 31–58. https://doi.org/10.1515/rle-2013-0030.Search in Google Scholar
Reinganum, J. F., and L. L. Wilde. 1986. “Settlement, Litigation, and the Allocation of Litigation Costs.” The RAND Journal of Economics 17 (4): 557–66. https://doi.org/10.2307/2555481.Search in Google Scholar
Roth, A. E., J. K. Murnighan, and F. Schoumaker. 1988. “The Deadline Effect in Bargaining: Some Experimental Evidence.” The American Economic Review 78 (4): 806–23.Search in Google Scholar
Sanfey, A. G., J. K. Rilling, J. A. Aronson, L. E. Nystrom, and J. D. Cohen. 2003. “The Neural Basis of Economic Decision-Making in the Ultimatum Game.” Science 300 (5626): 1755–8. https://doi.org/10.1126/science.1082976.Search in Google Scholar
Schotter, A., W. Zheng, and B. Snyder. 2000. “Bargaining through Agents: An Experimental Study of Delegation and Commitment.” Games and Economic Behavior 30 (2): 248–92. https://doi.org/10.1006/game.1999.0728.Search in Google Scholar
Shavell, S. 1982. “Suit, Settlement, and Trial: A Theoretical Analysis under Alternative Methods for the Allocation of Legal Costs.” The Journal of Legal Studies 11 (1): 55–81. https://doi.org/10.1086/467692.Search in Google Scholar
Shavell, S. 1995. “Alternative Dispute Resolution: An Economic Analysis.” The Journal of Legal Studies 24 (1): 1–28. https://doi.org/10.1086/467950.Search in Google Scholar
Spier, K. E. 1992. “The Dynamics of Pretrial Negotiation.” The Review of Economic Studies 59 (1): 93–108. https://doi.org/10.2307/2297927.Search in Google Scholar
Suchon, R., and D. Houser. 2022. “Image Spillovers in Groups and Misreporting.” Journal of Economic Behavior Organization 198: 302–14. https://doi.org/10.1016/j.jebo.2022.04.007.Search in Google Scholar
Sullivan, S. P. 2016. “Why Wait to Settle? an Experimental Test of the Asymmetric-Information Hypothesis.” The Journal of Law Economics 59 (3): 497–525. https://doi.org/10.1086/689704.Search in Google Scholar
Sutan, A., and R. Vranceanu. 2016. “Lying about Delegation.” Journal of Economic Behavior & Organization 121: 29–40. https://doi.org/10.1016/j.jebo.2015.10.023.Search in Google Scholar
van de Ven, J., and M. C. Villeval. 2015. “Dishonesty under Scrutiny.” Journal of the Economic Science Association 1 (1): 86–99. https://doi.org/10.1007/s40881-015-0002-6.Search in Google Scholar
© 2025 Walter de Gruyter GmbH, Berlin/Boston
Articles in the same Issue
- Frontmatter
- Articles
- The Impact of Online Dispute Resolution on the Judicial Outcomes in India
- Legal Compliance and Detection Avoidance: Results on the Impact of Different Law-Enforcement Designs
- Women in Piracy. Experimental Perspectives on Copyright Infringement
- Is Investment in Prevention Correlated with Insurance Fraud? Theory and Experiment
- Bias, Trust, and Trustworthiness: An Experimental Study of Post Justice System Outcomes
- Do Sanctions or Moral Costs Prevent the Formation of Cartel Agreements?
- Efficiency and Distributional Fairness in a Bankruptcy Procedure: A Laboratory Experiment
- Soft Regulation for Financial Advisors
- Conciliation, Social Preferences, and Pre-Trial Settlement: A Laboratory Experiment
- The Impact of Tax Culture on Tax Rate Structure Preferences: Results from a Vignette Study with Migrants and Non-Migrants in Germany
- Perceptions of Justice: Assessing the Perceived Effectiveness of Punishments by Artificial Intelligence versus Human Judges
- Judged by Robots: Preferences and Perceived Fairness of Algorithmic versus Human Punishments
- The Hidden Costs of Whistleblower Protection
- The Missing Window of Opportunity and Quasi-Experimental Effects of Institutional Integration: Evidence from Ukraine