Reactive nitrogen compounds and their influence on human health: an overview
-
Rolf Nieder
 and
Dinesh K. Benbi
and
Dinesh K. Benbi

Abstract
Nitrogen (N) is a critical component of food security, economy and planetary health. Human production of reactive nitrogen (Nr) via Haber-Bosch process and cultivation-induced biological N2 fixation (BNF) has doubled global N cycling over the last century. The most important beneficial effect of Nr is augmenting global food supplies due to increased crop yields. However, increased circulation of Nr in the environment is responsible for serious human health effects such as methemoglobinemia (“blue baby syndrome”) and eutrophication of coastal and inland waters. Furthermore, ammonia (NH3) emission mainly from farming and animal husbandary impacts not only human health causing chronic lung disease, inflammation of human airways and irritation of eyes, sinuses and skin but is also involved in the formation of secondary particulate matter (PM) that plays a critical role in environment and human health. Nr also affects human health via global warming, depletion of stratospheric ozone layer resulting in greater intensity of ultra violet B rays (UVB) on the Earth’s surface, and creation of ground-level ozone (through reaction of NO2 with O2). The consequential indirect human health effects of Nr include the spread of vector-borne pathogens, increased incidence of skin cancer, development of cataracts, and serious respiratory diseases, besides land degradation. Evidently, the strategies to reduce Nr and mitigate adverse environmental and human health impacts include plugging pathways of nitrogen transport and loss through runoff, leaching and emissions of NH3, nitrogen oxides (NO x ), and other N compounds; improving fertilizer N use efficiency; reducing regional disparity in access to N fertilizers; enhancing BNF to decrease dependence on chemical fertilizers; replacing animal-based proteins with plant-based proteins; adopting improved methods of livestock raising and manure management; reducing air pollution and secondary PM formation; and subjecting industrial and vehicular NO x emission to pollution control laws. Strategic implementation of all these presents a major challenge across the fields of agriculture, ecology and public health. Recent observations on the reduction of air pollution in the COVID-19 lockdown period in several world regions provide an insight into the achievability of long-term air quality improvement. In this review, we focus on complex relationships between Nr and human health, highlighting a wide range of beneficial and detrimental effects.
Introduction
Nitrogen (N), an essential element of life, is the fourth most abundant element in biomass and a participant in environmental redox chemistry. Most N in the atmosphere exists as N2 gas. In this form it is not available to most biota on earth. When N2’s bond is broken, N becomes reactive and occurs in various forms. This diverse pool of N is defined as “reactive N” (Nr) which includes all biologically, radiatively, and photochemically active forms of the element [1]. Examples include dissolved NO3 − and NH4 + which are the major forms taken up by biota, and the gases NH3, NO x (NO and NO2) and N2O [1]. These forms of N can move readily among the biosphere, the hydrosphere and the atmosphere, and can alter the chemistry of these systems. The rate at which N2 is transformed into biologically available forms is vital for the functioning of terrestrial, freshwater and marine ecosystems [2]. Nr is a constituent of organic molecules such as amino acids, proteins, chlorophyll, hemoglobin, enzymes, nucleic acids (DNA and RNA), humic acids and others. Therefore, supply of Nr is essential for all life forms. Reactive N can be used by living organisms and provides both beneficial and harmful effects. Adequate amounts of digestible N promote human physiological health throughout the lifetime. The availability of N also has profound implications for the problem of anthropogenic carbon (C), as N is a major factor in determining the amount of atmospheric CO2 naturally sequestered through production of biomass [3]. In pre-industrial agriculture, N was the most yield-limiting nutrient.
Increases in N supply have been exploited in modern agriculture for yield gains and to produce food for the growing global human population [4]. In absence of human influences, biological N2 fixation (BNF) and the production of NO x by lightning are the only sources of new Nr in the environment. A review by [5] provides an estimate of annual pre-industrial BNF in terrestrial ecosystems of 58 Tg N, within a range of 40–100 Tg. Global BNF in croplands is estimated at about 43 Tg N year−1, with a range from 30 to 51 Tg N year−1, based on the ranges of N2 fixation yields [6]. This estimate includes leguminous crops and N2 fixation by cyanobacteria associated with the cultivation of rice and sugarcane, but does not include legumes in pasturelands or savannas used for grazing. Lightning fixation of N may amount to additional 5 Tg N year−1 [7].
Humans have dramatically increased the rate of reactive N cycling, in particular via mineral N fertilizer production due to the commercialization of the Haber-Bosch process and cultivation of N2–fixing crops for increasing crop productivity, as well as by fossil fuel combustion [8]. Synthetic N fertilizer usage since the beginning of the 20th century grew to about 12 Tg N year−1 in 1960, and thereafter it has grown almost tenfold to 110 Tg N year−1 in 2013 [9]. In summary, industrial N fertilizer production and cultivation-induced N2 fixation sums up to about 150 Tg year−1 [10] indicating that cycling of reactive N due to these activities has more than doubled in the last century [11].
Emissions of NO x from combustion processes also constitute a source of reactive N. These emissions have increased from about 5.8 Tg N year−1 in 1910 to approximately 38 Tg N year−1 in 2010. Since the 1990s, NO x emission sources have been subject to pollution controls in the USA and Europe, resulting in substantial emission reductions. However, emissions continue to increase in the developing world and emerging economies, especially in China [12]. The higher use of synthetic fertilizer, increased cultivation of N2-fixing crops, and elevated emissions of NO x all contribute to rise in the overall level of Nr in the environment. The total of these three sources for 2014 was 190 Tg N year−1, with a plausible range from 160 to 210 Tg N year−1 [9].
Humans currently produce as much biologically available N as all natural pathways and this may grow by a further 65% by 2050 [13]. Since 1960, global N use efficiency in crop production (portion of N that is converted into harvest products) has declined from ∼68 to ∼47% [14]. Consequently, more than half of the N used for crop production is lost to the environment. Nitrogen efficiency in livestock production is even lower. For example, cattle production per unit area produces 2–10 times less protein in meat and milk compared to cereal grains and 20-fold less compared to legumes such as soybeans [15].
Much of the developed world has easy access to N fertilizers to achieve food security. In contrast, many developing nations still lack access to adequate nitrogen supplies [4]. This disparity is most pronounced in sub-Saharan Africa, parts of Asia and Latin America where nitrogen is mined from diminishing soil pools to grow food [16, 17]. In line with this, the response of agricultural systems to increased N fertilization in different world regions has developed differently. For example, N losses (greatly) exceed 50 kg N ha−1 year−1 in most of Europe, the Middle East, the USA and Central America, India and China, while they remain on average (far) below 25 kg N ha−1 year−1 in most sub-Saharan Africa and some Former Soviet Union countries [14, 18]. Nitrogen is transported and lost to the environment through runoff, leaching to groundwater, and emissions of ammonia (NH3), nitrogen oxides (NO x ), and other N compounds [19, 20].
Reactive N is responsible for various kinds of environmental damages such as eutrophication and oxygen depletion in water bodies, change and loss of biodiversity, acidification of waters and soils, coral reef degradation, contribution to particulate matter (PM) and ozone (O3) formation (ground level) and depletion (stratosphere), and global warming. All of these processes can cause serious direct or indirect human health effects [21]. For instance, acidification can lead to enhanced mobility of metals in soil [22], which may lead to harmful effects on humans. Lockdown measures due to COVID-19 during the first quarter of 2020 applied in many countries has significantly reduced air pollution [23], but the effect may be only temporary.
Eutrophication, particularly due to enrichment of coastal and inland waters with nitrogen causes fish kills and algal blooms, the latter being potentially toxic to humans [24, 25]. All of these environmental effects are widespread and worsening. Human additions of N to the environment can also drive a range of ecological changes including the dynamics of some human diseases. For example, there is some evidence that abundance and distribution of the mosquito hosts of malaria, West Nile virus, and several types of Vibrio cholerae, causing cholera disease, may be affected by changes in N availability [26]. Several studies also indicate that there is a relationship between the spread of vector-borne diseases and climate change [21].
Human needs and supplies of N
Of all essential nutrients, N is required in the largest amount and is often the limiting nutrient. The element is essential for synthesis of amino acids, proteins, peptides, enzymes, DNA and RNA, growth hormones, neurotransmitters and low-molecular weight substances (e.g. glutathione, creatine, nitric oxide, dopamine, serotonin) [21, 27]. Amino acids are essential for health, growth, development, reproduction, lactation and survival of organisms. On average, amino acids contain 16% N. Dietary glutamate, glutamine and aspartate are major metabolic fuels for the small intestine in the fed state, whereas glutamine is almost the only source of energy in the arterial blood in the post-absorptive state [27]. Glutamine also provides about 50 and 35% of ATP in lymphocytes and macrophages, respectively, to sustain immune responses [27]. The human metabolism is able to synthesize 11 of 20 proteinogenic amino acids. The other nine must be obtained through dietary intake. Essential amino acids include histidine, isoleucine, leucine, lysine, methionine, phenylanaline, threonine, tryptophane and valine. Histidine is essential for the growing children but not for adults. The body needs to replace protein losses caused by breakdown of the compounds, excretions of N in urine, feces and sweat, shedding of skin and cutting of hair and nails [28]. The relative protein demand peaks in infancy when both tissue synthesis and protein breakdown rates are high [29, 30]. The daily protein needs of an adult amount to 0.83 g kg−1 body weight, corresponding to ∼50–70 g protein capita−1 day−1 (Table 1).
Human protein requirements [29].
| Group | Age, years | Dietary requirements, g kg−1 day−1 |
|---|---|---|
| Infants | 0.3–0.5 | 1.31 |
| 0.5–1 | 1.14 | |
| Children | 1–3 | 1.02 |
| 4–8 | 0.92 | |
| Adolescents | 9–13 | 0.90 |
| 14–18 | 0.86 | |
| Adults | ≥19 | 0.83 |
Daily adult protein needs change with the degree of physical activity [27]. Dietary intake of 1.0, 1.3 and 1.6 g protein per kg body weight day−1 is recommended for individuals with minimal, moderate, and intense physical activity, respectively [27]. The amino acids or proteins that cannot be synthesized by human body may be either obtained directly from plants or indirectly through consumption of animal products. Currently, plant- and animal-based foods contribute ∼65 and 35% of protein in human diet worldwide (in North America: 32 and 68%, respectively) [31]. However, the production of animal protein has greater environmental footprint as the conversion efficiency for synthesizing human digestible proteins from forages and feedgrains is low, ranging between 5 and 60% [21]. Shifting consumption from animal-based to plant-based proteins can help reduce environmental and the consequential human health impacts. Since the plant sources are generally deficient in some essential amino acids such as lysine, tryptophan, or methionine, it is important to combine different plant protein sources such as cereals and legumes to achieve a balance and avoid deficiencies. A recent study showed that soybean is the most important source of plant-based lysine and can be considered as a substitute for animal-based protein [32]. Though proper combinations of legumes with cereals in the human diet can sufficiently provide most amino acids, yet the availability of legumes for human nutrition is limited in many parts of the world, where these foods are not produced [27]. Despite livestock (meat and milk) production requiring disproportionately high nitrogen, water and land resources, elimination of animal sources from the diet, especially in developing regions where micronutrient (e.g. iron and zinc) and vitamin A and B-complex vitamins deficiency is widespread, is not recommended [33].
Causes of regional malnutrition
Mineral fertilizers have led to a tremendous increase in world food production from the 1960s to the 2000s [8, 26]. Despite large population increases over the same time period, starvation and malnutrition have declined in many regions [30], though these are still widespread in some regions, especially in sub-Saharan Africa, parts of Asia and Latin America. In poor countries with substantial malnutrition problems, increased N fertilizer use can considerably reduce malnutrition [34]. However, synthetic N fertilizer use is unevenly distributed over the globe with low consumption in Africa compared to countries in Asia (Table 2).
Fertilizer N use per unit of cropland during 2000 and 2018 in different regions of world [35].
| Region/Country | Fertilizer N use, kg ha−1 during year | |
|---|---|---|
| 2000 | 2018 | |
| Africa | 11.0 | 16.2 |
| Eastern Africa | 6.1 | 13.8 |
| Northern Africa | 32.5 | 38.8 |
| Middle Africa | 1.2 | 2.9 |
| Southern Africa | 27.3 | 37.9 |
| Western Africa | 2.5 | 8.0 |
| Americas | 47.3 | 65.2 |
| Central America | 52.9 | 53.5 |
| Northern America | 56.0 | 72.3 |
| South America | 29.4 | 59.2 |
| USA | 60.1 | 72.6 |
| Asia | 84.3 | 108.3 |
| Eastern Asia | 167.0 | 202.3 |
| Central Asia | 18.0 | 23.5 |
| Southern Asia | 63.8 | 97.3 |
| South-eastern Asia | 57.9 | 64.6 |
| Western Asia | 48.9 | 51.6 |
| India | 64.2 | 104.1 |
| China | 170.8 | 208.6 |
| Australia | 40.0 | 45.1 |
| Europe | 41.6 | 49.6 |
| Eastern Europe | 17.2 | 30.8 |
| Northern Europe | 104.7 | 105.3 |
| Western Europe | 129.6 | 116.3 |
| Southern Europe | 62.3 | 61.3 |
| Russian Federation | 7.6 | 12.5 |
| World | 54.4 | 69.7 |
In Africa, the N fertilizer use increased slowly during the past two decades, although cropland expansion widely occurred. In sub-Saharan (Eastern, Middle, Western) Africa most areas still received less than 15 kg N ha−1 in 2018. In most of Europe, agricultural N fertilizer use rate peaked in the 1970s and decreased slightly during the last 2 decades, while the USA still demonstrate a slight increase of agricultural N input. Large areas of cropland in China stand out due to extremely high N fertilizer input (on average ∼200 kg N ha−1 per crop in 2018; in eastern and southern China even >300 kg N ha−1 in 2018), with still increasing trend [36]. There is also a strongly increasing trend in N fertilizer use in India up to now. Parts of South America also experienced a rapid increase in N fertilizer use rate during the past 20 years, particularly agricultural areas of Brazil, with N input reaching levels close to those of the USA. Australia demonstrates a relatively low level of agricultural N input (less than 50 kg N ha−1 in 2018). N fertilizer use in Russia is still low due to the breakup of the Soviet Union and conversion to market economies [36].
Distinct relationships exist between N fertilizer availability and protein supply for the population of different world regions [16]. Affluent countries (Europe, North America) currently consume about 35% of all N fertilizers. Some countries use more than 60% of all N fertilizers (China alone about 33%) [37]. In these countries, N application could be reduced significantly and adequate nutrition would still be available. Despite excessive N application in agriculture, the supply of dietary protein remains inadequate in countries such as India, Bangladesh, and parts of China. On the other hand, protein deficiencies in these countries would not occur with egalitarian access to food, while countries with stagnating or falling food production due to low soil fertility and limited or no access to N fertilizers (sub-Saharan Africa; several countries in Central Asia and Latin America) would not be able to secure adequate protein nutrition [16].
Health effects of inadequate dietary N intake
Currently, the number of people with chronic inadequate protein intake amounts to ∼1 billion [35] including ∼165 million children under five years of age. In Central Africa and South Asia about 30% of children suffer from malnutrition [27]. Protein deficiency is also common in sections of population in developed countries (e.g. elderly people; home-delivered meals, patients in long-term care facilities, cancer patients) [27]. The global distribution of protein supply to humans reveals that most countries across Europe, Oceania and North America have per capita protein supplies greater than 100 g day−1 (Figure 1). Countries across South Asia, sub-Saharan Africa and South America tend to be close to or below the critical range of 50–70 g capita−1 day−1. Protein deficiency in humans can cause various health problems such as kwashiorkor (caused by severe protein deficiency), marasmus (caused by severe deficiency of protein and energy), impaired mental health, edema, organ failure, wasting and shrinkage of muscle tissue, and weakness of immune system, particularly in children of developing countries [38].
![Figure 1:
Daily per capita protein supply [39]. Map derived based on data from FAO: http://www.fao.org/faostat/en/#data/FBS.](/document/doi/10.1515/reveh-2021-0021/asset/graphic/j_reveh-2021-0021_fig_001.jpg)
Daily per capita protein supply [39]. Map derived based on data from FAO: http://www.fao.org/faostat/en/#data/FBS.
Protein-energy malnutrition (PEM) is the most widespread form of malnutrition in the world today and accounts for ∼6 million deaths annually [31]. The number is expected to rise with increasing world population (9.4–10.1 billion by 2050) [40]. PEM includes the classifications of oedematous kwashiorkor (protein deficiency disease), non-oedematous marasmus (energy deficiency disease) and the intermediate form marasmic kwashiorkor [41]. Clinical symptoms of kwashiorkor include weight loss, decrease of muscle mass, swollen abdomen, ascites caused by increase of capillary permeability, enlarged (fatty) liver, anemia, and hair and skin changes; those of marasmus include weight loss (“skin and bones”), growth retardation, chronic diarrhoea, muscle atrophy, skin folds and “old man” face (Figure 2).
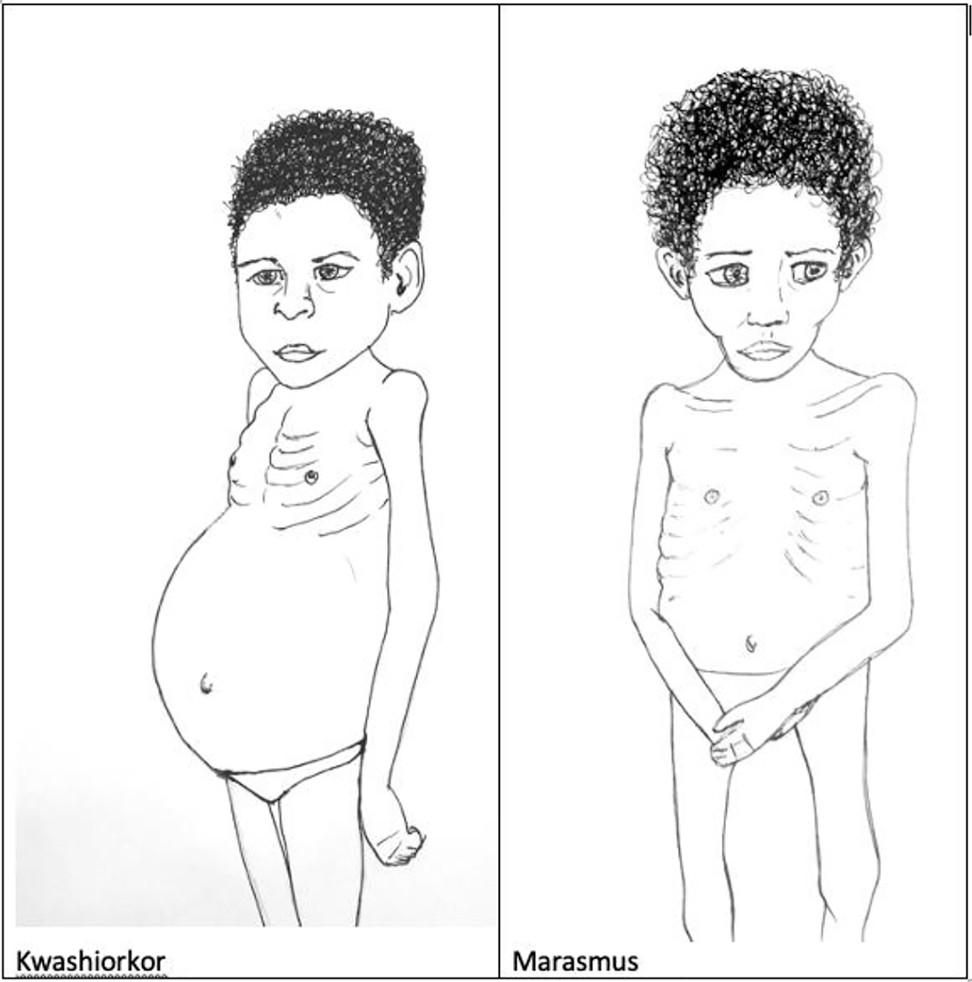
Clinical signs of kwashiorkor and marasmus.
In kwashiorkor, a greater suppression of protein breakdown creates shortages of essential and conditionally essential amino acids, and these insufficiencies impair protein metabolism, while the reduced availability of lipid impairs energy metabolism [42, 43]. Complications of PEM include hypoglycemia, hypothermia, electrolyte imbalance, micronutrient deficiencies and infections, the latter being one of the major complications of PEM. Malaria, bronchopneumonia and measles are the most frequently associated infections with PEM in African children [44]. In sub-Saharan Africa as well as in India, an additional concern is that a number of patients with severe malnutrition are also infected with HIV [45].
The other end of the nutrition spectrum is over-consumption of dietary protein from meals and excessive supplementation in many of the world’s wealthier nations [26]. A prominent example is the doubling of per capita meat consumption in the developed world since 1960. Chronic high protein intake (>2 g kg−1 day−1) may result in diabetes, cancer, intestinal, hepatic, renal or cardiovascular abnormalities [27, 46]. Another important aspect is that much of the world’s grain production is used for animal feed. Feed crops like corn are fertilized at high N levels, which means that increased meat production and consumption has been a significant driver of rising N fertilizer use. In addition, the environmental and health consequences of meat production and consumption vary with the way livestock is raised [26]. Beef, pork, chicken, and turkey are increasingly produced in concentrated animal feeding operations (CAFOs), where the livestock is fed with intensely fertilized grain products [47]. CAFOs lead to a cascade of environmental problems, including high N losses, that can have human health implications [47]. In particular poor manure management practices and decoupling of geographical regions specialized in intensive livestock farming and intensive crop production contribute to high anthropogenic N emissions [48]. Consequently, without high N fertilizer input, the growing use of CAFOs in meat production would not be possible.
Direct health effects of exposure to mobile forms of Nr
Increased circulation of Nr in the environment is also responsible for serious human health effects via different pathways [33]. Nitrate (NO3 −) is the most common chemical contaminant in the world’s aquifers. Ammonia (NH3), NO x and N2O are classified as primary air pollutants which are emitted directly from a source. Secondary air pollutants result from primary pollutants interactions (e.g. secondary particulate matter formation from NH3 and NO x ; ozone formation from NO x ) and are difficult to control, as they are not emitted directly.
Water polluted with NO3 −
Sources of NO3 −
Almost half of the drinking water in the world is sourced from groundwater (GW), and in many parts of the world GW is the most important source of drinking water [49, 50]. In many world regions high levels of nitrate (NO3 −) are present in GW (Figure 3). In 15 European countries, nearly 10 million people (0.5–10% of population) are exposed to high NO3 − levels (above the threshold value of 50 ppm NO3 − or ∼11.3 ppm NO3 −–N) in drinking-water [51, 52]. In China, 28% of the groundwater samples tested during 1980–2008 exceeded the WHO threshold value with 1.5 fold increase in N movement to the groundwater during the period [53]. Major anthropogenic sources of NO3 − contamination include cropland (60%), domestic wastewater and septic tanks (20%), industrial waste (13%) and deforestation (7%) [54]. Besides drinking water, vegetables are an important source of dietary nitrate. Green leafy vegetables such as spinach, parsley, lettuce accumulate higher amounts of nitrate (1,000–6,000 mg kg−1 fresh weight) compared to cabbage, cauliflower, celery, artichoke, kale, leek etc. (a few hundred to 1,000 mg kg−1) [21]. Presence of high amounts of free nitrate and nitrite in vegetables can be a health risk to humans. Depending on dietary habits the nitrate consumption through vegetables can reach up to 85% of the total intake.
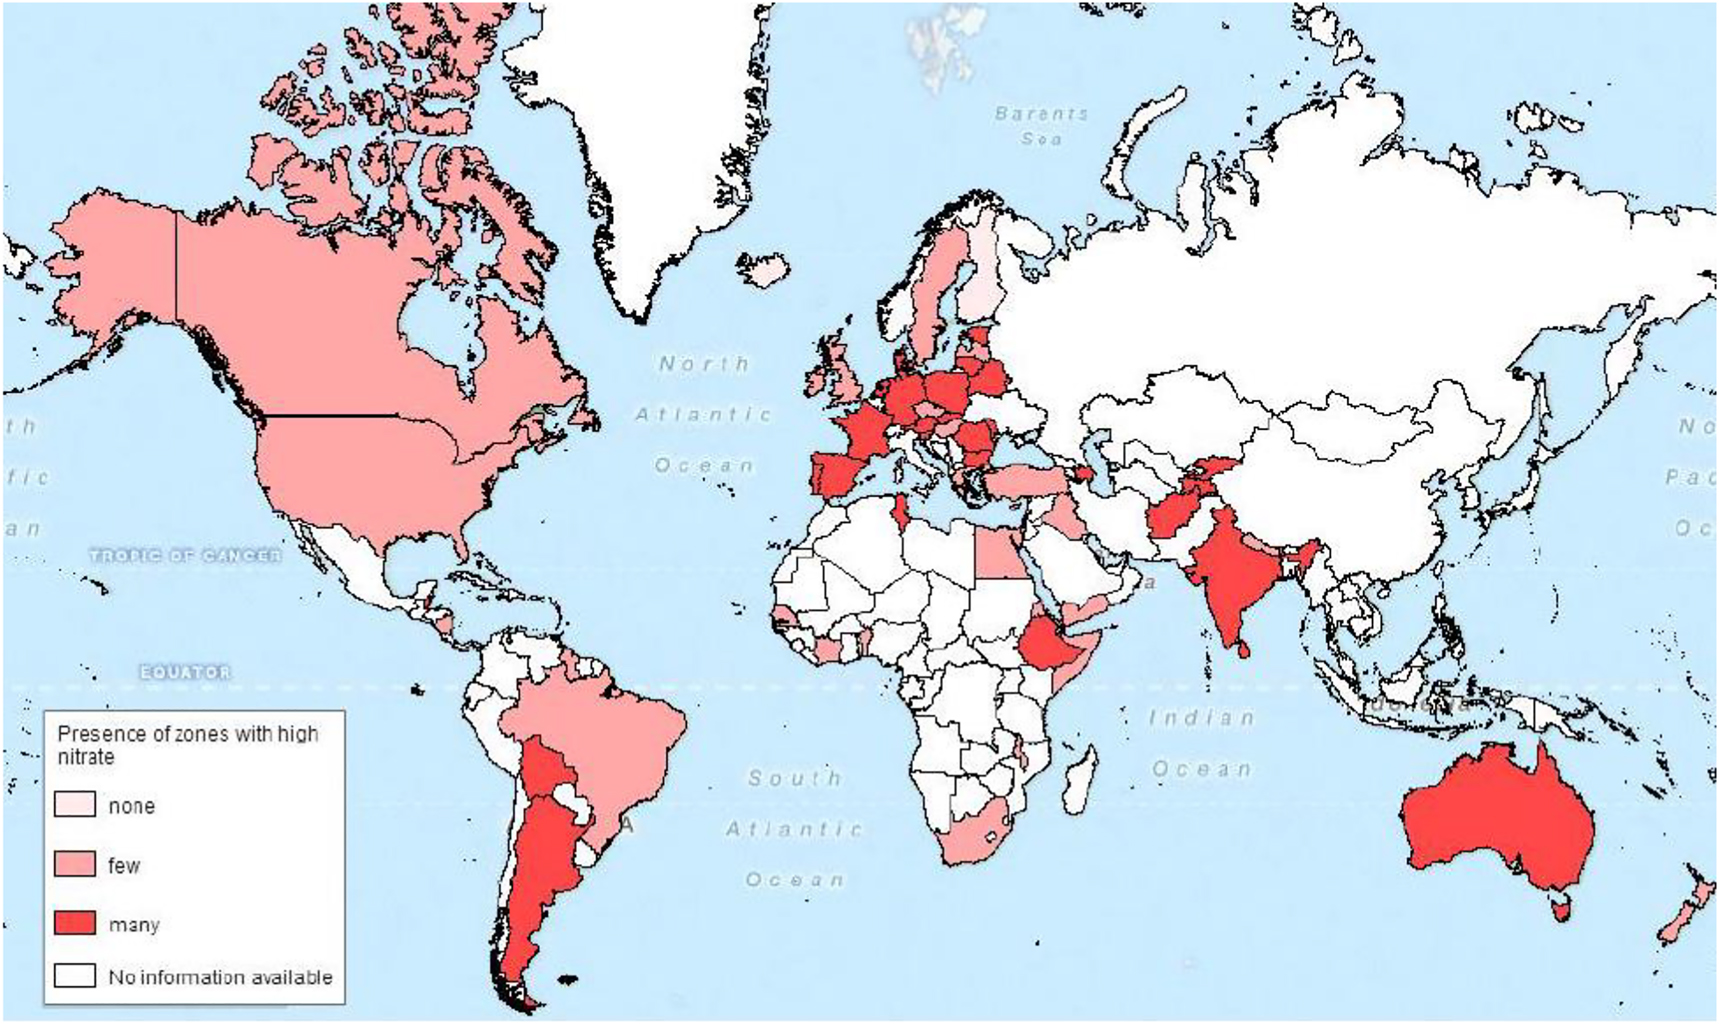
Global map with the presence of zones with high nitrate in groundwater.
In global waterways, levels of NO3 − have risen by ∼36% since 1990 [55]. Excessive additions of anthropogenic N (and P) from fertilizer runoff have promoted widespread eutrophication of fresh and coastal water bodies [25]. Typical effects include blooms of harmful algae species, the development of O2-depleted dead zones due to draw down of O2 levels by aerobic bacteria during their degradation of algal biomass, associated fish kills, as well as acidification as a result of CO2 formation by vigorous decomposition [56].
Map based on a literature study with information about the percentage of high nitrate concentration in groundwater [57].
Health effects of NO3 −
Nitrate per se is generally considered non-toxic for humans. Adverse effects on human health are due to conversion of NO3 − to nitrite (NO2 −). WHO (10 ppm), USA (10 ppm) and EU (11 ppm) have adopted NO3 −–N maximum standards in drinking water. Mainly rural domestic water wells and shallow wells beneath farmlands exceed the standards. Major health issues include infant methemoglobinemia (MHG: “cyanosis” or “blue baby syndrome”) and cancers of the digestive tract. MHG is potentially fatal, usually in infants under 6 months. Nitrite ions in the blood can change hemoglobin (Hb) to methemoglobin (MetHb), thereby inactivating hemoglobin by oxidizing iron from Fe2+ to Fe3+ and lowering the ability of blood to carry O2 [58]. Neonates <3 months of age are particularly prone to adverse effects of NO3 − exposure [59]. Compared to adults, the gastric pH is higher which enhances conversion of NO3 − to NO2 −. Moreover, babies drink three times more water for their size than older people. In addition, MHG reductase (enzyme that converts MetHb back to Hb) activity is reduced by half in infants. Normal methemoglobin levels do not exceed 1–3%. Clinical symptoms of increased levels include cyanosis (at MetHb concentrations between 10 and 20%), hypoxia (MetHb levels at 20–35%), coma, arrhythmias, shock (MetHb levels at 35–55%), and are lethal at >70% MetHb [21]. However, there exists only limited evidence on the relationship between NO3 − and MHG. Infantile MHG directly associated with higher NO3 − intake has been demonstrated only in a few studies and NO3 − as a cause of MHG is still being debated [60]. A complex co-factor relationship exists; for example, gastroenteritis from bacteria also stimulates NO2 − production and MHG. Association of MHG also exists with inflammation, acidosis, exposure to drugs, nitrates from cured meats, fruits and vegetables, and exogenous NO2.
High nitrate ingestion has also been associated with acute respiratory tract infection, increased risk of spontaneous abortion or certain birth defects in infants, reproductive problems and cancer [59, 61, 62]. N-nitroso compounds, formed from reaction of nitrites with amines and amides in the alimentary canal, have been linked with the risk of different cancers [63]. Nitrate has been associated with ovarian and liver cancers [64], [65], [66]. In England, an ecological study found an increased incidence of adult brain and central nervous system tumours in areas with high drinking water nitrate levels, but a number of case-control studies did not find any relationship [67]. Contrary or mixed results have also been found for other types of cancer. For example, about 50 epidemiological studies conducted since 1975 did not find a convincing link between NO3 − and stomach cancer [60]. Analysis of the relationship between different concentrations of nitrate in drinking water and cancer of the stomach, bladder, prostate, and colon among 258 citizens of the province of Valencia (Spain) showed that mortality from gastric cancer in males and females had increased with increasing exposure to nitrate [68]. In populations that had been exposed to high concentrations of nitrates of 50 mg per liter, the relative risk for gastric cancer in the age group of 55–75 years for males and females was 1.91 and 1.81 times, respectively [69]. According to the latter study, deaths from prostate cancer in males have also increased and relative risk for the age group of 55–75 years was higher by a factor 1.86 and for patients older than 75 years this was 1.8 times. Similarly, high dietary intakes of dairy products and meat also increase prostate cancer risk [70]. Consumption of red and processed meat is positively associated with prostate cancer via mechanisms involving heme iron, grilling/barbecuing, benzo[a]pyrene and nitrite/nitrate [71].
In a study conducted in Slovakia, Hodgkin’s Lymphoma and colorectal cancer incidence was observed among males and females who were exposed to water containing concentrations of 4.5–11.3 mg of NO3 −–N L−1 [72]. In other studies, no association was found between high concentrations of NO3 − in drinking water and bladder or kidney cancer [73, 74]. The effect of NO3 − concentrations in drinking water on the prevalence of urinary tract cancer in Germany in two groups that were exposed to NO3 − concentrations ranging from 10 to 60 mg L−1 was evaluated [75]. In the groups that had greater exposure, a positive correlation was found between urinary tract cancer in both genders, and a negative correlation was found with testicular tumor, but no association with kidney cancer. Negative relationships between NO3 − concentration in drinking water and the incidence of Hodgkin’s Lymphoma were found in the UK [76] and Iowa, USA [66]. In Sardinia (Italy), there was limited evidence for prevalence of Hodgkin’s Lymphoma among males but not in females [77].
Different results were obtained from case-control studies on both males and females [78] in the USA. There was a dose-response relationship and the risk of Hodgkin’s Lymphoma doubled with exposure to the highest NO3 − concentrations in drinking water. In the same study, the concentration of NO3 − in private wells with Hodgkin’s Lymphoma risk was considered irrelevant when intervening pesticides, and vitamin C and carotene were taken into account. In general, most studies have shown that NO3 − concentrations in drinking water have either no association with Hodgkin’s Lymphoma or reduced it.
Though there is no clear association between NO3 − in drinking water and the adverse human health effects, evidence is emerging of possible benefits in cardiovascular health and providing protection against infections. Nitrate is considered to have a role in protecting the gastrointestinal tract against a variety of pathogens, as nitrous oxide and acidified nitrite have antibacterial properties. It is particularly effective in the stomach against Salmonella, Escherichia coli and other organisms that cause gastroenteritis [21]. It also acts against dental caries and even against fungal skin pathogens such as Tinea pedis (athlete’s foot). Recent research indicates that NO2 − participates in host defence because of antimicrobial activity and it protects against a number of problems including ischemia-reperfusion injury (e.g. in heart attack and stroke), kidney injuries and hypertension [79]. Other NO3 − metabolites, e.g. nitric oxide, have important physiological roles such as vasoregulation [80]. It is generally suspected that animals lick their wounds because of antimicrobial salivary NO and other compounds. The presence of NO has been shown to increase both mucosal blood flow and mucus generation in the gastrointestinal tract [81]. Nitrite and its conversion to NO in the stomach also have an important role in promoting neonatal health [82]. Human breast milk is known to contain NO3 − and NO2 −, but the breast milk during the first three days (colostrum) contains more NO2 − than NO3 −, which presumably provides more NO in the baby’s stomach because of lack of nitrate reducing bacteria in its mouth and stomach. This ensures protection against infection to the newborn. Finally, it is important to note that increased consumption of vegetables is widely recommended because of their beneficial effects for health notwithstanding that these are a major source of NO3 − [80]. There may, therefore, be some benefit from exogenous NO3 − uptake, but there is a need to balance the potential risks and benefits.
Air polluted with NH3
Sources of NH3
Ammonia (NH3) as a primary air pollutant is emitted to the atmosphere mainly from agriculture. Farming and animal husbandry (∼80% of total global emissions) are main sources of atmospheric NH3. Results from a study using recently available retrievals from the Atmospheric Infrared Sounder aboard NASA’s Aqua satellite provide evidence of substantial increases in atmospheric NH3 concentrations over 14 years in several of the global hotspots represented by major agricultural regions ([83]; Figure 4). The values presented in Figure 4 are integrated over large areas; the local concentrations might be much higher as the transport distance of NH3 from source to deposition is usually small. Significant increasing trends can be identified over the USA (2.61% year−1), Western Europe (1.83% year−1) and China (2.27% year−1). Over the USA, increases in NH3 were explained by control of SO2 and NO x , resulting in reduced binding of NH3 in fine aerosols, and by regionally increasing temperatures. Over Western Europe, NH3 concentrations have increased despite reduced fertilizer use, again due to improved control of SO2 and NO x . Over China, a combination of increased agricultural activities, nascent SO2 control and increasing temperatures caused the observed increases in NH3 [83].
![Figure 4:
Atmospheric NH3 trends over the world’s major agricultural areas detected from space; volume mixing ratio computed for 1° × 1° latitude-longitude grid cell [83] (with kind permission from John Wiley and Sons).](/document/doi/10.1515/reveh-2021-0021/asset/graphic/j_reveh-2021-0021_fig_004.jpg)
Atmospheric NH3 trends over the world’s major agricultural areas detected from space; volume mixing ratio computed for 1° × 1° latitude-longitude grid cell [83] (with kind permission from John Wiley and Sons).
Health effects of NH3
Atmospheric NH3 is highly water-soluble and causes wet tissue (i.e. mucosa, eyes, and sinuses) and skin irritation and damage [21]. Long-term inhalation can be responsible for chronic lung disease. At concentrations >17 ppm, NH3 can be detected by odor (smell of drying urine). At increased concentration (e.g. 50 ppm for 2 h), irritation of eyes, nose and throat occurs [84]. Clinical symptoms at even greater levels cause rapid eye and respiratory tract irritation and skin burns (100 ppm), immediate irritation of eyes and throat (700 ppm) pulmonary edema and coughing (>1,500 ppm), and extremely high concentrations are fatal (2,500–5,500 ppm for 30 min) or rapidly fatal (5,000–10,000 ppm) [84].
Air polluted with NO x
Sources of NO x
Atmospheric NO x sources include biogenic emissions from soils (denitrification) and direct anthropogenic emissions (combustion). NO is formed by reaction between N and O in combustion air and by oxidation of N in the fuel. NO forms to NO2. About 30–50 Tg NO x year−1 originate from human activities and 10–20 Tg NO x year−1 from natural sources. Annual mean concentrations in urban areas generally range between 0.01 and 0.05 ppm and are strongly correlated with population level. Global hot spots of emission include the USA, China and Europe, with increasing trend over China [85].
Health effects of NO x
Nitric oxide (NO) is a colorless and odorless gas which is not soluble in water. Nitrogen dioxide (NO2) is a water-soluble, reddish-brown gas with a strong choking odor. NO2 contributes to urban haze. In water, NO2 reacts to produce nitric and nitrous acid:
NO2 is several times more human-toxic than NO [86]. The odor threshold is 1–3 ppm NO2. Human clinical studies have generally found no effects of NO2 exposure on pulmonary function at concentrations of 2 ppm [87]. Irritations can begin at concentrations of 15 ppm NO2, by tingling in the eyes and nose. The limited solubility of NO2 allows it to penetrate deep into the lower respiratory system. At 25 ppm NO2, respiratory irritations begin with cough, shortness of breath or dyspnea and chest pain [86]. Concentrations of NO2 between 25 and 100 ppm may result in cyanosis, fever, asthma, increased respiratory rate, tracheobronchitis, bronchopneumonia and pulmonary edema. Exposure to 150–200 ppm may result in lethal pulmonary disease [86]. Nitric acid (HNO3), being formed in the alveoli, destroys the protein structure of the membrane. The alveoli are filled up by water which causes acute edema. Consequently, the lack of free surface for the gas exchange causes death.
Secondary particulate matter formation from NH3 and NO x
Sources of particulate matter
Secondary particulate matter (PM) is a complex mixture of extremely small particles and liquid droplets. Commonly used indicators describing PM that are relevant to health refer to the mass concentration of particles with a diameter of less than 10 μm (PM10) and of particles with a diameter of less than 2.5 μm (PM2.5) [88]. The effect of PM2.5 is 4–5 times as severe as PM10. Gases are major contributors to PM. Formation of secondary PM is influenced by emission source profiles and climate/temperature. NH3 can form ammonium nitrate (NH4NO3) mainly in winter and ammonium sulfate ((NH4)2SO4) in summer. NH4NO3 has been identified as an important contributor to PM2.5 in many polluted regions [89, 90]. NO x and SO x require oxidants and water vapor; they contribute to PM formation mainly in summer.
Health effects of particulate matter
The WHO estimated that in 2016 globally ambient air pollution was responsible for 4.2 million premature deaths and approximately 3% of cardiopulmonary and 5% of lung cancer deaths were attributable to PM [91]. In 2010 annual PM2.5 alone accounted for 3.1 million deaths and around 3.1% of global disability-adjusted life years, [88]. In 2012 (with no change since 2000), roughly 75% of humans were exposed to PM concentrations exceeding the WHO guideline value of 20 μg m−3 [92]. Figure 5 presents PM2.5 concentration in different world regions during 2014.
![Figure 5:
PM2.5 concentration in different regions during 2014. Line bars represent standard errors. Emr: Eastern Mediterranean; LMI: Low- and middle income; HI: High-income (based on WHO data [92]).](/document/doi/10.1515/reveh-2021-0021/asset/graphic/j_reveh-2021-0021_fig_005.jpg)
PM2.5 concentration in different regions during 2014. Line bars represent standard errors. Emr: Eastern Mediterranean; LMI: Low- and middle income; HI: High-income (based on WHO data [92]).
In 2014, except for Americas (e.g. Canada, USA, Chile, Latin America, Brazil, Mexico), and high-income regions of Europe (e.g. countries in European Union, UK, Switzerland) and Western Pacific (e.g. Australia, New Zealand, Japan, Republic of Korea) all other regions exceeded the threshold value for PM2.5 (Figure 5). High-income Eastern Mediterranean region (Bahrain, Kuwait, Oman, Qatar, Saudi Arabia, UAE) exhibited the highest PM2.5 followed by low- and middle-income region of Western Pacific (China, Malaysia, Philippines) and South East Asian region (Bangladesh, India, Myanmar, Thailand). These differences in level of pollution point towards regions that need maximum attention.
On a global scale, a 10% reduction of NO x and NH y (NH3 + NH4 +) would each prevent 22,000 premature deaths per year [93]. A complete removal of agricultural emissions (in particular NH3) may prevent as many as 800,000 deaths annually [94]. While PM concentrations in the USA and in Europe are moderate and decreasing, there is still an increasing trend of the high levels in East and SE Asia [92]. In recent years, developing countries in Asia such as India and China have embarked on major urbanization and industrialization and consequently have been struggling immensely with severe air pollution. In China, chronic respiratory diseases due to air pollution remained in the top five leading causes of mortality, accounting for 870,000 deaths in 2016 [95]. Approximately one million people died in 2015 due to ambient particulate matter pollution in India [96].
Clinical signs of PM2.5 exposure are manifold [97]. They include short-term effects such as decreased lung function, increased respiratory symptoms, cardiac arrhythmias, heart attacks and premature death. Long-term effects include decreased lung function, chronic bronchitis, lung cancer and premature death. According to [98] there is an 8% increase in lung cancer development for every 10 μg m−3 increase in PM2.5. The adverse effects of air pollution reveal substantial need for more stringent control policies on the emission of air pollutants worldwide.
Tropospheric O3 formation from NO x
Sources of O3
In addition to PM formation, NO x also enhances production of tropospheric ozone (O3), which is a colorless, highly reactive and water-soluble gas with unpleasant odor. As a strong oxidant, O3 is used as disinfectant for water treatment. Two very different impact categories exist (Figure 6). The first and negative is tropospheric (ground-level) O3, a local air pollutant that has direct human health impacts. Tropospheric O3 is also known as a strong greenhouse gas, which over the short term contributes to warming [99]. The second and positive is stratospheric O3 which is essential in reflecting UV radiation and protecting humans from dangerous levels of UV exposure.
![Figure 6:
Concentration profiles of O3 in the atmosphere [100].](/document/doi/10.1515/reveh-2021-0021/asset/graphic/j_reveh-2021-0021_fig_006.jpg)
Concentration profiles of O3 in the atmosphere [100].
Ground-level O3 is formed from reaction of NO2 with O2 [33]. Requirements for forming ground-level O3 are solar radiation, NO x (released from soils or combustion products) and reactive volatile organic compounds (VOCs) which are released as natural VOCs from forests or produced during combustion. VOCs play a key role in O3 formation. In absence of VOCs, reaction reaches equilibrium, because most O3 oxidizes NO back into NO2, creating a cycle. VOCs shift the photochemical reaction towards O3 build-up. Peak O3 concentrations occur when high O3 precursor emissions coincide with appropriate meteorological conditions (sunshine, temperature), resulting in highest O3 levels during the afternoon hours. The stratospheric O3 layer is vulnerable to depletion, mainly by N2O.
Health effects of increased tropospheric O3
Increased O3 levels are known to cause serious respiratory diseases. In the EU about 20,000 premature deaths each year are associated with O3 [101]. Acute health effects of increased O3 levels include severe ear/nose/throat irritation, eye irritation (at 100 ppb O3), damages to cells lining the respiratory system, interference with lung functions (O3 reaches terminal bronchioles and alveoli) and coughing (at 2 ppm O3). Chronic health effects include irreversible accelerated lung damage, including asthma [102].
N2O emission impacts
Sources of N2O
Nitrous oxide (N2O), the product of microbial nitrification and denitrification, is a colorless, non-toxic gas of sweet odor having a residence time of 114 years. There are two different impacts of N2O, the global warming effect in the troposphere and the O3 depletion effect in the stratosphere. N2O accounts for 6% of the greenhouse effect and its concentration has increased from about 270 ppb in pre-industrial times to 320 ppb in 2011 [103]. This corresponds to a 0.25% increase of atmospheric N2O concentration per year. N2O is less abundant than CO2 but it is ∼300 times more climate damaging. Global N2O emissions have increased from ∼10 Tg N year−1 [104] before the industrial era to approximately 18 Tg N year−1 in the 2010–2015 period [105], of which 11 Tg N originate from natural sources and 7 Tg N from anthropogenic sources. About 70% of the anthropogenic N2O (∼5 Tg N) results from agricultural activities and biomass burning [106].
Once transported to the stratosphere, N2O is involved in photochemical processes that destroy stratospheric ozone (O3). In these processes, N2O is removed through its reaction with excited oxygen atoms formed by photolysis of O3 [107, 108]:
NO (and chlorofluorocarbons) catalyze O3 loss:
Stratospheric O3 is measured in units called “Dobson Unit” (D.U.). Normal O3 concentration is between 300 and 350 D.U. [109]. Ozone hole is created in regions where the O3 layer has been depleted. The term “ozone hole” is applied when the concentration level is below 200 D.U. Chlorofluorocarbons (CFCs) react with O3 in the same manner. The 1987 Montreal Protocol banned many of the CFCs used in refrigerators and aerosol sprays while N2O remained unregulated in the protocol. The consequences are an ongoing increase of the N2O concentration and a decrease of CFC concentrations, which means that N2O is now the dominant O3-depleting substance [108].
Health effects of N2O
Health impacts of N2O are indirect and include climate change effects as well as destruction of the stratospheric O3 layer. Climate change and health effects are manifold, such as higher temperatures and heat waves increasing the risk of dehydration and heat stroke, intense local weather changes increasing the risk of injuries and deaths, food insecurity due to land degradation leading to under-nutrition and mental illness, and population displacement promoting violent conflicts. Heatwaves have been linked with short-term increase in mortality. For instance, the heatwave in summer of 2003 in Central Europe caused an estimated 14,800 deaths in France [110]. Stratospheric O3 layer depletion increases the amount of ultraviolet B-rays (UVB: 290–320 nm) that reach the Earth’s surface [111]. Increased UVB has been linked to damage to parts of the eye (lens, cornea, conjunctiva), and cataract formation (clouding of the eye’s lens), the leading cause of blindness worldwide. A decrease of 1% of O3 level is considered to be responsible for 0.3–0.6% increase in the risk of cataract formation [109]. Depletion of the O3 layer leads to sun-burn and skin cancer [112]. There is considerable relationship between melanoma (type of skin cancer) and intermittent sun exposure and sun-burn history [113]. UVB is also responsible for breast cancer and leukemia [109]. Exposure to UVB can also result in suppression of immune response to skin cancer, which is due to changes in skin photoreceptors and antigen presenting cells that are affected by UVB [114]. Exposure to UVB can also cause DNA damage because UV radiation can disturb lipids, proteins and nucleic acids [109]. Obstruction of lungs, emphysema, asthma and bronchitis can also result from UV radiation exposure [109].
Effect of restricted emissions during COVID-19 on air quality
In the first quarter of 2020, coronavirus disease 2019 (COVID-19) spread worldwide and resulted in a global crisis. A relationship between the number of infected people and the lethality of COVID-19 increased exponentially between February and March of 2020, forcing most countries around the world to be under some form of lockdown [23]. Transport was one of the most affected sectors, but also industrial, commercial, and entertainment activities were closed. Several studies have reported decrease in the concentrations of atmospheric pollutants due to the lockdown. Changes of PM2.5 (monthly averages) during lockdowns in selected cities in Asia, the USA and Europe were reported by [115]. In Delhi and Mumbai (India), a decline of 35 and 14%, respectively, compared to March 2019 was observed. Significant changes were also observed in Beijing and Shanghai cities of China. In Beijing, a decline of 50% was observed from February to March, whereas in Shanghai PM2.5 declined by more than 50% in the same time period. In Zaragoza (Spain) significant decline (58%) in PM2.5 was observed during March 2020 compared to February 2020. In New York city, a reduction in PM2.5 by 32% was recorded during March 2020 compared with March 2019, and by 20% compared to February 2020. In Los Angeles, 4% reduction in PM2.5 was observed during March 2020 with reference to March 2019, and by about 30% compared with February 2020. In Rome, the average value of PM2.5 in the month of March 2020 was 24% lower compared with February and 159% compared to the month of January 2020 [115]. After two weeks of lockdown in Barcelona (Spain), the urban air pollution markedly decreased [116]. A lower reduction was observed for PM10 (∼30%). The most significant reduction was observed for NO2 (51%) which was mainly related to reduction of traffic emissions. In China, several European countries (Spain, France, Italy) and in the USA, NO2 was reduced by up to 20–30% due to lockdown [23]. In India (mean of 22 cities), around 43, 31 and 8% decreases in PM2.5, PM10 and NO2 were observed during the lockdown period compared to previous years [117]. The positive impact on air quality may be temporary. However, the changes in air pollution in the COVID-19 lockdown period provide an insight into the achievability of long-term air quality improvement under significant restrictions in emissions from different sources.
Indirect ecological feedback effects to human health
Vector-borne diseases considered sensitive to increased Nr
Several studies have shown a positive correlation between concentrations of inorganic N in surface water and larval abundance for malarial Anopheles mosquitoes [118, 119], as well as for Culex ssp. and Aedes ssp., carriers of La Crosse encephalitis, Japanese encephalitis, and West Nile virus [120, 121]. Positive associations between indices of algal productivity and larval abundance have also been found for Anopheles in Latin America and Africa [118, 122]. However, not all such associations are positive [123], and concurrent increases in mosquitoes and eutrophic conditions are probably species-, site-, and season-specific [26]. In general, as with many ecological responses to changing N, the dynamics of a disease vector are complex, driven not only by the organism’s direct response, but also by those of its food sources, and of the parasitic and predatory species that affect its abundance [124].
Another widespread effect of increased N is the eutrophication of coastal and marine ecosystems [25, 125], an ecological change which also affects human health. The global increase in harmful algal blooms (HABs) has been linked to anthropogenic nutrient loading [125, 126]. Under favorable light and nutrient conditions, some species of cyanobacteria produce secondary toxic metabolites, known as cyanotoxins. There are about 40 genera that produce toxins but the main ones are Anabaena, Aphanizomenon, Cylindrospermopsis, Lyngbya, Microcystis, Planktothrix and Nostoc [127]. Cyanotoxins fall into the groups of cyclic peptides, alkaloids and lipopolysaccharides. Exposure to cyanobacteria and their toxins may occur by ingestion of contaminated drinking water and through direct contact, inhalation and/or ingestion during recreational activities [123]. These toxic substances can cause diverse human health effects ranging from hepatotoxic, neurotoxic and dermatotoxic to general inhibition of protein synthesis [21]. There are also indications for hematological, kidney, cardiac, reproductive and gastrointestinal effects. Evidence suggests that long-term exposure to low levels of microcystins and cylindrospermopsin may promote cell proliferation and the growth of tumors [123]. Symptoms of cyanotoxity include fatigue, headache, fever, muscle and joint pain, blisters, stomach cramps, diarrhoea, vomiting, mouth ulcers, sore throat, skin irritations and allergic reactions [128].
HABs can also indirectly affect humans by disrupting freshwater and marine ecosystems and sources of nutrition derived from them. For example, consumption of shellfish and other seafood containing bioaccumulated toxins can cause acute and potentially fatal effects. The symptoms of diarrheal shellfish poisoning include diarrhea, vomiting, and abdominal pain and that of paralytic shellfish poisoning include muscular paralysis, difficulty in breathing, shock, and, in extreme cases, death by respiratory arrest [21]. Decaying algal biomass produces surface scum, odors, and increased populations of insect pests. Increased N and P can also increase the availability of other nutrients that can facilitate algal blooms of many harmful species [125] and enhanced survival of pathogenic bacteria such as E. coli, Salmonella spp. and V. cholerae. High nutrient conditions favoring algal growth have been implicated in a number of cholera outbreaks [129, 130]. The most efficient way to prevent eutrophication and the development of algal blooms, and to reduce vector-borne diseases, is by preventing excess nutrients from reaching water bodies.
Vector-borne diseases considered sensitive to climate change
It is estimated that by 2,100 average global temperatures will rise by 1.0–3.7 °C [103], increasing the likelihood of many vector-borne diseases in new areas. The greatest effect of climate change on transmission is likely to be observed at the extremes of the range of temperatures at which transmission occurs. For many diseases these lie in the range of 14–18 °C at the lower end and about 35–40 °C at the upper end [131]. In particular, regions at higher latitudes or altitudes may become conducive to the vectors because of an increase in temperature. Mosquito species are responsible for transmission of most vector-borne diseases, and are sensitive to temperature changes as immature stages in the aquatic environment and as adults. Malaria and dengue fever (both transmitted by mosquitos) are among the most important vector-borne diseases in the tropics and subtropics. If water temperature rises, mosquito larvae take a shorter time to mature [132] and consequently there is a greater capacity to produce more offspring during the transmission period. In warmer climates, adult female mosquitoes digest blood faster and feed more frequently [133], thus increasing transmission intensity. Salmonella and Cholera bacteria also proliferate more rapidly at higher temperatures. Strong associations have been observed between temperature and occurrence of salmonellosis in European countries [134] and Australia [135]. Lyme disease (tick-borne encephalitis) is the most common vector-borne disease in Europe and in the USA [21]. Other vector-borne diseases considered sensitive to climate change include Yellow fever (vector: mosquito), West Nile fever (vector: mosquito), “sleeping sickness” (vector: tsetse fly), Leishmaniasis (vector: phlebotomine sandfly), “river blindness” (vector: blackfly), schistosomiasis (intermediate host: snail) and Hemorrhagic fever (caused by Hanta virus) [21].
In addition to temperature, changing precipitation patterns can also have short- and long-term effects on vector habitats. Increased precipitation has the potential to increase the number and quality of breeding sites for vectors such as mosquitoes, ticks and snails, and the density of vegetation, affecting the availability of resting sites [131].
Conclusions
Reactive nitrogen (Nr) has a wide range of beneficial and detrimental effects on ecosystems and humans. Humans consume N as protein that is indispensable for the development, upkeep and repair of all body cells. In contrast to the developed world with widespread access to commercial mineral N fertilizers, large areas of Africa and smaller but significant regions of Asia and Latin America continue to experience constraints in access to N fertilizers. These regional disparities in N availability contribute to food insecurity, famine, economic insecurity and social unrest. Universal access to mineral N fertilizers combined with improving agricultural practices is critical for reducing malnutrition and promoting resilience. Solving this problem will require inter-governmental cooperation and policies that incentivize the private sector, local NGOs, and citizens to make fertilizers accessible to all.
Human activity creates more reactive N forms (NO3 −, NH4 +, NH3, NO x (NO + NO2) and N2O) than all terrestrial natural processes together. The resulting effects on the environment are widespread but there are also serious human health effects due to the ingestion of N‐containing compounds in air or water, or compounds and particulates produced because of excess reactive N in those reservoirs. Improved agricultural management practices and mitigation technologies can help to reduce direct N emissions as well as secondary particulate matter formation from NH3 and NO x . Since atmospheric NO x also arises from combustion processes, it is important to reduce emissions from traffic, industry and biomass burning. The positive impact of restricted emissions during COVID-19 pandemic on air quality (e.g. NO x emission reduction) may be only temporary. However, governments should learn from the lockdown on how to reduce air pollution.
Increases in N availability can lead to a cascade of ecological responses at multiple levels. It’s a fact that increased N is not only a main cause of lowered biodiversity but also a driver of vector-borne disease dynamics. Changes in the epidemiology of human diseases due to increased N are variable and complex. They depend on the life histories of disease-causing organisms and their vectors, the structure and composition of food webs controlling their abundance, and the overall sensitivity to increased N shown by the ecosystems in which they reside. Enrichment of surface waters with N and P contributes to eutrophication leading to harmful algal blooms, causing neurological, amnesic, paralytic, and/or diarrheic shellfish poisoning as well as production of human-toxic substances by cyanobacteria and estuarine dinoflagellates. An effective counteractive measure is the protection of groundwater and surface water quality by reducing input of N and P in agricultural systems.
To reduce N emissions from agriculture, optimized management based on the 4-R concept (right type, rate, timing and method of application of N fertilizer) is required. Improvements in animal production systems include efforts to reduce unwanted N release to the environment via inadequate animal nutrition and waste management, as well as reducing excessively high densities of livestock towards appropriate stocking rates. Sharing these approaches to improve N management among developed and developing countries could be a solution to avoid problems with N excess in developing regions. Optimized ways of N use and minimizing stress to natural resources and humans presents a major multinational challenge across the fields of agriculture, ecology and public health. Dealing with all these cross-border challenges, interdisciplinary dialog and collaboration are the key prerequisite.
Acknowledgement
We thank cand. med. Alexandra Nieder for the preparation of Figure 2.
-
Research funding: None declared.
-
Author contributions: All authors have accepted responsibility for the entire content of this manuscript and approved its submission.
-
Competing interests: The authors state no conflict of interest.
-
Informed consent: Not applicable.
-
Ethical approval: The conducted research is not related to either human or animal use. The authors herewith confirm that all research reviewed complies with all the relevant national regulations, institutional policies, and was performed in accordance with the tenets of the Helsinki Declaration, and has been approved with the authors‘ institutional review board or equivalent committee.
References
1. Galloway, JN, Schlesinger, WH, Levy, H, Michaels, A, Schnoor, JL. Nitrogen fixation: atmospheric enhancement – environmental response. Global Biogeochem Cycles 1995;9:235–52. https://doi.org/10.1029/95gb00158.Search in Google Scholar
2. Vitousek, PM, Howarth, RW. Human alteration of the global nitrogen cycle: causes and consequences. Ecol Appl 1991;7:737–50.10.1890/1051-0761(1997)007[0737:HAOTGN]2.0.CO;2Search in Google Scholar
3. Zhang, X, Ward, BB, Sigman, DM. Global nitrogen cycle: critical enzymes, organisms, and processes for nitrogen budgets and dynamics. Chem Rev 2020;120:5308–51. https://doi.org/10.1021/acs.chemrev.9b00613.Search in Google Scholar PubMed
4. Houlton, BZ, Almaraz, M, Aneja, V, Austin, AT, Bai, E, Cassman, KG, et al.. A world of co-benefits: solving the global nitrogen challenge. Earths Future 2019;7:1–8. https://doi.org/10.1029/2019ef001222.Search in Google Scholar
5. Vitousek, PM, Menge, DNL, Reed, SC, Cleveland, CC. Biological nitrogen fixation: rates, patterns, and ecological controls in terrestrial ecosystems. Phil Trans Biol Sci 2013;B368:20130119. https://doi.org/10.1098/rstb.2013.0119.Search in Google Scholar PubMed PubMed Central
6. Herridge, DF, Peoples, MB, Boddey, RM. Global inputs of biological nitrogen fixation in agricultural systems. Plant Soil 2008;311:1–18. https://doi.org/10.1007/s11104-008-9668-3.Search in Google Scholar
7. Fowler, D, Coyle, M, Skiba, U, Sutton, MA, Cape, JN, Reis, S, et al.. The global nitrogen cycle in the twenty-first century. Phil Trans Biol Sci 2013;368:20130164. https://doi.org/10.1098/rstb.2013.0164.Search in Google Scholar PubMed PubMed Central
8. Galloway, JN, Cowling, EB, Seitzinger, SP, Robert, HS. Reactive nitrogen: too much of a good thing? Ambio 2002;31:60–3. https://doi.org/10.1579/0044-7447-31.2.60.Search in Google Scholar PubMed
9. Battye, W, Aneja, VP, Schlesinger, WH. Is nitrogen the next carbon? Earth’s Future 2017;5:894–904. https://doi.org/10.1002/2017ef000592.Search in Google Scholar
10. Schlesinger, WH. On the fate of anthropogenic nitrogen. Proc Natl Acad Sci Unit States Am 2009;106:203–8. https://doi.org/10.1073/pnas.0810193105.Search in Google Scholar PubMed PubMed Central
11. Heckenmüller, M, Narita, D, Klepper, D. Global availability of phosphorus and its implications for global food supply: an economic overview. Kiel Institute for the World Economy; 2014. Working Paper No. 1897.Search in Google Scholar
12. UN. Hemispheric transport of air pollution 2010, part A: ozone and particulate matter, air pollut studies no 17. Geneva: United Nations; 2010.Search in Google Scholar
13. Millennium Ecosystem Assessment. Ecosystems and human well-being: synthesis. Washington DC: Island Press; 2005.Search in Google Scholar
14. Lassaletta, L, Billen, G, Grizetti, B, Anglade, J, Garnier, J. 50 year trends in nitrogen use efficiency of world cropping systems: the relationship between yield and nitrogen input to cropland. Environ Res Lett 2014;9:105011. https://doi.org/10.1088/1748-9326/9/10/105011.Search in Google Scholar
15. Goodland, R. Livestock sector environmental assessment. Washington, D.C.: World Bank Report; 1999.Search in Google Scholar
16. Smil, VA. Nitrogen and food production: proteins for human diets. Ambio 2002;31:126–31. https://doi.org/10.1579/0044-7447-31.2.126.Search in Google Scholar PubMed
17. Wang, C, Houlton, BZ, Dai, W, Bai, E. Growth in the global N2 sink attributed to N fertilizer inputs over 1860–2000. Sci Total Environ 2017;574:1044–53. https://doi.org/10.1016/j.scitotenv.2016.09.160.Search in Google Scholar PubMed
18. Zhang, X, Davidson, EA, Mauzerall, DL, Searchinger, TD, Dumas, P, Shen, Y. Managing nitrogen for sustainable development. Nature 2015;528:51–9. https://doi.org/10.1038/nature15743.Search in Google Scholar PubMed
19. Conant, RT, Berdanier, AB, Grace, PR. Patterns and trends in nitrogen use and nitrogen recovery efficiency in world agriculture. Global Biogeochem Cycles 2013;27:558–66. https://doi.org/10.1002/gbc.20053.Search in Google Scholar
20. Galloway, JN, Cowling, EB. Reactive nitrogen and the world: 200 years of change. Ambio 2002;31:64–71. https://doi.org/10.1579/0044-7447-31.2.64.Search in Google Scholar PubMed
21. Nieder, R, Benbi, DK, Reichl, FX. Soil components and human health. Dordrecht, The Netherlands: Springer; 2018.10.1007/978-94-024-1222-2Search in Google Scholar
22. Stevens, CJ, Dise, NB, Gowing, DJ. Regional trends in soil acidification and exchangeable metal concentrations in relation to acid deposition rates. Environ Pollut 2009;157:313–9. https://doi.org/10.1016/j.envpol.2008.06.033.Search in Google Scholar PubMed
23. Muhammad, S, Long, X, Salman, M. COVID-19 pandemic and environmental pollution: a blessing in disguise? Sci Total Environ 2020;728:138820. https://doi.org/10.1016/j.scitotenv.2020.138820.Search in Google Scholar PubMed PubMed Central
24. Grizetti, B, Bouraoui, F, Aloe, A. Changes of nitrogen and phosphorus loads to European seas. Global Change Biol 2012;18:769–82.10.1111/j.1365-2486.2011.02576.xSearch in Google Scholar
25. Howarth, RW. Coastal nitrogen pollution: a review of sources and trends globally and regionally. Harmful Algae 2008;8:14–20. https://doi.org/10.1016/j.hal.2008.08.015.Search in Google Scholar
26. Townsend, AR, Howarth, RW, Bazzaz, FA, Booth, MMS, Cleveland, CC, Collinge, SK, et al.. Human health effects of a changing global nitrogen cycle. Front Ecol Environ 2003;1:240–6. https://doi.org/10.1890/1540-9295(2003)001[0240:hheoac]2.0.co;2.10.1890/1540-9295(2003)001[0240:HHEOAC]2.0.CO;2Search in Google Scholar
27. Wu, G. Dietary protein intake and human health. Food Funct 2016;7:1251–65. https://doi.org/10.1039/c5fo01530h.Search in Google Scholar
28. Pellett, PL. Protein requirements in humans. Am J Clin Nutr 1990;51:723–37. https://doi.org/10.1093/ajcn/51.5.723.Search in Google Scholar
29. FAO/WHO/UNU. Protein and amino acid requirements in human nutrition. Geneva: World Health Organization; 2007.Search in Google Scholar
30. Smil, VA. Feeding the world: a challenge for the twenty-first century. Cambridge, MA: MIT Press; 2000.10.7551/mitpress/2977.001.0001Search in Google Scholar
31. Wu, G, Bazer, FW, Cross, HR. Land-based production of animal protein: impacts, efficiency, and sustainability. Ann N Y Acad Sci 2014;1328:18–28. https://doi.org/10.1111/nyas.12566.Search in Google Scholar
32. Leinonen, I, Iannetta, PPM, Rees, RM, Russell, W, Watson, C, Barnes, AP. Lysine supply is a critical factor in achieving sustainable global protein economy. Front Sustain Food Syst 2019;3:27. https://doi.org/10.3389/fsufs.2019.00027.Search in Google Scholar
33. Wolfe, AH, Patz, A. Reactive nitrogen and human health: acute and long-term implications. Ambio 2002;31:120–5. https://doi.org/10.1579/0044-7447-31.2.120.Search in Google Scholar
34. Sanchez, PA. Soil fertility and hunger in Africa. Science 2002;295:219–20. https://doi.org/10.1126/science.1065256.Search in Google Scholar
35. FAOSTAT. Fertilizers indicators (Food and Agriculture Organization Corporate Statistical Database). FAO Online Database; Last update: 2020. Available from: http://www.fao.org/faostat/en/#data/EF/visualize.Search in Google Scholar
36. Lu, C, Tian, H. Global nitrogen and phosphorus fertilizer use for agriculture production in the past half century: shifted hot spots and nutrient imbalance. Earth Syst Sci Data 2017;9:181–92. https://doi.org/10.5194/essd-9-181-2017.Search in Google Scholar
37. Liao, W, Liu, C, Yuan, Y, Gao, Z, Nieder, R, Roelcke, M. Trade-offs of gaseous emissions from soils under vegetable, wheat-maize and apple orchard cropping systems applied with digestate: an incubation study. J Air Waste Manag Assoc 2019;70:108–20. https://doi.org/10.1080/10962247.2019.1694091.Search in Google Scholar
38. FAO. Dietary protein evaluation in human nutrition: report of an FAO expert consultation. Rome: FAO; 2013.Search in Google Scholar
39. Roser, M, Ritchie, H. Food supply; 2013. Published online at OurWorldInData.org. Available from: https://ourworldindata.org/food-supply.Search in Google Scholar
40. UN. World population prospects 2019. Geneva: United Nations; 2019.Search in Google Scholar
41. Forrester, TE, Badaloo, AV, Boyne, MS, Osmond, C, Thompson, D, Green, C, et al.. Prenatal factors contribute to the emergence of kwashiorkor or marasmus in severe under nutrition: evidence for the predictive adaptation model. PloS One 2012;7:e35907. https://doi.org/10.1371/journal.pone.0035907.Search in Google Scholar PubMed PubMed Central
42. Jahoor, F, Badaloo, A, Reid, M, Forrester, T. Protein metabolism in severe childhood malnutrition. Ann Trop Paediatr 2008;28:87–101. https://doi.org/10.1179/146532808x302107.Search in Google Scholar
43. Golden, MH. Evolution of nutritional management of acute malnutrition. Indian Pediatr 2010;47:667–78. https://doi.org/10.1007/s13312-010-0103-5.Search in Google Scholar PubMed
44. Fagule, D. Malnutrition: a reappraisal of the major predisposing factors. Niger J Paediatr 1990;17:7–13.Search in Google Scholar
45. Ambrus, JLSr, Ambrus, JLJr. Nutrition and infectious diseases in developing countries and problems of aquired immunodeficiency syndrome. Exp Biol Med 2004;229:464–72. https://doi.org/10.1177/153537020422900603.Search in Google Scholar PubMed
46. Pedersen, AN, Kondrup, J, Børsheim, E. Health effects of protein intake in healthy adults: a systematic literature review. Food Nutr Res 2013;57:21245. https://doi.org/10.3402/fnr.v57i0.21245.Search in Google Scholar PubMed PubMed Central
47. Mallin, MA. Impacts of industrial animal production on rivers and estuaries. Am Sci 2000;88:2–13. https://doi.org/10.1511/2000.1.26.Search in Google Scholar
48. Hou, Y, Wie, S, Ma, WQ, Roelcke, M, Nieder, R, Shi, SL, et al.. Changes in nitrogen and phosphorus flows and losses in agricultural systems of three megacities of China. Resour Conserv Recycl 2018;139:64–75. https://doi.org/10.1016/j.resconrec.2018.07.030.Search in Google Scholar
49. Schmoll, O, Howard, G, Chorus, I. Protecting groundwater for health: managing the quality of drinking-water sources. London: IWA Publ.; 2006.Search in Google Scholar
50. Shiklomonav, I. World fresh water resources. In: Gleick, P, editor. Water in crisis: a guide to the world’s fresh water resources. New York: Oxford University Press; 1993.Search in Google Scholar
51. WHO. Health hazards from nitrate in drinking-water. Report on a WHO meeting, Copenhagen, 5–9 March 1984. Copenhagen: WHO Regional Office for Europe (Environmental Health Series No. 1); 1985.Search in Google Scholar
52. ECETOC. Nitrate and drinking water. Brussels: European Centre for Ecotoxicology and Toxicology of Chemicals (Technical Report No. 27); 1988.Search in Google Scholar
53. Gu, B, Ge, Y, Chang, SX, Luo, W, Chang, J. Nitrate in groundwater of China: sources and driving forces. Global Environ Change 2013;23:1112–21. https://doi.org/10.1016/j.gloenvcha.2013.05.004.Search in Google Scholar
54. Shukla, S, Saxena, A. Global status of nitrate contamination in groundwater: its occurrence, health impacts, and mitigation measures. In: Handbook of environmental materials management. Cham, Switzerland: Springer; 2019:869–88 pp.10.1007/978-3-319-73645-7_20Search in Google Scholar
55. World water quality facts and statistics. Pacific Institute; 2010. Available from: https://pacinst.org/wp-content/uploads/2018/08/water_quality_facts_and_stats3.pdf.Search in Google Scholar
56. Sunda, WG, Cai, WJ. Eutrophication-induced CO2-acidification of subsurface coastal waters: interactive effects of temperature, salinity and atmospheric pCO2. Environ Sci Technol 2012;46:10651–9. https://doi.org/10.1021/es300626f.Search in Google Scholar PubMed
57. IGRAC. Global groundwater information system; 2012. Available from: https://ggis.un-igrac.org/layers/igrac:igrac:go_gwquality_presofzoneswithhighnitrate#more.Search in Google Scholar
58. Brender, JD, Weyer, PJ, Romitti, PA, Mohanty, BP, Shinde, MU, Vuong, AM, et al.. Prenatal nitrate intake from drinking water and selected birth defects in offspring of participants in the National Birth Defects Prevention Study. Environ Health Perspect 2013;121:1083–9. https://doi.org/10.1289/ehp.1206249.Search in Google Scholar PubMed PubMed Central
59. Gupta, SK, Gupta, RC, Gupta, AB, Seth, AK, Bassin, JK, Gupta, A. Recurrent acute respiratory infections in areas with high nitrate concentrations in drinking water. Environ Health Perspect 2000;108:363–6. https://doi.org/10.1289/ehp.00108363.Search in Google Scholar PubMed PubMed Central
60. Powlson, DS, Addiscott, TM, Benjamin, N, de Kok, TM, van Grinsven, H, L’Hirondel, JL, et al.. When does nitrate become a risk for humans. J Environ Qual 2008;37:291–5. https://doi.org/10.2134/jeq2007.0177.Search in Google Scholar PubMed
61. Kramer, MH, Herwaldt, BL, Craun, GF. Surveillance of waterborne-disease outbreaks- United States, 1993–1994. CDCP surveillance summaries. Morb Mortal Wkly Rep 1996;45:1–33.Search in Google Scholar
62. Nolan, BT. Nitrate behavior in ground waters of the Southeastern USA. J Environ Qual 1999;28:1518–27. https://doi.org/10.2134/jeq1999.00472425002800050017x.Search in Google Scholar
63. IARC. Monograph on the evaluation of the carcinogenic risk of chemicals to humans: some N-nitroso compounds. Lyon: International Agency for Research on Cancer; 1978. Monograph No. 17.Search in Google Scholar
64. Tsezou, A, Kitsiou-Tzeli, S, Galla, A, Gourgiotis, D, Mitrou, S, Molybdas, P, et al.. High nitrate content in drinking water: cytogenetic effects in exposed children. Arch Environ Health 1996;51:458–61. https://doi.org/10.1080/00039896.1996.9936046.Search in Google Scholar PubMed
65. Mueller, BA, Newton, K, Holly, EA, Preston-Martin, S. Residential water source and the risk of childhood brain tumors. Environ Health Perspect 2001;109:551–6. https://doi.org/10.1289/ehp.01109551.Search in Google Scholar PubMed PubMed Central
66. Weyer, PJ, Cerhan, JR, Kross, BC, Hallberg, GR, Kantamneni, J, Breuer, G, et al.. Municipal drinking water nitrate level and cancer risk in older women: the Iowa Women’s Health Study. Epidemiology 2001;12:327–38. https://doi.org/10.1097/00001648-200105000-00013.Search in Google Scholar PubMed
67. Johnson, CJ, Kross, BC. Continuing importance of nitrate contamination of groundwater and wells in rural areas. Am J Ind Med 1990;18:449–56. https://doi.org/10.1002/ajim.4700180416.Search in Google Scholar PubMed
68. Parvizishad, M, Dalvand, A, Mahvi, AH, Goodarzi, F. A review of adverse effects and benefits of nitrate and nitrite in drinking water and food on human health. Health Scope 2017;6:e14164.10.5812/jhealthscope.14164Search in Google Scholar
69. Morales-Suarez-Varela, MM, Llopis-Gonzalez, A, Tejerizo-Perez, ML. Impact of nitrates in drinking water on cancer mortality in Valencia, Spain. Eur J Epidemiol 1995;11:15–21. https://doi.org/10.1007/bf01719941.Search in Google Scholar PubMed
70. Leitzmann, F, Rohrmann, S. Risk factors for the onset of prostatic cancer: age, location, and behavioral correlates. Clin Epidemiol 2012;4:1–11. https://doi.org/10.2147/clep.s16747.Search in Google Scholar PubMed PubMed Central
71. Sinha, R, Park, Y, Graubard, BI, Leitzmann, MF, Hollenbeck, A, Schatzkin, A, et al.. Meat and meat-related compounds and risk of prostate cancer in a large prospective cohort study in the United States. Am J Epidemiol 2009;170:1165–77. https://doi.org/10.1093/aje/kwp280.Search in Google Scholar PubMed PubMed Central
72. Gulis, G, Czompolyova, M, Cerhan, JR. An ecologic study of nitrate in municipal drinking water and cancer incidence in Trnava District, Slovakia. Environ Res 2002;88:182–7. https://doi.org/10.1006/enrs.2002.4331.Search in Google Scholar PubMed
73. Ward, MH, Cantor, KP, Riley, D, Merkle, S, Lynch, CF. Nitrate in public water supplies and risk of bladder cancer. Epidemiology 2003;14:183–90. https://doi.org/10.1097/01.ede.0000050664.28048.df.Search in Google Scholar
74. Zeegers, MP, Selen, RF, Kleinjans, JC, Goldbohm, RA, van den Brandt, PA. Nitrate intake does not influence bladder cancer risk: The Netherlands cohort study. Environ Health Perspect 2006;114:1527–31. https://doi.org/10.1289/ehp.9098.Search in Google Scholar PubMed PubMed Central
75. Volkmer, BG, Ernst, B, Simon, J, Kuefer, R, Bartsch, GJ, Bach, D, et al.. Influence of nitrate levels in drinking water on urological malignancies: a community-based cohort study. BJU Int 2005;95:972–6. https://doi.org/10.1111/j.1464-410x.2005.05450.x.Search in Google Scholar PubMed
76. Law, G, Parslow, R, McKinney, P, Cartwright, R. Non-Hodgkin’s lymphoma and nitrate in drinking water: a study in Yorkshire, United Kingdom. J Epidemiol Community Health 1999;53:383–4. https://doi.org/10.1136/jech.53.6.383.Search in Google Scholar PubMed PubMed Central
77. Cocco, P, Broccia, G, Aru, G, Casula, P, Muntoni, S, Cantor, KP, et al.. Nitrate in community water supplies and incidence of non-Hodgkin’s lymphoma in Sardinia, Italy. J Epidemiol Community Health 2003;57:510–1. https://doi.org/10.1136/jech.57.7.510.Search in Google Scholar PubMed PubMed Central
78. Ward, MH, Mark, SD, Cantor, KP, Weisenburger, DD, Correa-Villasenor, A, Zahm, SH. Drinking water nitrate and the risk of non-Hodgkin’s lymphoma. Epidemiology 1996;7:465–71. https://doi.org/10.1097/00001648-199609000-00003.Search in Google Scholar
79. Carlstrӧm, M, Persson, AE, Larsson, E, Hezel, M, Scheffer, PG, Teerlink, T, et al.. Dietary nitrate attenuates oxidative stress, prevents cardiac and renal injuries, and reduces blood pressure in salt-induced hypertension. Cardiovasc Res 2011;89:574–85. https://doi.org/10.1093/cvr/cvq366.Search in Google Scholar PubMed
80. EFSA. Nitrate in vegetables. Scientific opinion of the panel on contaminants in the food chain. Eur Food Saf Auth J 2008;689:1–79.10.2903/j.efsa.2008.689Search in Google Scholar
81. Petersson, J, Phillipson, M, Jansson, E, Patzak, A, Lundberg, JO, Holm, L. Dietary nitrate increases gastric mucosal blood flow and mucosal defense. Am J Physiol Gastrointest Liver Physiol 2007;292:G718. https://doi.org/10.1152/ajpgi.00435.2006.Search in Google Scholar PubMed
82. Berens, PD, Bryan, NS. Nitrite and nitrate in human breast milk: implications for development. In: Bryan, NS, Loscalzo, J, editors. Nitrite and nitrate in human health and disease. New York: Humana Press; 2011.10.1007/978-1-60761-616-0_9Search in Google Scholar
83. Warner, JX, Dickerson, RR, Wie, Z, Strow, LL, Wang, Y, Liang, Q. Increased atmospheric ammonia over the world’s major agricultural areas detected from space. Geophys Res Lett 2017;44:2875–84. https://doi.org/10.1002/2016gl072305.Search in Google Scholar
84. PHE. Compendium of chemical hazards: ammonia. Public Health England; 2019. Available from: https://assets.publishing.service.gov.uk/government/uploads/system/uploads/attachment_data/file/455704/Ammonia_TO_PHE_240815.pdf.Search in Google Scholar
85. Geddes, JA, Martin, RV, Boys, BL, van Donkelaar, A. Long-term trends worldwide in ambient NO2 concentrations inferred from satellite observations. Environ Health Perspect 2016;124:281–9. https://doi.org/10.1289/ehp.1409567.Search in Google Scholar PubMed PubMed Central
86. Theodorakidou, M, Lambrou, GI. Public health issues from the exposure to nitrogen oxides: a brief review. ARC J Public Health Community Med 2017;2:44–56.10.20431/2456-0596.0204008Search in Google Scholar
87. Frampton, MW, Boscia, J, Roberts, NJJr, Azadniv, M, Torres, A, Cox, C, et al.. Nitrogen dioxide exposure: effects on airway and blood cells. Am J Physiol Lung Cell Mol Physiol 2002;282:155–65. https://doi.org/10.1152/ajplung.2002.282.1.l155.Search in Google Scholar
88. WHO. Health effects of particulate matter. Policy implications for countries in Eastern Europe, Caucasus and Central Asia. Geneva: World Health Organization; 2013.Search in Google Scholar
89. Guo, S, Hu, M, Zamora, ML, Peng, J, Shang, D, Zheng, J, et al.. Elucidating severe urban haze formation in China. Proc Natl Acad Sci USA 2014;11:17373–8. https://doi.org/10.1073/pnas.1419604111.Search in Google Scholar PubMed PubMed Central
90. Pant, P, Shukla, A, Kohl, SD, Chow, JC, Watson, JG, Harrison, RM. Characterisation of ambient PM2.5 at a pollution hotspot in New Delhi, India and inference of sources. Atmos Environ 2015;109:178–89. https://doi.org/10.1016/j.atmosenv.2015.02.074.Search in Google Scholar
91. WHO. Ambient (outdoor) air quality and health. Geneva: World Health Organization; 2018.Search in Google Scholar
92. WHO. Ambient air pollution: a global assessment of exposure and burden of disease. Geneva: World Health Organization; 2016.Search in Google Scholar
93. Lee, CJ, Martin, RV, Henze, DK, Brauer, M, Cohen, A, van Donkelaar, A. Response of global particulate-matter-related mortality to changes in local precursor emissions. Environ Sci Technol 2015;49:4335–44. https://doi.org/10.1021/acs.est.5b00873.Search in Google Scholar PubMed
94. Pozzer, A, Tsimpidi, AP, Karydis, VA, de Meij, A, Lelieveld, J. Impact of agricultural emission reductions on fine-particulate matter and public health. Atmos Chem Phys 2017;17:12813–26. https://doi.org/10.5194/acp-17-12813-2017.Search in Google Scholar
95. Mokoena, KK, Ethan, CJ, Yu, Y, Shale, K, Liu, F. Ambient air pollution and respiratory mortality in Xi’an, China: a time-series analysis. Respir Res 2019;20:139. https://doi.org/10.1186/s12931-019-1117-8.Search in Google Scholar PubMed PubMed Central
96. Guo, H, Kota, SH, Sahu, SK, Hu, J, Ying, Q, Gao, A, et al.. Source apportionment of PM2.5 in North India using source-oriented air quality models 2017. Environ Pollut 2017;231:426–36. https://doi.org/10.1016/j.envpol.2017.08.016.Search in Google Scholar PubMed
97. Anderson, JO, Thundiyil, JG, Stolbach, AJ. Clearing the air: a review oft he effects of particulate matter air pollution on human health. J Med Toxicol 2012;8:166–75. https://doi.org/10.1007/s13181-011-0203-1.Search in Google Scholar PubMed PubMed Central
98. Pope, CA3rd, Burnett, RT, Thun, MJ, Calle, EE, Krewski, D, Ito, K, et al.. Lung cancer, cardiopulmonary mortality, and long-term exposure to fine particulate air pollution. J Am Med Assoc 2002;287:1132–41. https://doi.org/10.1001/jama.287.9.1132.Search in Google Scholar PubMed PubMed Central
99. Pinder, RW, Bettez, ND, Bonan, GB, Greaver, TL, Wieder, WR, Schlesinger, WH, et al.. Impacts of human alteration of the nitrogen cycle in the US on radiative forcing. Biogeochemistry 2013;114:25–40. https://doi.org/10.1007/s10533-012-9787-z.Search in Google Scholar
100. Ritchie, H, Roser, M. Ozone layer. Published online at OurWorldInData.org. Available from: https://ourworldindata.org/ozone-layer [Accessed Feb 2021].Search in Google Scholar
101. EEA. Air pollution by ozone. European Environment Agency; 2007. Available from: https://www.eea.europa.eu/data-and-maps/indicators/air-pollution-by-ozone.Search in Google Scholar
102. Lippmann, M. Health effects of tropospheric ozone: review of recent research findings and their implications to ambient air quality standards. J Expo Anal Environ Epidemiol 1993;3:103–29.Search in Google Scholar
103. IPCC. Climate change 2014: synthesis report. In: Core Writing Team, Pachauri, RK, Meyer, LA, editors. Contribution of Working Groups I, II and III to the fifth assessment report of the intergovernmental panel on climate change. Geneva: Intergovernmental Panel on Climate Change; 2014.Search in Google Scholar
104. Davidson, EA. The contribution of manure and fertilizer nitrogen to atmospheric nitrous oxide since 1860. Nat Geosci 2009;2:659–62. https://doi.org/10.1038/ngeo608.Search in Google Scholar
105. Thompson, RL, Lassaletta, L, Patra, PK, Wilson, C, Wells, KC, Gressent, A, et al.. Acceleration of global N2O emissions seen from two decades of atmospheric inversion. Nat Clim Change 2019;9:993–8. https://doi.org/10.1038/s41558-019-0613-7.Search in Google Scholar
106. Coskun, D, Britto, DT, Shi, WM, Kronzucker, HJ. Nitrogen transformations in modern agriculture and the role of biological nitrification inhibition. Nat Plants 2017;3:17074. https://doi.org/10.1038/nplants.2017.74.Search in Google Scholar PubMed
107. Crutzen, PJ. Atmospheric chemical processes of the oxides of nitrogen, including nitrous oxide. In: Delwiche, CC, editor. Denitrification, nitrification and atmospheric N2O. New York: John Wiley and Sons; 1981.Search in Google Scholar
108. Portman, RW, Daniel, JS, Ravishankara, AR. Stratospheric ozone depletion due to nitrous oxide: influence of other gases. Phil Trans Biol Sci 2012;367:1256–64.10.1098/rstb.2011.0377Search in Google Scholar PubMed PubMed Central
109. Anwar, F, Chaudhry, FN, Nazeer, S, Zaman, N, Azam, S. Causes of ozone layer depletion and its effects on human: review. Atmos Clim Sci 2016;6:129–34. https://doi.org/10.4236/acs.2016.61011.Search in Google Scholar
110. Kovats, RS, Ebi, KL. Heatwaves and public health in Europe. Eur J Publ Health 2006;6:592–9. https://doi.org/10.1093/eurpub/ckl049.Search in Google Scholar PubMed
111. Hegglin, MI. Twenty questions and answers about the ozone layer: 2014 update. Scientific assessment of ozone depletion. Geneva: World Meteorological Organization; 2015.Search in Google Scholar
112. Pearce, MS, Parker, L, Cotterill, SJ, Gordon, PM, Craft, AW. Skin cancer in children and young adults: 28 years’ experience from the Northern region young person’s malignant disease registry, UK. Melanoma Res 2003;13:421–6. https://doi.org/10.1097/00008390-200308000-00013.Search in Google Scholar
113. Gandini, S, Sera, F, Cattaruzza, MS, Pasquini, P, Picconi, O, Boyle, P, et al.. Meta-analysis of risk factors for cutaneous melanoma: II. Sun exposure. Eur J Canc 2005;41:45–60. https://doi.org/10.1016/j.ejca.2004.10.016.Search in Google Scholar PubMed
114. UNEP. Environmental effects of ozone depletion and its interaction with climate change. 2006 assessment. Nairobi: United Nations Environment Programme; 2006.Search in Google Scholar
115. Chauhan, A, Singh, RP. Decline in PM2.5 concentrations over major cities around the world associated with COVID-19. Environ Res 2020;187:109634. https://doi.org/10.1016/j.envres.2020.109634.Search in Google Scholar PubMed PubMed Central
116. Tobías, A, Carnerero, C, Reche, R, Massagué, J, Via, M, Minguillón, M, et al.. Changes in air quality during the lockdown in Barcelona (Spain) one month into the SARS-CoV-2 epidemic. Sci Total Environ 2020;726:138540. https://doi.org/10.1016/j.scitotenv.2020.138540.Search in Google Scholar PubMed PubMed Central
117. Sharma, S, Zhang, M, Anshika, Gao, J, Zhang, H, Kota, SH. Effect of restricted emissions during COVID-19 on air quality in India. Sci Total Environ 2020;728:138878. https://doi.org/10.1016/j.scitotenv.2020.138878.Search in Google Scholar PubMed PubMed Central
118. Rejmankova, E, Savage, HM, Rejmanek, M. Multivariate analysis of relationships between habitats, environmental factors and occurrence of Anopheline mosquito larvae Anopheles albimanus and A. pseuodopunctipennis in southern Chiapas, Mexico. J Appl Ecol 1991;28:827–41. https://doi.org/10.2307/2404210.Search in Google Scholar
119. Teng, HJ, Wu, YL, Wang, SJ, Lin, C. Effects of environmental factors on abundance of Anopheles minimus larvae and their seasonal fluctuations in Taiwan. Environ Entomol 1998;27:324–8. https://doi.org/10.1093/ee/27.2.324.Search in Google Scholar
120. Toth, SJ, Melton, TA. North Carolina Pest News. NC Coop Ext Serv 2000;11:16.Search in Google Scholar
121. Walker, ED, Lawson, DL, Merritt, RW. Nutrient dynamics, bacterial populations and mosquito productivity in tree-hole ecosystems and microcosms. Ecology 1991;72:1529–46. https://doi.org/10.2307/1940953.Search in Google Scholar
122. Gimnig, JE, Ombok, M, Kamau, L, Hawley, WA. Characteristics of larval anopheline (Diptera: Culicidae) habitats in Western Kenya. J Med Entomol 2001;38:282–8. https://doi.org/10.1603/0022-2585-38.2.282.Search in Google Scholar PubMed
123. US EPA. Cyanobacteria and cyanotoxins: information for drinking water systems. Washington DC: US Environmental Protection Agency, EPA-810F11001, Office of Water; 2014.Search in Google Scholar
124. Comiskey, NM, Lowrey, RC, Wesson, DM. Role of habitat components on the dynamics of Aedes albopictus from New Orleans. J Med Entomol 1999;36:313–20. https://doi.org/10.1093/jmedent/36.3.313.Search in Google Scholar PubMed
125. NRC. Clean coastal waters. Washington, DC: National Academy Press, National Research Council; 2000.Search in Google Scholar
126. Burkholder, JM. Implications of harmful microalgae and heterotrophic dinoflagellates in management of sustainable marine fisheries. Ecol Appl 1998;8:S37–62. https://doi.org/10.1890/1051-0761(1998)8[s37:iohmah]2.0.co;2.10.1890/1051-0761(1998)8[S37:IOHMAH]2.0.CO;2Search in Google Scholar
127. Carmichael, WW. Health effects of toxin-producing cyanobacteria: “The CyanoHABs”. Hum Ecol Risk Assess 2001;7:1393–407. https://doi.org/10.1080/20018091095087.Search in Google Scholar
128. Volterra, L, Boualam, M, Menesguen, A, Duguet, JP, Duchemin, J, Bonnefoy, X. European Commission Eutrophication and Health. Luxembourg: World Health Organization Regional Office for Europe. European Communities; 2002:28 p.Search in Google Scholar
129. Epstein, PR. Algal blooms in the spread and persistence of cholera. Biosystems 1993;31:209–21. https://doi.org/10.1016/0303-2647(93)90050-m.Search in Google Scholar
130. Coldwell, R, Huq, A. Marine ecosystems and cholera. Hydrobiologia 2001;460:141–5.10.1023/A:1013111016642Search in Google Scholar
131. Githeko, AK, Lindsay, SW, Confalonieri, UE, Patz, JA. Climate change and vector-borne diseases: a regional analysis. Bull World Health Organ 2000;78:1136–47.Search in Google Scholar
132. Rueda, LM, Patel, KJ, Axtell, RC, Stinner, RE. Temperature-dependent development and survival rates of Culex quinquefasciatus and Aedes aegypti (Diptera: Culicidae). J Med Entomol 1990;27:892–8. https://doi.org/10.1093/jmedent/27.5.892.Search in Google Scholar
133. Gillies, MT. The duration of the gonotrophic cycle in Anopheles gambiae and A. funestus with a note on the efficiency of handcatching. East Afr Med J 1953;30:129–35.Search in Google Scholar
134. Kovats, RS, Edwards, SJ, Hajat, S, Armstrong, BG, Ebi, KL, Menne, B. The effect of temperature on food poisoning: a time-series analysis of salmonellosis in ten European countries. Epidemiol Infect 2004;13 2:443–53. https://doi.org/10.1017/s0950268804001992.Search in Google Scholar
135. D’Souza, RM, Becker, NG, Hall, G, Moodie, K. Does ambient temperature affect foodborne disease? Epidemiology 2004;15:86–92. https://doi.org/10.1097/01.ede.0000101021.03453.3e.Search in Google Scholar
© 2021 Walter de Gruyter GmbH, Berlin/Boston
Articles in the same Issue
- Frontmatter
- Mini Reviews
- Unani medicinal herbs as potential air disinfectants: an evidence-based review
- Safety assessment of natural products in Malaysia: current practices, challenges, and new strategies
- Environmental and occupational health on the Navajo Nation: a scoping review
- Review Articles
- Understanding Holism in the light of principle underlying practice of Unani Medicine
- Investigating the field effectiveness of respirators against metal particle exposure in various workplaces: a systematic review
- To which extent are per-and poly-fluorinated substances associated to metabolic syndrome?
- Reactive nitrogen compounds and their influence on human health: an overview
- Millimeter (MM) wave and microwave frequency radiation produce deeply penetrating effects: the biology and the physics
- Air pollution increases the risk of pulmonary embolism: a meta-analysis
- Housing and health in vulnerable social groups: an overview and bibliometric analysis
- Environmental arsenic exposure and its toxicological effect on thyroid function: a systematic review
- Letters to the Editor
- Comments on Martin Pall, “Millimeter (MM) wave and microwave frequency radiation produce deeply penetrating effects: the biology and the physics”, Rev Environ Health 2021;37:247–58.
- Comments on Pall’s “Millimeter (MM) wave and microwave frequency radiation produce deeply penetrating effects: the biology and the physics”
- ‘Proof of EHS beyond all reasonable doubt’. Comment on: Leszczynski D. Review of the scientific evidence on the individual sensitivity to electromagnetic fields (EHS). Rev Environ Health 2021; https://doi.org/10.1515/reveh-2021-0038. Online ahead of print
- Why scientifically unfounded and misleading claim should be dismissed to make true research progress in the acknowledgment of electrohypersensibility as a new worldwide emerging pathology
- Comments on the article by Dariusz Leszczynski: Review of the scientific evidence on the individual sensitivity to electromagnetic fields (EHS). Rev Environ Health 2021