KPI-based standards benchmarking for the preference of different analytical approaches developed for simultaneous determination of ciprofloxacin and hydrocortisone: A SWOT case study
-
Christine Nessim
 ,
Mohamed El Hamd
,
Reem Obaydo
,
Sarah Saleh
,
Mohamed El Hamd
,
Reem Obaydo
,
Sarah Saleh

Abstract
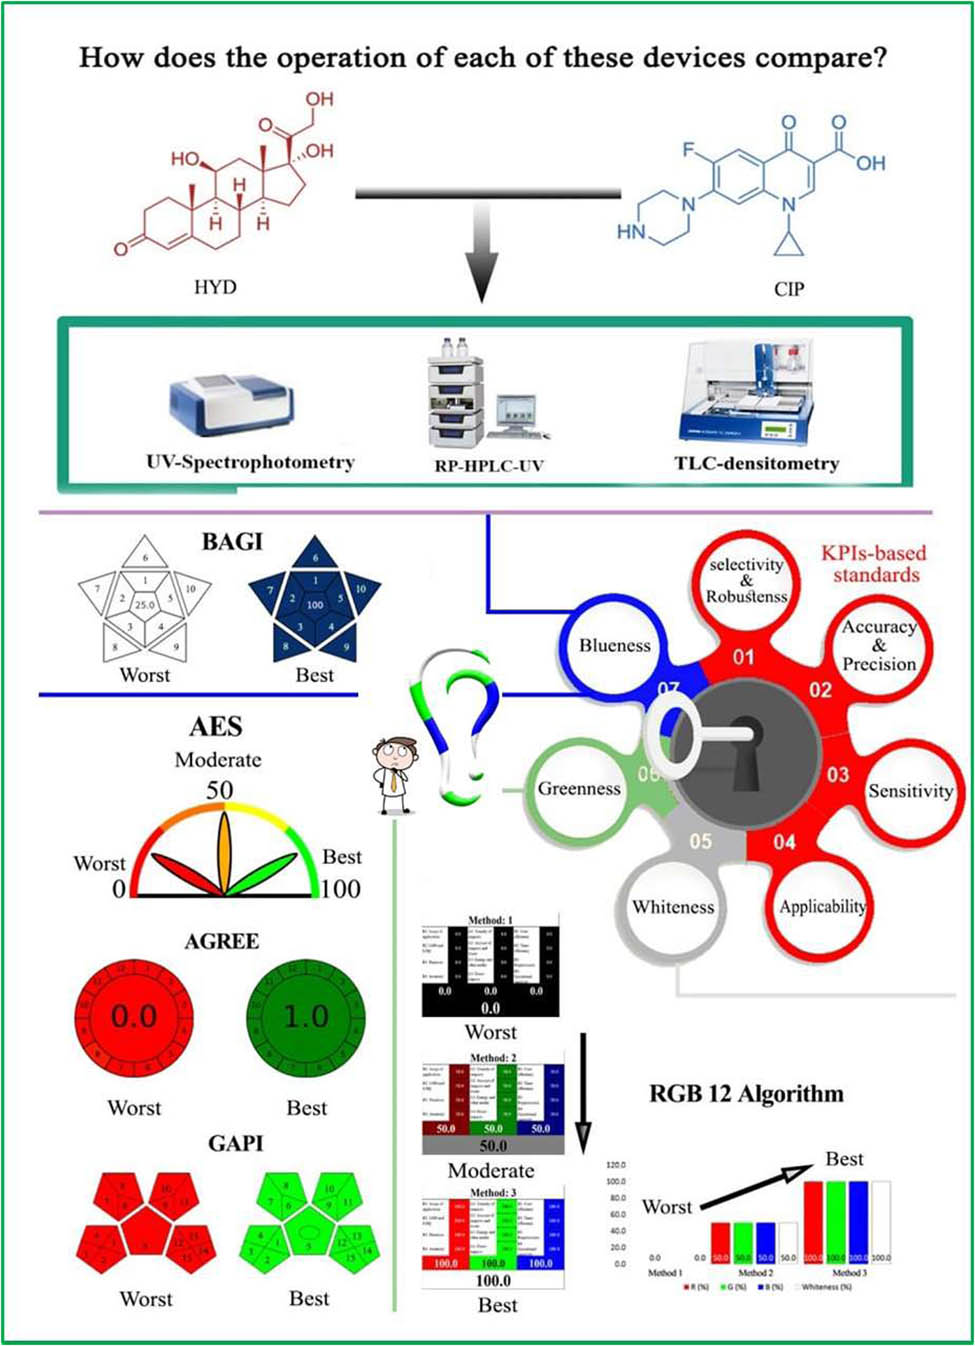
This study aims to prefer the suitability of an analytical approach developed for simultaneously determining ciprofloxacin hydrochloride (CIP) and hydrocortisone (HYD) in their ear drop dosage form. The preference between the three known instruments was utilized, namely UV-spectrophotometry, reversed phase-high-performance liquid chromatography (RP-HPLC)-UV, and thin-layer chromatography (TLC)-densitometry. The instrumentational studies determined that the mathematical UV methods (utilized various manipulation designs such as the isoabsorptive point, absorbance ratio, extended ratio subtraction, ratio difference, and mean centering of ratio spectra) had linearities in the range of 2.0–14.0 and 1.0–14.0 µg·mL−1, the RP-HPLC-UV method showed a linearity range of 1.0–8.0 µg·mL−1, and the TLC-spectrodensitometric method had linearity ranges of 0.2–1.6 µg/band and 0.6–2.0 µg/band for both CIP and HYD, respectively. The analytical performance, validity, and greenness of the approaches were evaluated through the benchmarking of key performance indicator (KPI)-based standards and a SWOT (strengths, weaknesses, opportunities, and threats) analysis. The KPIs and SWOT study focused on several aspects, including (1) the selectivity and robustness of the methods, (2) sensitivity, (3) accuracy and precision, (4) applicability, (5) whiteness, (6) greenness, and (7) blueness. However, the assessment of whiteness, greenness, and blueness was conducted using well-known ecological assessment tools such as the RGB12 Algorithm, Analytical Eco-Scale, AGREE, GAPI, and Blue Applicability Grade Index. In conclusion, based on the findings, UV-spectrophotometry emerged as the most practically convenient approach. It demonstrated advantages based on the predetermined KPI-based standards. Furthermore, UV-spectrophotometry was deemed to be the most environmentally friendly option.
Graphical abstract
1 Introduction
Ciprofloxacin hydrochloride (CIP; Figure 1(a) [1]) is a medicine commonly used to treat invasive salmonella infections. It is not recommended for individuals under the age of 18, and the dosage should be adjusted for patients with renal impairment [2]. Hydrocortisone (HYD; Figure 1(b) [3]) is an artificial cortisol-like steroid hormone used in the treatment of congenital adrenal hyperplasia as an alternative to cortisol [4]. When combined as ear drops, CIP and HYD are used to treat otitis externa, which is a bacterial infection that affects the outer ear canal. Symptoms of otitis externa include swelling, redness, and pain in the ear canal and outer ear [5]. Several methods have been reported for determining CIP, namely, direct UV-spectrophotometry [6,7,8], UV-chemometric [9,10], reversed phase-high-performance liquid chromatography (RP-HPLC) with different spectroscopic detectors [11,12], thin-layer chromatography (TLC) [13,14], and capillary electrophoresis [15,16]. Similarly, for HYD, reports have been made using UV-spectrophotometry [17], RP-HPLC-UV [18,19,20], capillary electrophoresis [21], and micellar electrokinetic capillary chromatography [22,23].
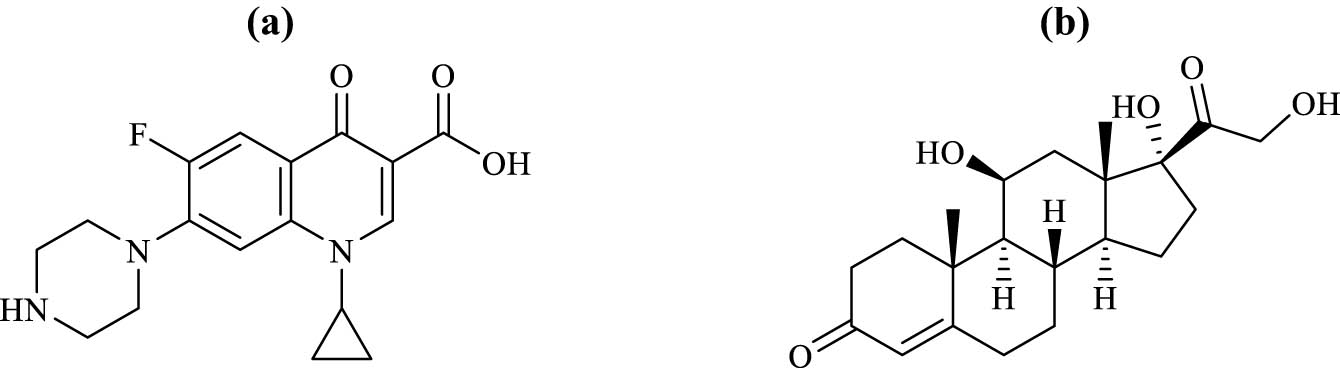
Chemical structures of the cited drugs: (a) CIP and (b) HYD.
A group of authors recently conducted a scientific exploration to improve the analysis of CIP and HYD. They developed UV-spectrophotometric methods to estimate these substances in their pure and pharmaceutical forms. They introduced two new techniques called the extended ratio subtraction and ratio difference techniques and compared them to the established methods like mean centering of ratio spectra, isoabsorptive point spectrophotometric, and absorbance ratio methods [20]. They then expanded their exploration into instrumentation, utilizing reversed-phase high-performance liquid chromatography-UV detection (RP-HPLC-UV) and TLC-spectrodensitometric detection (TLC-spectrodensitometric) methods to separate and quantify the same binary mixture of CIP and HYD in their ear preparation. Their work showcased innovation in pharmaceutical analysis and expanded analytical capabilities [24]. However, the utilization of multiple instruments under different conditions for the separation of the same mixture raises a logical question regarding the comparison of their operation and the determination of preferences.
TLC is affordable and user-friendly, allowing comprehensive detection of compounds using sequential steps and appropriate separation techniques [25]. However, its subjectivity makes it a semi-quantitative approach, requiring careful validation [26,27,28]. RP-HPLC is essential for routine separation of complex mixtures, but the choice of detector system may limit the availability of structural data [29]. The chemical composition and physicochemical properties of the sample influence the selection of RP-HPLC technique, stationary and mobile phases, and detector type [30]. However, the RP-HPLC process in multicomponent analysis is influenced by sample characteristics, analytes, and matrix composition, requiring choices in the sample preparation, column selection, mobile phase, detection method, and quantitation approach. UV-spectrophotometry has been explored as an alternative technique for the analysis of CIP and HYD by TLC and RP-HPLC, taking into account the presence of co-formulated drugs, excipients, and degradation products. The application of the univariate resolution technique in UV-spectrophotometry allows for selective analysis of multiple drugs simultaneously, eliminating the need for prior chemicals [31,32,33].
The background information given above emphasizes that when researchers search for a method to assess a multicomponent dosage form, they encounter various options. Evaluating the suitability of each method based on certain standards attached to key performance indicators (KPIs) is crucial. Moreover, adherence to global standards such as ICH [34] and USP [35] is crucial in developing new analytical methods. Sustainability is increasingly important, with the RGB12 algorithm assessing “whiteness” based on white analytical principles (white analytical chemistry [WAC]) [36]. Green analytical chemistry (GAC) principles, including metrics like Analytical Eco-Scale (AES), AGREE [37,38,39,40], and Green Analytical Procedure Index (GAPI) [41,42,43], evaluate the environmental impact of methods. These tools improve environmental assessments and prioritize practicality in routine analytical laboratories. The Blue Applicability Grade Index (BAGI) offers a straightforward assessment of the practical application or “blueness” of analytical methods [44].
The novelty of this research work is that the researchers implemented KPI-based benchmarking standards to assess analytical methods’ efficiency. By tracking KPIs such as [1] selectivity and robustness, [2] sensitivity, [3] accuracy and precision, [4] applicability with its own statistics confirmation (in the form of F-value and t-test), [5] sustainability, [6] greenness, and [7] blueness (as demonstrated in Figure 2). However, the researchers were able to identify inefficiencies in the developed methods and implement corrective measures that could be used as a guideline in future research. As a result, the research in analytical methods saw a significant increase in its output and reduced downtime, leading to cost savings and improved efficiency. Overall, this study demonstrates how the application of KPI-based standards can lead to a comprehensive evaluation of the environmental impact and practicality of the methods under consideration. Thus, it highlights the analytical method of high performance that could be used in quality control laboratories to achieve effective sustainability objectives. Ear drops, a combination of CIP and HYD, are widely used by healthcare professionals for the management of ear infections; thus, it was chosen in this study as an example of a simple binary mixture determined by spectrophotometric and chromatographic techniques so that researchers can analyze the effects of different analytical techniques without the added complexity of a complex mixture. This allows researchers to focus on the specific attributes of each analytical technique and determine which method is the most effective and sustainable for use in quality control laboratories. Overall, studying the efficacy and sustainability of different analytical techniques on a simple mixture gives the opportunity for more accurate and reliable comparisons, helping to develop future research and advancements in analytical chemistry.
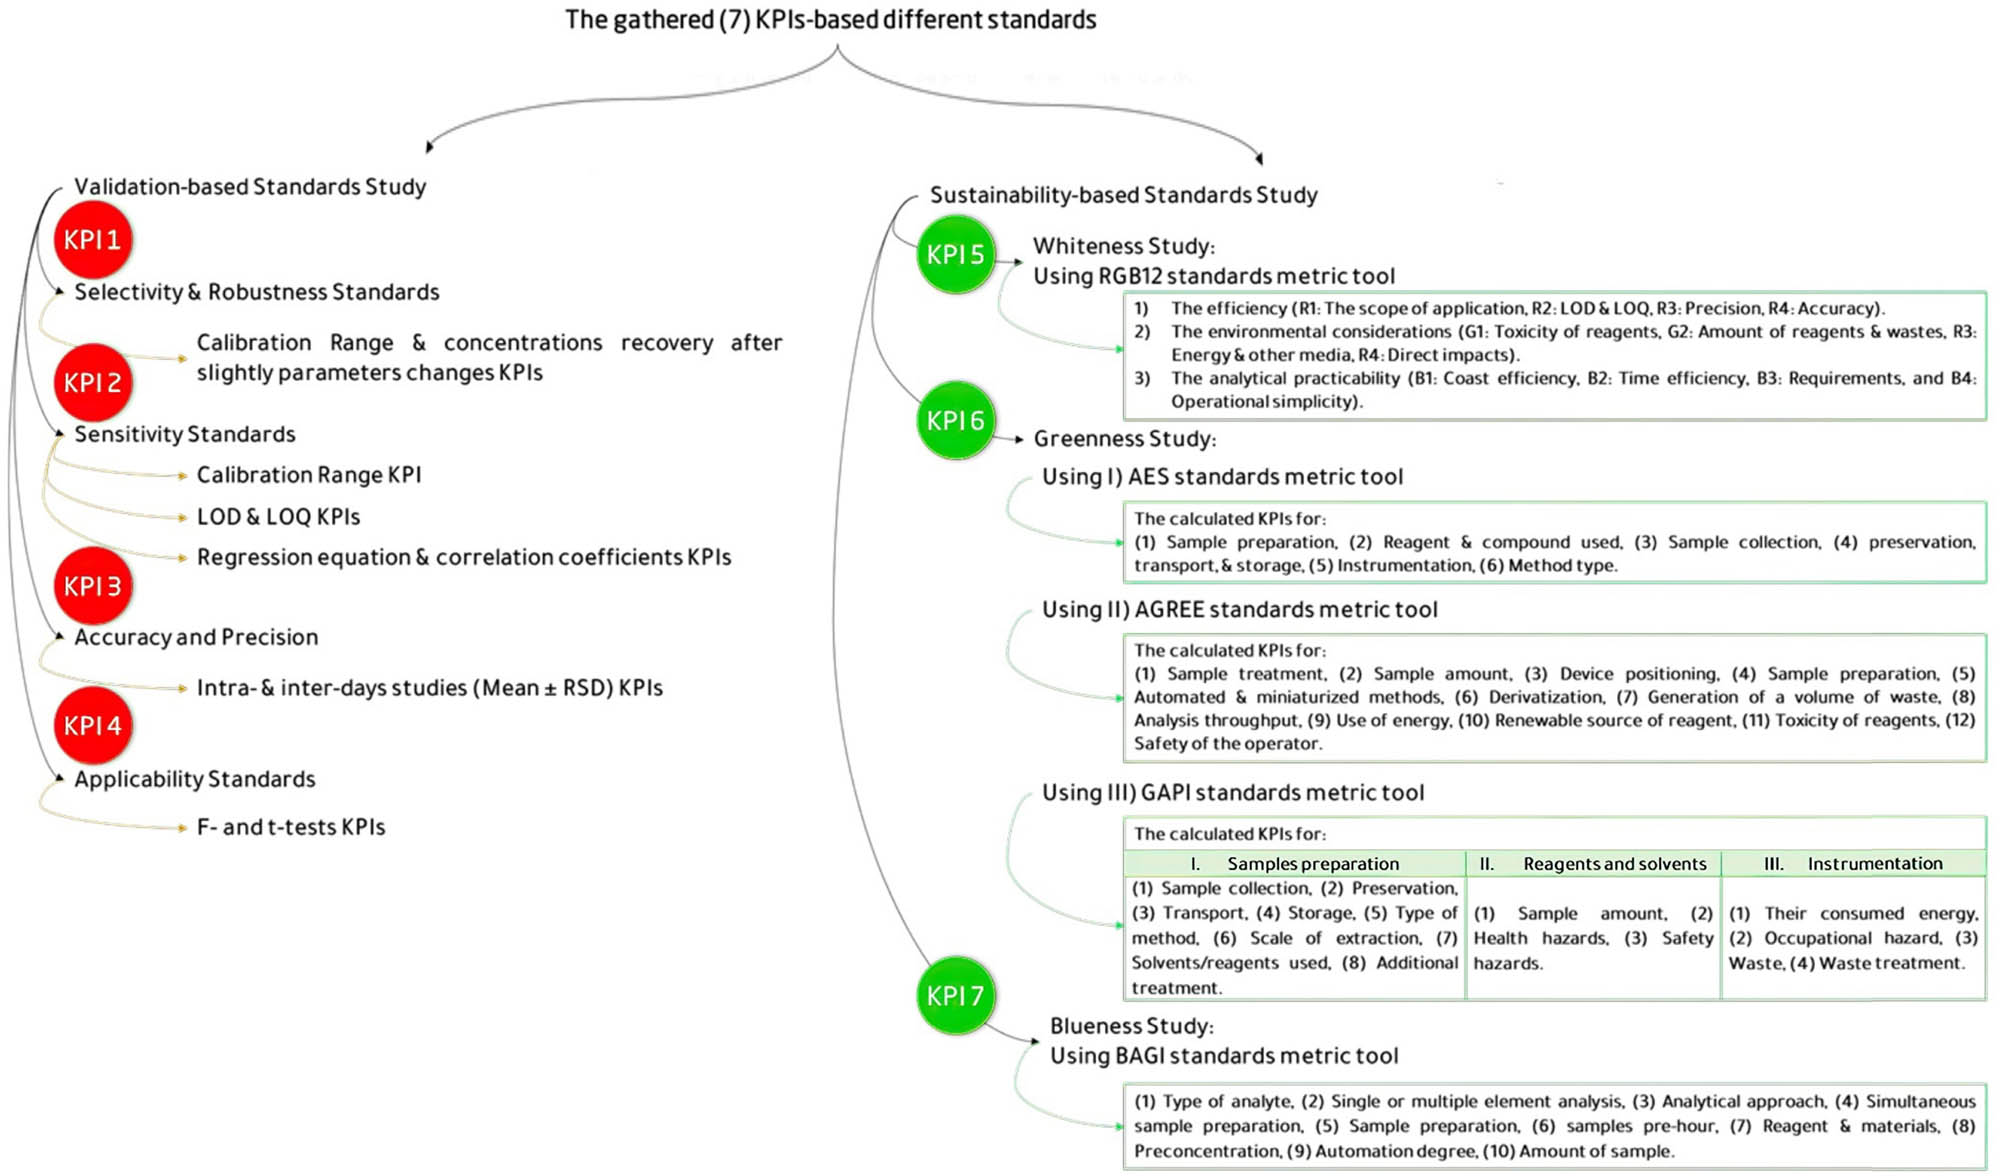
Standards used and their KPIs for comparison.
Consequently, the objective of this study is to compare and evaluate the efficacy, accuracy, and environmental sustainability of the developed approaches for the routine analysis of CIP and HYD. Additionally, the study aims to provide recommendations and insights for selecting the best tools and techniques commonly used for pharmaceutical analysis, either individually or in combination. In a case study, the authors compared their developed analytical tools with previously published methods (UV-spectrophotometric, RP-HPLC-UV, and TLC-spectrodensitometric) for analyzing a binary mixture of drugs (CIP and HYD). However, different standards (Figure 2) were adopted based on KPIs such as (1) selectivity and robustness, (2) sensitivity, (3) accuracy and precision, (4) applicability, (5) sustainability, (6) greenness, and (7) blueness. Moreover, the study extensively explores and compares the efficacy of analytical methodologies, with a particular emphasis on conducting a SWOT analysis to highlight the advantages of UV-spectrophotometry over chromatographic separations in terms of efficiency and environmental impact.
2 Materials and methods
2.1 Standards powder, chemical, and solvents
CIP was supplied by Egyptian International Pharmaceutical Industries Co. (Cairo, Egypt), and HYD was supplied by Sigma Pharmaceutical Industries Limited (Al-Monofeya, Egypt). The purity of both drugs, as determined by the official method outlined in the British Pharmacopoeia, ranged from 99.9 to 100.5 [45]. Commercial ear drops containing 2.3 mg·mL−1 CIP and 10 mg·mL−1 HYD were used to test the developed and compared methods. Analytical- and HPLC-grade solvents were provided by S.D. Fine-Chem Limited (Mumbai). HPLC-grade chemicals, such as sodium hydroxide, ethyl acetate, ammonia solution, and O-phosphoric acid, were used. Triethylamine, chloroform, methanol, and acetonitrile were obtained from Lobachemie and LabScan Limited. System suitability parameters, including peak symmetry and resolution (Rs), were calculated following the USP guidelines [35].
2.2 Standard stock and working solutions
CIP and HYD stock solutions were prepared in a solvent mixture of methanol and water (80:20%, v/v) at concentrations of 1.0 and 0.5 mg·mL−1, respectively, for UV-spectrophotometric techniques. Working solutions of both drugs at a concentration of 20.0 μg·mL−1 were freshly prepared by diluting the stock solutions with a solvent mixture. The solvent mixture was used as a blank for measuring the zero-order absorption spectra (D0) of the 5.0 μg·mL−1 HYD and CIP solutions. In the RP-HPLC-UV method, new working solution t concentrations of 10.0 μg·mL−1 for CIP and HYD were prepared by diluting the stock solutions with the mobile phase. For TLC spectrodensitometric techniques, new working solutions at concentrations of 200.0 μg·mL−1 for both drugs were prepared by diluting the stock solutions with the same solvent. All solutions remained stable for 3 weeks when stored at 4°C in dark bottles, as confirmed by stability testing using the reported methods [18,46].
2.3 Instrumentation
UV-spectrophotometric measurements were conducted using a Shimadzu UV-1800 double-beam UV-visible spectrophotometer equipped with 1 cm quartz cells and a wavelength range of 200–800 nm. The spectrophotometer adjustments were facilitated using Shimadzu UV-Probe 2.32 software. For mean centering of the ratio spectra, Matlab® Version 7.9 was utilized.
HPLC analysis was performed using an Agilent 1200 series chromatographic system, which included a thermostatic column compartment, variable wavelength UV-VIS detector, micro vacuum degasser, quaternary pump, and autosampler. Data processing and collection were carried out using Agilent ChemStation software, version A.10.01. The column used was Agilent Zorbax SB-C18 (150 mm × 4.6 mm, 5 µm particle size). The mobile phase consisted of a mixture of acetonitrile, bidistilled water, and a pH-controlled solution (pH 3) in a ratio of 55:40:5 (v/v/v). The pH-controlled solution contained 1% triethylamine in bidistilled water, adjusted to pH 3 with O-phosphoric acid. The mobile phases were filtered through a 0.45 μm Millipore membrane filter and supplied at a flow rate of 0.6 mL·min−1. Injection volumes of 20 μL were used for both drugs, and the detection wavelength was set at 256 nm. System suitability parameters, including retention time, tailing factor, theoretical plate count (N), height of theoretical plate, and resolution, were calculated according to USP guidelines [35].
For TLC spectrodensitometry, a Camag TLC scanner 3 with winCATS software was used. The system included a Linomat 5 autosampler, a Camag microsyringe (100 µL), and a TLC aluminum sheet (20 cm × 20 cm) precoated with silica gel 60 F254. The samples were applied as bands with a bandwidth of 6 mm, located 1 cm from the bottom edge of the TLC plate. Each band received 10 μL of sample from a 100 µL syringe. The developing system consisted of a mixture of ethyl acetate, hexane, and triethylamine in a ratio of 50:25:25 (v/v/v). Linear ascending development was performed for 1 h at room temperature in a chromatographic tank previously saturated with the developing system. After air drying, the developed plates were scanned at 243 nm using the Camag TLC scanner 3 in absorbance mode, with a 3 mm × 0.45 mm slit size and a scanning speed of 20 mm·s−1.
A “Jenway 3505” pH meter (Jenway, UK) with a combined glass electrode was used to adjust the pH.
2.4 Building up the calibration curves
Aliquots were taken from the working solutions to prepare solutions with concentrations ranging from 2.0 to 14.0 μg·mL−1 of CIP and 1.0 to 14.0 μg·mL−1 of HYD. These solutions were prepared in volumetric flasks filled with an 80:20 methanol/water solvent mixture. The solvent mixture was used as a blank to record the zero-order absorption spectra (D0) of the CIP and HYD solutions, which were scanned between 200 and 400 nm and stored using computer software (Figure 3(a)). Regression equations were derived to separate CIP and HYD in a mixture by manipulating the original spectrum. The resulting spectra were then analyzed according to the procedures outlined in Table S1. To modify the original UV-spectrum (D0) of the combined drug mixture, the UV-Probe software’s built-in iso-absorptive point was utilized. The detailed manipulating theory for each spectrophotometric approach is discussed in Table S2.
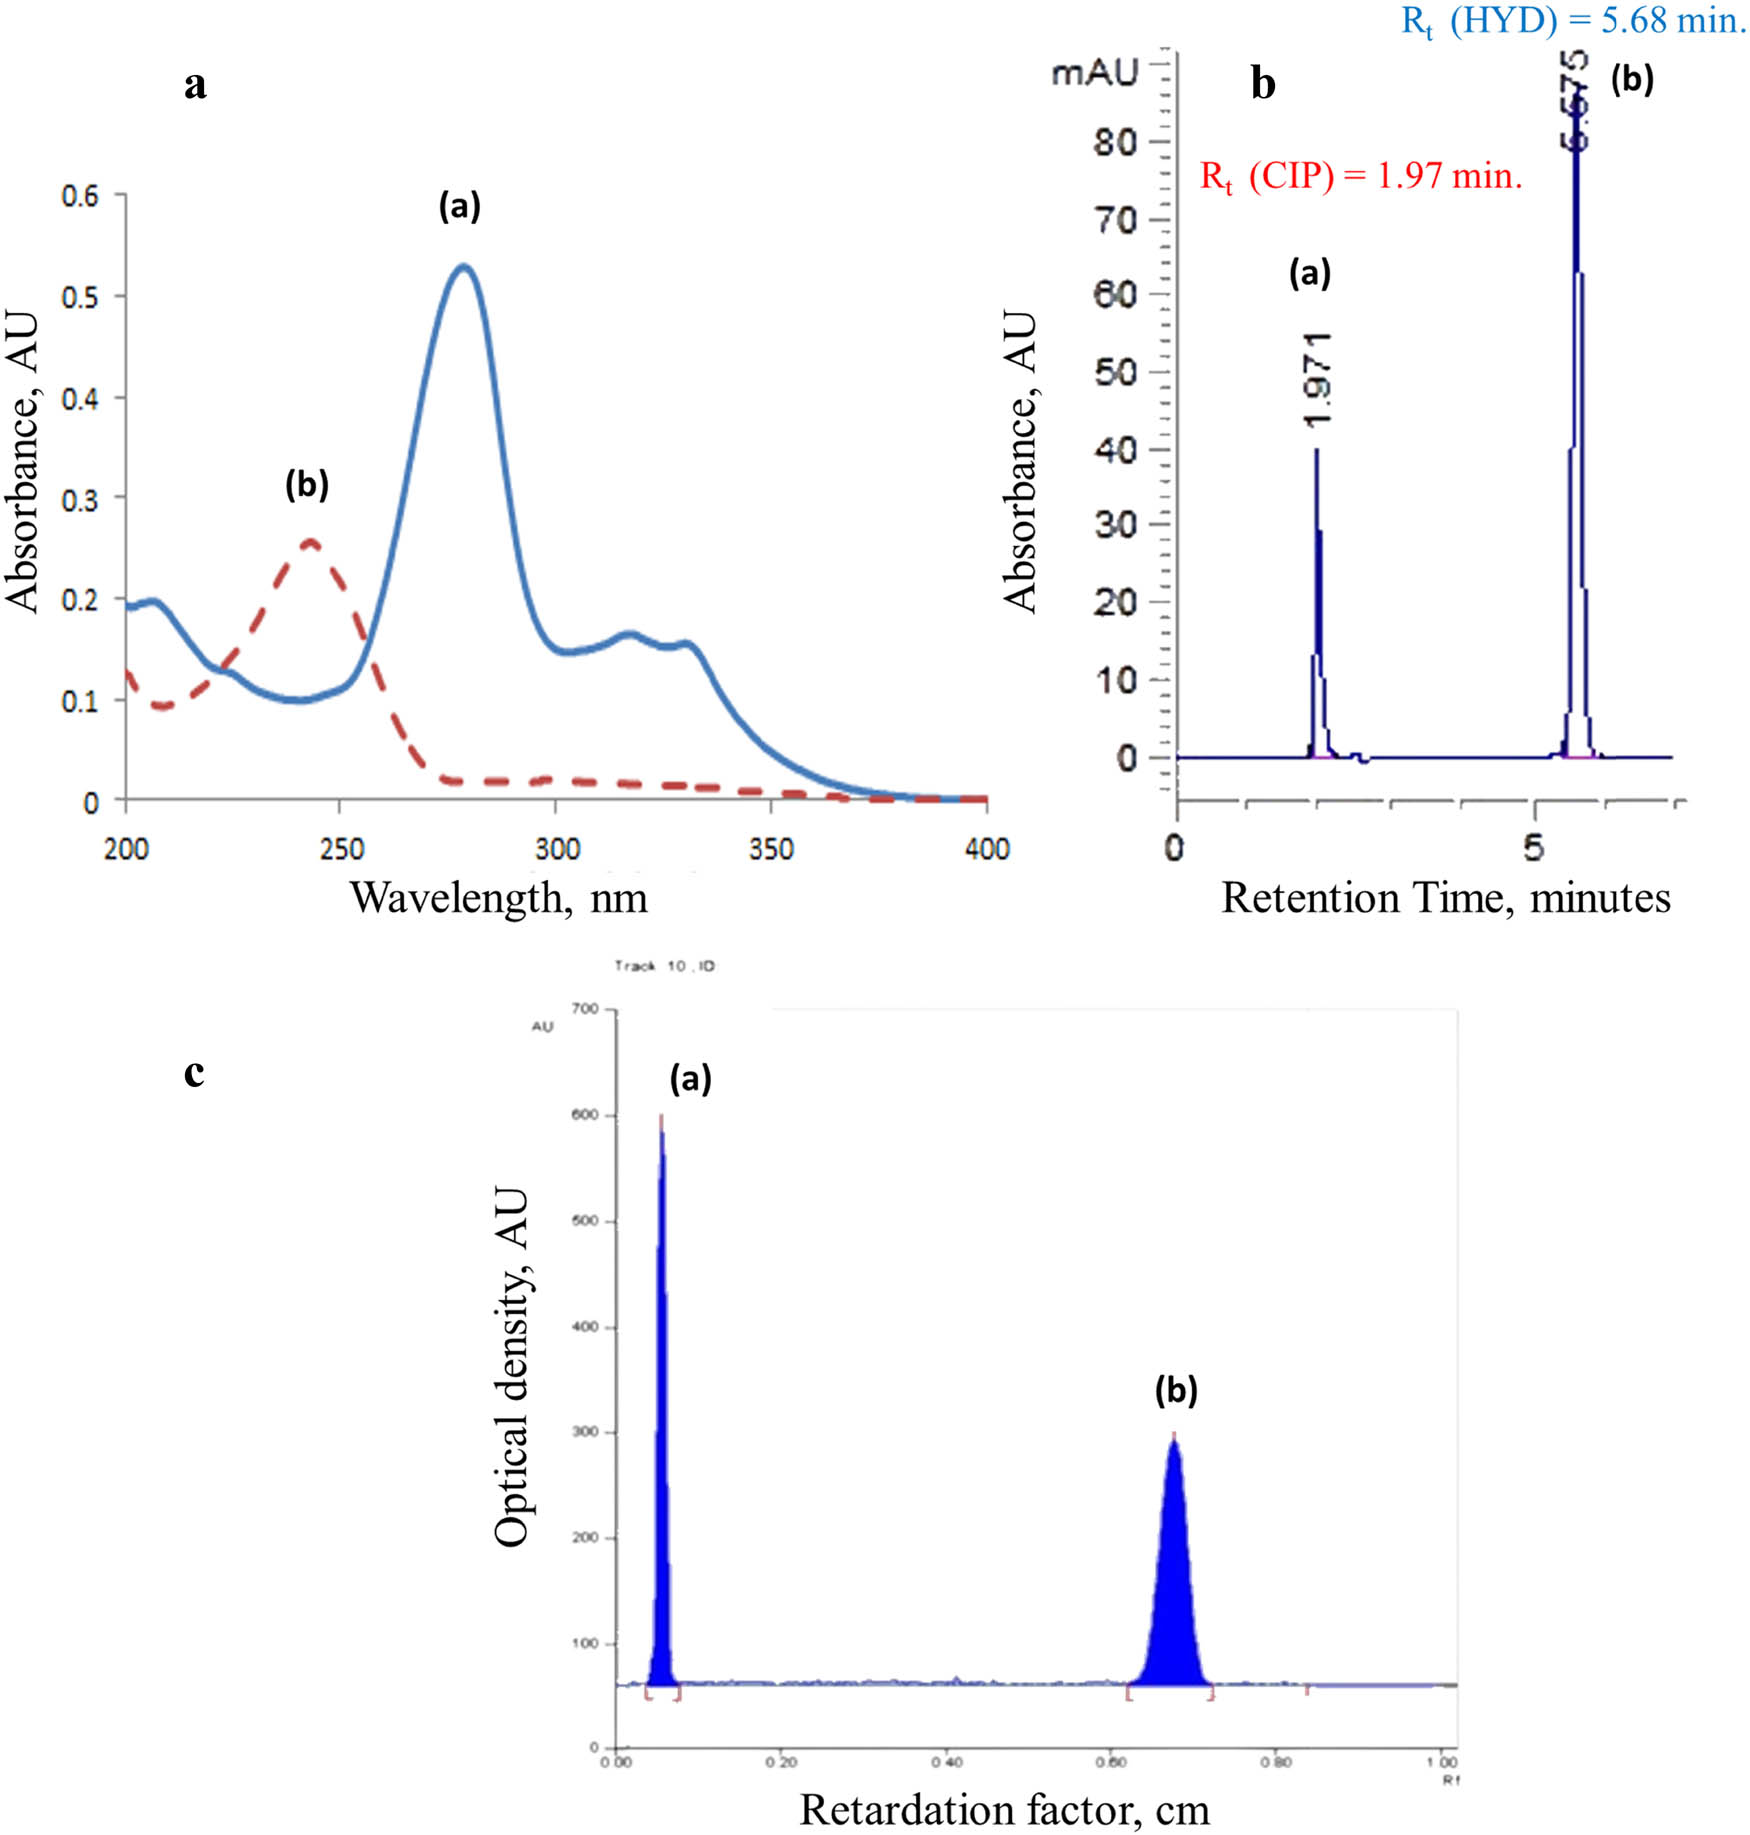
(a)–(c): Analytical signals for CIP and HYD standards were measured using three different methods: (a) UV-spectrophotometry (D0, 5 µg·mL−1 of both drugs). (b) PH-HPLC-UV (a) CIP, 2 μg·mL−1 and (b) HYD 6 μg·mL−1, using C18 column and mobile phase of acetonitrile/ distilled water/ pH-controlled solution (pH 3.0) in a ratio 55:40:5 v/v/v) (flow rate of 0.6 mL·min−1 at 256 nm). (c) TLC-densitometry, (a) 1.2 μg/band CIP and (b) 0.6 μg/band HYD using ethyl acetate/hexane/triethylamine (50:25:25 v/v/v) as a developing system.
Calibration curves were created for CIP and HYD by plotting the relative peak area against the concentrations (μg·mL−1) in the case of RP-HPLC-UV separations, as shown in Figure 3(b). Triple-fashioned calibration curves were constructed within the range of 1.0–8.0 μg·mL−1 at 256 nm. In the case of TLC-spectrodensitometry, the calibration curves were generated by plotting the recorded peak area multiplied by 10−3 against the concentrations, as depicted in Figure 3(c). The calibration curves for TLC-spectrodensitometry were established in three different ranges: 0.2–1.6 μg·mL−1 for CIP and 0.6–2.0 μg/band for HYD. In TLC-spectrodensitometry, a linear ascending development was carried out in a chromatographic tank saturated with the developing system. The development process occurred at room temperature for over 1 h, covering a distance of approximately 8 cm from the lower edge. Subsequently, the plates were air-dried. More information about the chromatographic conditions and separation trials using RP-HPLC-UV and TLC-spectrodensitometric methods can be found in Table S3 and the study of Elgizawy et al. [24].
2.5 Application to laboratory-prepared mixtures
The working solutions of CIP and HYD were transferred into a series of 10 mL measuring flasks. Aliquots consisting of eight points, corresponding to 50.0, 20.0, 20.0, 80.0, 40.0, 90.0, 60.0, and 20 µg and 50.0, 40.0, 60.0, 40.0, 60.0, 30.0, 40.0, and 100 µg, were filled with a solvent mixture of methanol/water (80:20 v/v). The mixture solutions were then formed by thoroughly mixing the liquids in the same order. The computer was utilized to store the spectra of the prepared standard solutions, which were scanned between 200 and 400 nm. For RP-HPLC-UV and TLC-spectrodesitometry, to create solutions with various ratios, distinct aliquots of the drugs were precisely transferred from their working solutions and combined. For the mixture prepared in the lab, the chromatographic conditions of the method were used, and the corresponding regression equation was used to determine the concentrations of each drug. Every concentration was tested using the mean of three different runs.
2.6 Assessment of pharmaceutical dosage form
Precisely, 1 mL of the pharmaceutical dosage form solution was transferred to a 100 mL volumetric flask and diluted with a solvent mixture of methanol and water (80:20 v/v) to obtain 0.230 mg·mL−1 CIP and 1.0 mg·mL−1 HYD. The resultant solution was filtered through a 0.45 μm Millipore syringe membrane filter. Next, using the same solvent, a suitable dilution was created to create the working solution containing 2.3 μg·mL−1 CIP and 10 μg·mL−1 HYD in the case of spectrophotometric methods. In the case of RP-HPLC-UV methods, the working solutions were 1.15 μg·mL−1 of CIP and 5.0 μg·mL−1 of HYD. However, a suitable dilution was made with methanol to prepare the working solution for the TLC-spectrodensitometric method, yielding a solution containing 100.0 μg·mL−1 HYD and 23.0 μg·mL−1 CIP.
2.7 Method validation
For each of the developed methods, method validation was carried out in accordance with ICH guidelines [47]. Next, the KPI-based standards of the tested methods (which account for four parameters) were compared and benchmarked. The four validation KPI-based standards were in the form of (1) method selectivity and robustness, (2) method sensitivity (range, linearity, limit of detection [LOD], and limit of quantification [LOQ]), (3) method accuracy and precision, and (4) method applicability regarding the dosage forms without further pretreatment procedure(s) were gathered and compared for their accomplishment.
2.7.1 Selectivity and robustness
The selectivity of the suggested method was determined by analyzing various synthetic mixtures of CIP and HYD within the linearity range. Additionally, the robustness of the methods was assessed by examining different experimental conditions.
Spectral measurements of three concentrations (2.0, 4.0, 6.0 µg·mL−1) of CIP and HYD were taken using different methanol ratios in the solvent (75, 70, and 65%) and analyzed three times with the proposed methods.
Chromatographic determinations were conducted with slight deviations in pH (±0.5), and the mobile phase composition (acetonitrile proportion) was tested with variations of ±2% for RP-HPLC-UV. For TLC-spectrodensitometry, ethyl acetate ratios were tested up to ±2%.
2.7.2 Sensitivity
The linearity of the developed methods was assessed by processing calibration curves on three separate days. The concentration ranges for the calibration curves were selected based on the anticipated drug’s concentration during the assay of the commercial dosage form, ear drops. The ranges were as follows:
UV-spectrophotometry: CIP: 2.0–14.0 μg·mL−1 and HYD: 1.0–14.0 μg·mL−1.
RP-HPLC-UV method, for both drugs 1.0–8.0 μg·mL−1.
TLC-spectrodensitometric method: CIP: 0.2–1.6 μg/band and HYD: 0.6–2.0 μg/band
The LOD and LOQ for both drugs were calculated using the proposed methods. The LOD was determined as 3.3 times the standard deviation (SD) of the blank, and the LOQ was calculated as 10 times the SD of the blank divided by the slope of the calibration line.
2.7.3 Accuracy and precision
The methods within the linearity range were repeated three times to determine various blind concentrations of pure drug powder, aiming to assess the accuracy of the suggested methods. The interference of excipients was investigated by employing the standard addition method on the pharmaceutical formulation. To determine the precision of the proposed methods, three distinct concentrations of pure drugs within the linearity range were analyzed, and the precision was expressed as the relative standard deviation (RSD). Intra-day precision was determined by conducting three replicate analyses of three pure drug samples on the same day. Inter-day precision was calculated by examining the samples over the course of 3 days.
2.7.4 Applicability and statistical evaluation
The statistical comparison of the results obtained by the proposed methods and official methods [45] has been benchmarked. The calculated F- and t-values were tested with planning for target values less than the theoretical ones to indicate that there was no significant difference between the proposed and the official methods with respect to accuracy and precision. One-way ANOVA was applied to compare developed methods. Moreover, a statistical comparison was conducted between the outcomes obtained from the official methods and the proposed method for identifying pure samples of CIP and HYD [45].
2.8 Sustainability profile study
2.8.1 RGB12 algorithm
The sustainability (whiteness) of the developed methods was assessed using the RGB12 algorithm, which examines the 12 principles of WAC. This algorithm correlates the efficiency (red scale), environmental considerations (green scale), and feasibility/economic aspects (blue scale) of the methods. The RGB12 algorithm provides a comprehensive framework for assessing whiteness. An Excel worksheet with red, green, and blue columns was used to calculate scores for each criterion, resulting in mean values for the three primary colors and an overall average (Table S4). These average values collectively demonstrate the whiteness level of the methods. The accompanying chart illustrates the percentage distribution of each color and the total white result, enabling a concise evaluation of whiteness. The RGB12 algorithm serves as a pre-selection KPI-based standard benchmarking evaluation tool for analyzers, fulfilling the primary objective requirements of the analytical procedure. It allows for a comprehensive evaluation of the method’s green attributes, practicality, and validity.
2.8.2 Greenness assessment
To assess the greenness of the developed methods, three complementary tools were utilized: AES, AGREE, and GAPI. These tools served as KPI-based standard benchmarking for GAC. Each tool had specific criteria and KPIs used for benchmarking, which often resulted in penalty points (Pps). Table S5 shows the utilized standards regarding each tool.
AES tool evaluated environmental sustainability using a scale where scores above 75 indicated excellent performance, scores above 50 indicated acceptable performance, and scores below 50 suggested inadequate performance. The scores were represented by colors, with red indicating poor performance [48,49].
AGREE program consisted of a circular pictogram representing 12 GAC principles. Each principle was ranked on a scale of 0 (red, concept not met) to 1 (dark green, concept met). The central numeral in the AGREE pictogram represented the average numerical value derived from the 12 data points, with the color indicating the result [50,51].
GAPI provided a semi-quantitative, graphical representation of the environmental impact associated with each step of the analytical process. It used a unique symbol composed of five pentagrams subdivided into 15 fields. Red indicated a high environmental risk, while yellow and green indicated lower risk and greater greenness, respectively, based on GAPI’s color codes [52,53]. GAPI assessed various aspects of analytical procedures adhering to the principles of GAC, including sampling, transportation, storage, sample preparation, reagents, solvents, and resource use.
2.8.3 Blueness assessment
The BAGI metric tool evaluates the practicality (blueness) of analytical methods, focusing on the standards of WAC. It complements existing green metrics and provides KPIs for blueness, as listed in Table S6. An open-source and user-friendly application has been developed to facilitate the use of the BAGI metric, which can be accessed at https://mostwiedzy.pl/en/justyna-plotka-wasylka,647762-1/BAGI. The application maintains the principles of environmental sustainability. The BAGI metric tool generates two result types: an assigned score and a pictogram. The comprehensive evaluation result is represented by an asteroid-like pictogram with a central number. The color spectrum of the pictogram indicates the alignment of the process with guidelines, ranging from light blue (low alignment) to dark blue (high alignment), with blue indicating moderate alignment and white indicating no alignment. The number in the center of the BAGI pictogram represents the total score assigned to the analytical method, ranging from 25 to 100. A score of 25 indicates poor applicability, while a score of 100 indicates excellent method performance. A practical method should achieve a score of at least 60, which is widely acknowledged within this assessment tool (Table S6) [54,55].
3 Results and discussion
As mentioned in Section 1, the study herein was constructed to determine which of the three analytical tools – UV-spectrophotometric, RP-HPLC-UV, and TLC-spectrodensitometric – would be most suitable for simultaneously measuring a combination of CIP and HYD in their pure and ophthalmic samples. These tools are simple and rely on seven KPI-based standards benchmarking, which include (1) method selectivity and robustness, (2) method sensitivity, (3) method accuracy and precision, (4) method applicability, (5) method whiteness, (6) method greenness, and (7) method blueness.
3.1 Exploring the power of applied methods
In the initiated UV-spectrophotometric method, the original zero-order absorption spectra (D0) of CIP and HYD showed overlap, as depicted in Figure 2(a). The overlap was not resolved by employing first- or second-order derivatives, as shown in Figure S1(a–c). To address this issue, various computational spectrum manipulation techniques, discussed in Table S7, were applied. However, regarding the chromatographic methods, successful resolutions were achieved using the specified chromatographic conditions, as mentioned in Table S3. System suitability parameters for the CIP and HYD mixtures were computed using both approaches and are presented in detail in Table S8.
3.2 Validation regarding the KPI-based standards
With the aid of the KPI-based standard benchmarks between the developed methods, in accordance with ICH guidelines [56], the performance of each method was compared and benchmarked for their achieved KPIs. Moreover, the assay and validation parameters are listed in Table S9 for UV-spectrophotometric methods and Table S10 for other chromatographic methods.
3.2.1 KPI (1): Method selectivity and robustness
The selectivity of the developed analytical methods allows for accurate quantitation of a desired analyte even in the presence of interfering substances. In this case, UV-spectrophotometric and chromatographic methods (RP-HPLC-UV and TLC-spectrodensitometry) were evaluated. Laboratory-prepared mixtures were analyzed, and good mean recovery percentages were obtained with low SDs, indicating minimal spectral noise impact, as shown in Figure 4(a) in the case of UV-spectrophotometry. However, the chromatographic methods showed lower SDs compared to UV-spectrophotometric methods due to their separation step before optical determinations. Among all methods, RP-HPLC-UV had the lowest SDs due to its high automation level, reducing errors. The net assay results are found in Table S11 for UV-spectrophotometric methods and Table S12 for chromatographic methods, which are extracted from the developed methods [20,24].
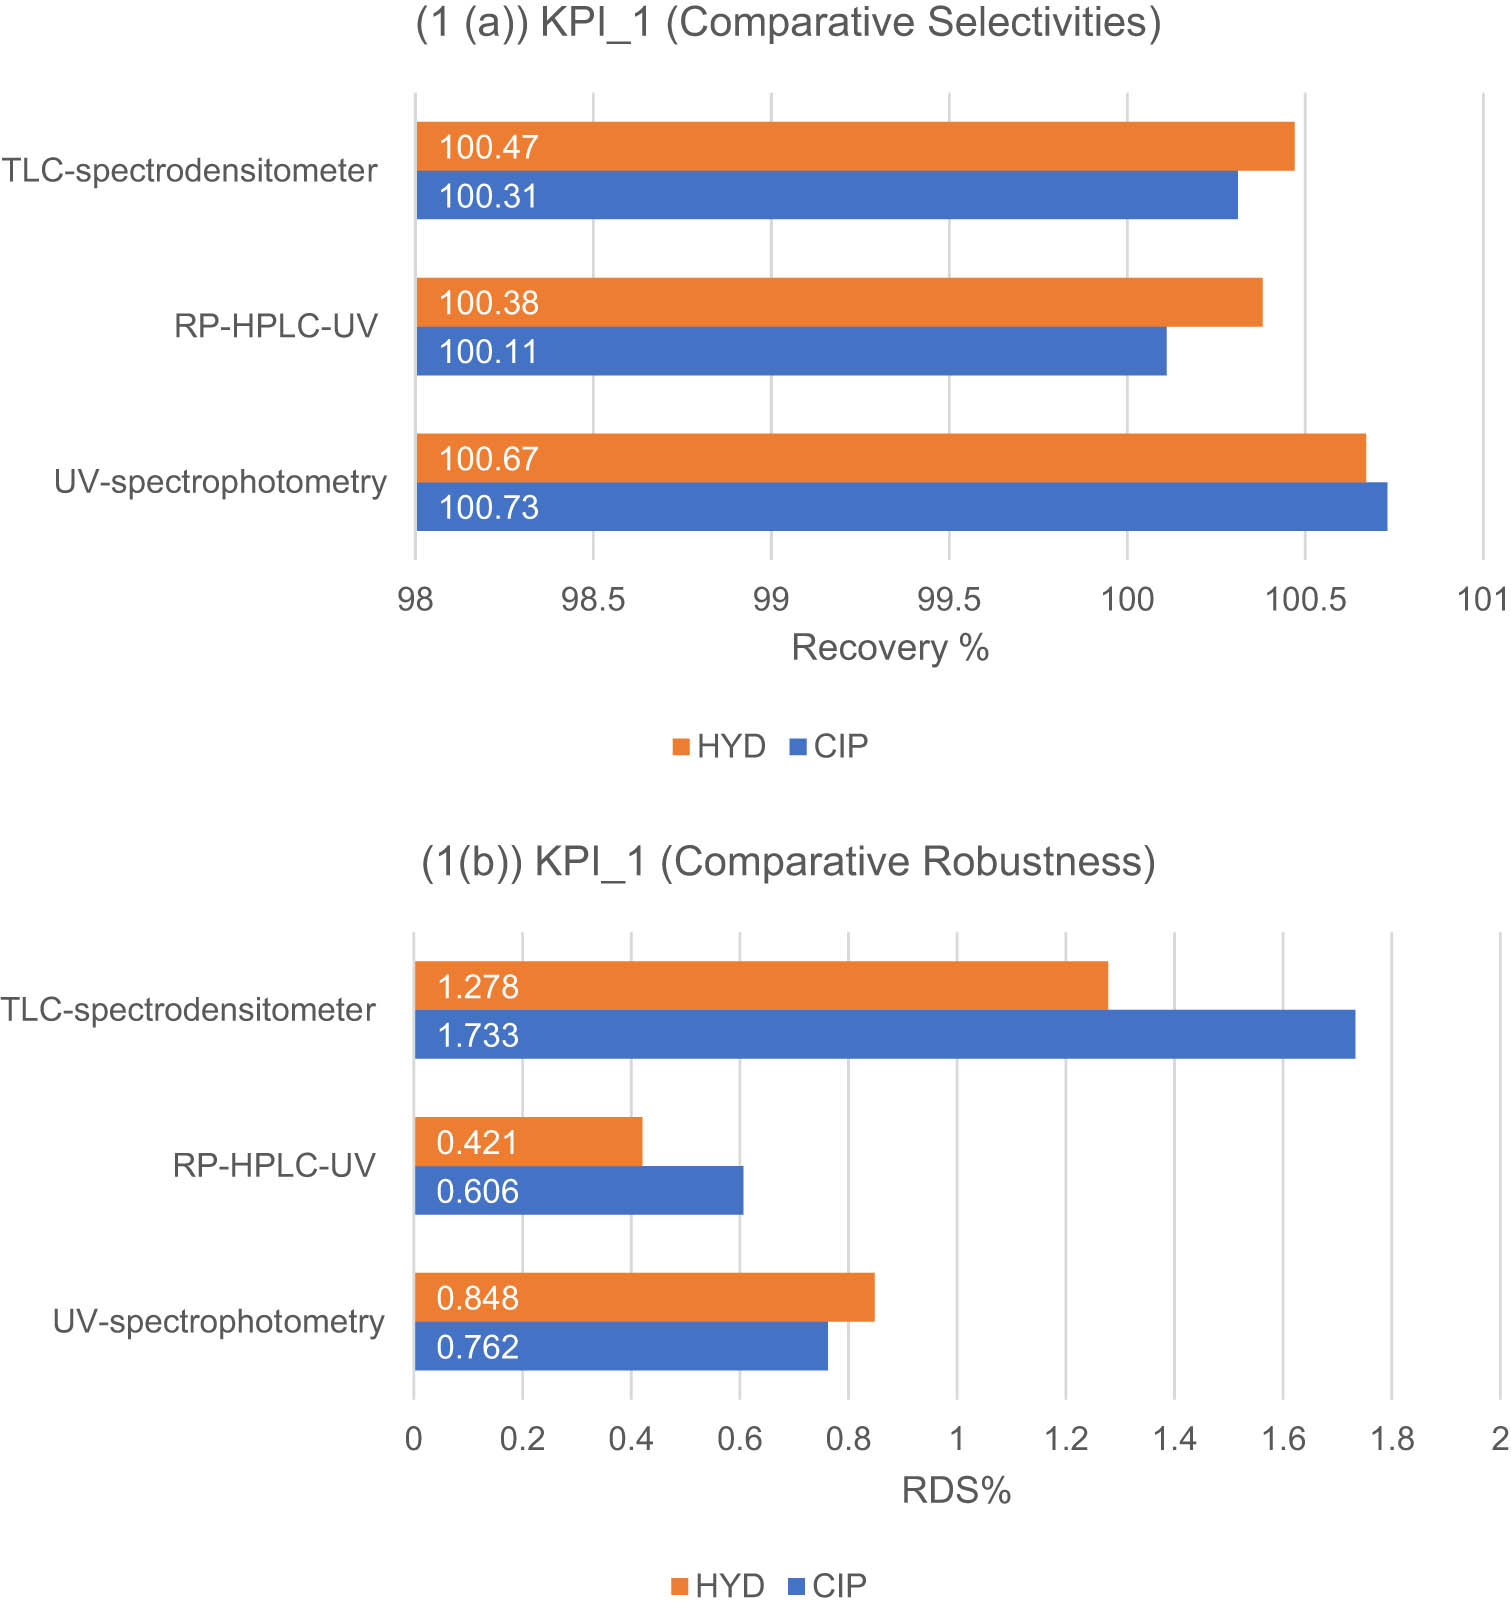
(a) and (b). Results of the KPI-1-based standard (a) and (b) for the developed methods for the determination of CIP and HYD: (1(a)) selectivity expressed as mean recovery % ± SD, (1(b)) robustness expressed as RSD%.
To ensure the practicality of analytical methods, the analytical conditions must not be overly sensitive. Minor variations should not significantly affect the results when the method is used in different laboratories. The robustness of the proposed UV-spectrophotometric methods was tested by varying the percentage of methanol in the solvent, resulting in negligible changes to the assigned wavelengths. For the RP-HPLC-UV method, small deviations in pH and acetonitrile proportion were tested in the mobile phase. The TLC-spectrodensitometric methods had slight adjustments in the ethyl acetate ratios in the developing systems. Although there were small variations in retention time and peak parameters, the peak areas remained constant. Robustness was evaluated using RSD% values, with all methods showing values lower than 2%. However, the TLC-spectrodensitometric method exhibited higher RSD% values, indicating a greater impact when experimental conditions were changed, as indicated in Figure 4(b).
Regarding the KPI evaluation of this standard, the developed methods demonstrated satisfactory levels of selectivity and robustness depending on the obtained acceptable results. Among the three methods, RP-HPLC-UV showed the lowest values for SD and RSD in both selectivity and robustness criteria. This can be attributed to the higher degree of automation in the RP-HPLC-UV method, which reduced errors compared to the other two methods.
3.2.2 KPI (2): Method sensitivity
Maximizing sensitivity is crucial in analytical methods to enable the quantitation of small analyte amounts and minimize sample size. This is particularly important when analyzing complex matrices such as biological fluids or environmental samples, where analyte concentrations are often very low. To evaluate sensitivity, the proposed methods were compared in terms of their LOD and LOQ, as shown in Figure 5. The TLC-spectrodensitometric method exhibited the lowest LOD and LOQ values for both drugs, followed by the RP-HPLC-UV method. This can be attributed to the separation mechanism employed, along with the smaller sample size, which enhanced the ability to detect lower concentrations compared to UV-spectrophotometric measurements.
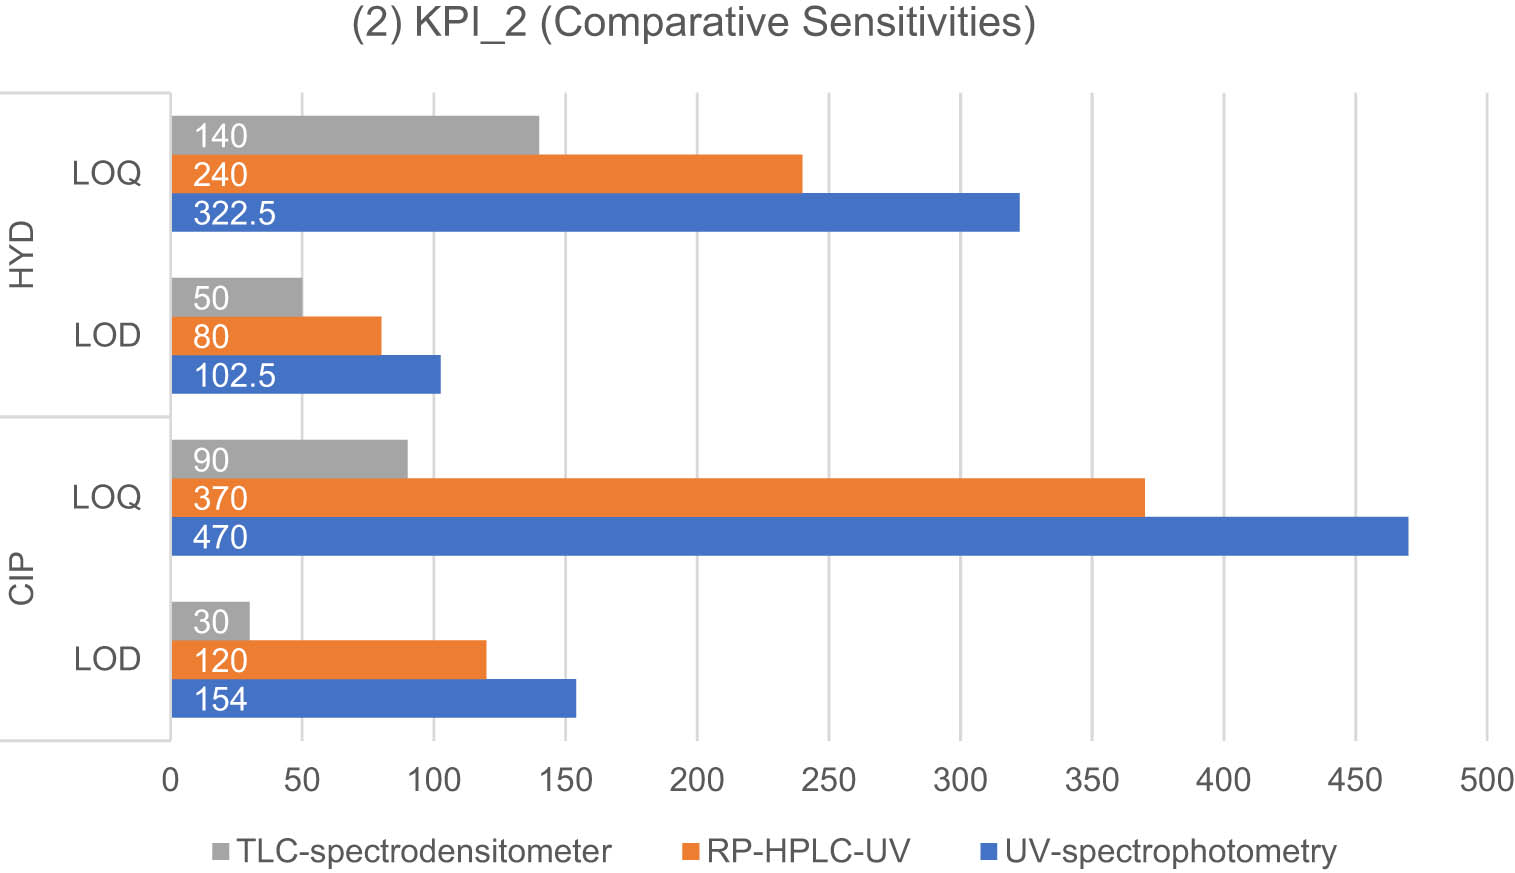
Results of the KPI-2-based standard for the developed methods for the determination of CIP and HYD: sensitivity is expressed as LOD and LOQ values (ng·mL−1).
3.2.3 KPI (3): Accuracy and precision
The accuracy of an analytical method ensures that the presence of excipients in pharmaceutical formulations does not affect the analysis of the desired analyte (active ingredient) in the formulation. The standard addition technique was applied to the pharmaceutical ear drops, and the results are presented in Table S13 for UV-spectrophotometric methods and Table S14 for chromatographic methods. All three methods demonstrated similar recovery percentages with acceptable SDs, as shown in Figure 6(a). This indicates that all methods can accurately analyze the pharmaceutical dosage form.
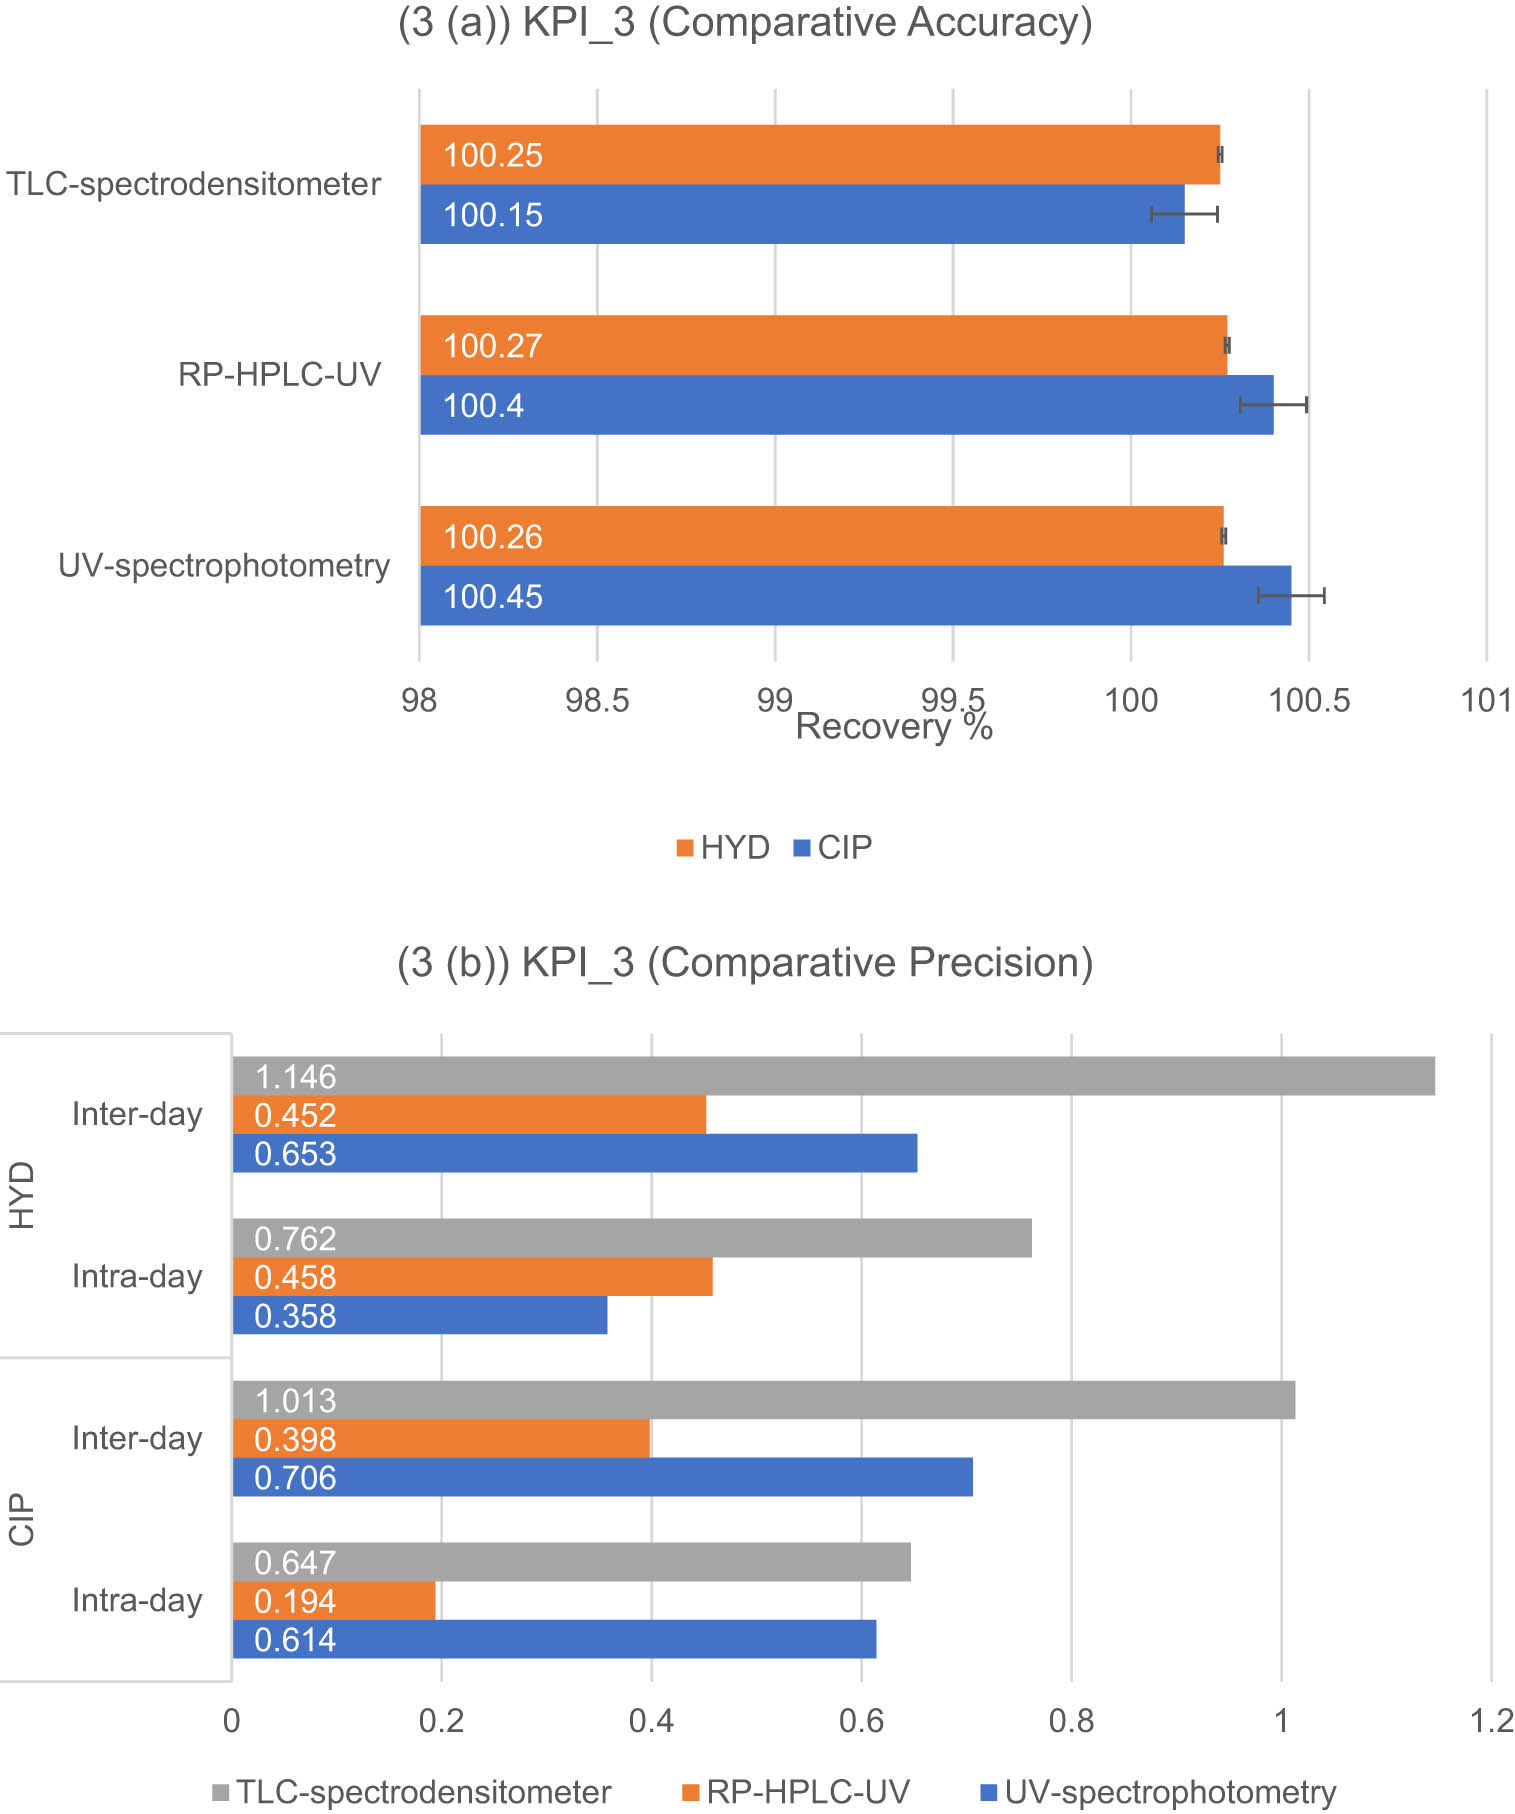
(a) and (b): Results of the KPI-3-based standards (a) and (b) for the developed methods for the determination of CIP and HYD: (3(a)) accuracy expressed as mean recovery % ±SD, (3(b)) interday and intra-day precision expressed as RSD%.
Precision, on the other hand, measures the consistency and reliability of measurements. Precision is expressed as the RSD%, as depicted in Figure 6(b). Variations in RSD% values were observed among the three methods, with the TLC-spectrodensitometric method showing the highest values. This could be attributed to factors such as packing of the stationary phase, mobile phase ratios, and manual injection of the analyte. In contrast, the RP-HPLC-UV method exhibited the lowest RSD% values due to its high degree of automation, which enhances the method’s reliability.
3.2.4 KPI (4): Method applicability and statistical evaluation
Tables S15 and S16 present the statistical comparisons between the developed spectrophotometric and chromatographic methods and the official BP methods [45] for the analysis of CIP and HYD. The student-t and F tests were used to compare the analytical tools, with a significance level of p < 0.05. The official method for CIP is an RP-HPLC method, while for HYD, it is a direct UV-spectrophotometric method. In terms of the student-t test, the RP-HPLC-UV methods exhibited the highest differences between calculated and tabulated values for both drugs. On the other hand, for the F test, UV-spectrophotometric methods and TLC-spectrodensitometric methods showed the highest differences between calculated and tabulated values for HYD and CIP, respectively, as shown in Figure 7. However, there were no significant differences in precision and accuracy between the official and proposed methods. The computed t- and F-values were lower compared to the corresponding tabulated values.
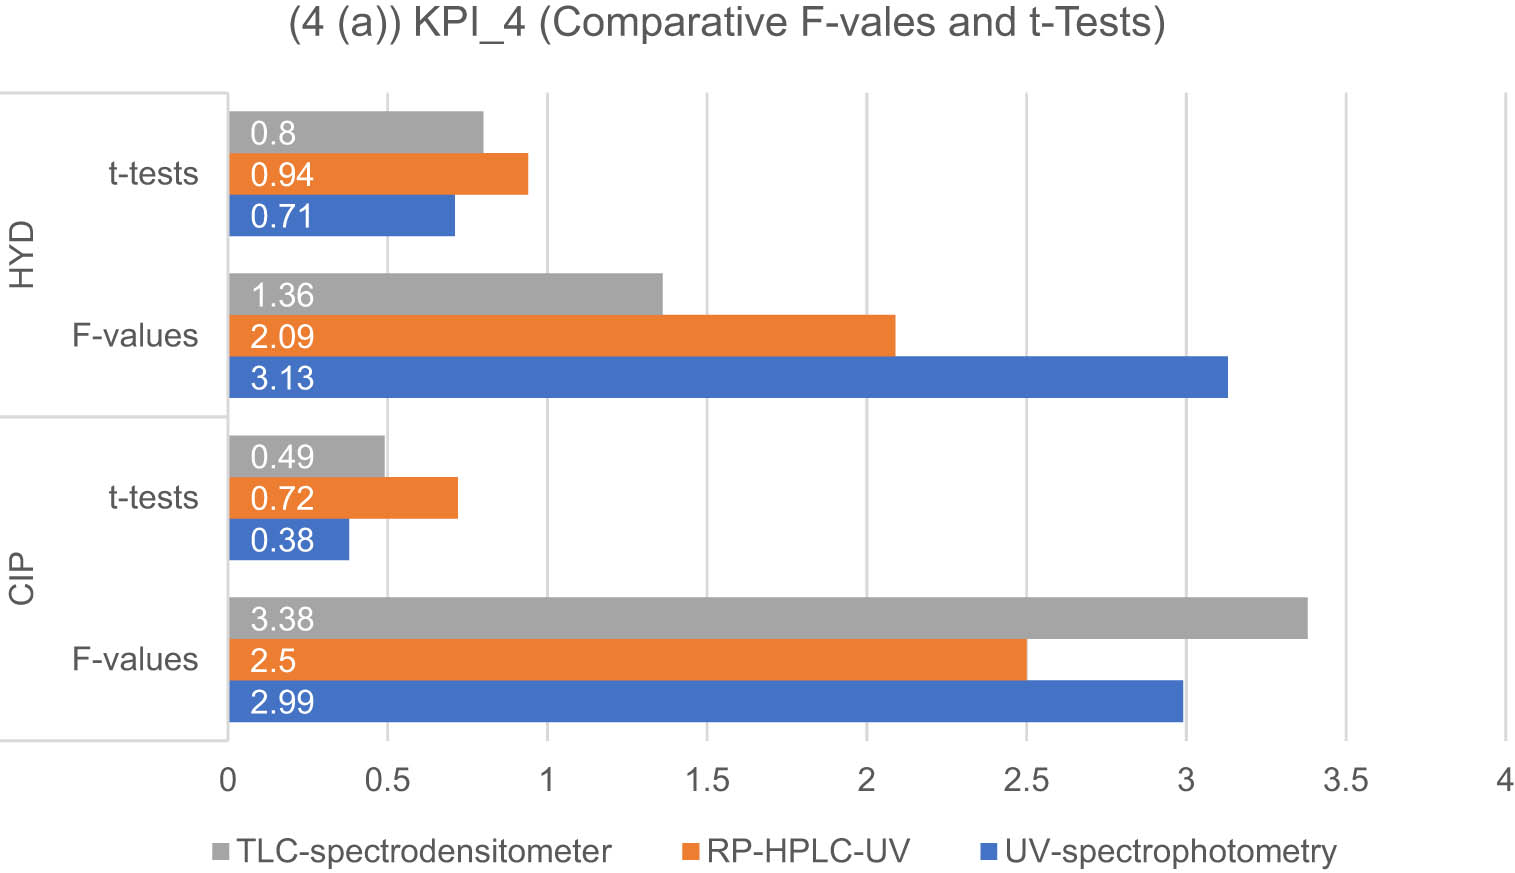
Results of the KPI-4-based standard for the developed methods for the determination of CIP and HYD: applicability and statistical evaluation are expressed as the difference between calculated and tabulated F-values and t-tests.
3.3 Sustainability-based KPI standards
3.3.1 KPI (5): Whiteness standards study
3.3.1.1 RGB12 algorithm
The RGB12 algorithm, a KPI-based standard, was employed in the study to assess three developed analytical approaches for determining the concentration levels of a binary mix (CIP and HYD) in dosage forms. The first approach utilized UV-spectrophotometric methods with methanol and bidistilled water as the sample preparation and analysis procedure. The second approach involved RP-HPLC-UV, utilizing acetonitrile, methanol, triethylamine, and O-phosphoric acid. The third approach employed TLC-densitometry with methanol and ethyl acetate–hexane–triethylamine. Each approach had its own advantages and disadvantages in terms of sustainability. The whiteness scores based on the WAC principles are presented in supplementary excel data file and Figure 8(a). The UV-spectrophotometric approach obtained the highest whiteness score of 85.6, while the two chromatographic approaches (RP-HPLC-UV and TLC) yielded similar results, with scores of 83.5 and 82.1, respectively.
In summary of this standard, both chromatographic methods were more efficient than the UV-spectrophotometric method (Figure 8(a)). The S2 provides additional information about the RGB12 Algorithm score, obtained using the 5 KPIs in line with WAC requirements for analytical procedures. Chromatography is generally preferred for drug analysis due to its higher sensitivity and validity. However, the UV-spectrophotometric method scored high in greenness (89.2%) as it used only one solvent, methanol, while chromatographic methods used multiple solvents. The UV-spectrophotometric method was the most practical and cost-effective option, with ease of use, affordability, and quick results. RP-HPLC-UV offered high selectivity but required expensive equipment and skilled operators, with a blueness score of 77.1%. TLC-densitometry was simpler and reasonably priced, with the ability to handle larger samples, scoring 78.8% in blueness. The UV-spectrophotometric method was recommended for routine drug analysis.
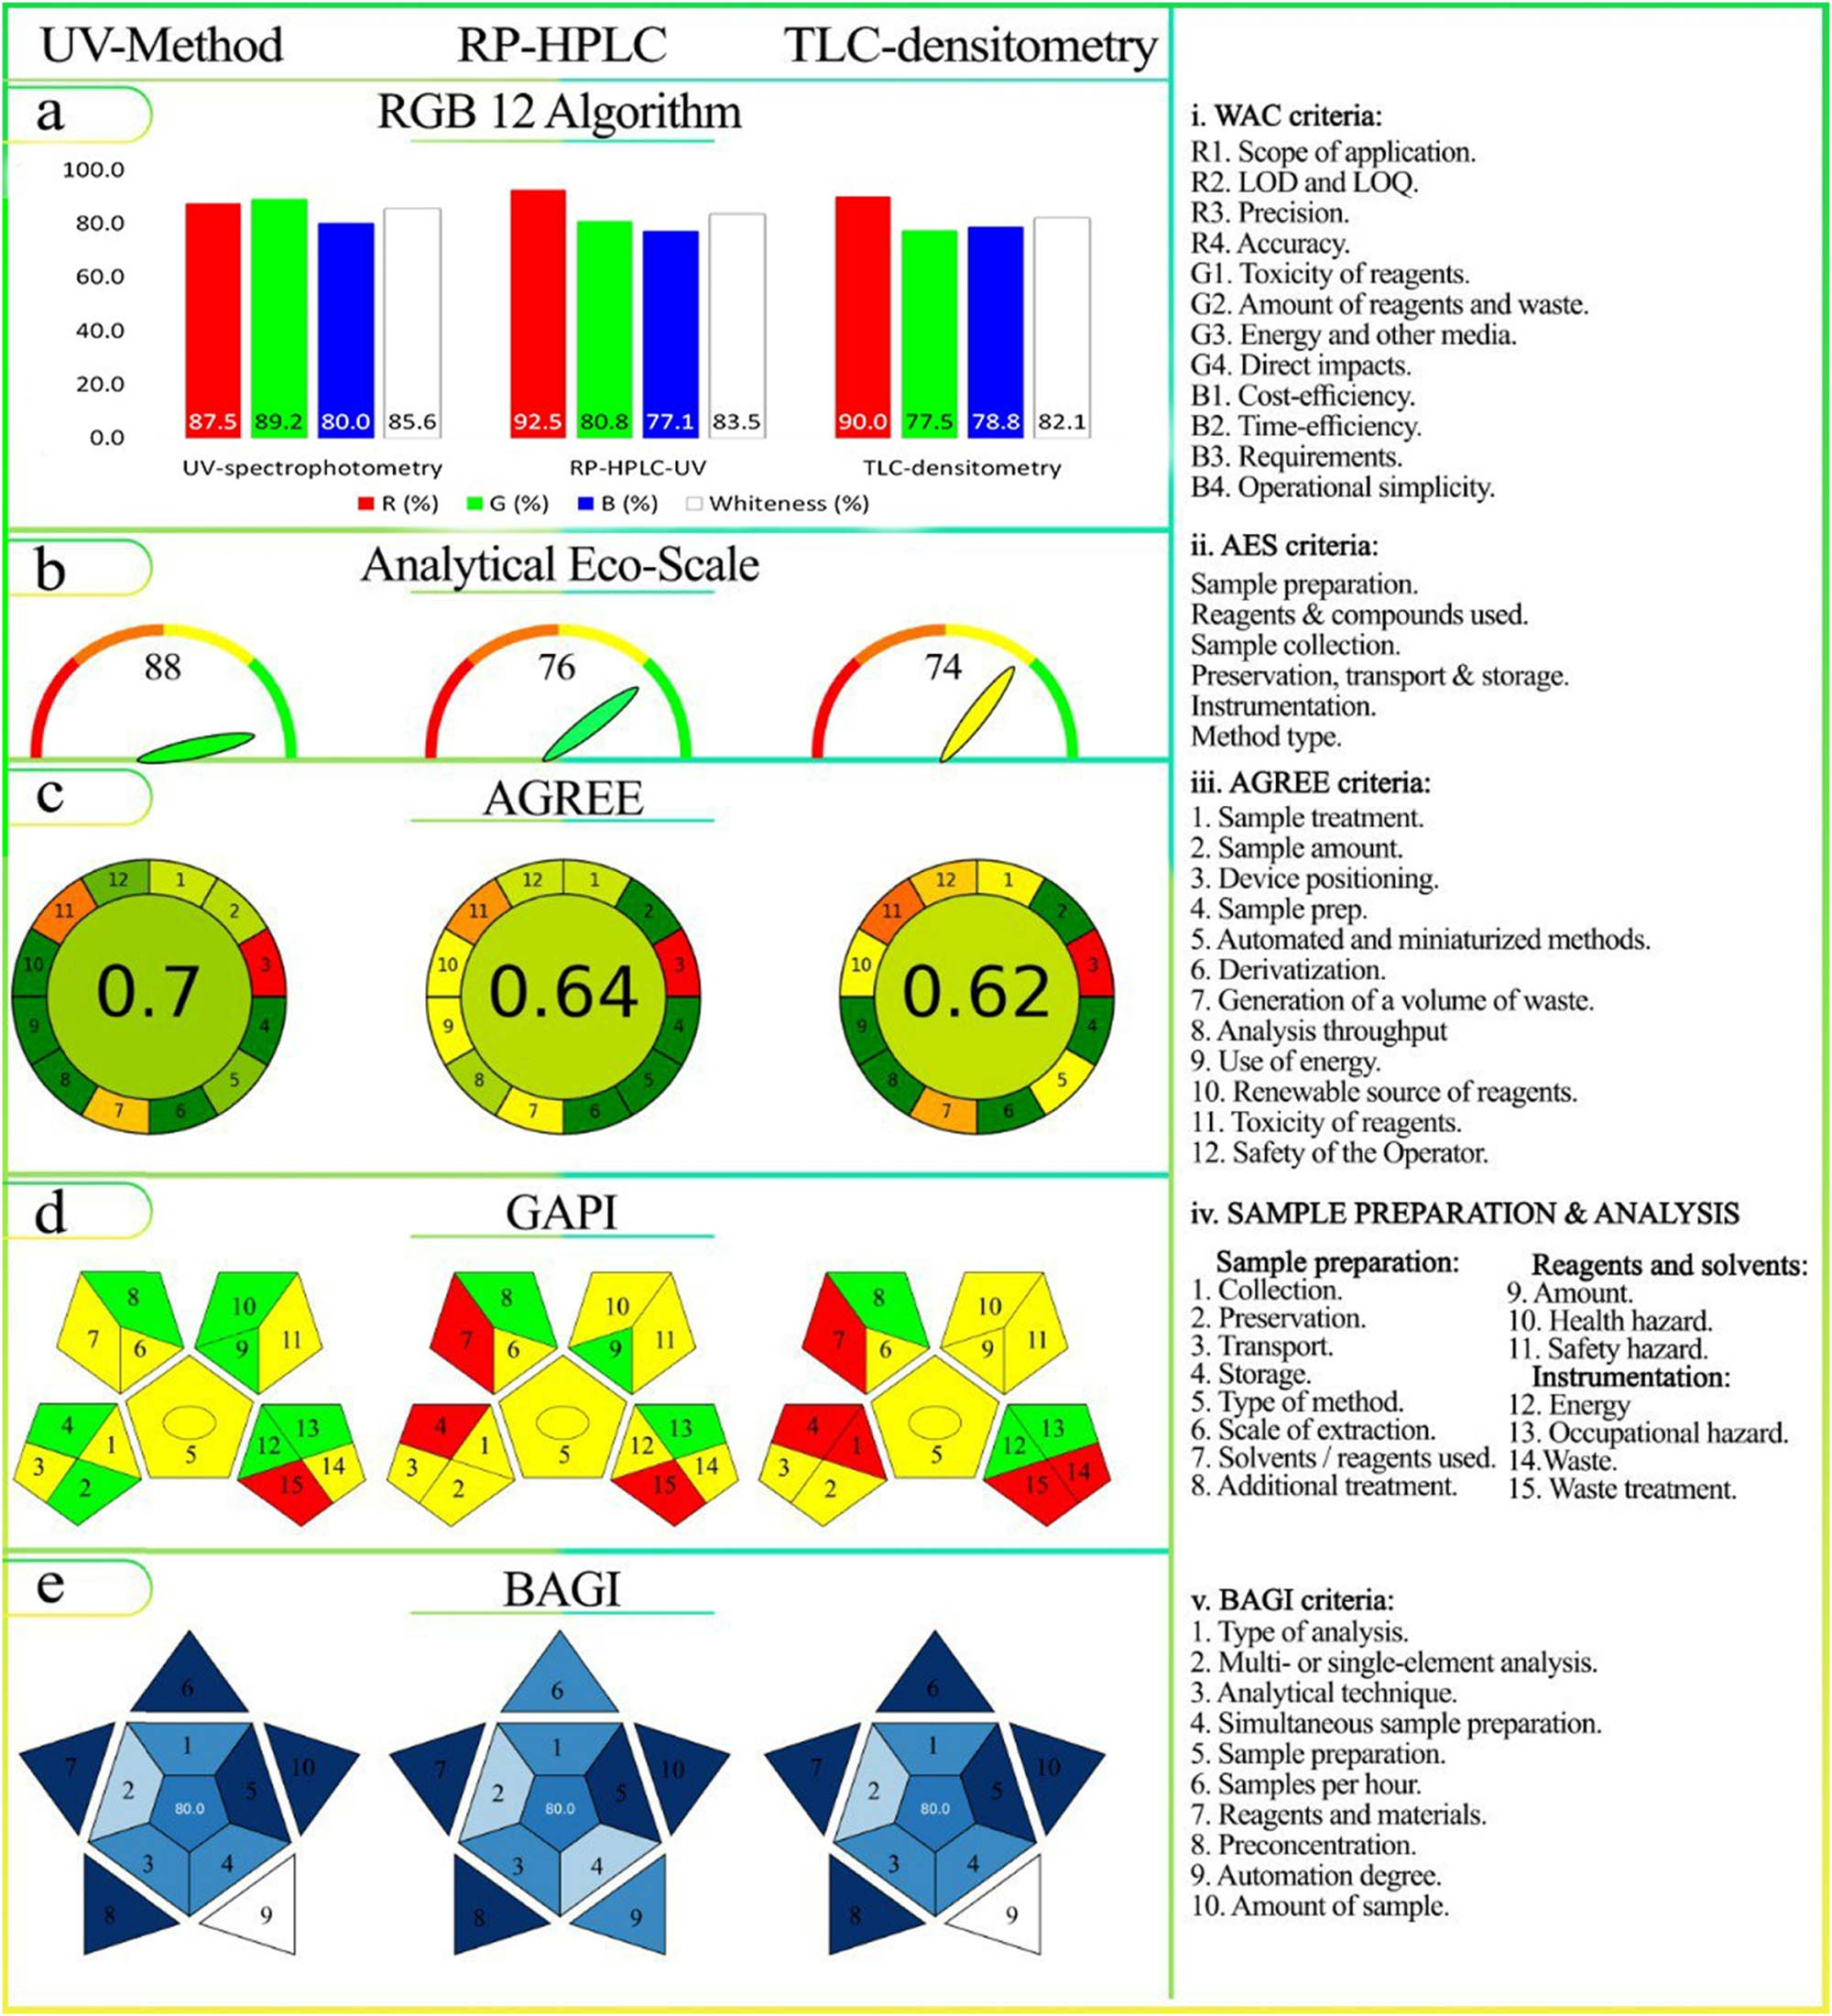
(a)–(e). Assessment of the KPI-based standards 5, 6, and 7 for the developed methods for the determination of CIP and HYD: (a) RGB12 Algorithm, (b) AES, (c) AGREE, (d) GAPI, and (e) BAGI assessment tools.
3.3.2 KPI (6): Greenness standard study
3.3.2.1 AES metric
Pps are assigned to analytical method factors that contradict green analysis. The AES (Eco-Scale) is calculated as AES = 100 − (Total Pps). A higher AES indicates a greener analysis. In Table 1, the UV-spectrophotometric method scored 88, while the RP-HPLC-UV method scored 76 and the TLC-densitometry method scored 74 (Figure 8(b)). The UV-spectrophotometric method had fewer Pps for reagents due to the minimal use of organic solvents. It also had minimal energy consumption (<0.1 kW h per sample).
Summary Pps for the developed methods for the determination of CIP and HYD using a KPI-6 of the AES tool
| Studied factor | Description | Sub-total Pp | Total score |
|---|---|---|---|
| UV-spectrophotometric methods | |||
| Methanol | Quantity (1) | 6 | Σ = 12 AES = 88 |
| Hazardous (3 pictograms) | |||
| Consuming energy | Less than 0.1 kW h per sample | 0 | |
| Waste | Between 1 and 10 mL | 3 | |
| Not dealt | 3 | ||
| Total score for the AES: 100−12 = 88, so the method is considered Excellent green | |||
| RP-HPLC-UV method | |||
| Acetonitrile | Quantity (1) | 4 | Pps Σ =24 AES = 76 |
| Hazardous (physical, environmental, health) (2 pictograms) Danger (2) | |||
| O-Phosphoric acid | Quantity (1) | 1 | |
| Hazardous (1 pictogram) Danger | |||
| Triethylamine | Danger | 6 | |
| Water | Safe | 0 | |
| Methanol | Quantity (1) | ||
| Hazardous (3 pictogram) Danger (2) | 6 | ||
| Consuming energy | Less than 1.5 kW h per sample | 1 | |
| Waste | Between 1 and 10 mL | 3 | |
| Not dealt | 3 | ||
| The total score for the AES is 100−24 = 76, so the method is considered excellent green | |||
| TLC-spectrodensitometric method | |||
| Methanol | Quantity (1) | 6 | Σ = 26 AES = 74 |
| Hazardous (3 pictograms) Danger (2) | |||
| Ethyl acetate | Danger | 2 | |
| Hexane | 4 | ||
| Triethylamine | 6 | ||
| Consuming energy | Less than 0.1 kW h per sample | 0 | |
| Waste | Not dealt | 3 | |
| More than 10 mL | 5 | ||
| Total score for the AES: 100−26 = 74, so the method is considered an acceptable green method | |||
3.3.2.2 AGREE metric
In Figure 8(c), the chromatographic methods scored 0.64 (RP-HPLC-UV) and 0.62 (TLC-densitometry), while the UV-spectrophotometric method scored 0.7 in terms of the tool’s KPI. Here are the details for each GAC principle:
Principle 2 : Chromatographic methods outperformed the UV-spectrophotometric method.
Principle 3 : All three methods received a score of zero and were marked in red for the offline position of the analytical device.
Principle 4 : All three methods received a score of 1 and were colored green for sample preparation.
Principle 5 : The RP-HPLC-UV method scored higher in automation.
Principle 6 : All methods received a perfect score of 1 and a green color for derivatization.
Principle 7 : The TLC-densitometry method generated the most waste.
Principle 8 : The TLC-spectrodensitometric and UV-spectrophotometric techniques demonstrated higher sample throughput per hour.
Principle 9 : The TLC-spectrodensitometric method had sufficient sample throughput capacity, while the RP-HPLC-UV method had higher energy consumption.
Principle 11 : The use of different organic solvents resulted in lower scores for all methods.
Principle 12 : The UV-spectrophotometric method received a green score for its use of methanol, while the RP-HPLC-UV method received a light green score, and the TLC-spectrodensitometric method received a light orange score due to the properties of the solvents used.
3.3.2.3 GAPI metric
In the study results depicted in Figure 8(d), the analytical process was thoroughly assessed, comparing the UV-spectrophotometric and chromatographic methods. Here are the key findings:
Time collection for the sample (field 1) showed variations, with at-line analysis being time-efficient (yellow), while the offline method involved manual steps and consumed more time. The TLC-densitometry method required approximately 1 h to saturate the chamber before sample analysis (red).
Preservation (field 2) and storage (field 4) were critical considerations. The UV-spectrophotometric method required neither preservation nor storage (green), while chromatographic methods needed both (yellow/red).
Sample transportation (field 3) was essential for all methods, impacting the results (yellow).
Simple preparation steps, including filtration (field 5), were required for all methods, and microliter-scale extraction (field 6) was a common characteristic.
The solvent used (field 7) differed, with the UV-spectrophotometric method using green methanol (green), while chromatographic methods employed hazardous solvents.
Additional treatment (field 8) was unnecessary for any method (green).
Solvent quantity (field 9) varied, with UV-spectrophotometric and RP-HPLC-UV methods using less than 10 mL (green) and the TLC-spectrodensitometric method using more than 10 mL (red).
Health hazards (field 10) favored the UV-spectrophotometric method (green), while both chromatographic methods received a yellow rating.
Flammability (field 11) was yellow for all methods.
Energy consumption (field 12) was lower for the UV-spectrophotometric and TLC-spectrodensitometric methods (green) compared to the RP-HPLC-UV method (yellow).
Occupational hazards (field 13) were absent for all established methods (green).
Waste generation (field 14) varied, with UV-spectrophotometric and RP-HPLC-UV methods generating between 1 and 10 mL of waste (yellow) and the TLC-spectrodensitometric method producing more than 10 mL (red).
No waste treatment was required (field 15, red). All established methods fulfilled qualitative and quantitative criteria, as indicated by the central ring (green).
In summary of this standard (a collective comparative study between the utilized tools, AES, AGREE, and GAPI):
Using the AES standards, both the UV-spectrophotometric and RP-HPLC-UV methods are classified as “excellent” in environmental aspects. In contrast, the TLC-densitometry method is “acceptable” due to its use of hazardous solvents and waste production. However, the broadness of this scale can lead to imprecise classification. For instance, despite the RP-HPLC-UV method’s higher consumption of hazardous solvents and greater energy use compared to the UV-spectrophotometric method, it receives an equivalent score. As mentioned in Section 1, the research underscores the need for an alternative green assessment tool capable of offering a more comprehensive evaluation of various aspects of GAC, as the next tools emphasized.
Using the AGREE standards, this tool offers a variety of data for every process. In comparison to chromatographic methods, the UV-spectrophotometric method seems to be more green. This is based on the results. Using the comprehensive scores for the various procedures, Figure 8(c) illustrates whether each of the 12 GAC principles was met and contributed to the greenness assessment as in S3, S4, and S5.
Using the GAPI standards, there is a clear pattern in their pictogram that shows the three analytical processes. The UV-spectrophotometric method displays the greatest number of green-colored fields (1 # 7) and the fewest red-colored sections. The TLC-spectrodensitometric approach, on the other hand, shows the greatest number of red-colored sections and the fewest green-colored fields (5 # 3). In contrast, an even distribution with three red and three green sections is shown by the RP-HPLC-UV method. When compared to chromatographic methods, this pattern highlights the UV-spectrophotometric method’s environmentally friendly sampling strategy. It is crucial to remember that these findings are particular to the applied conditions and may or may not hold generally.
3.3.3 KPI (7): Blueness standard study
In the UV-spectrophotometric approach, the method quantified analytes using simple and easily accessible reagents. It achieved high sample throughput, producing almost 40 samples at once and over 13 samples per hour. The sample volume was minimal at 1 mL, requiring only basic preparation steps. The process was carried out manually, resulting in a positive BAGI score of 80, indicating strong applicability.
The RP-HPLC-UV detection method utilized readily available reagents and standard laboratory apparatus. It had a total analysis time of 7 min and allowed for the simultaneous preparation of approximately six samples, with an hourly throughput of 8.5 samples. However, the TLC-spectrodensitometric method, although semi-automated, required some manual steps. However, it had a low sample volume and did not necessitate pre-concentration, resulting in an overall BAGI score of 80, indicating favorable applicability.
In summary of this standard: Notably, all three methods had similar scores, highlighting their comparable usefulness. However, the pictogram generated by the BAGI metric tool revealed variations. The RP-HPLC-UV method displayed a light blue color in nine sections, representing its semi-automated characteristics. In contrast, the UV-spectrophotometric and TLC-spectrodensitometric methods showed white sections for manual sampling. Moreover, the UV-spectrophotometric and TLC-spectrodensitometric methods exhibited significantly higher sample throughput compared to the RP-HPLC-UV method. In terms of cost-effectiveness, the UV-spectrophotometric method was the most favorable, followed by the TLC-spectrodensitometric method. The RP-HPLC-UV method ranked last in cost-effectiveness when considering practicality and economic considerations, as indicated by the blue color in the RGB12 tool (Figure 8(e)).
3.4 SWOT analysis tools regarding the developed analytical approaches
Another tool to evaluate the environmental friendliness and sustainability of the developed methods in the context of green and white chemistry is implementing a SWOT analysis [60,61]. This analysis aims to provide a comprehensive assessment of the methods’ strengths, weaknesses, opportunities for improvement, and potential threats, considering eco-conscious practices. The goal of this analysis is to offer valuable insights into the methods’ ecological impact and their contributions to green and white chemistry [36,62]. The CIP and HYD strengths, weaknesses, opportunities, and threats determined by the developed methods are outlined in Tables 2–4.
UV-Spectrophotometry SWOT analysis results
| Strengths | Weaknesses | Opportunities | Threats |
|---|---|---|---|
|
|
|
|
TLC-densitometry SWOT analysis results
| Strengths | Weaknesses | Opportunities | Threats |
|---|---|---|---|
|
|
|
|
RP-HPLC-UV SWOT analysis results
| Strengths | Weaknesses | Opportunities | Threats |
|---|---|---|---|
|
|
|
|
4 Recommendations
The utilization of reported standards with KPIs highlights the importance of evidence-based decision-making when choosing between analytical methods like UV-spectrophotometric and chromatographic techniques. Each method has its strengths and weaknesses, and researchers should consider their specific needs and priorities before selecting a method.
RP-HPLC-UV, although more expensive, stands out for its superior performance in terms of selectivity, robustness, accuracy, and precision according to KPI standards 1 and 3. This method is recommended for routine analysis in quality control labs and for analyzing complex sample matrices due to its precision, accuracy, and selectivity advantages.
While TLC-spectrodensitometric methods excel in sensitivity (KPI-2), they may fall short in other KPIs. Therefore, they are best suited for screening trials due to their cost-effectiveness and simplicity.
UV-spectrophotometric methods, despite their lower sensitivity, often prove to be more cost-effective and environmentally friendly than TLC-spectrodensitometric and RP-HPLC-UV methods. Ultimately, the choice of method should align with the specific requirements and constraints of the study.
5 Conclusions
Here, we utilized the parameters that had already been achieved, which were conducted during the development of three different instrumentation methods [20,24]. However, some of these parameters were on the side of any method validation, and others were on the side of the study of method sustainability (which was actually re-evaluated here and expanded for more comparative data) around three centers (namely whiteness, greenness, and blueness). The selected standards in the study related to method validation were selectivity and robustness, sensitivity, accuracy and precision, and statistical comparison after applicability (with the aid of F- and t parameters). Concerning method sustainability, different recent tools related to whiteness, greenness, and blueness, as clarified in the main text, were utilized. However, these standards all have certain values, so our suggestion is the appearance of the KPI-based. The benchmarking is recalled based on these methods being published, and they must considered as an internal benchmark in itself; however, an external benchmark for the other is eligible. Fortunately, the objectives of the study were achieved, which inversely translates to a new trend in the analytical work for the readers and specialists.
The study revealed that there is no inherently superior approach among the various instruments evaluated. Each method has its own set of advantages and disadvantages, particularly in terms of sustainability. Researchers must consider specific needs and priorities when choosing one method over another. For instance, while RP-HPLC-UV offers higher sensitivity at a higher cost, the UV-spectrophotometric method proves to be more cost-effective despite some loss in sensitivity compared to RP-HPLC-UV. Additionally, the automation benefits of HPLC with a UV detector must be weighed against the need for human intervention in the UV-spectrophotometric and TLC-spectrodensitometric methods. By prioritizing green chemistry principles and striving for enhanced efficiency and reduced environmental footprint in pharmaceutical analysis, researchers can contribute to the future advancement of analytical techniques. This emphasis on sustainability fosters innovation and environmental stewardship, paving the way for more sustainable and effective pharmaceutical analyses. In summary, this study highlights the significance of considering specific requirements and limitations of the research while aligning with green chemistry principles. Such an approach will drive the field of pharmaceutical analysis toward a more sustainable and environmentally friendly future.
In the end, the decision should be in line with the specific requirements and limitations of the study, as illustrated:
| No. of standard | Standard name | UV-spectrophotometric method | RP-HPLC method | TLC-spectrodensitometric method |
|---|---|---|---|---|
| Validation-bases KPI standards | ||||
| KPI 1 | Selectivity and robustness | ⊠ | ⊠ | □ |
| KPI 2 | Sensitivity | □ | □ | ⊠ |
| KPI 3 | Accuracy and precision | □ | ⊠ | □ |
| KPI 4 | Applicability | ⊠ | ⊠ | ⊠ |
| Total score for the validation study | 1 | 3 | 2 | |
| Sustainability-based KPI standards | ||||
| KPI 5 | RGB12 Algorithm | □ | □ | □ |
| KPI 6 | Greenness | ⊠ | □ | □ |
| KPI 7 | Blunesses | ⊠ | □ | □ |
| Total score for sustainability study | 3 | 0 | 0 | |
| Final score | 4 | 3 | 2 | |
Acknowledgements
The authors would like to thank the Deanship of Scientific Research at Shaqra University for supporting this work.
-
Funding information: Authors state no funding involved.
-
Author contributions: Christine Nessim (Ch.N.), Mohamed El Hamd (M.E.H.), Reem Obaydo (RO), Sarah Saleh (S.S.), Hayam Lotfy (H.L). Ch.N. and S.S.: Data curation, formal analysis, investigation, methodology, software, validation, and writing – original draft preparation. M.E.H.: conceptualization, data curation, formal analysis, investigation, software, validation, writing – reviewing, and editing. R.O.: conceptualization, data curation, investigation, and SWOT analysis. H.L.: Data curation, investigation, supervision, writing – reviewing and editing.
-
Conflict of interest: Authors state no conflict of interest.
-
Data availability statement: The datasets generated during and/or analyzed during the current study are available from the corresponding author on reasonable request.
References
[1] Grohe K, Heitzer H. Cycloaracylation of enamines. part 1. Synthesis of 4‐quinolone‐3‐carboxylic acids. J Cheminformatics. 1987;18:871–9.10.1002/chin.198721175Suche in Google Scholar
[2] Vardanyan RS, Hruby VJ. 33 – Antimicrobial drugs. In: Vardanyan RS, Hruby VJ, editors. Synthesis of essential drugs. Amsterdam: Elsevier; 2006. p. 499–523.10.1016/B978-044452166-8/50033-9Suche in Google Scholar
[3] Hindmarsh PC, Geertsma K. Chapter 20 – Hydrocortisone. In: Hindmarsh PC, Geertsma K, editors. Congenital adrenal hyperplasia. Amsterdam, Netherlands: Elsevier Inc.; 2017. p. 231–4.10.1016/B978-0-12-811483-4.00020-9Suche in Google Scholar
[4] Hindmarsh PC, Geertsma K. Chapter 27 – intravenous, intramuscular and other forms of hydrocortisone. In: Hindmarsh PC, Geertsma K, editors. Congenital adrenal hyperplasia. Academic Press; 2017. p. 343–51.10.1016/B978-0-12-811483-4.00027-1Suche in Google Scholar
[5] Ronowicz J, Kupcewicz B, Pałkowski Ł, Bilski P, Siódmiak T, Marszałł M, et al. Simultaneous determination of ciprofloxacin hydrochloride and hydrocortisone in ear drops by high performance liquid chromatography. Chem Pap. 2014;68(7):861–70.10.2478/s11696-013-0526-2Suche in Google Scholar
[6] El-Brashy AM, Metwally ME-S, El-Sepai FA. Spectrophotometric determination of some fluoroquinolone antibacterials by binary complex formation with xanthene dyes. Il farmaco. 2004;59(10):809–17.10.1016/j.farmac.2004.07.001Suche in Google Scholar PubMed
[7] Ragab GH, Amin AS. Atomic absorption spectroscopic, conductometric and colorimetric methods for determination of fluoroquinolone antibiotics using ammonium reineckate ion-pair complex formation. Spectrochim Acta Part A: Mol Biomol Spectrosc. 2004;60(4):973–8.10.1016/S1386-1425(03)00327-5Suche in Google Scholar PubMed
[8] Ulu ST. Spectrofluorimetric determination of fluoroquinolones in pharmaceutical preparations. Spectrochim Acta Part A: Mol Biomol Spectrosc. 2009;72(1):138–43.10.1016/j.saa.2008.08.017Suche in Google Scholar PubMed
[9] Murillo JA, Alañón Molina A, Muñoz De La Peña A, Durán Merás I, Jiménez Girón A. Resolution of ofloxacin–ciprofloxacin and ofloxacin–norfloxacin binary mixtures by flow-injection chemiluminescence in combination with partial least squares multivariate calibration. J Fluoresc. 2007;17:481–91.10.1007/s10895-007-0198-9Suche in Google Scholar PubMed
[10] Beltran JL, Jimenez-Lozano E, Barron D, Barbosa J. Determination of quinolone antimicrobial agents in strongly overlapped peaks from capillary electrophoresis using multivariate calibration methods. Anal Chim Acta. 2004;501(2):137–41.10.1016/j.aca.2003.09.055Suche in Google Scholar
[11] Cazedey ECL, Perez DP, Perez JP, Salgado HRN. LC assay for ciprofloxacin hydrochloride ophthalmic solution. Chromatographia. 2009;69:241–4.10.1365/s10337-009-1004-4Suche in Google Scholar
[12] Galarini R, Fioroni L, Angelucci F, Tovo GR, Cristofani E. Simultaneous determination of eleven quinolones in animal feed by liquid chromatography with fluorescence and ultraviolet absorbance detection. J Chromatogr A. 2009;1216(46):8158–64.10.1016/j.chroma.2009.06.076Suche in Google Scholar PubMed
[13] Elkady EF, Mahrouse MA. Reversed-phase ion-pair HPLC and TLC-densitometric methods for the simultaneous determination of ciprofloxacin hydrochloride and metronidazole in tablets. Chromatographia. 2011;73:297–305.10.1007/s10337-010-1898-xSuche in Google Scholar
[14] Feng Y-L, Dong C. Simultaneous determination of trace ofloxacin, ciprofloxacin, and sparfloxacin by micelle TLC-fluorimetry. J Chromatogr Sci. 2004;42(9):474–7.10.1093/chromsci/42.9.474Suche in Google Scholar PubMed
[15] Faria AF, de Souza MVN, de Almeida MV, de Oliveira MAL. Simultaneous separation of five fluoroquinolone antibiotics by capillary zone electrophoresis. Anal Chim Acta. 2006;579(2):185–92.10.1016/j.aca.2006.07.037Suche in Google Scholar PubMed
[16] Bannefeld KH, Stass H, Blaschke G. Capillary electrophoresis with laser-induced fluorescence detection, an adequate alternative to high-performance liquid chromatography, for the determination of ciprofloxacin and its metabolite desethyleneciprofloxacin in human plasma. J Chromatogr B: Biomed Sci Appl. 1997;692(2):453–9.10.1016/S0378-4347(96)00539-7Suche in Google Scholar
[17] Gallego JML, Arroyo JP. Spectrophotometric determination of hydrocortisone, nystatin and oxytetracycline in synthetic and pharmaceutical preparations based on various univariate and multivariate methods. Anal Chim Acta. 2002;460(1):85–97.10.1016/S0003-2670(02)00138-1Suche in Google Scholar
[18] Grippa E, Santini L, Castellano G, Gatto MT, Leone MG, Saso L. Simultaneous determination of hydrocortisone, dexamethasone, indomethacin, phenylbutazone and oxyphenbutazone in equine serum by high-performance liquid chromatography. J Chromatogr B: Biomed Sci Appl. 2000;738(1):17–25.10.1016/S0378-4347(99)00478-8Suche in Google Scholar PubMed
[19] Hajkova R, Solich P, Dvořák J, Šı́cha J. Simultaneous determination of methylparaben, propylparaben, hydrocortisone acetate and its degradation products in a topical cream by RP-HPLC. J Pharm Biomed Anal. 2003;32(4–5):921–7.10.1016/S0731-7085(03)00193-6Suche in Google Scholar PubMed
[20] Lotfy HM, Hassan NY, Elgizawy SM, Saleh SS. Comparative study of new spectrophotometric methods; An application on pharmaceutical binary mixture of ciprofloxacin hydrochloride and hydrocortisone. J Chil Chem Soc. 2013;58(3):1892–8.10.4067/S0717-97072013000300022Suche in Google Scholar
[21] Sirén H, Seppänen-Laakso T, Orešič M. Capillary electrophoresis with UV detection and mass spectrometry in method development for profiling metabolites of steroid hormone metabolism. J Chromatogr B. 2008;871(2):375–82.10.1016/j.jchromb.2008.06.016Suche in Google Scholar PubMed
[22] Lemus Gallego JM, Pérez Arroyo J. Micellar electrokinetic capillary chromatography as an alternative method for determination of hydrocortisone and its most important associated compounds in local pharmaceutical preparations. Chromatographia. 2002;56:455–62.10.1007/BF02492009Suche in Google Scholar
[23] Lemus Gallego JM, Arroyo JP. Determination of hydrocortisone and associated compounds in pharmaceutical preparations by micellar electrokinetic chromatography. J Liq Chromatogr Relat Technol. 2003;26(7):1011–25.10.1081/JLC-120020089Suche in Google Scholar
[24] Elgizawy SM, Hassan NY, Lotfy HM, Saleh SS. Comparative study of RP-HPLC versus TLC-spectrodensitometric methods applied for binary mixtures of fluoroquinolones and corticosteroids. Acta Chromatogr. 2014;26(3):439–56.10.1556/AChrom.26.2014.3.4Suche in Google Scholar
[25] Urbain A, Simões‐Pires CA. Thin‐layer chromatography for the detection and analysis of bioactive natural products. Encyclopedia of Analytical Chemistry. Atlanta, GA, USA: American Cancer Society; 2020. pp. 1–29.10.1002/9780470027318.a9907.pub2Suche in Google Scholar
[26] Wilson CR. 10.09 – Methods for analysis of gastrointestinal toxicants. In: McQueen CA, editor. Comprehensive toxicology. 2nd edn. Oxford: Elsevier; 2010. p. 145–52.10.1016/B978-0-08-046884-6.00845-9Suche in Google Scholar
[27] Wagieh NE, Hegazy MA, Abdelkawy M, Abdelaleem EA. Quantitative determination of oxybutynin hydrochloride by spectrophotometry, chemometry and HPTLC in presence of its degradation product and additives in different pharmaceutical dosage forms. Talanta. 2010;80(5):2007–15.10.1016/j.talanta.2009.11.002Suche in Google Scholar PubMed
[28] El-Saharty YS, El-Ragehy NA, Abdel-Monem HM, Abdel-Kawy MI. Stability-indicating methods for the determination of pipazethate HCl in the presence of its alkaline degradation product. J Adv Res. 2010;1(1):71–8.10.1016/j.jare.2010.02.008Suche in Google Scholar
[29] Shockcor JP. HPLC–NMR, pharmaceutical applications*. In: Lindon JC, editor. Encyclopedia of spectroscopy and spectrometry. 2nd edn Oxford: Academic Press; 2010. p. 946–56.10.1016/B978-0-12-374413-5.00377-8Suche in Google Scholar
[30] Moldoveanu SC, David V. Chapter 9 – HPLC analysis. In: Moldoveanu SC, David V, editors. Essentials in modern HPLC separations. Amsterdam, Netherlands: Elsevier; 2013. p. 465–519.10.1016/B978-0-12-385013-3.00009-4Suche in Google Scholar
[31] Morelli B. Second‐derivative spectrophotometric assay of mixtures of dicloxacillin sodium and ampicillin sodium in pharmaceuticals. J Pharm Sci. 1988;77(12):1042–6.10.1002/jps.2600771211Suche in Google Scholar PubMed
[32] Morelli B. Determination of a quaternary mixture of vitamins B6, B1, and B12 and uridine 5’-triphosphate by derivative spectrophotometry. J Pharm Sci. 1995;84(1):34–7.10.1002/jps.2600840109Suche in Google Scholar PubMed
[33] Doyle TD, Fazzari FR. Determination of drugs in dosage forms by difference spectrophotometry. J Pharm Sci. 1974;63(12):1921–6.10.1002/jps.2600631219Suche in Google Scholar PubMed
[34] (ICH) guideline. Impurities in new drug substances Q3A(R2). International Conference on Harmonisation of Technical Requirements for the Registration of Pharmaceuticals for Human Use; 2006.Suche in Google Scholar
[35] Moreton RC. United States pharmacopeia-national formulary. J Excip Food Chem. 2016;6(3):61–4.Suche in Google Scholar
[36] Nowak PM, Wietecha-Posłuszny R, Pawliszyn J. White Analytical chemistry: an approach to reconcile the principles of green analytical chemistry and functionality. TrAC Trends Anal Chem. 2021;138:116223.10.1016/j.trac.2021.116223Suche in Google Scholar
[37] Elbalkiny HT, El-Zeiny MB, Saleh SS. Analysis of commonly prescribed analgesics using in-silico processing of spectroscopic signals: application to surface water and industrial effluents, and comparative study via green and white assessments. Environ Chem. 2022;19(7):446–59.10.1071/EN22108Suche in Google Scholar
[38] Kannaiah KP, Chanduluru HK, Obaydo RH, Lotfy HM, Erk N, Krishnan M, et al. Application of advanced environmentally benign assessment tools in determining ternary cardiovascular drug combination by RP-HPLC with analytical quality by design: Application to stability indicating method evaluation. Sustainable Chem Pharm. 2023;35:101197.10.1016/j.scp.2023.101197Suche in Google Scholar
[39] Kayali Z, Obaydo RH, Alhaj Sakur A. Spider diagram and sustainability evaluation of UV-methods strategy for quantification of aspirin and sildenafil citrate in the presence of salicylic acid in their bulk and formulation. Heliyon. 2023;9(4):e15260.10.1016/j.heliyon.2023.e15260Suche in Google Scholar PubMed PubMed Central
[40] Naguib IA, Majed M, Albogami M, Alshehri M, Bukhari A, Alshabani H, et al. Greenness assessment of HPLC analytical methods with common detectors for assay of paracetamol and related materials in drug products and biological fluids. Separations. 2023;10(5):283.10.3390/separations10050283Suche in Google Scholar
[41] Saleh SS, Lotfy HM, Tiris G, Erk N, Rostom Y. Analytical tools for greenness assessment of chromatographic approaches: Application to pharmaceutical combinations of indapamide, perindopril and amlodipine. Microchem J. 2020;159:105557.10.1016/j.microc.2020.105557Suche in Google Scholar
[42] El-Naem OA, Saleh SS. Eco-friendly UPLC-MS/MS analysis of possible add-on therapy for COVID-19 in human plasma: Insights of greenness assessment. Microchem J. 2021;166:106234.10.1016/j.microc.2021.106234Suche in Google Scholar PubMed PubMed Central
[43] Hafez HM, El Deeb S, Swaif MM, Ibrahim RI, Kamil RA, Abdelwahed AS, et al. Micellar organic-solvent free HPLC design of experiment for the determination of Ertapenem and meropenem; assessment using GAPI, AGREE and analytical Eco-scale models. Microchem J. 2023;185:108262.10.1016/j.microc.2022.108262Suche in Google Scholar
[44] Manousi N, Wojnowski W, Płotka-Wasylka J, Samanidou V. Blue applicability grade index (BAGI) and software: a new tool for the evaluation of method practicality. Green Chem. 2023;25(19):7598–604.10.1039/D3GC02347HSuche in Google Scholar
[45] Pharmacopoeia B. The stationary office on behalf of the medicines and healthcare products Regulatory Agency. Vol. 669. London, UK; 2009.Suche in Google Scholar
[46] Singh R, Maithani M, Saraf SK, Saraf S, Gupta RC. Simultaneous estimation of ciprofloxacin hydrochloride, ofloxacin, tinidazole and ornidazole by reverse phase–high performance liquid chromatography. Eurasian J Anal Chem. 2009;4(2):161–7.Suche in Google Scholar
[47] Guideline IHT. Validation of analytical procedures: text and methodology. Q2 (R1). 2005;1(20):05.Suche in Google Scholar
[48] Gałuszka A, Migaszewski ZM, Konieczka P, Namieśnik J. Analytical Eco-Scale for assessing the greenness of analytical procedures. TrAC, Trends Anal Chem. 2012;37:61–72.10.1016/j.trac.2012.03.013Suche in Google Scholar
[49] Mannaa IM, El Gazayerly ON, Abdelbary AA, Saleh SS, Mostafa DA. Validated green spectroscopic manipulation of area under the curve (AUC) for estimation of Simvastatin: Application to nano-structured lipid carriers and niosomal systems. J Res Pharm. 2023;27(1):30–42.10.29228/jrp.285Suche in Google Scholar
[50] Pena-Pereira F, Wojnowski W, Tobiszewski M. AGREE – Analytical GREEnness metric approach and software. Anal Chem. 2020;92(14):10076–82.10.1021/acs.analchem.0c01887Suche in Google Scholar PubMed PubMed Central
[51] El-Maraghy CM, Saleh SS, Ibrahim MS, El-Naem OA. Green wastewater treatment of repurposed COVID-19 therapy (levofloxacin) using synthesized magnetite pectin nanoparticles, comparison with mesoporous silica nanoparticles. BMC Chem. 2023;17(1):134.10.1186/s13065-023-01048-4Suche in Google Scholar PubMed PubMed Central
[52] Płotka-Wasylka J. A new tool for the evaluation of the analytical procedure: Green analytical procedure index. Talanta. 2018;181:204–9.10.1016/j.talanta.2018.01.013Suche in Google Scholar PubMed
[53] Saleh SS, Lotfy HM, Elbalkiny HT. An integrated framework to develop an efficient valid green (EVG) HPLC method for assessment of antimicrobial pollutants with potential threats for human health in aquatic systems. Environ Sci: Process Impacts. 2023;25:2125–38.10.1039/D3EM00339FSuche in Google Scholar
[54] El Hamd MA, Soltan OM, Abdelrahman KS, Fouad A, Saleh SF, Obaydo RH, et al. Roth’s switch-on fluoremetric probe for green tracking and quantifying of 1.4-dihydropyridine medication: Evaluation of greenness, whiteness, and blueness. Sustain Chem Pharm. 2023;36:101294.10.1016/j.scp.2023.101294Suche in Google Scholar
[55] Morgan EM, Fayez YM, Boltia SA, Obaydo RH, Abdelkawy M, Lotfy HM. Spectrophotometric resolution methods for determination of dimenhydrinate and cinnarizine in presence of their toxic impurities: Greenness, environmental sustainability and blueness assessment tools. Bull Fac Pharm Cairo Univ. 2023;61(1):6.Suche in Google Scholar
[56] ICH, Q2B, Note for guidance on validation of analytical methods methodology. International Conference on Harmonization. IFPMA; 1997.Suche in Google Scholar
[57] Arunagiri T, Ganesan A, Ravi Kumaran V, Masilamani B, Kannaiah KP, Narayanasamy D. Green analytical chemistry-based spectrophotometric techniques for ternary component analysis of pain relievers. Future J Pharm Sci. 2024;10(1):1–13.10.1186/s43094-024-00648-8Suche in Google Scholar
[58] Lotfy HM, Obaydo RH, Sakur AA, editors. Evaluation of assay and in-vitro dissolution profile of certain fixed-dose combination using green analytical method. Elsevier; 2021.10.1016/j.pharma.2020.07.007Suche in Google Scholar PubMed
[59] Thongkam T, Apilux A, Tusai T, Parnklang T, Kladsomboon S. Thy-AuNP-AgNP hybrid systems for colorimetric determination of Copper(ii) ions using UV-Vis spectroscopy and smartphone-based detection. Nanomaterials. 2022;12(9):1449.10.3390/nano12091449Suche in Google Scholar PubMed PubMed Central
[60] Deetlefs M, Seddon KR. Assessing the greenness of some typical laboratory ionic liquid preparations. Green Chem. 2010;12(1):17–30.10.1039/B915049HSuche in Google Scholar
[61] Glaze WH. Sustainability engineering and green chemistry. Environ Sci Technol. 2000;34(21):449A.10.1021/es003465ySuche in Google Scholar PubMed
[62] Gałuszka A, Migaszewski Z, Namieśnik J. The 12 principles of green analytical chemistry and the significance mnemonic of green analytical practices. TrAC Trends Anal Chem. 2013;50:78–84.10.1016/j.trac.2013.04.010Suche in Google Scholar
[63] Takla SS, Shawky E, Hammoda HM, Darwish FA. Green techniques in comparison to conventional ones in the extraction of Amaryllidaceae alkaloids: Best solvents selection and parameters optimization. J Chromatogr A. 2018;1567:99–110.10.1016/j.chroma.2018.07.009Suche in Google Scholar PubMed
[64] Kannaiah KP, Chanduluru HK, Lotfy HM, Obaydo RH, El Hamd MA, Alshehri S, et al. Integrative AQbD, up-to-date greenness, and whiteness tools for evaluation of a sustainable RP-HPLC method used for simultaneous separation of triple antihypertensive combination therapy as a model. Sustainable Chem Pharm. 2023;36:101288.10.1016/j.scp.2023.101288Suche in Google Scholar
© 2024 the author(s), published by De Gruyter
This work is licensed under the Creative Commons Attribution 4.0 International License.
Artikel in diesem Heft
- Research Articles
- Microfabricated potentiometric sensor based on a carbon nanotube transducer layer for selective Bosentan determination
- A novel Six Sigma approach and eco-friendly RP-HPLC technique for determination of pimavanserin and its degraded products: Application of Box–Behnken design
- Enantiomeric separation of four pairs of alkaloids by using a C18 column tandem polysaccharide-based chiral column
- Sustainable HPLC technique for measurement of antidiabetic drugs: Appraisal of green and white metrics, content uniformity, and in vitro dissolution
- Quantitative analysis of mixed lipid nanostructures in rat skin by HPLC-MS
- Review Articles
- Recent advance in electrochemical immunosensors for lung cancer biomarkers sensing
- Latest trends in honey contaminant analysis, challenges, and opportunities for green chemistry development
- Quantitative methods in the analysis of clozapine in human matrices – A scoping review
- Review of potentiometric determination of cationic surfactants
- Surface-enhanced Raman spectroscopy in forensic analysis
- Special Issue: Greener Analytical Methods - Part II
- Greenness of dispersive microextraction using molecularly imprinted polymers
- KPI-based standards benchmarking for the preference of different analytical approaches developed for simultaneous determination of ciprofloxacin and hydrocortisone: A SWOT case study