A novel Six Sigma approach and eco-friendly RP-HPLC technique for determination of pimavanserin and its degraded products: Application of Box–Behnken design
-


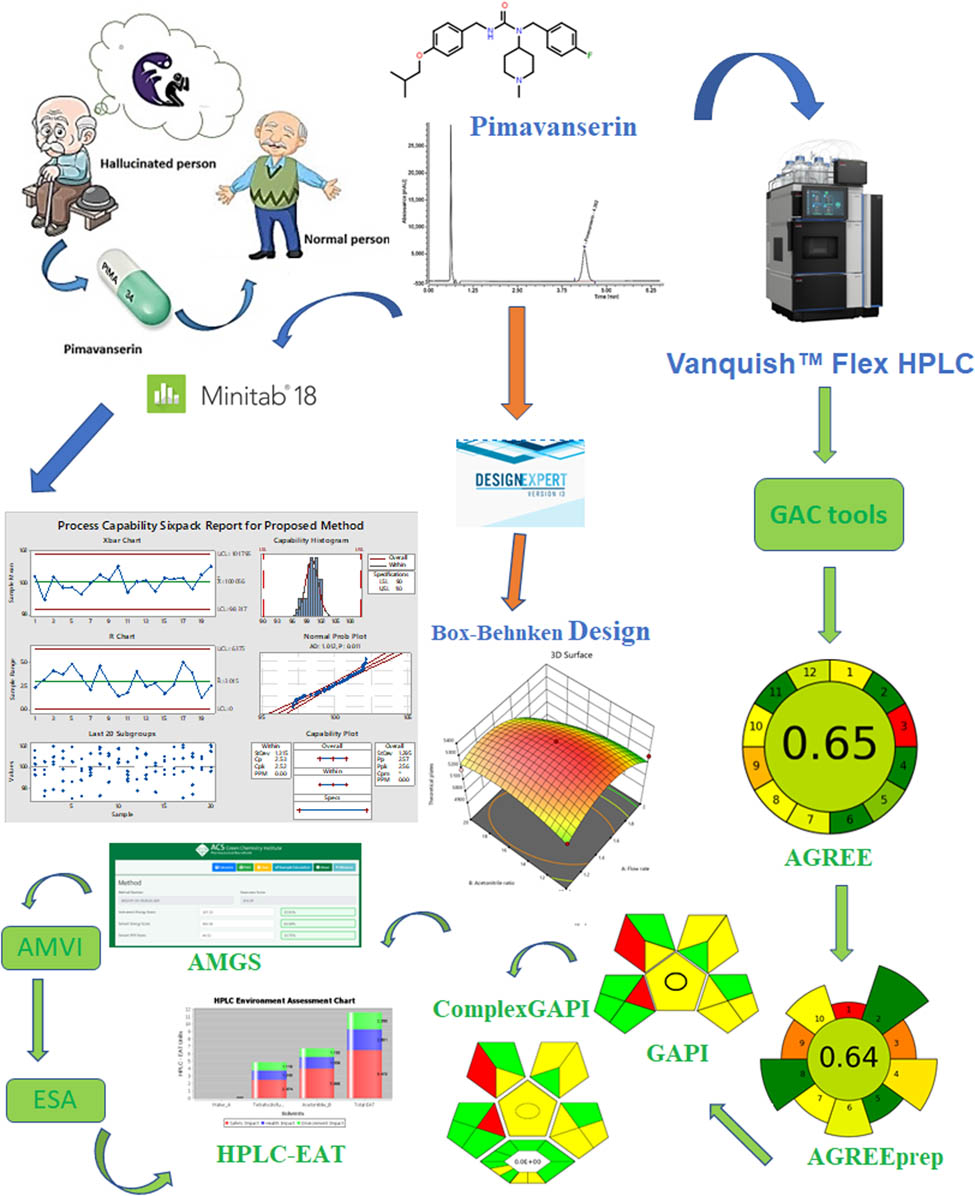
Abstract
A green analytical chemistry study attempts to generate environmentally friendly alternatives to dangerous compounds while reducing waste output. The study thoroughly analyzed eight green tools to determine their greenness. Given its importance in treating hallucinations and delusions produced by Parkinson’s disease psychosis, it is critical to have a reliable and precise method for identifying pimavanserin (PVS) in both pure form and pharmaceutical formulations. The current study used a straightforward approach to forced degradation experiments to establish a novel reversed-phase high-performance liquid chromatography method for evaluating stability. The method was executed on the Agilent Zorbax Eclipse Plus C18 column (100 × 4.6 mm, 3.5 μm particle size) with ultraviolet detection at 226 nm. The Box–Behnken design is the ultimate solution for identifying optimal chromatographic conditions in a timely and efficient manner, with minimal trials required. The study investigated the impact of three factors: acetonitrile ratio, column oven temperature, and flow rate on various responses, namely, retention time, tailing factor, and theoretical plates. Desirability and overlay plots were utilized to forecast the best mobile phase containing a buffer solution: acetonitrile: tetrahydrofuran in a ratio of (65: 20: 15, v/v/v), which proved highly effective in the experiments. Linearity was conducted for PVS in the 3–50 µg·mL−1 range with an R 2 coefficient of determination of 0.9997. PVS had detection and quantification limits of 1.1 and 3.5 µg·mL−1, respectively, indicating a highly significant correlation between the variables studied. PVS’s recovery percentage was determined to be 101.30%. We also used the Six Sigma lean technique to ensure precision and productivity. PVS was tested for acid, base, oxidative hydrolysis, photodegradation, and heat, as per International Council for Harmonisation guidelines. The highest degradation was obtained from oxidative hydrolysis and thermal degradation.
Graphical abstract
1 Introduction
Parkinson’s disease is a condition that affects the nervous system and can cause a range of symptoms that get worse over time. Early signs can develop slowly, but eventually, patients may experience hallucinations and visual delusions. Unfortunately, there is no cure for Parkinson’s disease, but medications are available to help alleviate the symptoms. One such medication is pimavanserin (PVS), which effectively treats hallucinations and delusions in patients with Parkinson’s disease psychosis. PVS is an atypical antipsychotic drug, and it is currently the only medication approved by the food and drug administration for treating these symptoms in patients with Parkinson’s disease [1,2]. PVS is recognized chemically as 1-[(4-fluorophenyl) methyl]-1-(1-methylpiperidin-4-yl)-3-[[4-(2-methylprop-oxy) phenyl] methyl] urea, which has the formula C25H34FN3O2 and a molecular weight of 427.6 g·mol−1 (Figure S1).
The improvements in chromatographic techniques that prioritize environmentally friendly practices are impressive. We must assess their possible environmental impact to guarantee that analytical procedures are helpful and environmentally friendly. We have many tools at our disposal, including the well-known analytical greenness (AGREE) tool. Several tools, such as analytical greenness metric for sample preparation (AGREEprep), green analytical procedure index (GAPI), complex green analytical procedure index (ComplexGAPI), analytical method volume intensity (AMVI), HPLC-environmental assessment tool (HPLC-EAT), analytical method greenness score (AMGS), and analytical eco-scale (ESA), have also been made to promote environmentally friendly analytical methods. We can significantly advance science by using these resources in our research and upholding our environmental responsibilities [3].
The Box–Behnken design (BBD) is the ultimate experiment for researchers aiming to maximize their efforts while minimizing resource consumption. Its simplicity and effectiveness translate to fewer experimental runs than alternative designs, making it the favored strategy. Moreover, the BBD’s capability to identify variables’ linear and quadratic effects provides a comprehensive understanding of the experimental system [4]. The utilization of BBD can significantly enhance the precision of experimental findings. Using BBD, the chromatographic conditions are optimized, resulting in enhanced precision throughout the development and validation of the HPLC analytical technique. The improved conditions can be regularly employed for analyses, enhancing the efficiency of HPLC procedures. In addition, the peak parameter is tweaked until it reaches the appropriate degree of satisfaction. Despite the necessity to assess many aspects, the BBD technique is straightforward to handle and will yield dependable outcomes [5,6]. The BBD is unquestionably one of the experimental design’s most widely utilized Response surface methodology (RSM). BBD is formulated to circumvent extreme amalgamations of components by employing a three-level factorial design that solely utilizes the midpoints of the edges and center points. An essential benefit of BBD in comparison to central composite design (CCD) is its reduced number of iterations and improved consistency throughout the design area. The design matrix of BBD may be developed with fewer experimental runs, giving it a more cost-effective and feasible alternative to CCD. Nevertheless, it is essential to acknowledge that BBD does have certain constraints. For instance, it can only calculate part of the quadratic model for components with four factors or factors that are difficult to modify. Notwithstanding these constraints, BBD remains a promising choice for experimental design [7,8].
Recently, most industries have adopted several methods for improving efficiency, preventing, and eliminating process errors, and improving the capability of overall processes, such as routine analytical procedures, quality tools, and lean Six Sigma methodologies. As a result, pharmaceutical companies have also implemented these strategies to improve their processes [9,10]. An essential aspect of Six Sigma is minimizing variance between factors. Six Sigma strategies ensure process quality by implementing various effective procedures. A process capability index (Cpk) and a process capability (Cp) are two statistics that can be used to calculate process performance and capability [11,12]. The evidence presented in Table 1 shows that the Six Sigma methodology is unquestionably superior to all previously used approaches for estimating PVS and its degradation products. This innovative technique exhibits a higher level of selectivity and is more environmentally sustainable than traditional methods. These results emphasize staying current with the latest methodologies and techniques.
Data description for the process capability sixpack, including reported and proposed methodologies
| Results | Parameters | |
|---|---|---|
| Proposed | Reported [19] | Descriptive statistic |
| 97.1 | 97.0 | Minimum |
| 102.1 | 102.3 | Maximum |
| 100.06 | 99.995 | Mean |
| 90–110% | 90–110% | Limit |
| 10,005.6 | 9,999.5 | Sum |
| 100 | 100 | Count |
| 0.13 | 0.14 | Standard error |
| 100.1 | 100.05 | Median |
| 99.3 | 99.3 | Mode |
| 1.29 | 1.37 | Standard deviation |
| 1.68 | 1.88 | Variance |
| −0.33 | −0.64 | Kurtosis |
| −0.54 | −0.39 | Skewness |
| 5 | 5.3 | Range |
Neither the United States Pharmacopeia nor the British Pharmacopeia include PVS. Numerous recent studies have been conducted on PVS identification and quantification [13,14]. One study that particularly caught our attention was Aalapati et al. This study developed a ultra-high-performance liquid chromatography mass spectrometry (UHPLC-MS/MS) method for estimating PVS in human plasma, with an average recovery value of 86% [15]. Additionally, Panda et al. developed an reversed-phase high-performance liquid chromatography (RP-HPLC) method with an 80% recovery value [16]. Ezzeldin et al. identified PVS using a highly sensitive UPLC-MS/MS with recovery values of 86% in both plasma and tissues [17]. This same technique was employed to quantify and evaluate PVS tartrate in rat plasma, with an average recovery value of 77% [18]. Finally, Koduri et al. developed an HPLC technique with an impressive average recovery percentage of 99.8% [19].
A meticulous literature analysis has established that additional techniques are necessary to accurately identify PVS and their associated degradation compounds while adhering to eight green metrics. We have successfully addressed this challenge using the BBD and the Six Sigma method. A comprehensive understanding of drug stability is paramount to our objective. Our primary aim is to devise simple, accessible, and replicable HPLC methodologies that enable swift estimation of the pharmaceutical ingredient under investigation. Our innovative approach employs stability-indicating RP-HPLC techniques to assess multiple active components and their associated degradants in a single analysis. Our study prioritizes environmental sustainability and adherence to Six Sigma principles, incorporating various approaches, including assays, degradation tests, and comparisons with prior HPLC methodologies.
2 Materials and methods
2.1 Chemicals and reagents
PVS was purchased from Polpharma, located in Starogard Gdański, Poland, with a purity of 99.12%. Acadia Pharmaceuticals Inc. manufactured the NUPLAZID 17 mg tablets in San Diego, USA. Hydrochloric acid, acetonitrile, bi-distilled water, sodium hydroxide, hydrogen peroxide, monobasic potassium phosphate, and tetrahydrofuran were obtained from Merck (Darmstadt, Germany).
2.2 Instrumentation and software
The highly efficient Vanquish Flex model HPLC apparatus from Thermo Fisher Scientific (Massachusetts, USA) yields consistent and reliable results, along with the Zorbax Eclipse Plus C18 (100 mm × 4.6 mm, 3.5 µm) HPLC Column from Agilent Technologies (California, USA).
Stat-Ease, Inc.’s (Minnesota, USA) Design-Expert version 13 was used to investigate response surface methodology. Quality by Design and Six Sigma were utilized by Minitab 2018 to evaluate the process capability index, all from Minitab, LLC (Pennsylvania, USA). HPLC-EAT, a software tool for assessing liquid chromatography methods, is designed to evaluate liquid chromatography methods. A free version of the software is available at http://www.biotek.lu.se/hplc-eat/. The AMGS program has a website (https://www.acsgcipr.org/amgs) that can be accessed through ACS-GCI-PR. Software based on ComplexGAPI is available for free at mostwiedzy.pl/complexgapi. AGREE can be accessed at https://mostwiedzy.pl/AGREE, with the most recent edition available at https://git.pg.edu.pl/p174235/AGREE. At https://agreeprep.anvil.app, we can use AGREEprep to assess how green sample preparation is during analytical procedures.
2.3 Diluent
Purified water:acetonitrile at a ratio of 1:1.
2.4 Stock standard solutions
We prepared the standard solution by weighing 20 mg PVS tartrate, equivalent to 17 mg of PVS, in a 100 mL volumetric flask. After adding the diluent, we sonicated the mixture for 10 min. To achieve the final 17 µg·mL−1 concentration, we added the diluent to 1 mL of the standard stock solution in a 10 mL volumetric flask.
2.5 Analysis of PVS in tablet sample solution
After experimenting, we determined the concentration of PVS in the test solution. We took the equivalent of 17 mg of PVS base from ten tablets and dissolved it with a diluent in a 100 mL volumetric flask after sonication for 15 min. By diluting 1 mL of the stock test solution with diluent in a 10 mL volumetric flask, we achieved a final concentration of 17 µg·mL−1 of PVS for the test solution. We injected 10 µL of this solution into the HPLC system and recorded the chromatogram. Through this process, we could measure PVS and identify its peak area. Overall, the experiment successfully determined the concentration of PVS in the test solution.
2.6 Chromatographic conditions
After a thorough investigation, we utilized modern technology such as the Vanquish Flex-type HPLC system. We used the Agilent Zorbax Eclipse plus C18 HPLC Column for our specific experiment. This column has a constant flow rate of 1.5 mL·min−1, measures 100 mm × 4.6 mm with a particle size of 3.5 µm, and is maintained at room temperature. To ensure accuracy, we used an isocratic elution procedure and a buffer solution:acetonitrile:tetrahydrofuran (65:20:15, v/v/v). The detection wavelength was fixed at 226 nm, and we injected 10 µL of samples. The results were accurate and reliable.
2.7 Construction of calibration curves
After completing the dilutions, we achieved the desired final concentrations by skillfully adding the diluent. We then meticulously plotted the peak area responses and the final PVS concentrations against each other to analyze the results precisely.
2.8 Application of Six Sigma methodology
Industries can significantly improve production procedures using the Cpk. This index eliminates scrap while enhancing product quality and consistency, reducing production costs and losses associated with subpar quality. By analyzing the behavior of the process, industries can obtain the Cpk value. A high Cpk value indicates that the process operates close to its specified center limit, even with significant fluctuations. Conversely, a low Cpk value signifies that the process requires improvement. Industries should aim for a Cpk of 1.33 (4 sigma) or higher to meet the expectations of most customers [20].
2.8.1 Evaluation of the proposed methodology’s capabilities
In this study, an investigation is conducted to determine if a specific methodology can meet predetermined standards or specifications statistically. The precision of the procedure is measured by examining many samples. Through a thorough review of the methodology’s correctness, the aim of this study is to determine whether the approach can meet the established requirements. As a result, the subsequent range enables evaluating the capability of managed processes. There is no metric for measuring capacity based on Cp [21]. Nominal or target values are used to evaluate process performance. In this case, Cpk is used, which is defined as follows:
In statistical process control, it is customary to use USLs and LSLs as abbreviations to signify upper and lower specification limits. These limitations are critical in determining the acceptable range for a product or process parameter to ensure that the outputs remain within the required parameters. Furthermore, it displays the standard deviation, which reflects the variability of the process. These statistical measurements can confidently ensure a product’s or process’s quality. The flowchart in Figure S2 shows how to compute the capability sixpack to determine the method’s competence.
2.9 Design of experiment for optimizing RP-HPLC method
After our initial screening investigation, we identified the critical variables impacted by chromatographic separation. To ensure the best resolution and shortest retention time for both medications, we utilized three variables at three levels of BBD with RSM. These variables included flow rate, acetonitrile ratio in the mobile phase, and column oven temperature. We conducted 17 experimental runs, emphasizing retention time, tailing factor, and theoretical plate. By utilizing the information presented in Table 2, we created a second-order polynomial equation that accurately represents the quadratic models. Additionally, we demonstrated the interaction between the independent variables by creating a 3D response surface. We employed overlay plots and the desirability function to predict the optimum outcome.
Box–Behnken experimental design factors and responses for the best strategy
| Factor 1 | Factor 2 | Factor 3 | Response 1 | Response 2 | Response 3 | ||
|---|---|---|---|---|---|---|---|
| Std | Run | A: Flow rate | B: Acetonitrile ratio | C: Column temperature | Retention time | Tailing factor | Theoretical plates |
| 1 | 15 | 1 | 10 | 30 | 4.784 | 1.34 | 5,186 |
| 2 | 10 | 2 | 10 | 30 | 4.296 | 1.38 | 5,167 |
| 3 | 3 | 1 | 20 | 30 | 4.576 | 1.36 | 5,189 |
| 4 | 7 | 2 | 20 | 30 | 4.102 | 1.42 | 4,921 |
| 5 | 11 | 1 | 15 | 25 | 4.884 | 1.33 | 5,178 |
| 6 | 14 | 2 | 15 | 25 | 4.284 | 1.37 | 4,940 |
| 7 | 4 | 1 | 15 | 35 | 4.623 | 1.35 | 5,197 |
| 8 | 8 | 2 | 15 | 35 | 4.21 | 1.39 | 5,000 |
| 9 | 5 | 1.5 | 10 | 25 | 4.526 | 1.28 | 5,155 |
| 10 | 6 | 1.5 | 20 | 25 | 4.362 | 1.29 | 5,159 |
| 11 | 17 | 1.5 | 10 | 35 | 4.508 | 1.33 | 5,192 |
| 12 | 2 | 1.5 | 20 | 35 | 4.312 | 1.34 | 5,185 |
| 13 | 16 | 1.5 | 15 | 30 | 4.498 | 1.32 | 5,350 |
| 14 | 12 | 1.5 | 15 | 30 | 4.498 | 1.32 | 5,350 |
| 15 | 13 | 1.5 | 15 | 30 | 4.498 | 1.32 | 5,350 |
| 16 | 1 | 1.5 | 15 | 30 | 4.498 | 1.32 | 5,350 |
| 17 | 9 | 1.5 | 15 | 30 | 4.498 | 1.32 | 5,350 |
3 Results
3.1 Initial assessment
Several experiments were performed until the method was developed under ideal chromatographic conditions, including altering the flow rate from 0.5 to 2 mL·min−1 until reaching the ideal flow rate of 1.5 mL·min−1. Various packing materials and column lengths were tested, including C8, C18, phenyl, and cyano columns. The Agilent Zorbax Eclipse Plus C18 column (150 mm × 4.6 mm, 3.5 µm) was selected for its outstanding performance, providing the highest number of theoretical plates and the best resolution. A C18 column was the most outstanding choice during extensive testing. As a result of the additional carbons in the C18 packing material, the mobile phase could traverse a larger surface area, extending the contact time between the bonded phase and the eluates. Therefore, the elution of the samples was slower and more distinct. As a result of their instability and repeatability concerns, cyano and phenyl columns are also less commonly used. Wavelength was selected by scanning wavelengths in the range of 200–400 nm, giving a clear chromatogram with sharp peaks with high resolution at 226 nm. A variety of mobile phase formulations, including methanol/water (30:70, v/v), acetonitrile/water (50:50, v/v), monobasic potassium dihydrogen phosphate solution at pH 3: ethanol (50:50, v/v), and monobasic potassium dihydrogen phosphate solution at pH 5.0: ethanol (50:50, v/v), have been used, but no distinct sharp peaks have been obtained. The role of tetrahydrofuran was to increase the selectivity and provide excellent possibilities for separation due to its eluting power compared to other organic solvents [22]. A recent experiment found that buffer solution, tetrahydrofuran, and acetonitrile were the best mobile phases to assess the PVS drug. We noticed considerable changes in the retention duration, tailing factor, and theoretical plate when we changed the acetonitrile ratio, column oven temperature, and flow rate. According to the results, the flow rate of the mobile phase, column oven temperature, and acetonitrile ratio were the most important variables influencing the experiment’s responses. Future investigations should consider these factors as they substantially impact their responses.
3.2 Design of experiments (DoE)
It is essential to state that the HPLC method development process has undergone a significant transformation. Analysts previously relied on trial and error, leveraging their knowledge and expertise to achieve desired outcomes. However, the traditional one-factor-at-a-time method is now considered less efficient since it requires considerable time, effort, and funding yet only delivers partially justified results. On the other hand, the BBD has proven more effective in determining the impact of factors and their interactions on measured responses while using the fewest possible experiments. This approach is more reliable and produces the desired result with greater accuracy. Optimizing chromatographic methods is crucial, and fortunately, the BBD DoE method is the most advanced technique available. This method is highly efficient and quickly determines the optimal settings for chromatography, producing second-order polynomial equations for the response classifier and emphasizing the significance of specific elements. The BBD method can significantly reduce the required trials, making it a highly favorable option. However, it is essential to note that the BBD may not be able to consider all possible combinations of variables at extreme values, particularly at the highest or lowest levels, which may impact results. The BBD method remains the most cutting-edge and effective strategy for improving chromatographic methods. Our thorough experimentation has discovered that the BBD technique is a precious tool for simplifying procedures. However, we have yet to fully explore its potential in predicting reactions to extreme independent variables. To ensure optimal precision in our results, we performed three rounds of testing utilizing a zero-level column oven temperature of 30, a flow rate of 1.5, and an acetonitrile ratio of 15%. Incorporating randomization in the final 15 runs allowed us to effectively mitigate the impact of external factors and promptly identify any errors in our process [23].
3.3 Techniques for statistical modeling
The analysis considers the model and its terms statistically significant if the P-value is less than 0.05. The regression models’ R-squared and modified R-squared values were within acceptable bounds (R > 0.8), indicating a decent fit with a polynomial equation and assisting in estimating the model’s predictive ability. This indicates proper data matching. The high forecasted R-squared values further highlight the vital forecasting accuracy of the model for successive estimations.
3.4 Effects of various variables
3.4.1 Impact of variables on retention time
The statistical analysis reveals the undeniable value of the model, as proven by the remarkable Model F-value of 50.02. All the P-values for the model terms A (flow rate), B (acetonitrile ratio), and C (column temperature) fall below the 0.0500 threshold, confirming the indispensability and appropriateness of these factors. With a probability of only 0.01%, the statistical evidence unequivocally shows that the observed F-value cannot be ascribed to random noise, as Table 3 attests. These compelling findings establish the model’s reliability and the valuable insights it offers to the data. Our investigation has definitively shown that the relationship between factors and the retention time response of PVS is highly intricate. We have identified a positive quadratic effect and a visibly negative linear impact. This demonstrates that increased variables may lead to decreased retention time response. Therefore, it is imperative to identify the optimal variable values that can maximize the retention time response. The positive sign preceding the interaction words also signifies that when two variables interact, they tend to behave similarly. To achieve the most exceptional outcomes, it is crucial to meticulously consider the impact of variables on the PVS retention time response. Based on the results presented in Figure 1, the retention time of PVS is significantly affected by the flow rate (A), acetonitrile ratio (B), and column temperature (C). A polynomial equation, 3D graphs, and contour plots were utilized to determine the relationship between these variables. Furthermore, the mobile phase ratio plays a vital role in determining the retention time of PVS. It was found that an increase in the column temperature and acetonitrile ratio leads to a considerable decrease in the retention time of PVS.
Quadratic approach of retention time response using ANOVA
| Sum of squares | Df | Mean square | F-value | p-value | ||
|---|---|---|---|---|---|---|
| Model | 0.6081 | 9 | 0.0676 | 50.02 | <0.0001 | Significant |
| A-Flow rate | 0.4876 | 1 | 0.4876 | 360.91 | <0.0001 | |
| B-Acetonitrile ratio | 0.0726 | 1 | 0.0726 | 53.72 | 0.0002 | |
| C-Column temperature | 0.0203 | 1 | 0.0203 | 15.03 | 0.0061 | |
| AB | 0.0000 | 1 | 0.0000 | 0.0363 | 0.8544 | |
| AC | 0.0087 | 1 | 0.0087 | 6.47 | 0.0384 | |
| BC | 0.0003 | 1 | 0.0003 | 0.1895 | 0.6764 | |
| A² | 0.0002 | 1 | 0.0002 | 0.1695 | 0.6929 | |
| B² | 0.0183 | 1 | 0.0183 | 13.52 | 0.0079 | |
| C² | 0.0001 | 1 | 0.0001 | 0.0819 | 0.7831 | |
| Residual | 0.0095 | 7 | 0.0014 | |||
| Lack of fit | 0.0095 | 3 | 0.0032 | |||
| Pure error | 0.0000 | 4 | 0.0000 | |||
| Cor total | 0.6176 | 16 | ||||
| R ² | 0.9847 | |||||
| Adjusted R ² | 0.9650 | |||||
| C.V. % | 0.8226 |
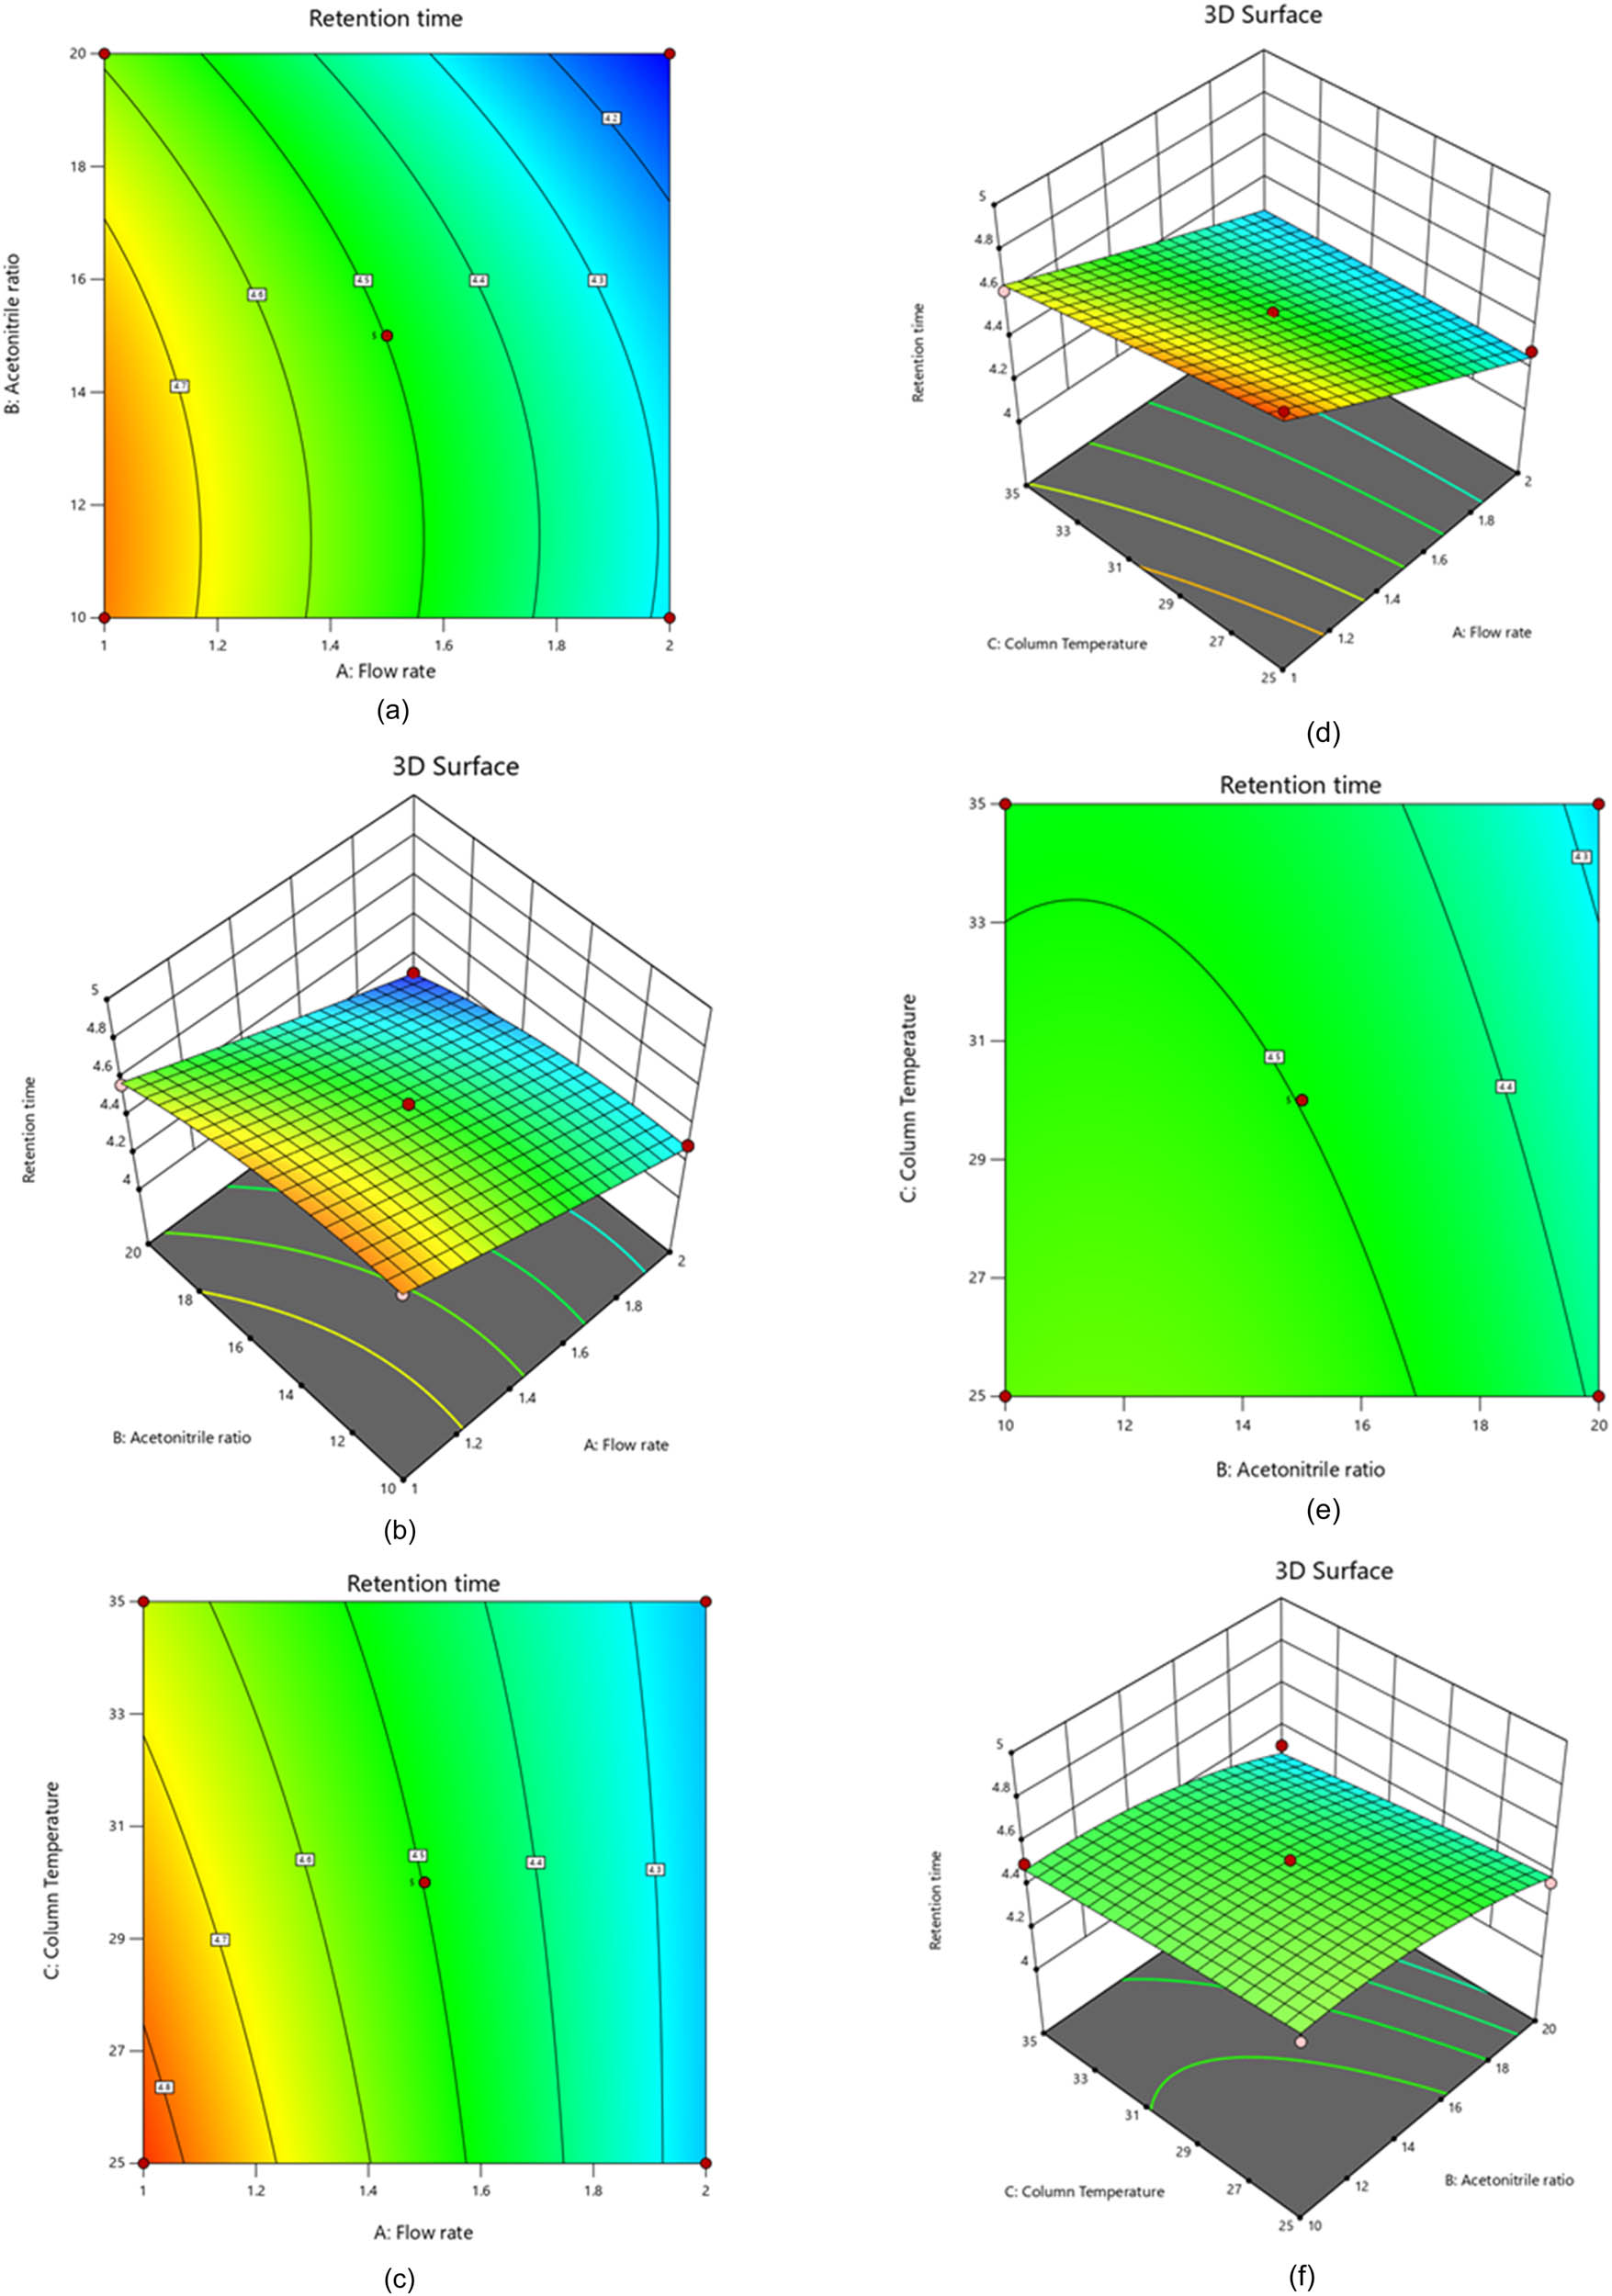
Contour and 3D-response surface plots showing the influence of flow rate and acetonitrile ratio (a and b), flow rate and column temperature (c and d), and acetonitrile ratio and column temperature (e and f) on PVS retention time.
Conversely, PVS’s retention duration is reduced when the acetonitrile ratio and column temperature increase. Experienced chemists understand that there are more intelligent ways to create analytical techniques than merely prolonging retention time. This approach can be wasteful, leading to a loss of precious time and mobile phase due to longer chromatogram run times. The PVS analytical technique was developed with an intermediate acetonitrile ratio and a low column temperature level to ensure maximum efficiency, long-term column maintenance, and minimal mobile phase waste. This technique has also reduced PVS retention time [24]. Through the investigative process, it has been determined that the primary factor influencing retention time is the flow rate (A). As the flow rate increases, the retention time decreases; conversely, the retention time increases as the flow rate decreases. A negative correlation has also been observed between the column temperature and the acetonitrile ratio. It has been discovered that increased acetonitrile ratios while maintaining low column temperatures reduced retention time response. It is important to note that the interaction between flow rate (A) and acetonitrile ratio (B) had a positive effect on the retention time response. We have found that the flow rate (A) and column temperature (C) directly impact the retention time, as indicated by our linear regression analysis. We can now streamline our operations and achieve better results by obtaining a second-order polynomial Eq. 1 to illustrate this relationship between predictor factors and responses [25].
where Rt is the retention time response for PVS drug, A (flow rate), B (acetonitrile ratio), C (column temperature), AB (flow rate × acetonitrile ratio), AC (flow rate × column temperature), and BC (acetonitrile ratio × column temperature) reflect the interaction of the variables, while A² (flow rate²), B² (acetonitrile ratio²), and C² (column temperature ²) are the quadratic terms.
3.4.2 Impact of variables on tailing factor
With an F-value of 21.67, we can confidently state that the model is significant. This occurrence only happens approximately 0.03% of the time when an F-value of this magnitude is caused by noise. Moreover, the model terms are adequate, with p-values lower than 0.0500. Noteworthy model terms include A, B, C, A 2, and C 2, as shown in Table 4. It is worth mentioning that the flow rate (A) positively affects the tailing factor. However, it is crucial to note that this impact on peak tailing is insignificant. Using a more significant tailing factor for the chromatographic procedure is not advisable as this may lead to unsatisfactory results [24]. Figure 2 showcases that the flow rate (A), acetonitrile ratio (B), and column temperature (C) have a substantial influence on the PVS tailing factor. Polynomial Eq. 2, 3D graphs, and contour plots illustrate the relationships between these variables with great accuracy. The PVS tailing factor depends on several factors, with the mobile phase ratio being one of the most crucial. To achieve the best results, it is essential to consider the acetonitrile ratio and column temperature. Increasing these parameters can lead to a substantial increase in the PVS tailing factor.
Quadratic approach of tailing factor response using ANOVA
| Source | Sum of squares | Df | Mean square | F-value | p-value | |
|---|---|---|---|---|---|---|
| Model | 0.0195 | 9 | 0.0022 | 21.67 | 0.0003 | Significant |
| A-Flow rate | 0.0040 | 1 | 0.0040 | 40.50 | 0.0004 | |
| B-Acetonitrile ratio | 0.0008 | 1 | 0.0008 | 8.00 | 0.0255 | |
| C-Column Temperature | 0.0024 | 1 | 0.0024 | 24.50 | 0.0017 | |
| AB | 0.0001 | 1 | 0.0001 | 1.0000 | 0.3506 | |
| AC | 0.0000 | 1 | 0.0000 | 0.0000 | 1.0000 | |
| BC | 0.0000 | 1 | 0.0000 | 0.0000 | 1.0000 | |
| A² | 0.0116 | 1 | 0.0116 | 116.05 | <0.0001 | |
| B² | 0.0000 | 1 | 0.0000 | 0.2632 | 0.6237 | |
| C² | 0.0007 | 1 | 0.0007 | 6.58 | 0.0373 | |
| Residual | 0.0007 | 7 | 0.0001 | |||
| Lack of fit | 0.0007 | 3 | 0.0002 | |||
| Pure error | 0.0000 | 4 | 0.0000 | |||
| Cor total | 0.0202 | 16 | ||||
| R ² | 0.9653 | |||||
| Adjusted R ² | 0.9208 | |||||
| C.V. % | 0.7463 |
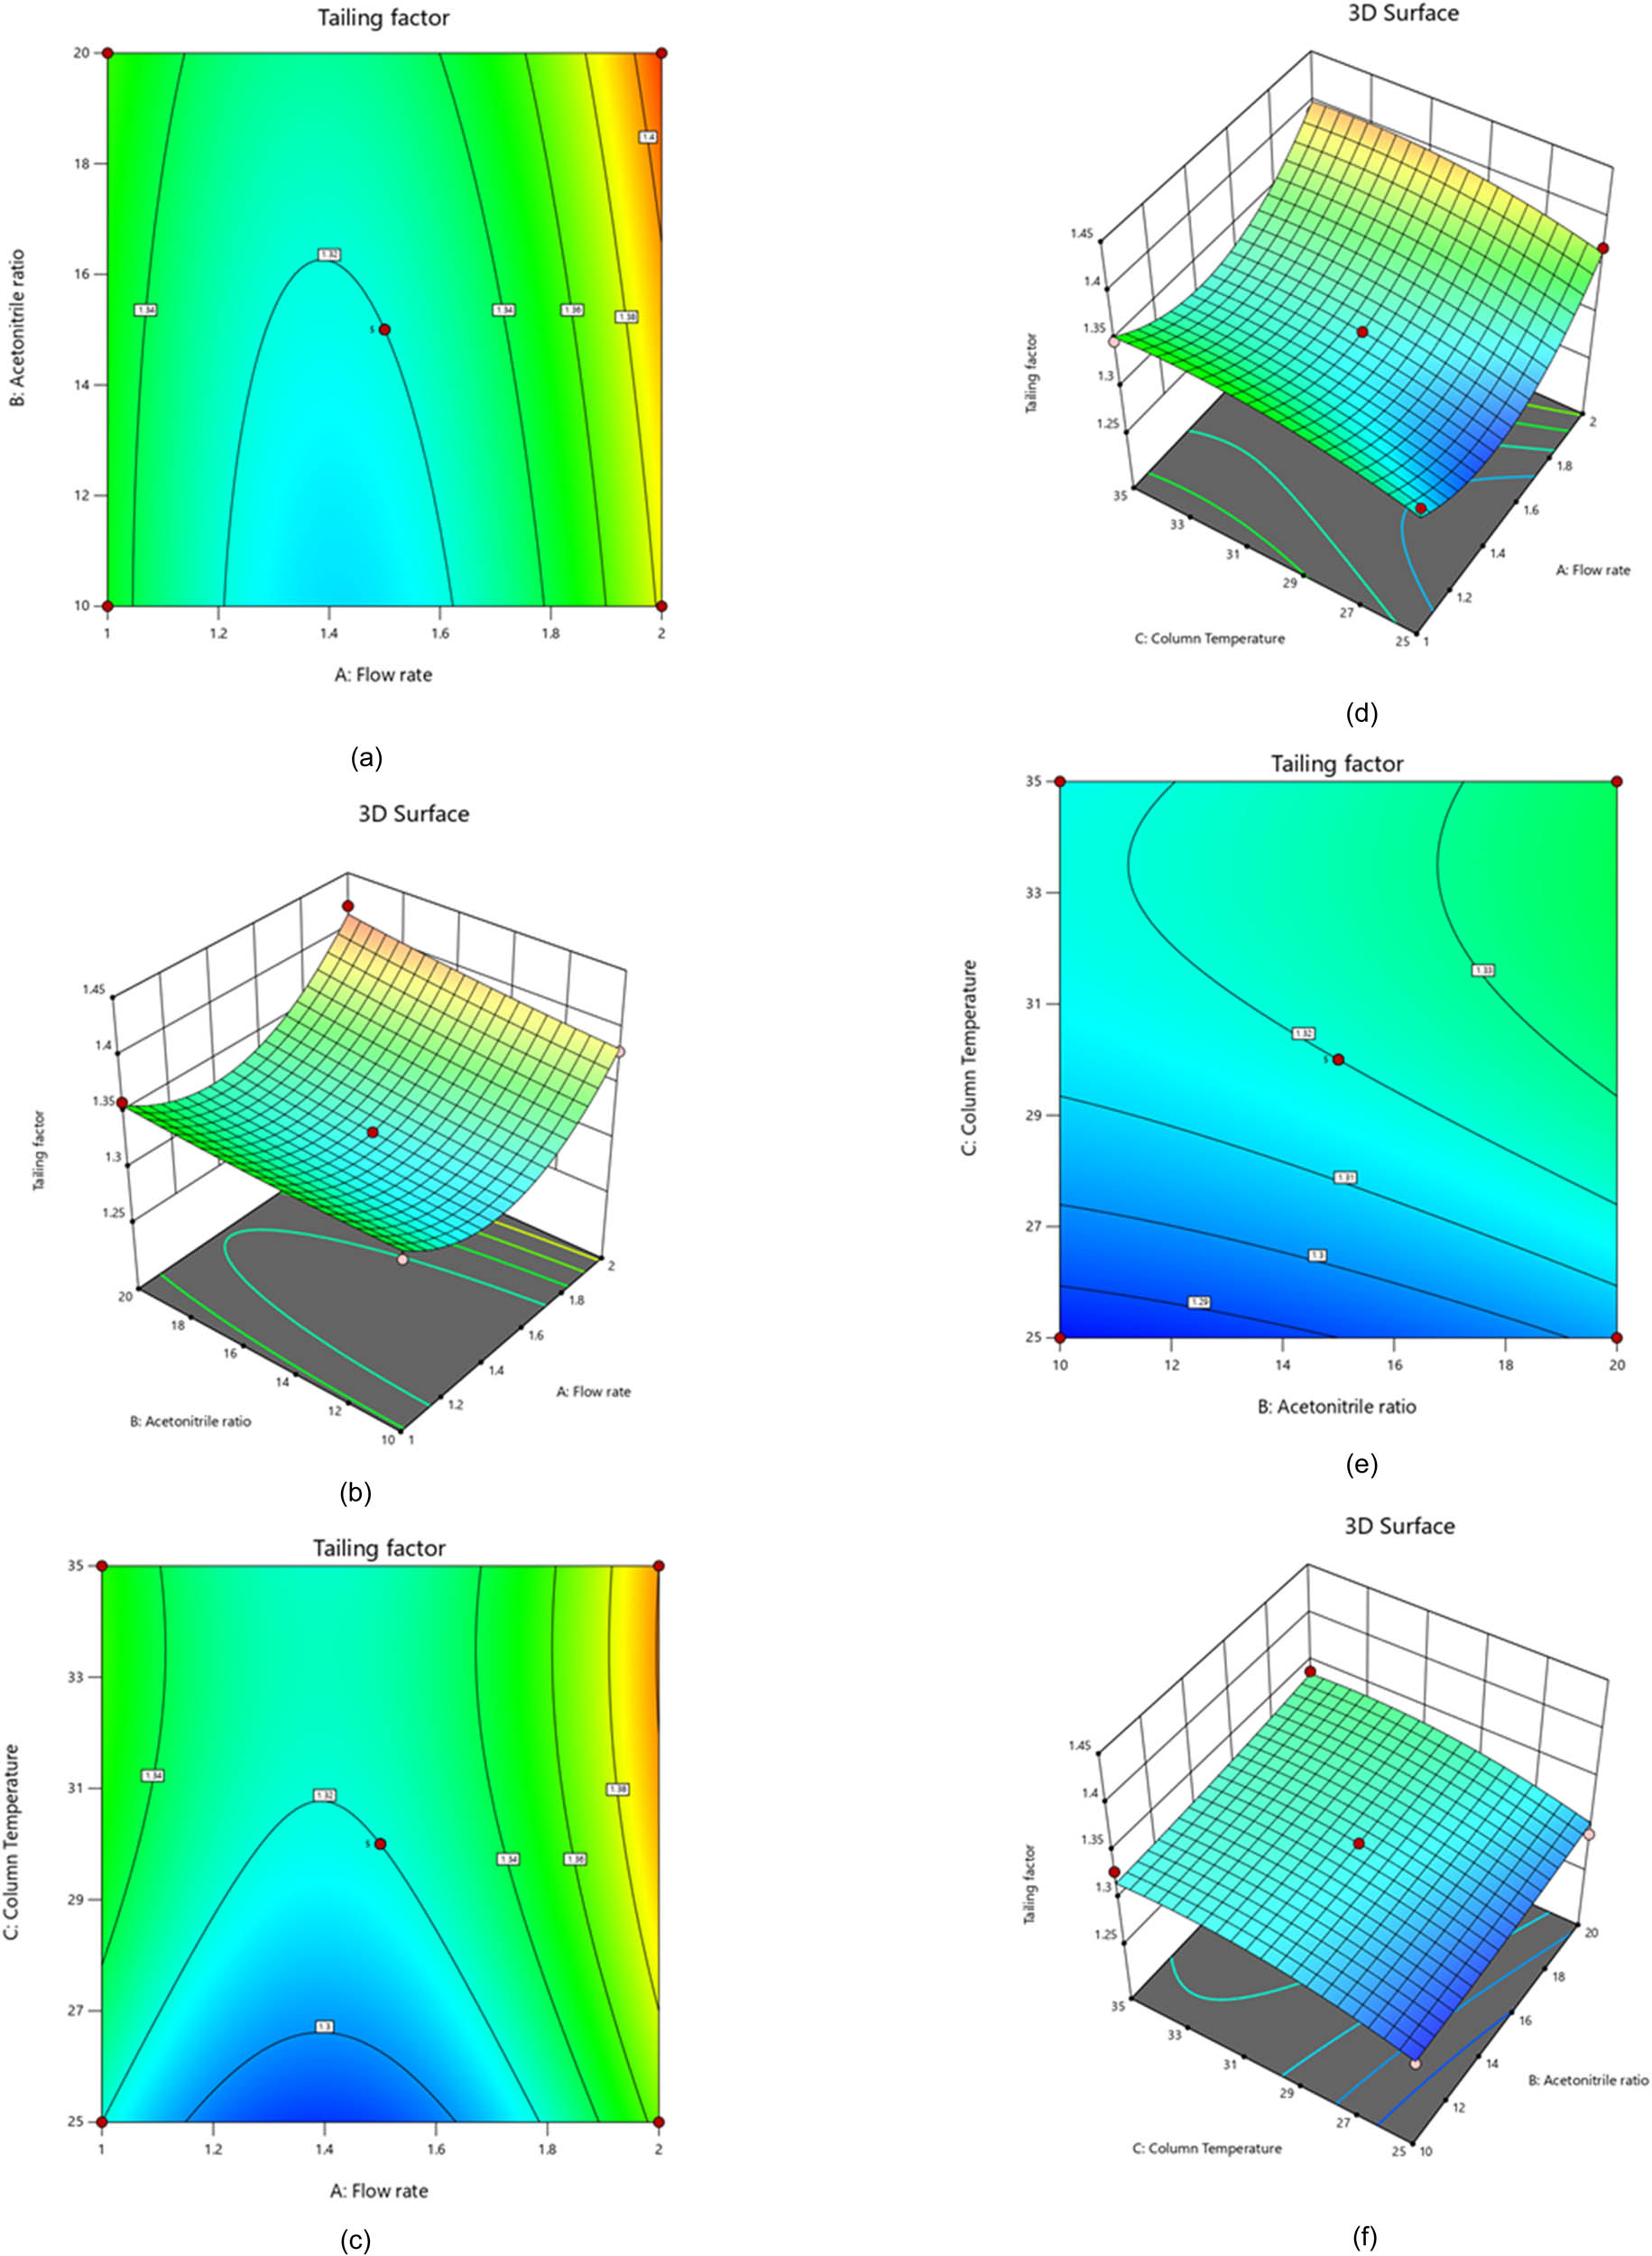
Contour and 3D-response surface plots show the effects of flow rate and acetonitrile ratio (a and b), flow rate and column temperature (c and d), and acetonitrile ratio and column temperature (e and f) on the PVS tailing factor.
Conversely, decreased acetonitrile ratio and column temperature significantly drop the PVS tailing factor. To optimize the system, it is recommended to use a low column temperature and an intermediate acetonitrile ratio. It is also worth noting that the combination of flow rate and acetonitrile ratio positively affects the tailing factor response. Furthermore, the acetonitrile ratio and column temperature can also favorably affect the tailing factor response. We analyzed the data and found that flow rate (A) and column temperature (C) significantly impact the tailing variables. To better understand this correlation, we used linear regression analysis to derive a second-order polynomial Eq. 2 that reveals the relationship between the responses and predictor factors. This knowledge allows us to optimize our methods and achieve better results [25].
where Tf is the tailing factor response for PVS drug.
3.4.3 Effect of variables on theoretical plates
Based on the statistical analysis conducted, it was found that the model is significant, with an F-value of 22.77. Such a high F-value could only occur around 0.02% of the time owing to noise, indicating that the model terms are required. The critical model terms identified were A, AB, C, A 2, B 2, and C 2, as shown in Table 5. The data presented in Figure 3 also revealed that flow rate (A), acetonitrile ratio (B), and column temperature (C) have a significant impact on the PVS theoretical plates. A polynomial Eq. 3, 3D graphs, and contour plots were used to further demonstrate these variables’ correlations. Overall, the findings suggest that carefully considering these variables is necessary to optimize PVS theoretical plates. When discussing the PVS theoretical plates, it is crucial to consider the column temperature (C). The number of PVS theoretical plates can increase as the column temperature rises, but it could ultimately impact the column’s efficiency. That is why we decided to go with a lower column temperature. However, it is worth noting that the flow rate (A) and acetonitrile ratio (B) can both have a detrimental effect on theoretical plates. Increasing the flow rate (A) and acetonitrile ratio (B) could lower the PVS theoretical plates significantly. So, we chose an intermediate flow rate for our approach. According to the findings, it was observed that the flow rate and column temperature had a positive effect on the theoretical plates. In contrast, the acetonitrile ratio and column temperature had a negative impact [26].
where N is the theoretical plate response for the PVS drug.
Quadratic approach of theoretical plate response using ANOVA
| Source | Sum of squares | Df | Mean square | F-value | p-value | |
|---|---|---|---|---|---|---|
| Model | 2.919 × 10⁵ | 9 | 32,437.54 | 22.77 | 0.0002 | Significant |
| A-Flow rate | 65,160.50 | 1 | 65,160.50 | 45.75 | 0.0003 | |
| B-Acetonitrile ratio | 7,564.50 | 1 | 7,564.50 | 5.31 | 0.0546 | |
| C-Column temperature | 2,520.50 | 1 | 2,520.50 | 1.77 | 0.2251 | |
| AB | 15,500.25 | 1 | 15,500.25 | 10.88 | 0.0131 | |
| AC | 420.25 | 1 | 420.25 | 0.2951 | 0.6039 | |
| BC | 30.25 | 1 | 30.25 | 0.0212 | 0.8882 | |
| A² | 1.134 × 10⁵ | 1 | 1.134 × 10⁵ | 79.63 | <0.0001 | |
| B² | 20,705.33 | 1 | 20,705.33 | 14.54 | 0.0066 | |
| C² | 48,319.01 | 1 | 48,319.01 | 33.93 | 0.0006 | |
| Residual | 9,970.00 | 7 | 1,424.29 | |||
| Lack of fit | 9,970.00 | 3 | 3,323.33 | |||
| Pure error | 0.0000 | 4 | 0.0000 | |||
| Cor total | 3.019 × 10⁵ | 16 | ||||
| R² | 0.9670 | |||||
| Adjusted R ² | 0.9245 | |||||
| C.V. % | 0.7273 |

Plots of the contour and 3D-response surfaces depict the effects of flow rate and acetonitrile ratio (a and b), flow rate and column temperature (c and d), and acetonitrile ratio and column temperature (e and f) on the theoretical PVS plates.
3.5 Combined desirability parameters
We could accurately anticipate the ideal separation criterion based on the overlay plots shown in Supplementary Figure S3a–f and our numerical optimization tool. We obtained a low tailing factor, a significant theoretical plate, and a retention time of under 4.4 min by making the system more enticing. We tested the suggested technique after identifying the most crucial parameters and experimenting with various parameter adjustments in the lab. As shown in Figure 4, we have found that the optimal chromatographic method uses a mobile phase containing a buffer solution:acetonitrile:tetrahydrofuran in a ratio of 65:20:15, v/v/v) with a flow rate of 1.5 mL·min−1. This method’s high precision, asymmetric peak, and short retention time will ensure that our investigation is adequate and accurate.

HPLC chromatogram of PVS recorded at wavelength 226 nm.
3.6 Lean Six Sigma technique
The Cpk metric is a valuable tool for businesses aiming to optimize their processes. By utilizing this statistical term, organizations can effectively reduce inefficiencies caused by low quality. Considering significant fluctuations, Cpk assesses how close a process is to its desired center limit. A higher Cpk score indicates consistent performance and reliable results, while a lower score indicates the need for process improvement. In the case of pharmaceutical product analysis batches, the suggested approach was used to perform the PVS assay test, and the resulting data were analyzed using the Minitab program to create a process capability sixpack report. Continually staying inside the control limits on the X bar and R charts demonstrate that the inspection processes are of the highest caliber. The most recent 20 subgroups also exhibit a uniform and random data dispersion nearly identical to the processing core. The applied statistical methods, such as capability charts, mean probabilities, and histograms, show that the procedure aligns with the intended result.
Additionally, according to the statistical analysis, the Cpk values for PVS have effectively reached the 1.33 acceptable cutoff limit, demonstrating the efficacy of the stated and advised techniques. The higher Cpk values show that the suggested approach is more accurate than the reported method based on the data in Figure 5a and b. The proposed procedure resulted in a Cpk value of 2.52 for PVS, while the reported process had a Cpk value of 2.47. Additionally, Table 1 presents more proof in favor of the proposed strategy because it has lower variance, standard error, and deviation values than previously reported methods. Overall, these findings imply that the suggested strategy outperforms current procedures and has the potential to significantly raise the precision and accuracy of the upcoming research [27].

Process capability sixpack for (a) proposed and (b) reported methodologies employing Minitab18.
3.7 Assessing the greenness of approaches
3.7.1 AMVI tool
The AMVI method is the most trustworthy and knowledgeable option when evaluating liquid chromatography techniques. Thanks to its ability to provide precise measurements of solvents and waste throughout the analytical process, it has become a go-to for many professionals. To develop a standardized AMVI, a particular HPLC analysis is required to ensure trustworthy results. Using a given equation makes it possible to calculate the total solvent use of the analytical technique quickly and reliably. It is essential to consider all the chemicals and solvents used during sample preparation and chromatographic analysis to determine the overall amount of solvent utilized.
One crucial factor to consider when evaluating analytical methodologies is the AMVI value. This value is calculated by dividing each technique’s total interest peaks by the solvent collected. The AMVI grade provides a professional strategy for assessing the environmental impact of a procedure. The lower the AMVI grade, the more environmentally friendly the methodology is. This is an important consideration to keep in mind when choosing an analytical method.
The AMVI method is highly effective and adaptable for calculating total solvent usage in liquid chromatography systems. It is a versatile tool in lab settings [28], particularly for liquid chromatography protocols. One of its advantages is that it employs various analytical procedures. Based on Table 6, the proposed method seems more environmentally friendly, with a lower AMVI score of 134.
AMVI assessment of the proposed technique
| Specification | Proposed technique |
|---|---|
| Solvent consumption HPLC (mL) | 94 |
| Flow rate | 1.5 |
| Run time | 6.25 |
| Number of injections for one complete analysis | 10 |
| Number of analytes | 1 |
| Solvent consumption sample rep (mL) | 40 |
| Volume (mL) for standard preparation | 10 |
| Number of standard preparations | 1 |
| Volume (mL) for test preparation | 10 |
| Number of test preparations | 2 |
| Volume (mL) for system suitability | 10 |
| System suitability numbers | 1 |
| Total method solvent consumption | 134 |
| Analytical method volume intensity | 134 |
| % Consumption HPLC | 70 |
| % Consumption preparations | 30 |
3.7.2 Analytical ESA
Upon evaluating the sustainability of our approach, we utilized the Eco-Scale tool to estimate its ecological impact. The tool factors in various aspects, including chemical usage, potential risks, energy consumption, and waste production, to determine a penalty score [29]. After deducting penalty points from a perfect score of 100, our system achieved an impressive eco-score of 73, translating to a high level of ecological sustainability. Our system’s eco-score places it in the “excellent green” category, according to the Eco-Scale, which is a noteworthy accomplishment [30]. More information about the penalty points are shown in Table 7.
Deduction of points for calculating the ESA score using the specified method
| Analytical eco-scale | Penalty points | |
|---|---|---|
| Reagents | Purified water | 0 |
| Monobasic potassium phosphate | 0 | |
| Acetonitrile | 4 | |
| Tetrahydrofuran | 6 | |
| Sodium hydroxide | 2 | |
| Hydrogen peroxide | 6 | |
| Hydrochloric acid | 4 | |
| Instruments | Energy for HPLC ≤1.5 kWh/sample | 1 |
| Occupational hazard | 0 | |
| Ultrasonic | 1 | |
| Waste | 3 | |
| Total penalty points | 27 | |
| Eco-scale total score | 73 |
3.7.3 AGREE tool
The AGREE tool is an exceptional evaluation procedure for assessing sustainability, especially environmental sustainability. It utilizes the 12 fundamental principles of GAC and assigns a score ranging from 0 to 1 to each principle based on its support for ecological sustainability. The AGREE technique has gained significant popularity in this regard. The resultant graph displays the performance levels of each standard in red, yellow, and green, with the size of each area corresponding to the metric measured, making it an incredibly remarkable tool [31]. The method used in this assessment is environmentally friendly and follows the 12 principles displayed in Figure S4a, ensuring its effectiveness. We noticed the AGREE symbol in Figure 6a, which represents the concept of ecological sustainability. This sustainability idea is well supported by the center score of 0.65. The green hues in the pictogram become more intense as the degree of sustainability achieved increases. The AGREE pictogram is a powerful tool for evaluating the method’s sustainability.

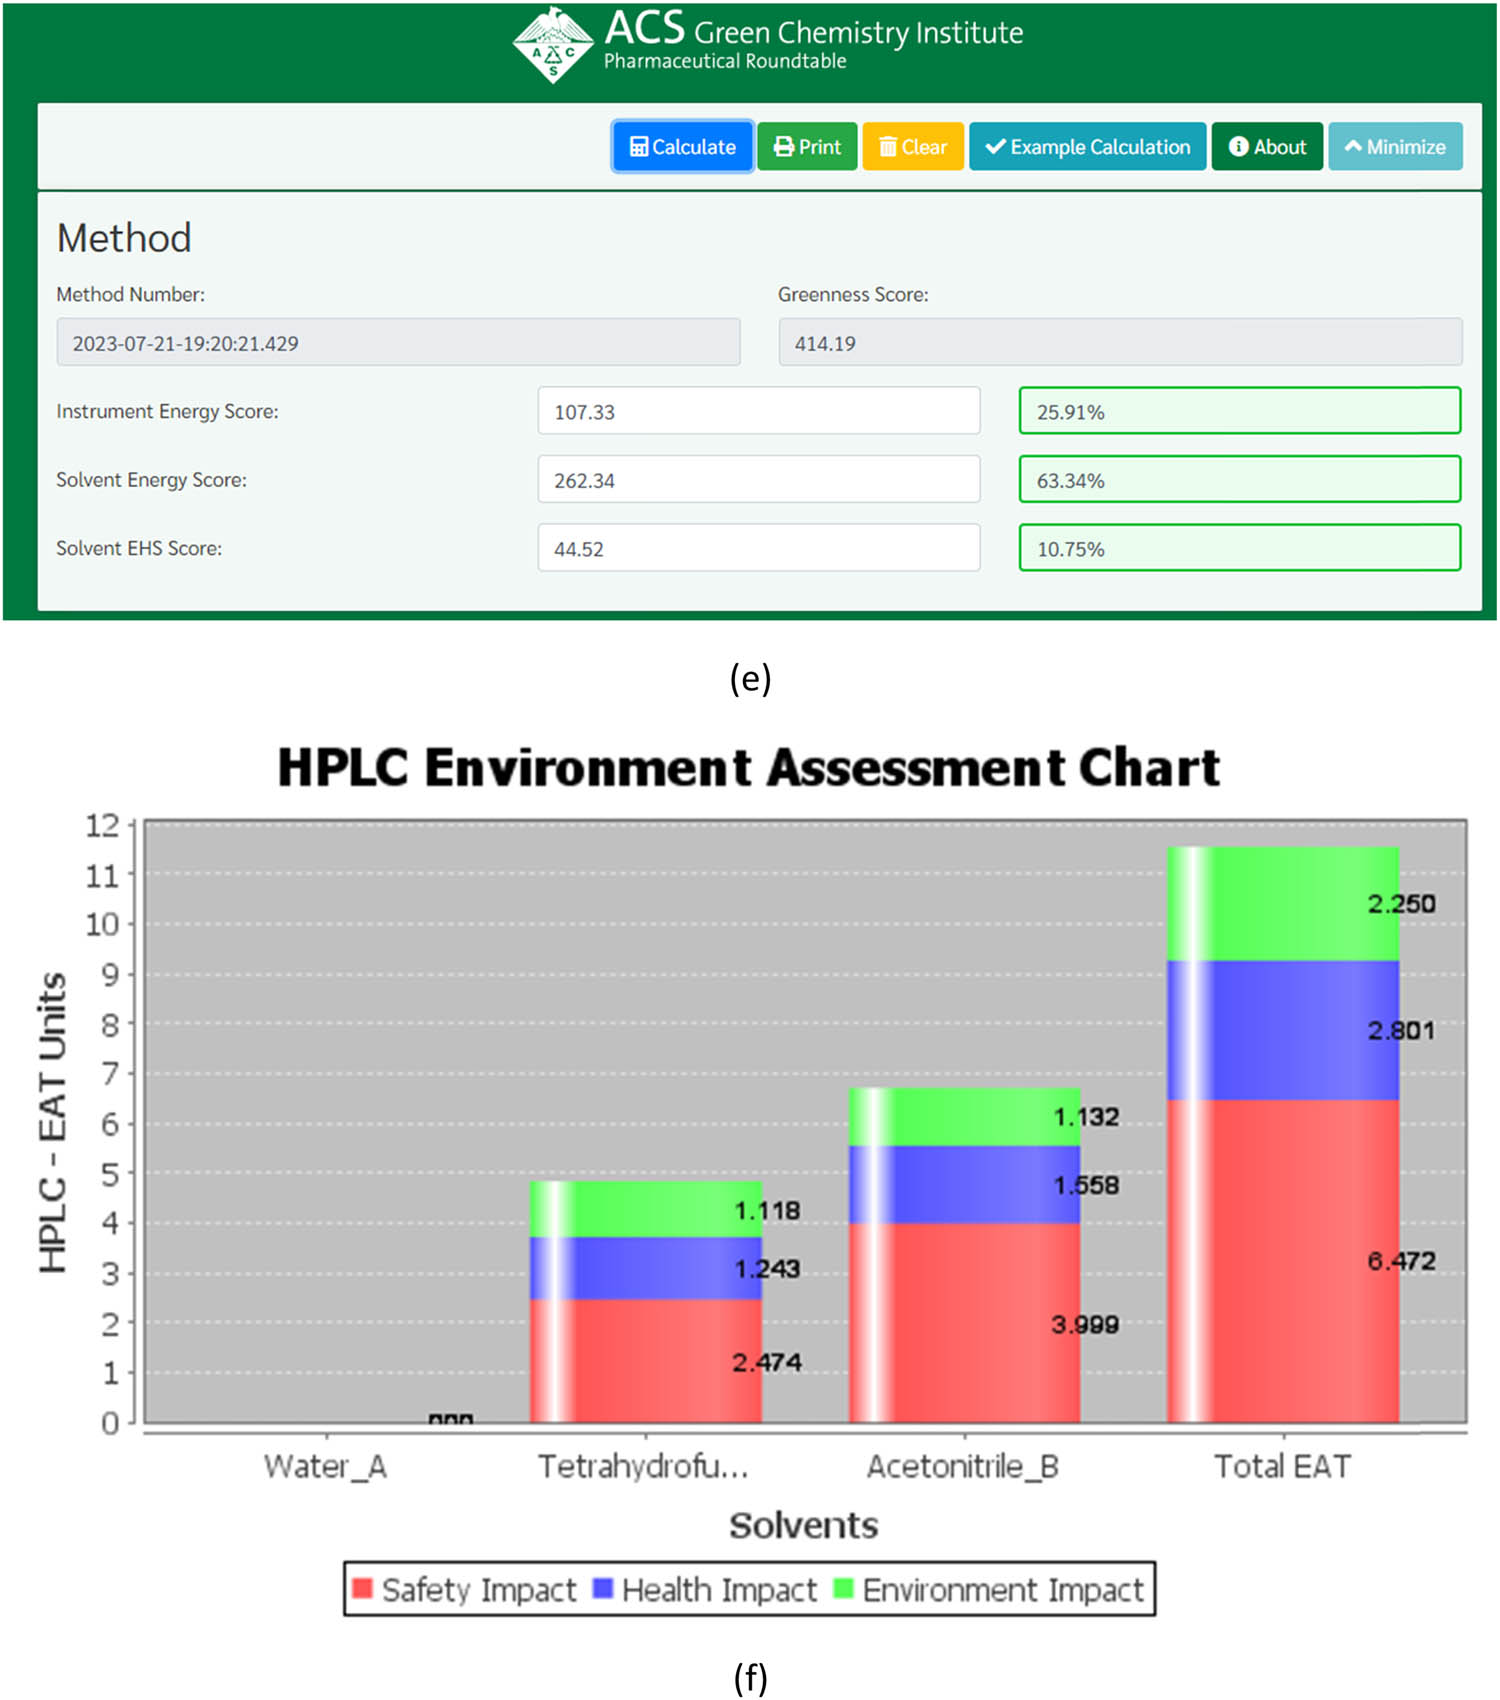
Evaluating the “greenness” of the suggested technique, using (a) AGREE, (b) AGREEprep, (c) GAPI, (d) ComplexGAPI pictograms, (e) AMGS, and (f) HPLC-EAT.
3.7.4 AGREEprep tool
When it comes to the analytical method, sample preparation is vital. At our firm, we take great care to ensure that our procedures have as little impact on the environment as possible. We greatly emphasize the AGREEprep metric, an innovative method that evaluates environmentally responsible sample preparation techniques. We can conduct sustainable and ecologically friendly sample preparation operations by adhering to the GAC’s 12 principles and the green sample preparations 10 criteria through the AGREEprep metric. We can evaluate the environmental impact of different sample preparation techniques with greater accuracy and precision. Incorporating ten critical concepts into the review process, the AGREEprep technique streamlines the sample preparation procedure. It is remarkable to see how the competency of each segment is evaluated using a score between 0 and 1, with 1 being the ideal level of performance [32]. The various graphical symbols in Figure S4b assigned to each of the ten sectors made it exceedingly simple to understand. Figure 6b demonstrates the methodology’s environmental applicability with a value of 0.64 achieved.
3.7.5 GAPI tool
One way to assess the potential environmental impact of different techniques is by using a tool for environmental sustainability. This tool evaluates the entire process, from sample collection to final analysis, and categorizes it into green, yellow, and red levels based on its ecological impact. By grouping these levels into high, moderate, and low categories, we can better understand the overall impact of the analytical method. This technology allows us to use more eco-friendly methodologies and make informed decisions about how our analytical techniques affect the environment. The GAPI methodology is a reliable and comprehensive way to assess the ecological viability of analytical techniques, providing us with the knowledge we need to evaluate our environmental impact [33]. When considering all relevant factors throughout the analytical process, as shown in Figure 6c, it becomes clear that the GAPI system outperforms traditional analytical methods. This superiority can be attributed to its 15 descriptive components, which cover everything from sample preparation to decision-making, as well as its five unique features. Additionally, the environmental benefits of this approach, as seen in Figure S5a, further support its effectiveness. All in all, the GAPI system is a potent analytical tool that provides valuable information about the systems.
3.7.6 ComplexGAPI tool
Based on Figure S5b, the ComplexGAPI metric is a sophisticated method for evaluating the sustainability impact of various components on GAC features. This metric surpasses the conventional GAPI measure by incorporating a second hexagonal layer for pre-analysis processes. It considers numerous factors, such as environmental considerations, reactants, solvents, compatibility with long-term economic models, instrumentation, post-reaction processing, and purification. The sustainability impact of each element is evaluated using a color-coded methodology, like the GAPI technique. The severity of environmental concerns is indicated by red, yellow, and green, representing severe, moderate, and mild impacts. The ComplexGAPI metric employs various strategies, as depicted in Figure 6d. This comprehensive, state-of-the-art approach makes it ideal for assessing GAC features through multiple methodologies [34].
3.7.7 AMGS tool
The AMGS method is the go-to framework for evaluating the environmental effectiveness of various processes. With a focus on ensuring the environment’s well-being and safety, this quantitative technique considers critical aspects such as energy consumption, solvent-related demands, and solvent waste generation. By breaking the tool into distinct categories of energy, solvent energy, and solvent safety components and using a numerical score system, the AMGS methodology provides a comprehensive method of comparing different processes [35]. The tool’s three colored portions, as shown in Figure 6e, clearly indicate the instrument’s energy, solvent energy, and solvent safety. Overall, the AMGS methodology offers a highly insightful way of assessing the practicality of a particular method with a greenness score of 414.19, as depicted in Figure S6a.
3.7.8 HPLC-EAT
HPLC-EAT is an excellent software application designed to review liquid chromatographic operations. This tool is handy, as it helps researchers assess the safety, environmental, and health repercussions of all solvents used in the process, making it easier to make informed decisions. After looking at Figure 6f, we were impressed by how user-friendly and simple the software is. However, it is essential to note that the tool only considers the environmental effects of solvents. Other components of GAC, such as equipment, energy, and sample preparation conditions, are not considered. The software generates a score based on the data, with a lower value of 11.523, as seen in Figure S6b. This suggests that the examined method is environmentally sustainable [36].
3.8 Method validation
The techniques we suggested were assessed using International Council for Harmonisation criteria. The data demonstrate that these strategies are dependable and valuable for analysts [37].
3.8.1 Linearity and range
The linearity of the calibration curves was tested within the 3–50 µg·mL−1 range. Figure S7 illustrates a series of dilutions that began with a standard stock solution of 100 µg·mL−1 and ended with different concentrations ranging from 3 to 50 µg·mL−1. The least-squares method was applied to determine a regression line with a coefficient of correlation (r) of 0.999. The results are shown in Table 8.
Regression and statistical parameters from the calibration curves of PVS
| Parameter | HPLC |
|---|---|
| PVS | |
| Wavelength | 226 nm |
| Range (µg·mL−1) | 3–50 |
| Slope | 5.4573 |
| Intercept | −3.5938 |
| Correlation coefficient | 0.9997 |
| Regression equation | y = 5.4573x – 3.5938 |
| LODa (µg·mL−1) | 1.1 |
| LOQa (µg·mL−1) | 3.5 |
| Repeatability | 0.22 |
aLOD (3.3 × σ/Slope) and a LOQ (10 × σ/Slope).
3.8.2 Limit of detection (LOD) and limit of quantification (LOQ)
After performing calculations using validated Excel spreadsheets and formulas (3.3 σ/S) and (10 σ/S), we have successfully determined the LOD and LOQ values. These values play a critical role in determining the standard deviation of the y-intercept and the calibration curve’s slope. Our investigation’s results, as illustrated in Table 8, reveal an inverse relationship between the sensitivity of the proposed techniques and the corresponding LOD and LOQ values.
3.8.3 Precision
Based on our experiments, we prepared six determinants and conducted rigorous intra-day and inter-day determination assessments on day 1 and day 2. This was done to assess the repeatability and intermediate precision of our approach. We calculated the relative standard deviation (RSD) % using RSD = (SD × 100)/mean value and found that the outcome was less than 2.0%, which is an excellent precision level. As seen in Table 8, the suggested procedure proved highly precise.
3.8.4 Accuracy and recovery
Three concentration levels covering the range from 50 to 150% of the nominal concentration of PVS were evaluated using the standard addition method. Each sample was prepared by adding a predetermined amount of PVS to a fixed amount containing lactose (as an excipient). The resulting samples were measured in triplicate, and then the recovery percentage was calculated, see Table S1.
3.8.5 Robustness
The methodology’s robustness was thoroughly assessed by examining its consistency when its parameters were slightly changed. To test this, standards were introduced after altering the drug settings. Table S2 lists the various modifications made, such as adjusting the wavelength by 2 nm, changing the flow rate by 0.1 mL·min−1, and altering the acetonitrile ratio by 1%. These modifications allowed for a detailed evaluation of the methodology’s robustness.
3.8.6 System suitability
Ensuring that specific crucial factors are within predetermined limits is imperative when assessing the performance of a chromatography system. Notably, the number of theoretical plates, an indicator of column efficiency, must be greater than 2,000. Moreover, the resolution between PVS and degraded peaks must be a minimum of 2.0. As per Table S3, the tailing or asymmetry factor should not exceed 2. Adhering to these factors is essential for confirming the system’s suitability for its intended purpose.
3.8.7 Assay of pharmaceutical formulation
We analyzed the Assay test solution by preparing three samples in duplicate and using the HPLC method. The results of our assay test for PVS in the NUPLAZID 17 mg tablets were successful, as shown in Table S4. The findings indicate that the drug under examination meets the required standards.
3.8.8 Specificity
3.8.8.1 Selectivity
This investigation was carried out by injecting blank samples (matrix) into the recommended HPLC system to assess whether the matrix would affect the prominent peak of PVS, as shown in Figure 7a.


Chromatograms of (a) placebo and degradation profiles of PVS after exposure to (b) 5 N HCl, (c) 5 N NaOH, (d) 30% H2O2, (e) photodegradation, and (f) thermal degradation, respectively.
3.8.8.2 Forced degradation
The study results showed that the proposed method is indeed specific to PVS, even in the presence of degradation products obtained from the applied stress conditions. The acid, base, oxidative degradation, photodegradation, and heat did not significantly affect the proposed method’s ability to identify and quantify PVS. This suggests that the proposed method is robust and reliable and can analyze PVS samples under different stress conditions. These findings in Table S5 are essential for developing methods for detecting and quantifying PVS in various applications.
3.8.8.2.1 Acid hydrolysis
Based on the experiment conducted, it was found that the PVS medication powder was exposed to 5 mL of 5 N HCl, and the samples were neutralized using a diluted 5 N NaOH solution by immersing them in a water bath set at 95°C for 5 h. The final concentration of the PVS drug in the solvent was 17 µg·mL−1. The blank was then injected with the final solution, and the degradation profile of the PVS medication in 5 N HCl was analyzed, as shown in Figure 7b.
3.8.8.2.2 Basic hydrolysis
Repeating the actions performed during the acid hydrolysis is crucial to attain accurate results. We utilized 5 mL of 5 N NaOH instead of 5 N HCl. Before injecting the final dose (17 µg·mL−1) against the blank, we neutralized both samples with 5 N HCl. To better understand the PVS deterioration profile in 5 N NaOH, refer to Figure 7c, which provides a clear illustration.
3.8.8.2.3 Oxidative degradation
We prepared 20 mg PVS tartrate, equivalent to 17 mg of PVS base, and 5 mL of 30% H2O2 in 100 mL volumetric flasks. The flask was immersed in a water bath set at 95°C for 5 h and then filled to the specified mark using the diluent. We ensured that the final concentration of each volumetric flask was 17 µg·mL−1 by dividing 1 mL of the standard stock solution among 10 mL volumetric flasks. Finally, we confidently injected the PVS final solution against the diluent, Figure 7d.
3.8.8.2.4 Photolytic and thermal degradation
After undergoing intense photolytic breakdown for 20 h, the final concentration of 17 µg·mL−1 PVS was subjected to thermal degradation using reflux in a water bath at 95°C for 6 h. The medication was injected at a final concentration of 17 µg·mL−1 compared to the control (Diluent). To better understand this process, refer to Figure 7e and f, which provides an easy-to-understand illustration.
4 Discussion
Based on the literature review, no HPLC method was reported for analyzing PVS in pharmaceutical formulations that integrate eight green metrics, Six Sigma methodology, or BBD. In our study, we utilized eight different green metrics to evaluate the eco-friendliness of the suggested method. These included AGREE, AGREEprep, GAPI, ComplexGAPI, ESA, AMVI, AMGS, and HPLC-EAT. We also employed a shorter column, which supported decreased retention time and reduced the amount of mobile phase waste produced. In addition, we realized that the Six Sigma technique is widely recognized for its ability to reduce inefficiencies, prevent errors, and boost overall efficiency. The current study shows how a high capability index (Cpk) can make it even more effective. Table 1 provides a detailed comparison between the Six Sigma methodology and a previous approach, and the results were satisfactory. The new strategy outperformed the previous one. Our cutting-edge HPLC technique is the most practical way to adhere to green chemistry principles. It surpasses previous methods in terms of reliability and accuracy, with superior qualitative and quantitative metrics. It is an adequate system for conducting chemical analysis in the most effective and environmentally friendly manner.
The proposed methodology was then compared to those found in the literature, following a meticulous evaluation of sustainability approaches. Table S6 and supplementary files 2a–h summarize the findings.
The evaluation was completed using eight green tools. According to the data analysis, the proposed approach in the AMVI tool has several advantages compared with the published methods. Using the AMVI tool, for example, sample preparation requires a volume of less than 40 mL due to solvent consumption. This method, despite its solvent consumption value of 160 [16], still fails to score highly on AMVI as it consumes more solvent when preparing samples, resulting in a lower AMVI score. Table S6 shows that the proposed method is more environmentally friendly since it has an AMVI value of 134.
The ESA scores in the ESA tool were 69 and 71, respectively, according to the research studies [15,19]. The scores of these methods are below those of the published and suggested methods, which had scores of 73. The proposed method included a forced degradation investigation as opposed to the other methods [15,17,18]. It is essential to point out that reagent penalty points were applied during forced degradation, which reduced the overall ESA score. Despite this, the tool evaluated the system and awarded it 73 points, indicating that it has a high level of ecological sustainability. Table S6 presents the penalty point results.
Several reasons have led to the study’s outperformance in the AGREE and AGREEprep tools, including the ability to generate less than 3.0 mL waste, reduce hazardous chemicals’ content, and maximize the number of samples examined per hour. As shown in Table S6, the AGREE and AGREEprep pictograms clearly illustrate this concept, with a central score of 0.65 and 0.64 and varying levels of green hues illustrating the level of environmental sustainability.
Because the proposed HPLC method does not need any pretreatment or extraction, it shows (6) green, (7) yellow, and (2) red better than the published methods [15,17,18] and makes less waste (less than 3.0 mL) than the published methods [16,19]. A critical difference between the proposed and earlier methods is that they do not require preserving samples, transportation, or special storage conditions. Based on our findings, as shown in Table S6, this approach is ecologically practical. For the same reasons as in the GAPI tool, the suggested approach outperformed those reported in ComplexGAPI, including using a slightly hazardous reagent and a straightforward process with 98% purity or more. Several aspects of the strategies are depicted in Table S6. As a result of ComplexGAPI, methodologies that incorporate GAC attributes can be evaluated in a comprehensive, all-encompassing manner.
Table S6 demonstrates that the suggested approach outperforms the reported method [16], while the other documented methods [15,17,18,19] exhibit lower HPLC-EAT values. HPLC-EAT does not include using less hazardous solvents, sample preparation, or apparatus. The data from the program in Table S6 suggest that a lower score signifies the environmental sustainability of the strategy under study.
Our analysis determined that three pivotal aspects significantly impact AMGS’s ultimate score: instrument, solvent energy, and solvent environmental health and safety. The AMGS values decrease as the sustainability of the process increases. An intriguing distinction exists between the suggested and the documented AMGS values. This approach employs less solvent using an isocratic system and an environmentally sustainable solvent (water). Table S6 demonstrates that the suggested method is more environmentally friendly than the published ones [15,16,17,18,19].
5 Conclusion
Our study used various greenness assessment tools to evaluate the chromatographic techniques. The analytical eco-scale, AMVI, HPLC-EAT, AMGS, AGREE, AGREEprep, GAPI, and ComplexGAPI were all employed to ensure the sustainability of our process. Additionally, we utilized the process capability index and Lean Six Sigma methodology to determine the effectiveness of our current process. The results indicate that our suggested strategy is both environmentally friendly and cost-effective. We adjusted the chromatographic settings using BBD and RSM with minimum experimental runs, resulting in the lowest retention time, a satisfactory tailing factor, and a high theoretical plate for the PVS medication. Using HPLC and a shorter column is a great way to promote green chemistry and reduce waste in the lab. Any lab that values sustainability and safety should consider implementing this strategy. The test has proven accurate in detecting and quantifying targeted medicines, even in degraded byproducts. Additionally, it maintains selectivity and sensitivity, as the primary peak and its degradation products do not interact at all.
Acknowledgements
The authors extend their appreciation to the Deputyship for Research and Innovation, Ministry of Education in Saudi Arabia for funding this research work through the project number 445-9-739.
-
Funding information: This research was funded by the Deputyship for Research and Innovation, Ministry of Education in Saudi Arabia through the project number 445-9-739.
-
Author contributions: Hossam Nassef: formal analysis, writing – review and editing, investigation, and conceptualization; Hoda Ahmed: data curation, supervision, visualization, and writing – review and editing (equal); Ali Bashal: validation, investigation (equal), software, and writing – review and editing (equal); Mohamed El-Atawy: writing – review and editing (equal), formal analysis (equal), data curation (equal), and conceptualization (equal); Tahani Alanazi: software (equal), formal analysis (equal), writing – review and editing (equal), and data curation (equal); Samar Mahgoub: project administration, resources, methodology, and writing – review and editing (equal); Mahmoud Mohamed: writing – original draft, software (equal), investigation (equal), and conceptualization (equal).
-
Conflict of interest: Authors state no conflict of interest.
-
Data availability statement: The datasets generated during and/or analyzed during the current study are available from the corresponding author on reasonable request.
References
[1] Hawkins T, Berman BD. Pimavanserin: A novel therapeutic option for Parkinson disease psychosis. Neurol Clin Pract. 2017;7(2):157–62. 10.1212/CPJ.0000000000000342.Search in Google Scholar PubMed PubMed Central
[2] Cruz MP. Pimavanserin (Nuplazid): A treatment for hallucinations and delusions associated with Parkinson’s disease. Pharm Ther. 2017;42(6):368–71.Search in Google Scholar
[3] Alanazi TYA, Almalki MA, Mohamed MA, Nassar HF. Five greenness assessments of novel RP-UPLC and MCR methods for concurrent determination of selected pharmaceutical drugs in comparison with the lean Six Sigma approach. Microchem J. 2023;194:109359. 10.1016/j.microc.2023.109359.Search in Google Scholar
[4] Prajapati P, Ahir H, Prajapati B, Shah S. Chemometric-based AQbD and green chemistry approaches to chromatographic analysis of remogliflozin etabonate and vildagliptin. J AOAC Int. 2022;106(1):239–49. 10.1093/jaoacint/qsac084.Search in Google Scholar PubMed
[5] Prajapati P, Rajpurohit P, Pulusu VS, Shah S. Green and sustainable analytical chemistry-driven chromatographic method development for stability study of Apixaban using Box-Behnken design and principal component analysis. J Chromatogr Sci. 2023;6:1–11. 10.1093/chromsci/bmad033.Search in Google Scholar PubMed
[6] Prajapati PB, Patel NM, Shah SA. Implementation of DMAIC principle-based analytical quality by design approach to simultaneous estimation of metronidazole and ofloxacin by HPTLC method. J Iran Chem Soc. 2022;19(7):2915–28. 10.1007/s13738-022-02503-0.Search in Google Scholar
[7] Prajapati P, Tailor P, Shahi A, Acharya A, Shah S. Application of Taguchi OA and Box-Behnken design for the implementation of DoE-based AQbD approach to HPTLC method for simultaneous estimation of azilsartan and cilnidipine. J Chromatogr Sci. 2023;61(8):725–36. 10.1093/chromsci/bmac045.Search in Google Scholar PubMed
[8] Prajapati PB, Patel UR, Shah SA. Fractional factorial and central composite design for implementation of risk and DoE-based enhanced AQbD approach to eco-friendly HPTLC method for estimation of dalfampridine in pharmaceutical dosage forms and human plasma. J Iran Chem Soc. 2022;19:2263–77. 10.1007/s13738-021-02445-z.Search in Google Scholar
[9] Kumbhar P, Waghmare P, Nadaf S, Manjappa A, Shah R, Disouza J. QbD and Six Sigma quality approach for chromatographic estimation of repurposed simvastatin from nanostructured lipid carriers. Microchem J. 2023;185:108310. 10.1016/j.microc.2022.108310.Search in Google Scholar
[10] Byrne B, McDermott O, Noonan J. Applying lean six sigma methodology to a pharmaceutical manufacturing facility: A case study. Processes. 2021;9(3):550. 10.3390/pr9030550.Search in Google Scholar
[11] El-Attar AA, Mohamed AA, Hasan MA, Abdel-Raoof AML. C-tandem mass spectrometry for quantifying three drugs simultaneously utilized for treating Chlamydia Trachomatis infection in Rabbit’s aqueous humor: Experimental central composite aided design augmented Lean Six Sigma. Microchem J. 2021;169:106571. 10.1016/j.microc.2021.106571.Search in Google Scholar
[12] Mahmoud OA, Omran AA, Binsaleh AY, Almalki MA, Mohamed MA. Chromatographic techniques for assessment of bisoprolol fumarate and perindopril arginine in solid formulations under various stress conditions and application to Six Sigma, content uniformity, and comparative dissolution approaches. J AOAC Int. 2023;106(5):1165–79. 10.1093/jaoacint/qsad077.Search in Google Scholar PubMed
[13] British Pharmacopoeia Stationary Office. Medicines, and Healthcare Products Regulatory Agency. British Pharmacopoeia Commission. British Pharmacopoeia. 2024 [online]. London: TSO.Search in Google Scholar
[14] U.S. Pharmacopoeia. United States Pharmacopoeia Convention Inc. USP43-NF38. 2023;45(4):43. 10.31003/USPNF_M99457_02_01.Search in Google Scholar
[15] Aalapati KK, Singh A, Patnaik RS. A fully validated UHPLC-MS/MS method for the estimation of Pimavanserin in human (K2EDTA) plasma and its application to a clinical pharmacokinetic study. J Chromatogr Sci. 2022;60(4):357–63. 10.1093/chromsci/bmab069.Search in Google Scholar PubMed
[16] Panda SS, Bera RKVV, Mohanty S, Panigrahi S, Sahu B. Analytical procedure development: concept to application for chemometry based ultrafast LC estimation of pimavanserin in pharmaceuticals. J Liq Chromatogr Relat Technol. 2020;43(3–4):118–30. 10.1080/10826076.2019.1680389.Search in Google Scholar
[17] Ezzeldin E, Iqbal M, Asiri YA, Ali AA, El-Nahhas T. A rapid, simple and highly sensitive UPLC-MS/MS method for quantitation of pimavanserin in plasma and tissues: Application to pharmacokinetics and brain uptake studies in mice. J Chromatogr B. 2020;1143:122015. 10.1016/j.jchromb.2020.122015.Search in Google Scholar PubMed
[18] Wang S, Wang Y, Gao S, Zhang Y, Wang H, Zhao L, et al. Development of a UPLC–MS/MS method for determination of pimavanserin tartrate in rat plasma: Application to a pharmacokinetic study. J Pharm Anal. 2017;7(6):406–10. 10.1016/j.jpha.2017.07.004.Search in Google Scholar PubMed PubMed Central
[19] Koduri GB, Bollikolla HB, Dittakavi R, Navuluri S. Quantification of pimavanserin in bulk and tablet dosage form using a stability indicating high performance liquid chromatographic method. Pharm Sci. 2018;24(4):291–7. 10.15171/PS.2018.42.Search in Google Scholar
[20] Mohamed MA. Simultaneous quantification of cephalexin and sodium benzoate in their dosage forms by high analytical technique. Application of Lean Six Sigma and in-vitro dissolution studies. Ann Pharm Fr. 2021;79(2):152–69. 10.1016/j.pharma.2020.09.006.Search in Google Scholar PubMed
[21] Al-Kadhi NS, Mohamed MA, Ahmed HA, Nassar HF. Facile synthesis and eco-friendly analytical methods for concurrent estimation of selected pharmaceutical drugs in their solutions: application to quality by design, lean six sigma, and stability studies. BMC Chem. 2023;17(1):136. 10.1186/s13065-023-01028-8.Search in Google Scholar PubMed PubMed Central
[22] Horváth P, Gergely A, Mazák K, Kökösi J, Szász G. Novel data on the effect of tetrahydrofuran as an organic co-modifier in RP-HPLC. Chromatographia. 2013;76:441–8. 10.1007/s10337-013-2421-y.Search in Google Scholar
[23] Alanazi TYA, Adel Pashameah R, Binsaleh AY, Mohamed M, Ahmed HA, Nassar HF. Condition optimization of eco-friendly RP-HPLC and MCR methods via Box–Behnken design and six sigma approach for detecting antibiotic residues. Sci Rep. 2023;13:15729. 10.1038/s41598-023-40010-1.Search in Google Scholar PubMed PubMed Central
[24] Ameeduzzafar, El-Bagory I, Alruwaili NK, Imam SS, Alomar FA, Elkomy MH, et al. Quality by design (QbD) based development and validation of bioanalytical RP-HPLC method for dapagliflozin: forced degradation and preclinical pharmacokinetic study. J Liq Chromatogr Relat Technol. 2020;43(1–2):53–65. 10.1080/10826076.2019.1667820.Search in Google Scholar
[25] Elkady EF, Fouad MA, Mozayad AN. Application of Box-Behnken experimental design and response surface methodology for selecting the optimum RP-HPLC conditions for the simultaneous determination of methocarbamol, indomethacin and betamethasone in their pharmaceutical dosage form. BMC Chem. 2022;16(1):114. 10.1186/s13065-022-00908-9.Search in Google Scholar PubMed PubMed Central
[26] Harish V, Almalki WH, Alshehri A, Alzahrani A, Gupta MM, Alzarea SI, et al. Quality by design (QbD) based method for estimation of xanthohumol in bulk and solid lipid nanoparticles and validation. Molecules. 2023;28(2):472. 10.3390/molecules28020472.Search in Google Scholar PubMed PubMed Central
[27] Ibrahim AM, Hendawy HAM, Hassan WS, Shalaby A, El-sayed HM. Six Sigma quality approach for HPLC-UV method optimization. Microchem J. 2019;144:303–8. 10.1016/j.microc.2018.09.023.Search in Google Scholar
[28] Hartman R, Helmy R, Al-Sayah M, Welch CJ. Analytical method volume intensity (AMVI): A green chemistry metric for HPLC methodology in the pharmaceutical industry. Green Chem. 2011;13(4):934–9. 10.1039/C0GC00524J.Search in Google Scholar
[29] Kannaiah KP, Sugumaran A, Chanduluru HK, Rathinam S. Environmental impact of greenness assessment tools in liquid chromatography–A review. Microchem J. 2021;170:106685. 10.1016/j.microc.2021.106685.Search in Google Scholar
[30] Gałuszka A, Migaszewski ZM, Konieczka P, Namieśnik J. Analytical Eco-Scale for assessing the greenness of analytical procedures. TrAC Trends Anal Chem. 2012;37:61–72. 10.1016/j.trac.2012.03.013.Search in Google Scholar
[31] Kowtharapu LP, Katari NK, Sandoval CA, Rekulapally VK, Jonnalagadda SB. Green chromatographic method for determination of active pharmaceutical ingredient, preservative, and antioxidant in an injectable formulation: Robustness by design expert. ACS Omega. 2022;7(38):34098–108. 10.1021/acsomega.2c03387.Search in Google Scholar PubMed PubMed Central
[32] Wojnowski W, Tobiszewski M, Pena-Pereira F, Psillakis E. AGREEprep–Analytical greenness metric for sample preparation. TrAC Trends Anal Chem. 2022;149:116553. 10.1016/j.trac.2022.116553.Search in Google Scholar
[33] Płotka‐Wasylka J. A new tool for the evaluation of the analytical procedure: Green Analytical Procedure Index. Talanta. 2018;181:204–9. 10.1016/j.talanta.2018.01.013.Search in Google Scholar PubMed
[34] Płotka‐Wasylka J, Wojnowski W. Complementary green analytical procedure index (ComplexGAPI) and software. Green Chem. 2021;23(21):8657–65. 10.1039/D1GC02318G.Search in Google Scholar
[35] Gundecha S, Patel M, Mayur YC. An application of quality by design and analytical greenness assessment approach for the development of erlotinib stability indicating method. Chromatographia. 2022;85:575–88. 10.1007/s10337-022-04167-7.Search in Google Scholar
[36] Gaber Y, Törnvall U, Kumar MA, Amin MA, Hatti-Kaul R. HPLC-EAT (Environmental Assessment Tool): a tool for profiling safety, health and environmental impacts of liquid chromatography methods. Green Chem. 2011;13(8):2021–5. 10.1039/C0GC00667J.Search in Google Scholar
[37] ICH Harmonized Tripartite Guideline. Validation of analytical procedures: text and methodology Q2 (R1). International conference on harmonization of technical requirements for registration of pharmaceuticals for human use. current step. Vol. 4. 2005. p. 1–17.Search in Google Scholar
© 2024 the author(s), published by De Gruyter
This work is licensed under the Creative Commons Attribution 4.0 International License.
Articles in the same Issue
- Research Articles
- Microfabricated potentiometric sensor based on a carbon nanotube transducer layer for selective Bosentan determination
- A novel Six Sigma approach and eco-friendly RP-HPLC technique for determination of pimavanserin and its degraded products: Application of Box–Behnken design
- Enantiomeric separation of four pairs of alkaloids by using a C18 column tandem polysaccharide-based chiral column
- Sustainable HPLC technique for measurement of antidiabetic drugs: Appraisal of green and white metrics, content uniformity, and in vitro dissolution
- Quantitative analysis of mixed lipid nanostructures in rat skin by HPLC-MS
- Review Articles
- Recent advance in electrochemical immunosensors for lung cancer biomarkers sensing
- Latest trends in honey contaminant analysis, challenges, and opportunities for green chemistry development
- Quantitative methods in the analysis of clozapine in human matrices – A scoping review
- Review of potentiometric determination of cationic surfactants
- Surface-enhanced Raman spectroscopy in forensic analysis
- Special Issue: Greener Analytical Methods - Part II
- Greenness of dispersive microextraction using molecularly imprinted polymers
- KPI-based standards benchmarking for the preference of different analytical approaches developed for simultaneous determination of ciprofloxacin and hydrocortisone: A SWOT case study