
Preparation of silver nanosheet-assembled film as a surface-enhanced Raman scattering substrate
-
Yuhai Wang
 ,
Yongling Zhang
,
Yongling Zhang

Abstract
In this work, we demonstrate a simple method for the fabrication of silver (Ag) nanosheet-assembled film on aluminum (Al) foil based on the galvanic displacement reaction between Al and Ag+. In order to obtain Ag nanosheets with large area and high aggregation density, both F− and H+ ions were introduced into the reaction system to etch the barrier layer Al2O3 on Al foils and promote the increase of the number of Ag nuclei. Therefore, Ag nuclei grew into nanosheets with citrate ions as the shape control agent. By varying the reaction parameters, Ag nanosheet film was optimized for surface-enhanced Raman scattering (SERS) measurements. The Ag nanosheet film prepared by the presented method exhibit the advantages of controllable morphology, good SERS activity, and distribution in large area, which could be utilized as a promising SERS-active candidate substrate for analytical applications.
1 Introduction
Surface-enhanced Raman scattering (SERS) spectroscopy is a highly sensitive and useful analytical technique, which has been considered to have great potential in various research fields, such as materials chemistry, analytical chemistry, and biology [1,2,3,4,5,6,7]. Many studies have shown that when SERS substrates have outstanding enhancement performance, they can be used to detect analytes at very low concentrations [8,9]. It is well known that the neighboring nanoparticles are so close that they form gaps with an ultrahigh electromagnetic field, which are called “hot spots” that provide a possibility for detecting trace molecules even single molecule [10,11]. For highly sensitive SERS detection, various kinds of SERS substrates have been fabricated successively, such as metal electrodes [12,13,14], island films [15,16], nanoparticles [17,18], and ordered nanostructures [19,20,21].
Compared with physical methods, chemical methods have obvious advantages for the fabrication of SERS-active substrates, such as noble materials, low-cost, and simple processes. The galvanic displacement reaction is an attractive chemical method that can fabricate nanostructure on solid supports. It is a typical electroless deposition that takes place in solution. The electrical potential difference between the cathode and anode is the driving force for the reaction. For example, the Ag+/Ag pair has higher redox potential (0.80 V vs standard hydrogen electrode (SHE)) than Cu2+/Cu, Al3+/Al and Zn2+/Zn pairs (0.34, −1.67, and −0.762 V vs SHE, respectively) [22,23,24,25]. Ag nanodendrites can be prepared by the galvanic displacement reaction of elemental Cu, Al, and Zn with Ag+ in plating solution [26,27,28,29,30]. High electromagnetic fields are generated at overlapped branches and tips of the branches, so the dendrites have good SERS activity [22,28,29,31]. However, the reaction rate is usually fast, and the generated Ag dendrites fall off easily because of weak adhesion between the dendrites and the substrates, which is a great inconvenience for SERS experiments. Nanosheets assembled on some substrates such as Cu and Si are also common structures [32,33,34]. For metal Al, when it reacts with Ag+ in solution, reaction Eq. 1 usually occurs but not react in Eq. 2. A thin oxide layer Al2O3 is formed on the surface of Al foil, which stops further galvanic displacement reaction. To overcome the obstacle, F− is has been introduced into the reaction system. According to the reaction in Eq. 3, the Al2O3 layer is etched and forms soluble
Anodic:
Alumina dissolution:
Cathodic:
In this work, we report a facile method for fabricating Ag nanosheets by the galvanic displacement reaction of commercial Al foil with AgNO3. For this aim, NaF was introduced into the reaction for etching Al2O3. To promote the formation of Ag+ nanosheets, trisodium citrate was employed as a shape-controlling agent in the reaction. But trisodium citrate is a salt of a weak acid, and it can reduce H+ in solution. This is not conducive to the dissolution of Al2O3 on Al foils. Therefore, HNO3 was added to compensate for the lack of H+ in the solution. All Ag nanostructures prepared in this experiment have very good resistance to washing. Even if the reaction time lasted up to 2 h, the Ag nanostructures did not peel off from the surface of Al foils. More importantly, by altering the experimental conditions, the morphology of the nanostructures was adjustable, and they presented tunable and good enhancement ability for SERS applications.
2 Materials and methods
2.1 Materials
High purity Al foil (thickness = 0.5 mm, purity = 99.999%) was obtained from the Beijing Trillion Metals Co., Ltd (Beijing, China). 4-Mercaptopyridine (4-MPy, 96%) was obtained from Sigma-Aldrich. Ethanol, silver nitrate (AgNO3, ≥99.8%), trisodium citrate (Na3C6H5O·2H2O, TSC, ≥99.5%), HNO3 (65%), and NaF ( ≥99.0%) were purchased from the Sinopharm Chemical Reagent Co., Ltd., (Shanghai, China). Ultrapure water with a resistivity greater than 18 MΩ·cm−1 was used throughout the present study. All the reagents were used as received without further purification.
2.2 Preparation of substrates
First, Al foil (1 cm × 1 cm) was polished with sandpaper (500 meshes) and sonicated with water for 3 min. Next, Al foil was washed with water and dried by N2 flow. The fabrication process of Ag nanosheets is shown in Scheme 1. (1) Al foil was put into a vessel. (2) 0.8 mL mixed solution contained 30 mM NaF and 15 mM HNO3 (NaF/HNO3) were put into the vessel. The clean Al foil was immersed in NaF/HNO3 etching solution for 1 min. (3) After that, 1.7 mL mixed solution containing 30 mM AgNO3 and 3 mM TSC were added into the vessel, and the timing was started. After the expected reaction time, Al foil was removed from the reaction mixture, rinsed with water, and dried with N2. The above experiment was conducted in a fume hood. The surface of the Al foil was covered by Ag nanosheets.

Schematic illustration of preparation process of Ag nanosheets assembled on Al foil.
The Al foils covered with Ag nanosheets were used as SERS-active substrates. The substrates were immersed in 4-MPy ethanol solution (10−6 M) for 2 h and washed with ethanol and dried by N2 flow for further use.
2.3 Characterization
The morphologies were characterized using scanning electron microscopy (SEM, JEOL FESEM 6700F) with an accelerating voltage of 3 kV. The structures were characterized using transmission electron microscopy (TEM, Hitachi H-800) at an accelerating voltage of 200 kV. X-ray diffraction (XRD) experiments were conducted using a Rigaku D/max 2500/PC diffractometer with Cu-Kα radiation (λ = 1.5418 A). The SERS spectra were recorded with a Renishaw 1000 model Raman spectrometer. The radiation from an air-cooled argon-ion laser (532 nm) was used as an excitation source. The spot of the laser was a circle with a diameter of 1 μm.
3 Results and discussion
3.1 Influence of the reaction time on the morphology
The phase structure of Al foils was characterized before and after the reaction by XRD. Curve a in Figure 1 shows the typical diffraction peaks of the Al according to JCPDS No. 65-2869. After Al reacted with Ag+, the XRD patterns of the products were exhibited in curve b in Figure 1. With the increase of reaction time, the peaks from Ag indicate that the Ag is deposited on Al foils. These peaks of Ag with face-centered cubic structure come from the index (111), (200), (220), and (311) (JCPDS No. 04-0783) from left to right.

XRD Patterns of the products obtained at (a) 0 s and (b) 60 min.
Figure A1 (in Appendix) shows the rough surface of Al foil before and after treatment with NaF and HNO3. Time-dependent experiments were conducted to understand the formation process of Ag nanosheets. The SEM images in Figure 2 and their corresponding magnified images (Figure A2) present the morphologies of Ag nanosheets that assembled on Al foils at different reaction times. When Al foil reacted with Ag+ for 5 s, some Ag islands appeared on the surface of Al foil, as shown in Figure 2a. With further observation, it was found that the islands were composed of small nanoparticles and ridge-like protuberances (Figure A2a). These ridge-like protuberances were actually rudimentary nanosheets. Previous experiments had revealed the shape-controlling role of citrate ions on nanosheets [32,35]. In the initial stage of the reaction, small Ag nanoparticles were formed, which acted as nuclei for mediating the growth of nanosheets. At the same time, citrate ions were adsorbed on the {111} facets of the Ag nanoparticle and restricted the growth of this plane. With the prolonging of reaction time, Ag nuclei were formed into nanosheets [32,35,36]. As shown in Figure 2b and Figure A2b, the nanosheets had taken shape after the reaction time of 30 s. The figures demonstrated that the surfaces of the nanosheets were very rough, and small nanoparticles could be seen on them. Obviously, with the reaction going on, as the nanosheets continued to grow, these small nanoparticles would develop into the nanosheets under the influence of citrate ions. It could be verified in Figure 2c and Figure A2c. On large nanosheets, there are small nanosheets besides small nanoparticles. With the longer reaction time, the nanoparticles were constantly generated and developed into nanosheets. As a result, the nanosheets were bigger and increasing in number at the same time. So, the nanosheets were connected in a parallel and intersection manner when the reaction time was long enough (Figure 2d–i and Figure A2d–i). There were sub-10 nm gaps formed between the adjacent nanosheets assembled in parallel as the black arrows marked in Figure A2d–i. When the reaction time was 1 h, the nanosheets were mainly assembled in parallel and filled almost all the voids. This would directly lead to the remarkable increase of sub-10 nm gaps. And, when the reaction time exceeded 1 h, the gaps were reduced dramatically, especially for 2.0 h (Figure 2h and i and Figure A2h and i). This was mainly due to the increase of nanosheets, which led to their fusion. Its EDS spectrum is presented in Figure 2j.
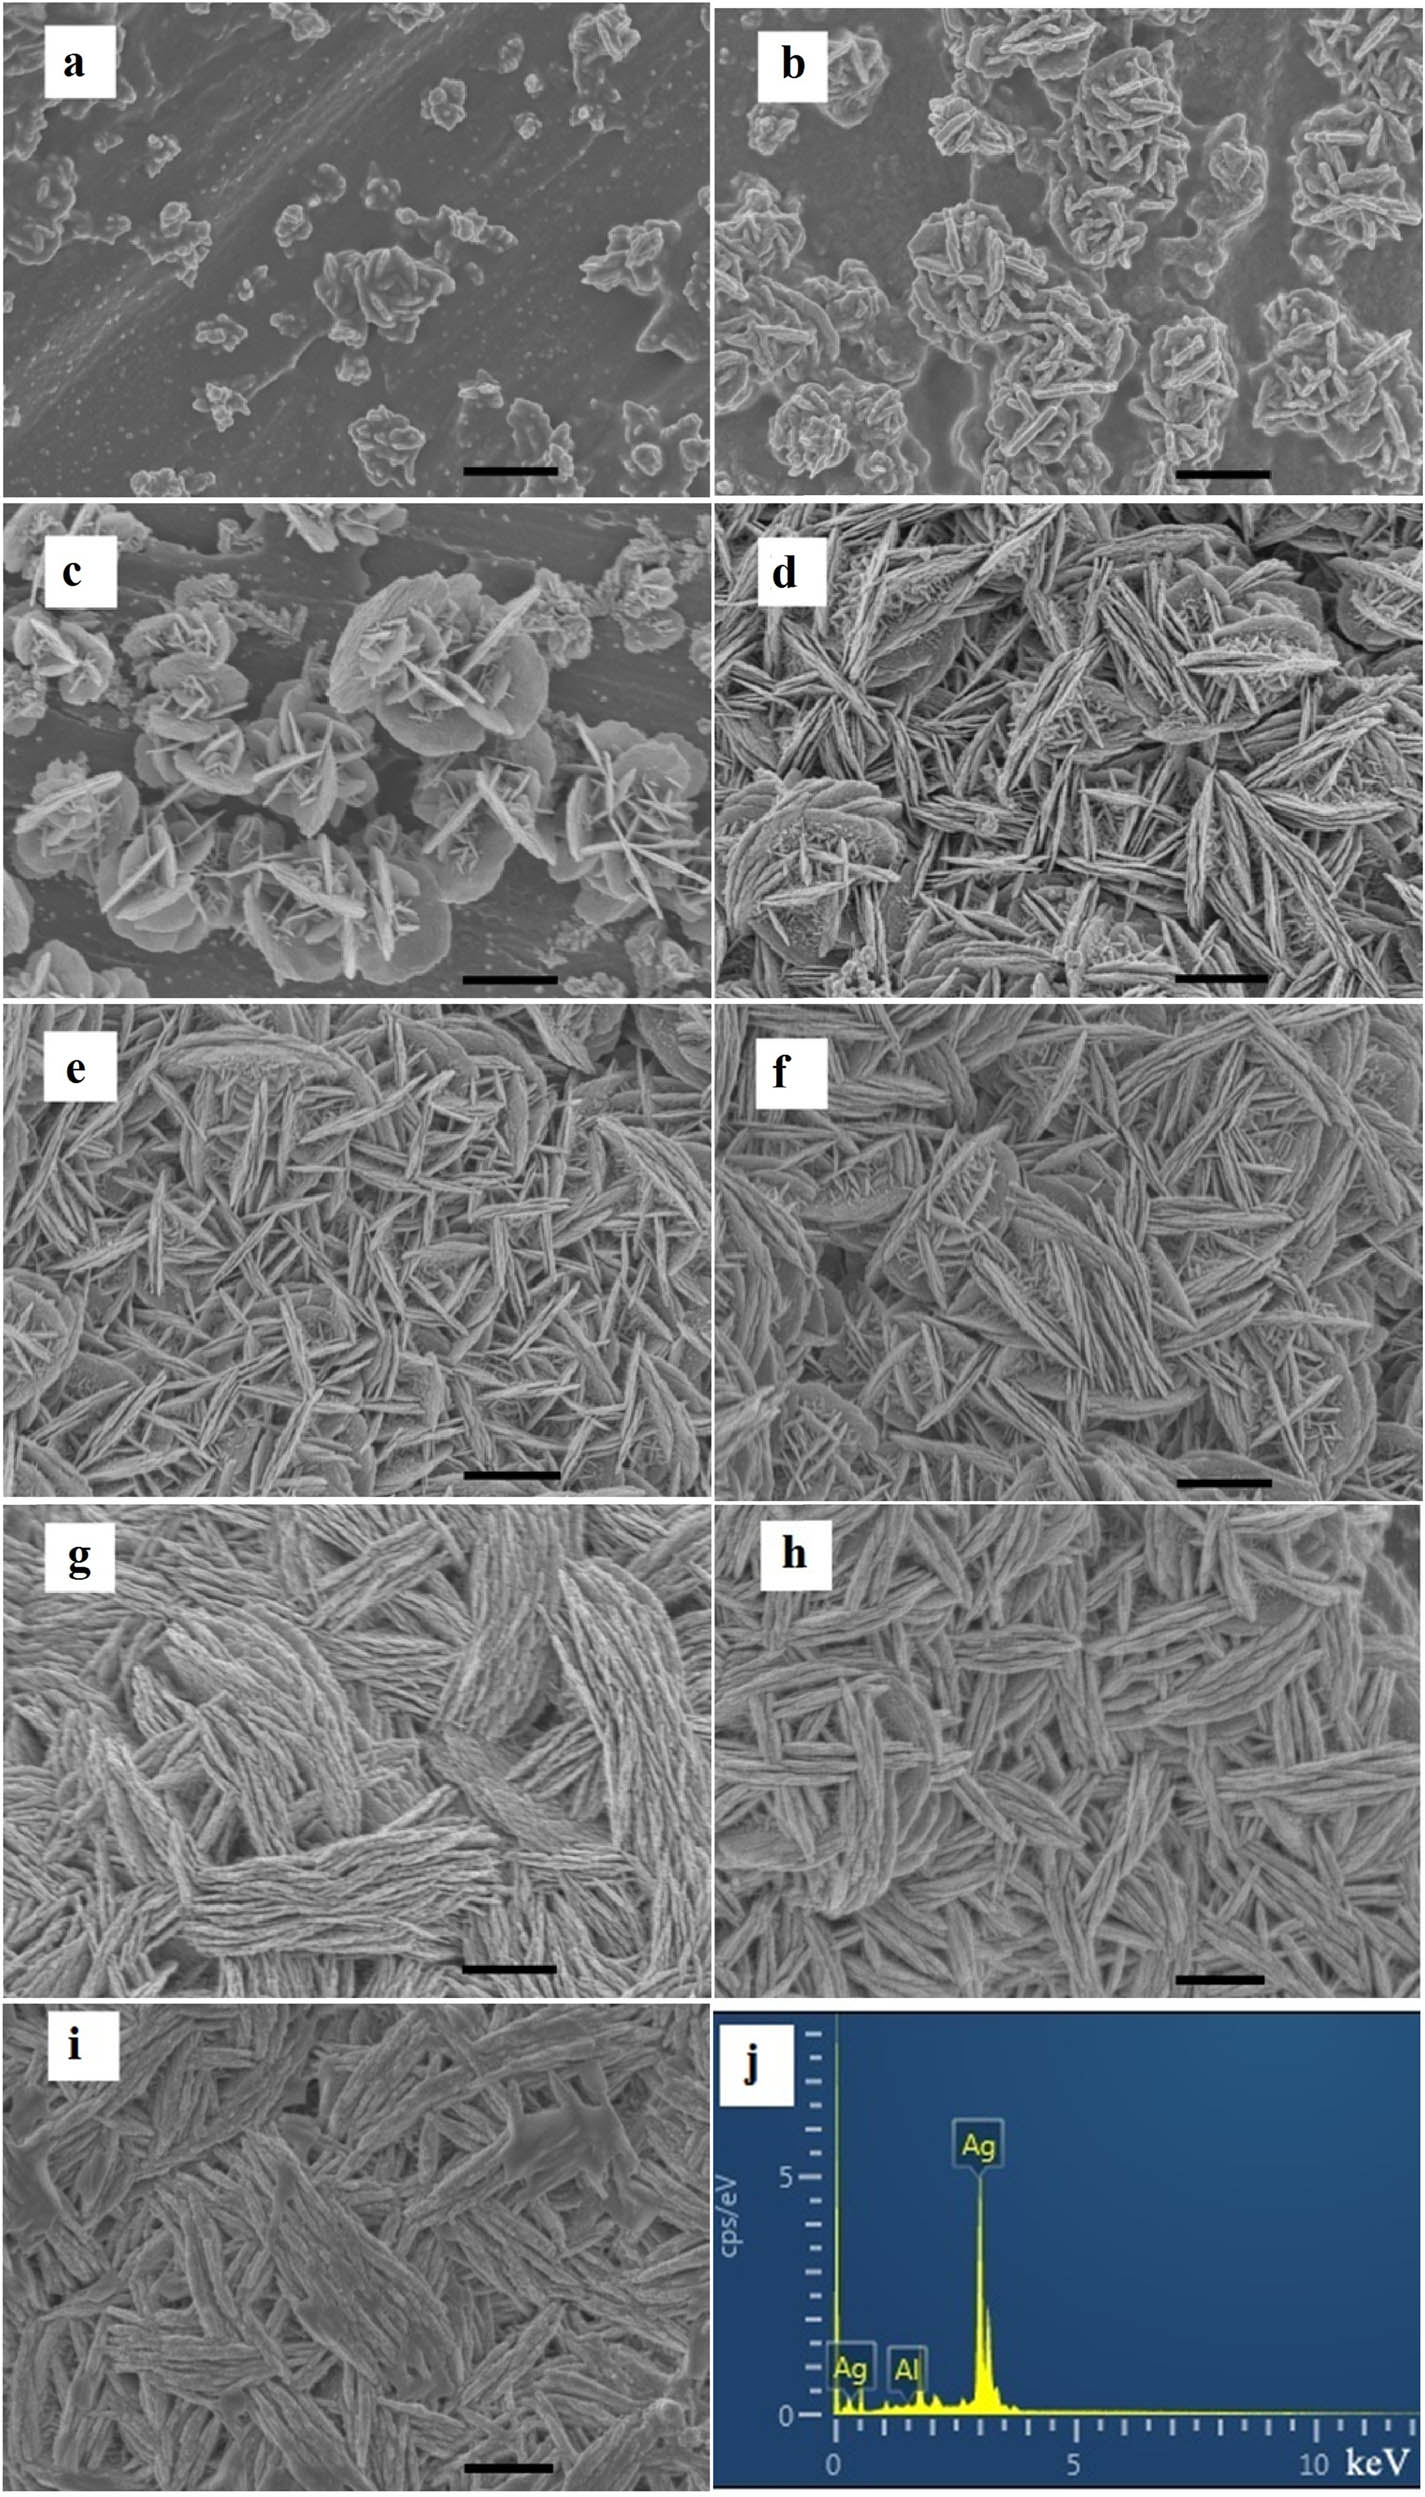
SEM Images of the products obtained at different reaction time: (a) 5 s, (b) 30 s, (c) 60 s, (d) 5 min, (e) 15 min, (f) 30 min, (g) 60 min, (h) 1.5 h, (i) 2.0 h, and (j) EDS spectrum of Ag shown in Figure 2g. The scale bar is 1 μm.
In addition, a supplementary experiment was performed in this work (Figure A3). When there is no TSC in the reaction solution, the Ag nanostructures on Al foil were composed of dendrites. This dramatic difference in the morphology from Figure 2a–i strongly suggested that citrate ions played a decisive role in the growth process of Ag nanosheets. The scraped Ag nanosheets were ultrasonicated in ethanol, dripped onto a copper grid, and characterized by TEM. Sheet-like samples were presented in Figure A4.
3.2 Influence of AgNO3 concentration on the morphology
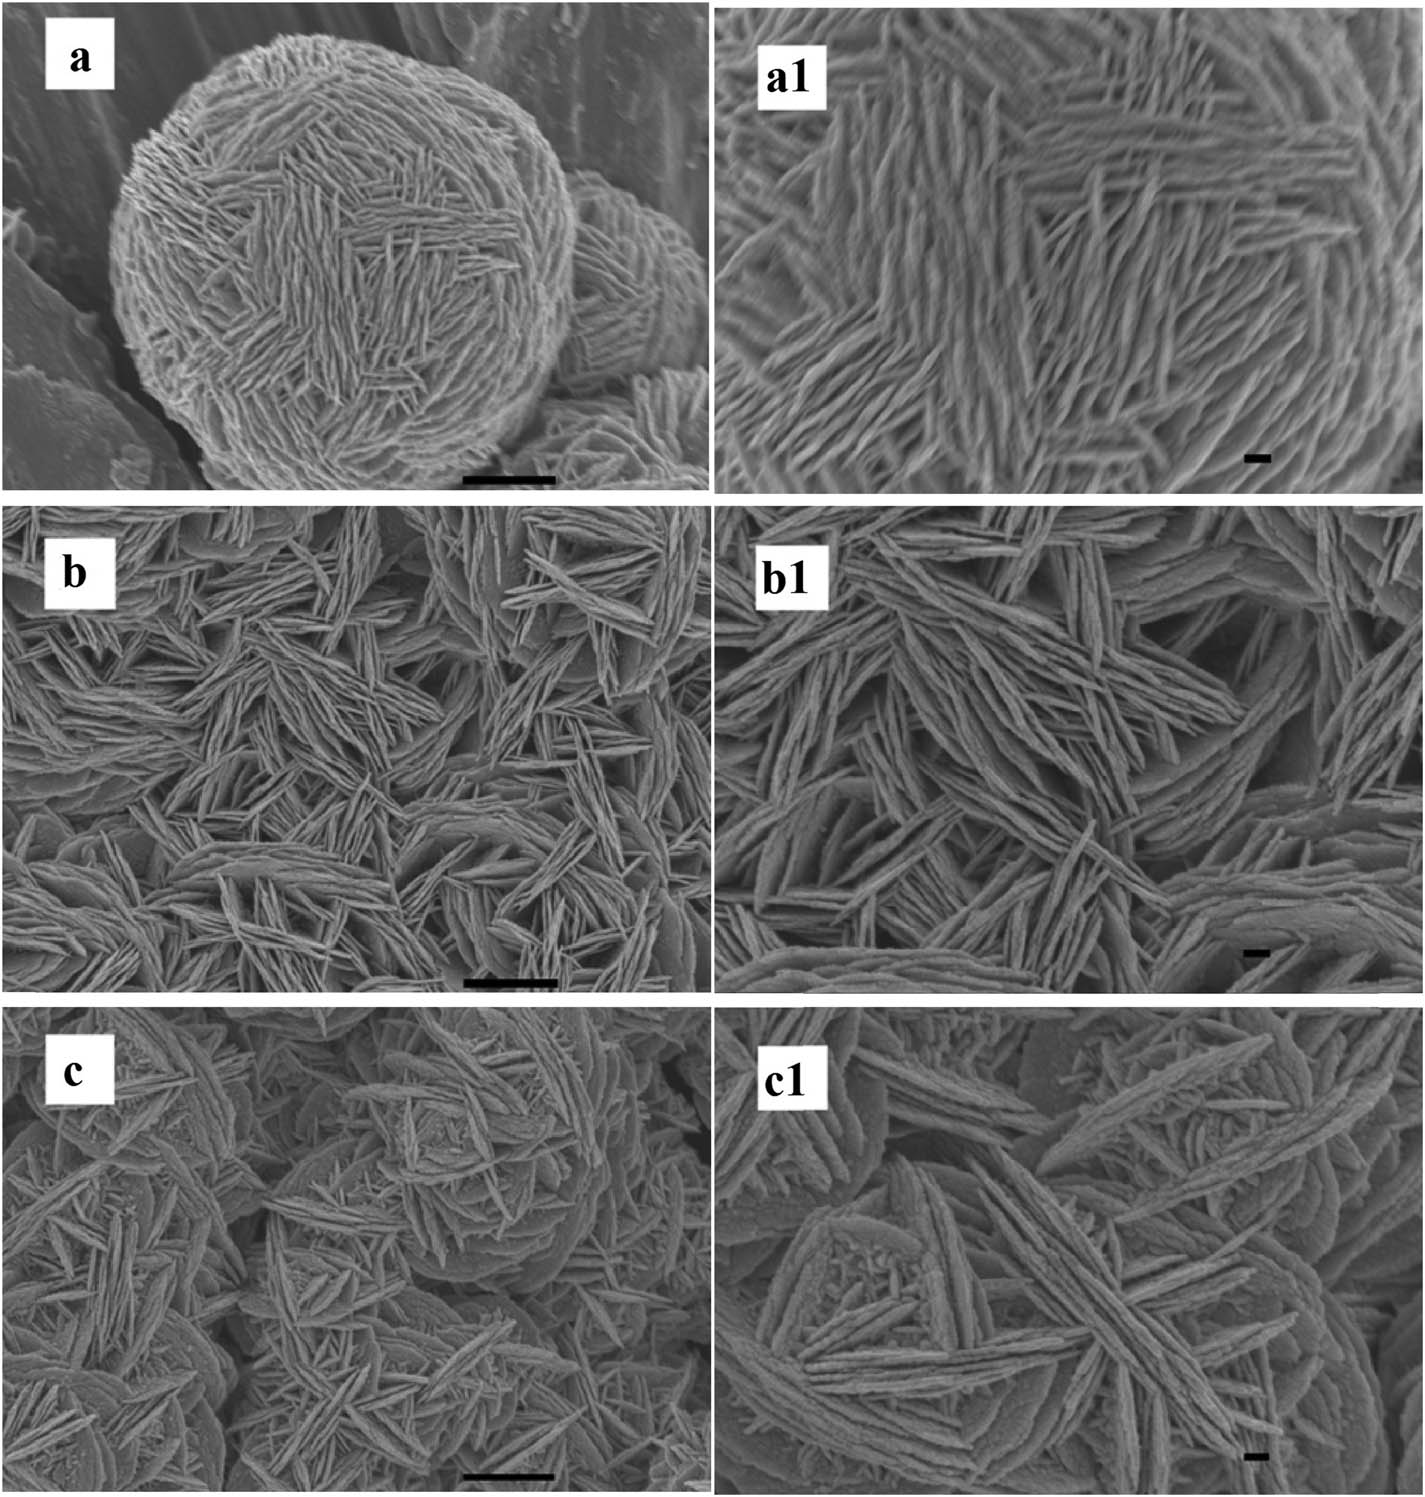
In this work, the influence of the AgNO3 concentration on the morphology of the products was investigated. The concentration of AgNO3 was respectively 10, 20, and 40 mM while keeping the other conditions unchanged. It was found that the morphology of the Ag products strongly depended on the concentrations of AgNO3 in the solution (Figure 3). At the low concentration of AgNO3 such as 10 mM, even though the reaction time was as long as 30 min, the nanosheets were not enough to effectively cover Al foil (Figures 3a and a1). In contrast, at 20 and 40 mM concentration of AgNO3 in the solution, the nanosheets were densely assembled (Figure 3b and c and b1 and c1). Even the voids surrounded by the bigger nanosheets are almost filled by smaller nanosheets and nanoparticles. We suggest that the reason for this is the effect of AgNO3 concentration on the number of Ag nuclei at the primary and their subsequent growth stage [32,35]. Therefore, with the increase of AgNO3 concentration, the density of nanosheets, especially nanosheets assembled in parallel, was significantly increased.

SEM Images of the products obtained at different concentrations of AgNO3: (a) 10, (b) 20, and (c) 40 mM, the reaction time was 30 min (scale bar, 1 μm), and (a1–c1) their corresponding magnified images (scale bar, 200 nm).
3.3 Influence of the NaF/HNO3 concentration on the morphology
The influence of NaF/HNO3 on the morphology of the products was investigated through varying NaF/HNO3 concentration while keeping the other conditions unchanged. The experimental results are shown in Figure 4. When NaF and HNO3 in the solution were 0 mM, a few scattered Ag nanoflowers composed with the nanosheets were formed (Figure 4a). In the absence of NaF and HNO3, Al is easily oxidized to Al2O3 in solution according to the reaction in Eq. 1 as previously mentioned [22,26]. Al2O3 could hamper sufficient contact of Ag+ and Al, so the amount of Ag nuclei was very small at the primary stage, and the coverage density of the resulting nanosheets was very low. When the concentration of NaF/HNO3 was increased to 20/10 and 40/20 mM, a large number of nanosheets were covered on the Al foils (Figure 4b and c). Besides, it was found that lots of the nanoparticles and the tiny nanosheets are on the side of the bigger nanosheets (Figures 4c and c1). The reason could be ascribed to the fact that HNO3 at high concentration resulted in the etching and roughening of the surface of Ag nanosheets. So, the nanoparticles and the tiny nanosheets were constantly formed on the side of the nanosheets. The obtained experiment proves that the difference in the density of nanosheets reflected the important role of NaF and HNO3 in the reaction.
SEM Images of the products obtained at different concentrations of NaF/HNO3: (a) 0, (b) 20/10, (c) 40/20 mM, the reaction time was 30 min (scale bar, 1 μm), and (a1–c1) their corresponding magnified images (scale bar, 200 nm).
3.4 SERS properties
Figure 5 shows SERS spectra of 4-MPy adsorbed on the substrates presented in Figure 2. The assignment of the peaks can be seen in the previous work [37]. As seen in Figure 5, the SERS intensity of 4-MPy first increased and then decreased with the reaction time (curves a–i). For clearer insight into the change of SERS intensity, the dependence of peak intensity at 1,010 cm−1 with the reaction time was exhibited in Figure 6a. In the initial stage of the reaction, the nanosheets were only increased in number and arranged randomly on the Al foils. The nanosheets can generate strong electromagnetic fields at their edges and tips, and then enhance Raman signals [38,39,40]. Thus, the SERS signal intensity of the nanosheets fabricated within 0–1 min mostly depended on the number of the nanosheets. However, after 5 min, the new nanosheets were mainly assembled in parallel and increased with the reaction time. The parallel nanosheets provide sub-10 nm gaps as hot spots. The local electromagnetic field can reach huge values at the hot spots. And the presence of the hot spots can make a great contribution to SERS [32,34,35,36,41,42]. So, when the abscissa was 5 min, the intensity value showed a great jump, and there was an inflection point on the curve. When the reaction time reached 60 min, a new inflection point appeared. After that, the SERS intensity was sharply reduced. This was because the sub-10 gaps on the substrates were sharply reduced. During the reaction period of 5–60 min, the SERS intensity had shown a linear correlation with the reaction time. The linear correlation is shown in Figure 6b and Eq. 5:
where y is the peak intensity of the SERS spectra of 4-MPy at 1,010 cm−1, and x is the time of galvanic replacement reaction. Enhancement factor (EF) of Ag nanosheets in Figure 2g was used to evaluate SERS enhancement ability. The calculative process for EF was presented in ESI. EF of the substrate was 3 × 10⁵.

SERS Spectra of 4-MPy (10−6 M) adsorbed on the substrates with different morphologies shown in Figure 2a–i, respectively.

(a) The relationship of SERS intensity of 4-MPy at 1,010 cm−1 and reaction time. (b) The linear relationship of SERS intensity of 4-MPy at 1,010 cm−1 and reaction time.
4 Conclusions
In summary, Ag nanosheets with controlled morphology were prepared by the galvanic displacement reaction. Ag nanosheets were developed from Ag nuclei, and different reaction conditions influenced the number of Ag nuclei in the initial and subsequent growth stages. It can be found that the appropriate reaction conditions such as reaction time, reactant concentration became the key to control the density of silver nanosheets. TSC was employed as the shape controlling agent to ensure that Ag nuclei grew into the nanosheets. The high-density parallel nanosheets were ideal SERS substrates because they provided more sub-10 gaps as hot spots. This current study proves that the commercially available Ag, the simple synthetic way, and good enhancement ability will be helpful for expanding the prospects of large-scale synthetic Ag nanosheets SERS-based highly sensitive analysis.
-
Funding information: This research was supported by the Natural Science Foundation Project of Jilin Province (grant number YDZJ202201ZYTS425).
-
Author contributions: Yuhai Wang performed research, analyzed data, and wrote the paper; Chunxu Wang designed research and analyzed data; Yongling Zhang analyzed data and revised the manuscript; Jia Wang provided instrumentation, reagents, materials; Li Wang revised the manuscript.
-
Conflict of interest: The authors state no conflict of interest.
Appendix
The calculative process for EF [37]:
where N Vol = c RS V is the average number of molecules in the scattering volume (V) for the Raman (non-SERS) measurement and N Surf is the average number of adsorbed molecules in the scattering volume for the SERS experiments. Herein, 50 μL of 4-MPy in ethanol (10−6 M) disperse on Al foil (1 cm × 1 cm). An assumption is made that 4-MPy is absorbed on the substrate as a homogeneous monolayer, and then, the average area occupied by each 4-MPy is estimated to be 3.3 nm2. The result is enormously larger than the reported unimolecular area of 0.18 nm2 of 4-MPy absorbed on Ag. So, 4-MPy is absorbed on substrates as a sub-monolayer. The spot of the laser is a circle with a diameter of 1 μm. N Surf can be calculated to be 2.36 × 10⁷. The reference used in non-SERS measurement is 0.3 M 4-MPy in ethanol. For the optical configuration and microscope employed here, the effective focused depth is 21 μm, so N Vol = c RS V is about 3 × 10⁹. Figure A4 shows the Raman and SERS spectra of 4-MPy in solution and on substrates presented in Figure 2h, respectively. For the vibration mode at 1,010 cm−1, I SERS/I RS is 2,403 and EF of the substrate is 3 × 10⁵.

SEM images of Al foils (a) before and (b) after treatment with NaF and HNO3 (scale bar, 200 nm).

SEM images of the products obtained at different reaction time: (a) 5 s, (b) 30 s, (c) 60 s, (d) 5 min, (e) 15 min, (f) 30 min, (g) 60 min, (h) 1.5 h, and (i) 2 h (scale bar, 200 nm).
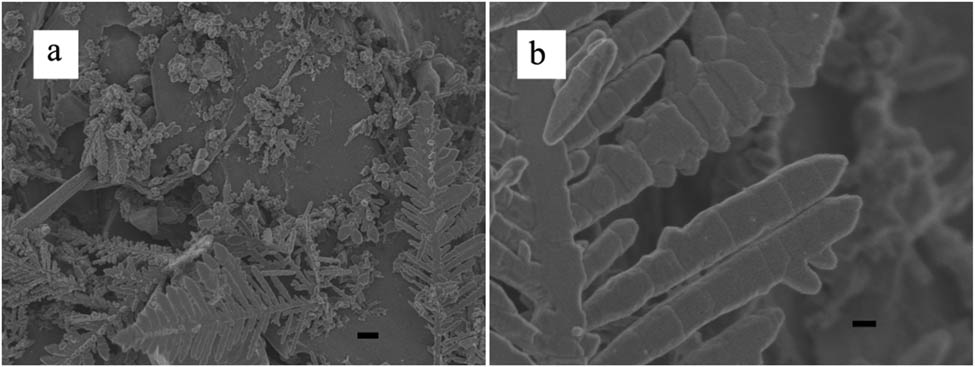
(a) SEM images of the products obtained at TSC 0 mM (scale bar, 1 μm) and (b) its corresponding magnified images (scale bar, 200 nm).
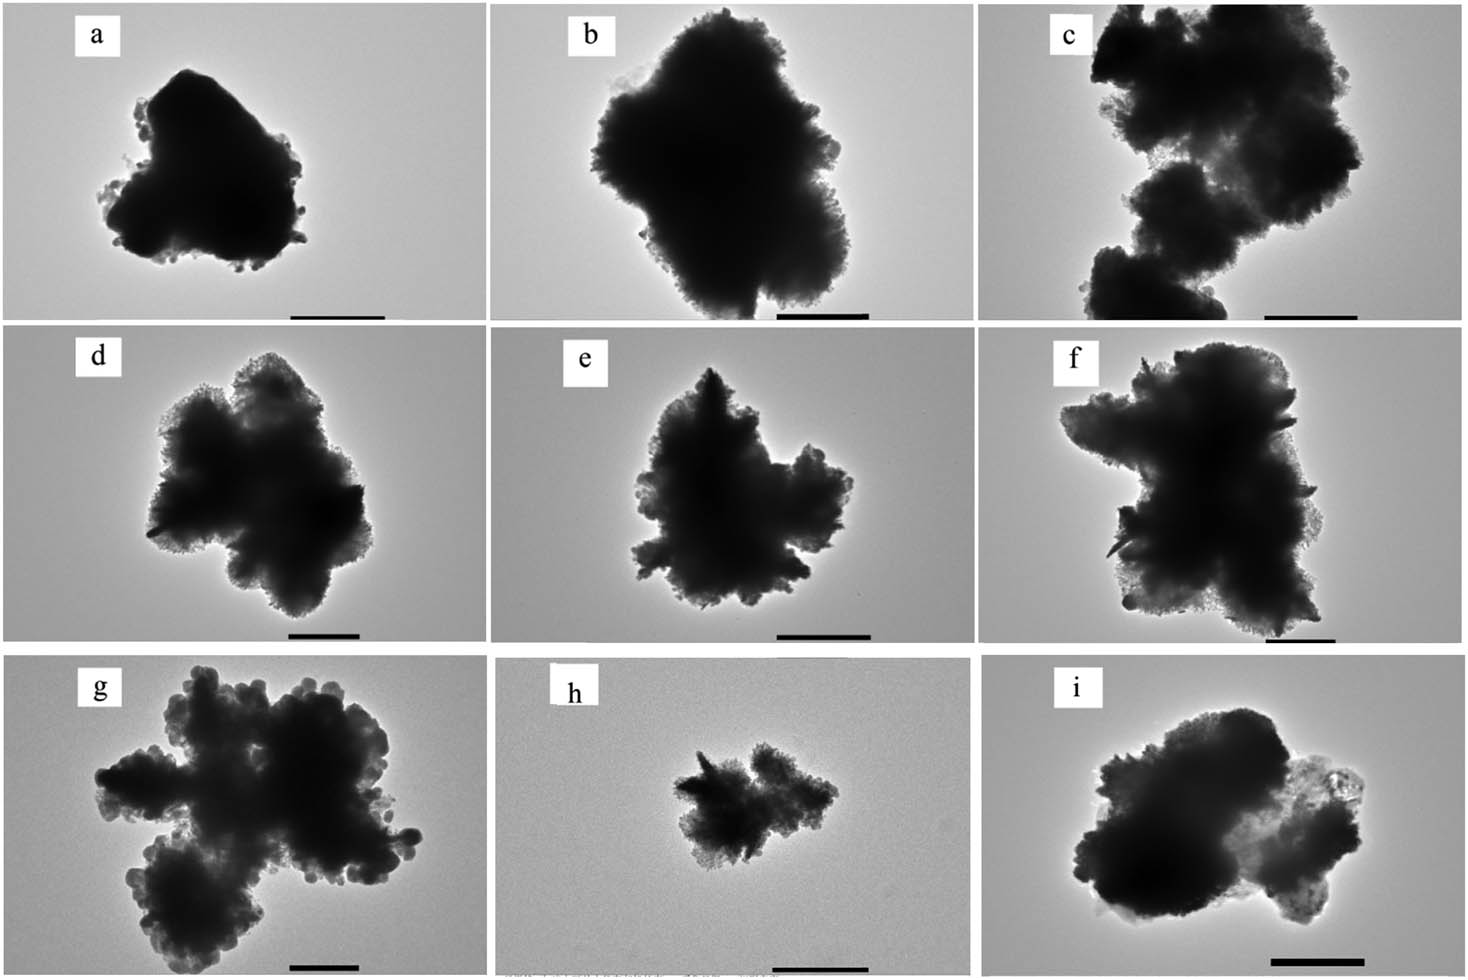
TEM image of a broken piece of the Ag nanosheets at different reaction time: (a) 5 s, (b) 30 s, (c) 60 s, (d) 5 min, (e) 15 min, (f) 30 min, (g) 60 min, (h) 1.5 h, and (i) 2 h (scale bar, 500 nm).

(a) Raman spectrum of 0.3 M 4-MPy in ethanol (200× magnification) and (b) SERS spectrum of 10−6 M 4-MPy absorbed on the SERS substrate presented in Figure 2g.
References
[1] Pieczonka NPW, Aroca RF. Single molecule analysis by surfaced-enhanced Raman scattering. Chem Soc Rev. 2008;37:946–54. 10.1039/b709739p.Search in Google Scholar PubMed
[2] Han XX, Chen L, Ji W, Xie YF, Zhao B, Ozaki Y. Label-free indirect immunoassay using an avidin induced surface-enhanced raman scattering substrate. Small. 2011;7(3):316–20. 10.1002/smll.201001936.Search in Google Scholar PubMed
[3] Hering K, Cialla D, Ackermann K, Dörfer T, Möller R, Schneidewind H, et al. SERS: a versatile tool in chemical and biochemical diagnostics. Ana Bio Chem. 2008;390(1):113–24. 10.1007/s00216-007-1667-3.Search in Google Scholar PubMed
[4] Chen L, Zhao Y, Wang YX, Zhang YJ, Liu Y, Han XX, et al. Mercury species induced frequency-shift of molecular orientational transformation based on SERS. Analyst. 2016;141(15):4782–8. 10.1039/C6AN00945J.Search in Google Scholar PubMed
[5] Wang L, Qi H, Chen L, Sun YT, Li Z. Self-assembled Ag-Cu2O nanocomposite films at air-liquid interfaces for surface-enhanced Raman scattering and electrochemical detection of H2O2. Nanomaterials. 2018;8(5):332. 10.3390/nano8050332.Search in Google Scholar PubMed PubMed Central
[6] Zhang LX, Lian WH, Li P, Ma H, Han XX, Zhao B, et al. Crocein orange G mediated detection and modulation of amyloid fibrillation revealed by surface-enhanced Raman spectroscopy. Biosens Bioelectron. 2020;148:111816. 10.1016/j.bios.2019.111816.Search in Google Scholar PubMed
[7] Kutsanedzie FYH, Agyekum AA, Annavaram V, Chen Q. Signal-enhanced SERS-sensors of CAR-PLS and GA-PLS coupled AgNPs for ochratoxin A and aflatoxin B1 detection. Food Chem. 2020;315:126231. 10.1016/j.foodchem.2020.126231.Search in Google Scholar PubMed
[8] Ward DR, Grady NK, Levin CS, Halas NJ, Wu Y, Nordlander P, et al. Electromigrated nanoscale gaps for surface-enhanced Raman spectroscopy. Nano Lett. 2007;7(5):1396–1400. 10.1021/nl070625w.Search in Google Scholar PubMed
[9] Cecchini MP, Turek VA, Paget J, Kornyshev AA, Edel JB. Self-assembled nanoparticle arrays for multiphase trace analyte detection. Nat Mater. 2013;12:165–71. 10.1038/NMAT3488.Search in Google Scholar PubMed
[10] Kneipp K, Wang Y, Kneipp H, Perelman LT, Itzkan I, Dasari RR, et al. Single molecule detection using surface-enhanced raman scattering (SERS. Phys Rev Lett. 1997;78(3):1667–70. 10.1103/PhysRevLett.78.1667.Search in Google Scholar
[11] Nie SM, Emory SR. Probing single molecules and single nanoparticles by surface-enhanced Raman scattering. Science. 1997;275(5303):1102–6. 10.1126/science.275.5303.1102.Search in Google Scholar
[12] Li L, Steiner U, Mahajan S. Single nanoparticle SERS probes of ion intercalation in metal-oxide electrodes. Nano Lett. 2014;14(2):495–8. 10.1021/nl403485e.Search in Google Scholar
[13] Fleischmann M, Hendra PJ, McQuillan AJ. Raman spectra of pyridine adsorbed at a silver electrode. Chem Phys Lett. 1974;26(2):163–6. 10.1016/0009-2614(74)85388-1.Search in Google Scholar
[14] Tian ZQ, Ren B, Wu DY. Surface enhanced Raman scattering: from noble to transition metals and from rough surfaces to ordered nanostructures. J Phys Chem B. 2002;106(37):9463–83. 10.1021/jp0257449.Search in Google Scholar
[15] Tang LL, Liu Y, Chen GQ, Li QQ, Shi YY, Liu LL, et al. A novel SERS substrate platform: spatially stacking plasmonic hotspots films. Nanoscale Res Lett. 2019;14:94. 10.1186/s11671-019-2928-8.Search in Google Scholar PubMed PubMed Central
[16] Khlebtsov BN, Khanadeev VA, Panfilova EV, Bratashov DN, Khlebtsov NG. Gold nanoisland films as reproducible SERS substrates for highly sensitive detection of fungicides. ACS Appl Mater Inter. 2015;7(12):6518–29. 10.1021/acsami.5b01652.Search in Google Scholar PubMed
[17] Hu XG, Cheng WL, Wang T, Wang YL, Wang EK, Dong SJ. Fabrication, characterization, and application in SERS of self-assembled polyelectrolyte–gold nanorod multilayered films. J Phys Chem B. 2005;109(41):19385–9. 10.1021/jp052706r.Search in Google Scholar PubMed
[18] Guo HY, Jiang D, Li HB, Xu SP, Xu WQ. Highly efficient construction of silver nanosphere dimers on poly(dimethylsiloxane) sheets for surface-enhanced Raman scattering. J Phys Chem C. 2014;117(1):564–70. 10.1021/jp309396x.Search in Google Scholar
[19] Dick LA, McFarland AD, Haynes CL, Van Duyne RP. Metal film over nanosphere (MFON) electrodes for surface-enhanced Raman spectroscopy (SERS): improvements in surface nanostructure stability and suppression of irreversible loss. J Phys Chem B. 2002;106(4):853–60. 10.1021/jp013638l.Search in Google Scholar
[20] Li XL, Xu WQ, Zhang JH, Jia HY, Yang B, Zhao B, et al. Self-assembled metal colloid films: two approaches for preparing new sers active substrates. Langmuir. 2004;20(4):1298–1304. 10.1021/la0356396.Search in Google Scholar PubMed
[21] Wang KQ, Sun DW, Pu HB, Wei QY. Two-dimensional Au@Ag nanodot array for sensing dual-fungicides in fruit juices with surface-enhanced Raman spectroscopy technique. Food Chem. 2019;310(3):125923. 10.1016/j.foodchem.2019.125923.Search in Google Scholar PubMed
[22] Ye WC, Chen Y, Zhou F, Wang CM, Li YM. Fluoride-assisted galvanic replacement synthesis of Ag and Au dendrites on aluminum foil with enhanced SERS and catalytic activities. J Mater Chem. 2012;22:18327–34. 10.1039/C2JM32170J.Search in Google Scholar
[23] Sun YG, Mayers BT, Xia YN. Template-engaged replacement reaction: a one-step approach to the large-scale synthesis of metal nanostructures with hollow interiors. Nano Lett. 2002;2(5):481–5. 10.1021/nl025531v.Search in Google Scholar
[24] Zhuo K, An CY, Kannan PK, Seo N, Park YS, Chung CH. Effect of electrolyte composition on the morphological structures of dendritic copper powders prepared by a spontaneous galvanic displacement reaction. Korean J Chem Eng. 2017;34:1483–9. 10.1007/s11814-017-0023-3.Search in Google Scholar
[25] Xie SP, Zhang XC, Yang SL, Paau MC, Xiao D, Choi MMF. Liesegang rings of dendritic silver crystals emerging from galvanic displacement reaction in a liquid-phase solution. RSC Adv. 2012;2:4627–31. 10.1039/C2RA20055D.Search in Google Scholar
[26] Ou JF, Shi QW, Chen YW, Wang FJ, Xue MS, Li W. Superhydrophobic surfaces on diverse metals based on ultrafastsequential deposition of silver and stearic acid. Appl Surf Sci. 2015;326:139–44. 10.1016/j.apsusc.2014.11.107.Search in Google Scholar
[27] You HJ, Chen F, Yang SC, Yang ZM, Ding BJ, Liang SH, et al. Size Effect on Nanoparticle-Mediated Silver. Cryst Growth Des. 2011;13(6):2696. 10.1021/cg400573n.Search in Google Scholar
[28] Gutés A, Carraro C, Maboudian R. Silver dendrites from galvanic displacement on commercial aluminum foil as an effective SERS substrate. J Am Chem Soc. 2010;132:1476–7. 10.1021/ja909806t.Search in Google Scholar PubMed
[29] Xie SP, Zhang XC, Xiao D, Paau MC, Choi MMF. Fast growth synthesis of silver dendrite crystals assisted by sulfate ion and its application for surface-enhanced Raman scattering. J Phys Chem C. 2011;115(20):9943–51. 10.1021/jp201484r.Search in Google Scholar
[30] Jie Z, Meng G, Zhu C, Zhou Q, Li Z, Yan K, et al. Ordered arrays of Ag nanodendrite clusters as effective surface-enhanced Raman scattering substrates. Rsc Adv. 2016;6:26490–4. 10.1039/C6RA03223K.Search in Google Scholar
[31] Li XX, Lin X, Liu BK, Zhao XL, Zhao HY, Wang L, et al. Citrate–assisted galvanic replacement for fabrication of homogeneous Ag nanosheets as high–performance SERS substrate. Appl Phys A. 2019;125:492. 10.1007/s00339-019-2786-3.Search in Google Scholar
[32] Gao T, Wang YQ, Wang K, Zhang X, Dui J, Li G, et al. Controlled synthesis of homogeneous Ag nanosheet-assembled film for effective SERS substrate. ACS Appl Mater Interfaces. 2013;5(15):7308–14. 10.1021/am401552x.Search in Google Scholar PubMed
[33] Li ZB, Meng GW, Liang T, Zhang Z, Zhu XG. Facile synthesis of large-scale Ag nanosheet-assembled films with sub-10 nm gaps as highly active and homogeneous SERS substrates. Appl Surf Sci. 2013;264:383–90. 10.1016/j.apsusc.2012.10.031.Search in Google Scholar
[34] Liu GQ, Cai WP, Liang CH. Trapeziform Ag nanosheet arrays induced by electrochemical deposition on Au-coated substrate. Cryst Growth Des. 2008;8(8):2748–52. 10.1021/cg700933p.Search in Google Scholar
[35] Wang YQ, Wang K, Zou BF, Gao T, Zhang XL, Du ZL, et al. Magnetic-based silver composite microspheres with nanosheet-assembled shell for effective SERS substrate. J Mater Chem C. 2013;1:2441–7. 10.1039/C3TC30106K.Search in Google Scholar
[36] Zhang B, Xu P, Xie XM, Wei H, Li ZP, Mack NH, et al. Acid-directed synthesis of SERS-active hierarchical assemblies of silver nanostructures. J Mater Chem. 2011;21:2495. 10.1039/c0jm02837a.Search in Google Scholar
[37] Ji N, Ruan WD, Wang CX, Lv ZC, Zhao B. Fabrication of silver decorated anodic aluminum oxide substrate and its optical properties on surface-enhanced Raman scattering and thin film interference. Langmuir. 2009;25(19):11869–73. 10.1021/la901521j.Search in Google Scholar PubMed
[38] Zou X, Dong S. Surface-enhanced Raman scattering studies on aggregated silver nanoplates in aqueous solution. J Phys Chem B. 2006;110(43):21545–50. 10.1021/jp063630h.Search in Google Scholar PubMed
[39] Pastoriza-Santos I, Liz-Marzán LM. Colloidal silver nanoplates. State of the art and future challenges. J Mater Chem. 2008;18:1724–37. 10.1039/b716538b.Search in Google Scholar
[40] Kelly KL, Coronado E, Zhao LL, Schatz GC. The optical properties of metal nanoparticles: the influence of size, shape, and dielectric environment. J Phys Chem. 2003;107(3):668–77. 10.1021/jp026731y.Search in Google Scholar
[41] Xu W, Meng G, Huang Q, Hu X, Huang Z, Tang H, et al. Large-scale uniform Ag-NW tip array with enriched sub-10-nm gaps as SERS substrate for rapid determination of trace PCB77. Appl Surf Sci. 2013;271:125–30. 10.1016/j.apsusc.2013.01.144.Search in Google Scholar
[42] Wang H, Levin CS, Halas NJ. Nanosphere arrays with controlled sub-10-nm gaps as surface-enhanced Raman spectroscopy substrates. J Am Chem Soc. 2005;127(43):14992–3. 10.1021/ja055633y.Search in Google Scholar PubMed
© 2022 Yuhai Wang et al., published by De Gruyter
This work is licensed under the Creative Commons Attribution 4.0 International License.
Articles in the same Issue
- Research Articles
- Abnormal retention of s-triazine herbicides on porous graphitic carbon
- One-factor-at-a-time method combined with ICP-MS for determining 11 elements in soy sauce and their migration from the containing glass bottles
- Analysis of initiator content of prepreg by near-infrared spectroscopy
- Simultaneous MEKC-DAD and smart spectrophotometric assays of thiocolchicoside and etoricoxib in challenging concentration ratio mixtures
- Alternative analytical methods for ibrutinib quantification in pharmaceutical formulation: A statistical comparison
- Chemometric determination of common cold infection drugs in human urine
- An effective, novel, and cheap carbon paste electrode for naproxen estimation
- Fabrication of ultra-sensitive carbon paste electrode with nanocomposite CdS modification for electroanalysis of rafoxanide in dosage form and biological fluids
- Purification and characterisation of phytochemicals extracted from Rhizophora mucronata: Their efficacy against Pseudomonas aeruginosa infection in Catla catla
- Review Articles
- Recent applications of quantitative analytical FTIR spectroscopy in pharmaceutical, biomedical, and clinical fields: A brief review
- Review of characteristics and analytical methods for determination of indomethacin
- A review of the application of comprehensive two-dimensional gas chromatography MS-based techniques for the analysis of persistent organic pollutants and ultra-trace level of organic pollutants in environmental samples
- Enrichment and analysis of glycated proteins
- Round robin tests of secondary raw materials: A systematic review of performance parameters
- Paper-based microfluidic devices: Fabrication, detection, and significant applications in various fields
- Applications of headspace solid-phase microextraction in human biological matrix analysis
- Chemometrics and infrared spectroscopy – A winning team for the analysis of illicit drug products
- Canagliflozin: A review with specific focus on analytical methods in biological matrices and pharmaceuticals
- RNA-based isothermal amplification technology and its clinical application in pathogen infection
- Detection of diarrheal shellfish toxins
- Special Issue: Nanomaterials with mimetic enzymatic properties for label-free sensors and biosensors (Guest Editors: Gang Wei and Zhiqiang Su)
- Preparation of cuprous oxide-supported silver-modified reduced graphene oxide nanocomposites for non-enzymatic electrochemical sensor
- Recent advances in matrix metalloproteinases-responsive nanoprobes for cancer diagnosis and therapy
- A simple salicylaldehyde-bearing pyrazine as a turn-on fluorescent chemosensor for Al3+ and Zn2+ recognition and its applications
- Preparation of silver nanosheet-assembled film as a surface-enhanced Raman scattering substrate
- Synthesis of group I–III–VI semiconductor quantum dots and its application in food safety testing