Fabrication of ultra-sensitive carbon paste electrode with nanocomposite CdS modification for electroanalysis of rafoxanide in dosage form and biological fluids
-
 ,
,

Abstract
An anthelmintic, rafoxanide (RF), is frequently used in veterinary medicine to cure fascioliasis in cattle and sheep. A sensitive, quick, and selective detection of RF in its pharmaceutical preparation and in human urine was achieved through developing a new electrochemical sensor. The suggested method relied on the electro-oxidation of RF that used a modified carbon paste electrode in the presence of sodium dodecyl sulfate, which acts as an anionic surfactant. Voltammetric types were utilized in RF analysis, and these methods were cyclic voltammetry and differential pulse techniques. The suggested electro-analytical method’s validity is verified using the International Council on Harmonization (ICH/Q2) rules. The calibration curve for RF quantification was done in the concentration range from 2.9 × 10⁻⁶ to 3.1 × 10⁻⁴ M at cadmium sulfide modified carbon paste electrode. The limit of detection and the limit of quantification LOQ were found to be 6.7 × 10⁻⁷ M and 2.01 × 10⁻⁶ M, respectively. This study could be applied to the examined drug in QC-laboratory units, and also RF could be assayed in its pharmacokinetic studies.
Graphical abstract

1 Introduction
An anthelmintic, rafoxanide (RF), is frequently used in veterinary medicine to treat fascioliasis in cattle and sheep. IUPAC name of RF is N-[3-chloro-4-(4-chlorophenoxy)phenyl]-2-hydroxy-3,5 diiodo-benzamide (Figure 1) [1]. There are various published methods for quantifying RF that were examined in pure form, co-administered, and in combination. These methods included chromatographic methods such as gas chromatography, ultra-performance liquid chromatography (UPLC) [2,3,4,5,6,7,8], and also spectrophotometric methods [9,10]. The electro-analytical technique uses different types of voltammetric methods, such as cyclic voltammetry (CV) and differential pulse voltammetry (DPV). These types are simple, cost-effective, and rapid using low toxicity reagents (generally aqueous buffer solutions) [11,12,13]. In addition, voltammetric methods are informative and give more information about the active site of the studied drug based on oxidation–reduction behavior. Hence this technique is preferable compared to the abovementioned classical method for RF analysis. In the present study, the carbon paste electrode (CPE) was fabricated to determine RF at different experimental conditions. CPE has good chemical reactivity in electroanalysis [14,15,16,17,18,19], good rigidity, simplicity, gives good linearity, high accuracy, fastness, inexpensive, low ohmic resistance, and an extreme potential window [12,20,21,22,23,24,25,26,27]. The modification of CPE was another strategy that was developed to increase electrode sensitivity. Furthermore, the resulting data is accurate, precise, selective, and robust. Different nanomaterials were utilized as a modifier to improve the performance of the carbon-based electrodes [5,28].

Chemical structure of rafoxanide.
The main objective of the present work is to offer a valid, simple, economical, and excellent reproducibility and powerful electro-analytical method. Finally, the proposed voltammetric approaches, such as CV and DPV techniques, provided a way to improve the conditions for the accurate detection of RF in its commercial dosage forms and spiked urine samples.
2 Experimental material
2.1 Chemicals and reagents
The used reagents and solvents were of analytical grade-A. All chemicals were used without the need for further purification. Graphite (powdered, particle dimension 20 µm) was obtained from Sigma-Aldrich, Germany, and an anionic surfactant like sodium dodecyl sulphate (SDS), cadmium sulfide, ZnSO4·7H2O, and paraffin oil were purchased from El Nasr Co. for Intermediate Chemicals, Egypt. Flukanil® injection (B. no., 1509104) and RF (99.8% purity) was kindly supplied by Pharma Swede, Egypt. The selected supporting electrolyte was aqueous Britton Robinson (BR) buffer solutions from pH 2.0 to pH 10. The composition of BR buffer solutions (0.04 M of each phosphoric acid, boric acid, and acetic acid (Merck, Darmstadt, Germany) was adjusted by 0.2 M NaOH to reach the desired pH.
2.2 Instruments
Electrochemical measurements were done through a Potentiostat voltammetric analyzer, OrigaFlex OGF500. Origa Master software was used. Three electrodes were placed in an electrochemical cell namely the working electrode of 3.0 mm glassy carbon, platinum as auxiliary or counter electrode, and reference silver (Ag/AgCl) electrode. The diamond paste was used to polish the working electrode. Analytical digital balance (Switzerland) has been used. pH measurements were done with an Adwa pH-meter, Model: AD1030.
2.3 Standard RF solution
An accurate amount (62.0 mg) of RF was weighed and mixed with 20 mL of methanol as a solvent in 100 mL calibrated flask, then completed to 100.0 mL with the same solvent. The final concentration was 1.0 × 10⁻³ mol·L−1 and stored away from light.
2.4 Electrode preparation
The CPE was fabricated through mixing of 0.3 mL of paraffin oil with the mixture of graphite powder (0.5 g) and cadmium sulfide in glass mortar [29]. The obtained paste was placed into the hole of the electrode body and then smoothed to produce a shiny electrode appearance. The prepared modified electrode is carried in deionized water and under nitrogen conditions. Different concentrations of cadmium sulfide were added to obtain a cadmium sulfide modified carbon paste electrode (CCPE). After that, CCPE is washed and dried enough before being used.
2.5 Electrochemical measurement of CdS
The measurements were recorded after cyclic voltammetric measurements on CCPE for exactly 1.0 × 10⁻³ M RF at pH 5.0, upon successive additions of different percentages (2%, 3%, 5%, and 7%) of cadmium sulfide solution to the electrochemical cell.
2.6 Analysis of RF in its pure form
At pH 5.0, an aliquot of (1.0 × 10⁻³ M) RF solution was transferred to the electrochemical cell, with BR buffer provided as a supporting electrolyte. The resulting solution was stirred for 5 s at the CCPE working electrode under open circuit conditions. Anionic surfactant (SDS) solution, 4.0 × 10⁻⁵ M was used. All measurements were then recorded at a scan rate of 10 mV·s−1.
2.7 RF Analysis in dosage form
Flukanil® injection (75 mg·mL) yielded an exact volume equivalent to 1.0 × 10⁻³ M RF solution in a 100 mL volumetric flask containing 75 mL methanol. The mixture was then dissolved using sonication for 30 min before being completed to volume with methanol. The final solution was filtered. The electrochemical cell was filled with various aliquots of the produced solution (35 μL) and the standard RF solution (1.0 × 10⁻³ M) and voltammograms were observed [30].
2.8 Applications to human urine
400 μL of human urine samples were precisely spiked with aliquots of RF solutions into each centrifugation test tube accurately. For 5 min, the vortex was used to generate the combination. Following that 0.5 mL of methanol, 0.1 mL (0.1 M) of NaOH, and 0.5 mL of ZnSO4·7H2O (5% w/v) [31] were accurately added and centrifuged at 4,000 rpm for 10 min. A 0.45 µm cellulose acetate membrane filter was used to purify the supernatant. The supernatant liquor (0.1 mL) was placed into the electrochemical cell and filled to a total volume of 5 mL with BR buffer, pH 5. After that the proposed DPV procedure was performed [32].
3 Results and discussion
3.1 Influence of pH on RF electrochemical behavior
As shown in Figure 2, preliminary CV measurements for (1.0 × 10⁻³ mol·L−1) RF were performed at CPE in BR buffer solutions. The pH range (2.0–12) was investigated, as well as two anodic peaks for the oxidation process of RF within the pH range of 3.0–7.0. In the suggested mechanism, first, the –OH group in RF gives one electron and oxidizes to phenoxy radical form (–O). Then, the protonated azomethyn (–NH2+) group in the structure gives one electron and one proton and oxidizes to cationic radical form (–NH+). Finally, the formed diradical also loses one proton, and a new product is formed by the cyclization process [19] as shown in Scheme 1. This is based on the oxidation of the primary amino group, which becomes inactive in acidic media due to protonation (Figure 3). The anodic peak potential is affected by pH, which increases up to pH 3 before reaching a near-steady state at pH 5. The anodic peak potential increases from pH 7 to pH 10, and then decreases to pH 12. At pH values of 5.0 and 10.0, the anodic peak current (I p) has maximum values of 21.23 and 120.05 μA, respectively. Figure 4 illustrates the anodic peak currents of RF in the presence of CPE, different concentrations of CCPE, and SDS. At pH 10, the greatest anodic peak current value was 149.22 μA. While in the presence of 4.0 × 10⁻⁵ M SDS solution, a CPE containing 5% cadmium sulfide was changed. This suggested that the basic medium (pH 10) was preferable to any other medium for producing the assessment maximum anodic peak for the modified electrode with SDS.

Cyclic voltammograms of the oxidation of RF solution (1.0 × 10⁻³ mol·L−1) at CPE using BR buffer.

The suggested mechanism of the studied electrochemical oxidation process for RF at CPE.

The plot of anodic peak potential (A) and peak current (B) of RF (1.0 × 10⁻³ M) as a function of pH at CPE.

Cyclic voltammograms of 1.0 × 10⁻³ mol·L−1 RF at (a) CPE and (b) 2%, 3%, 5%, and 7% CCPE in the presence 4.0 × 10⁻⁵ M SDS.
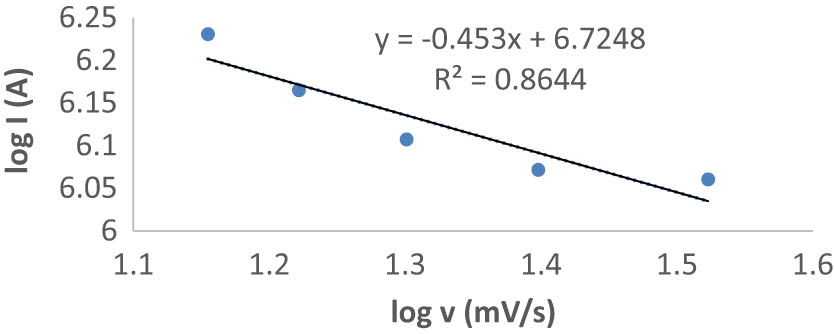
Plot of anodic peak current as a function of scan rate: (A) log I vs log ν.
3.2 Effect of scan rate (υ)
In the presence of SDS solution, scan rate (υ) had an effect on the anodic peak current (I p) of RF at both CPE and CCPE in the range of 10–150 mV·s−1. Figure 5 shows the relationship between the logarithm of oxidation peak current (log I p) and the logarithm of scan rate (log υ). The linear regression equation is
with R² = 0.8644. According to the slope values, the RF oxidation process is an adsorption-contributed process at CPE and CCPE in the presence of SDS solution [33]. The diffusion coefficient of RF can be calculated using the (Randles-Sevcik equation) and the square root of the scan rate (Figure 5) [33]
where I pa is the anode peak current (A), n is the number of transferred electrons in a redox cycle, A is the active surface area of the electrode (cm2), D and C are the diffusion coefficients (cm2·s−1) and concentration of redox-active species, respectively, and υ is the applied scan rate in V·s−1. The diffusion coefficients for RF are 1.076 × 10⁻⁶, 1.155 × 10⁻⁵, and 7.911 × 10⁻⁵ cm2·s−1 at CPE, CCPE, and CCPE/SDS, respectively. The results showed that there was a quick mass transfer of RF molecules from the bulk solution to the surface of the CCPE when SDS solution was present.
3.3 Validation of an electro-analytical methodology
3.3.1 Linearity range, detection, and quantification limit
The proposed methods were validated based on International Council Harmonization (ICH/Q2) rules [34]. To provide the electro-analytical method for RF analysis, different quantitative measurements were performed using DPV at CCPE in the presence of SDS solution (4.0 × 10⁻⁵ M). The calibration plot was constructed through consecutive additions of RF solution (1 × 10⁻³ M) to the electrochemical cell at pH 10. The peak currents vs different RF concentrations were plotted within the linearity range. As shown in Figure 6, the anodic peak current (I p) increases linearly with the increase in the RF concentration from 2.9 × 10⁻⁶ to 3.1 × 10⁻⁴ M with a correlation coefficient of 0.9992, which can be seen in Table 1. The limit of detection (LOD) and limit of quantification (LOQ) are obtained according to the following equations:
where S is the slope of the calibration curve, and σ is the standard deviation of the intercept [35,36]. Through the calibration graph, the calculated value of LOD and LOQ in µg/mL was converted to molar concentration using the molecular weight of rafoxanide. LOD and LOQ were found to be 6.7 × 10⁻⁷ and 2.01 × 10⁻⁶ M, respectively. Different RF doses in the linear range that extends from 2.9 × 10⁻⁶ to 3.1 × 10⁻⁴ M were used to test the validity [37] of the approach. The values of relative standard deviation (RSD) ranging from 0.25% to 1.51% were obtained (Table 1).

(a) Voltammograms of RF using DPV mode at CCPE in BR buffer pH 10 and scan rate of 10 mV·s−1 in the presence of 4.0 × 10⁻⁵ M SDS. (b) Calibration plot of the oxidation peak current vs the concentration range of RF.
Statistical data and quantitative parameters for RF determination by the proposed method
| Parameter | CCPE |
|---|---|
| E (V) | 0.571 |
| Linearity (M) | 2.9 × 10⁻⁶−3.1 × 10⁻⁴ |
| A | 1.32 |
| B | 0.11 |
| s a | 0.014 |
| s b | 0.01 |
| s y/x | 0.015 |
| RSD | 0.25–1.51% |
| LOD (M) | 6.7 × 10⁻⁷ |
| LOQ (M) | 2.01 × 10⁻⁶ |
| r | 0.9996 |
| R² | 0.9992 |
where A – intercept t; B – slope; s a – standard deviation of intercept; s b – standard deviation of slope; s y/x – standard deviation of regression; LOD – limit of detection; LOQ – limit of quantification; r – correlation coefficient; LR – linear range; n – number of data; R 2 – coefficient of determination.
3.3.2 Accuracy and precision
For the analysis of Flukanil® injection, the suggested electro-analytical method’s accuracy was tested using the standard addition method, and aliquots of RF standard solution (1.0 × 10⁻³ M) were added. Five replicate trials produced the resulting data, expressed as estimated percent recoveries ranging from 99.95% to 100.8%, with RSD values between 0.493% and 1.338%. The obtained results were in excellent agreement with the labeled content (Tables 2 and 3). After studying the effect of various excipients accessible in Flukanil® injection, there are no interferences from the matrix. The estimated values in the current investigation of the DPV technique for the analysis of RF in bulk and pharmaceutical formulations were 1.0 × 10⁻⁴–1.0 × 10⁻¹ µM and 5.0 × 10⁵–1.0 × 10⁻¹ µM, respectively, indicating that it is more sensitive than HPLC and spectrophotometric approaches. After statistically comparing the computed and tabular data, it was discovered that there is no significant difference between the proposed approach and the published spectrophotometric method [10] at 95% confidence level [10] as shown in Table 4.
Standard addition method for the assay of 5 µg·mL−1 at CCPE
| Claimed (µg·mL−1) | Added (µg·mL−1) | % Recovery | Bias (%) | SD | CV | |
|---|---|---|---|---|---|---|
| CPE | 5.0 | 1.0 | 99.6 | −1.4 | 1.21 | 1.41 |
| 3.0 | 100.2 | 0.6 | 1.33 | 1.32 | ||
| 4.0 | 99.3 | −0.7 | 1.15 | 1.10 |
Precision data of the proposed method for determination of RF
| RF (M) | Intraday precision | Interday precision | ||
|---|---|---|---|---|
| % Recovery ± SD* | CV | % Recovery ± SD* | CV | |
| 3 × 10⁻⁶ | 99.61 ± 0.37 | 1.02 | 99.61 ± 1.11 | 0.97 |
| 3 × 10⁻⁵ | 98.78 ± 0.91 | 0.92 | 98.95 ± 0.81 | 1.01 |
| 3 × 10⁻⁴ | 99.95 ± 1.12 | 0.81 | 99.54 ± 0.84 | 0.92 |
* Number of replicates (n) = 5.
Assay of RF in dosage form, claimed to contain 3 × 10⁻⁵ M of RF at CCPE
| Parameter | Labeled claim | Found (µg·mL−1) | % Recovery | Bias (%) | SD | CV | t cal |
|---|---|---|---|---|---|---|---|
| CPE | 3 × 10⁻⁵ | 1.98 | 99.3 | 1.5 | 1.22 | 1.04 | 0.58 |
3.3.3 Reproducibility and Stability
Five DPV experiments at pH 5 were studied using the fabricated sensing for the same electrode, which was conducted in a row under similar conditions. The RSD value was found to be 3.22%, which proved the excellent reproducibility of the modified CCPE. Furthermore, the stability was tested in the fabrication of the modified CCPE. After 2 weeks of storing the CCPE in the refrigerator, the test was done using DPV at optimum experimental conditions and on every 5th day, the stability was checked. The results showed that the electrode remained stable by 98% of the current activity toward RF till 15 days, demonstrating the long-term stability of the CCPE.
3.4 RF testing in urine samples
To test the application of the proposed electro-analytical method of RF in biological fluids, urine samples were collected from healthy volunteers and processed as stated in (Section 2.8). Its calibration curve was a straight line with a correlation coefficient of 0.9995. According to the statistical regression data, the LOD and LOQ are 7.70 × 10⁻⁷ and 2.57 × 10⁻⁶ mol·L−1, respectively. Also, mean %R and RSD were found to be 99.30–101.65% and 0.621–1.420%, respectively. Therefore, the proposed electro-analytical study can be successfully and easily used to determine RF in human urine (Table 5).
Assay of RF in spiked urine by application of standard addition method (DP)
| Claimed (µg·mL−1) | Added (ng·mL−1) | % Recovery | Bias (%) | SD | CV | |
|---|---|---|---|---|---|---|
| MCPE | 500 | 50.0 | 100.12 | 1.2 | 1.11 | 1.02 |
| 100.0 | 100.05 | 0.15 | 1.05 | 1.21 | ||
| 200.0 | 99.89 | 0.20 | 1.42 | 1.20 |
4 Conclusion
The proposed method produces ultra-sensitive, simple, selective, long-run stability, and the precise DPV method for determination of RF. The proposed electro-analytical method was fully validated based on the International Council Harmonization (ICH/Q2) rules. Based on the enhancing effect and formation of inclusion complexes with SDS, this approach may be used to detect RF in its pure form, pharmaceutical formulations, and real urine samples using a modified CPE in presence of micellar SDS solution. Under optimized parameters, method validation demonstrated that the proposed electro-analytical method was linear and had a very low detection limit, good accuracy, and precision. The developed method can be used in routine work to analyze the cited drug in the pharmaceutical industry QC-units.
Acknowledgments
The authors would like to thank National Research Center in Dokki, Egypt.
-
Funding information: Authors state no funding involved.
-
Author contributions: Waheed M. Salem: conceptualization, writing – original draft, visualization, methodology, investigation, and supervision; Mohamed A. Abdel-Lateef: writing – review; Mohamed A. Abdel Hamid and Hany A. Batakoushy: formal analysis, data curation, resources, writing – original draft, validation, and writing – review and editing.
-
Conflict of interest: The authors state no conflict of interest.
-
Precaution: Care must be taken when handling cadmium sulfide residues as they are toxic.
-
Data availability statement: All data generated or analyzed during this study are included in this published article.
References
[1] Brayfield A. Martindale: the complete drug reference. Electronic version. London, UK: Pharmaceutical Press; 2013.Search in Google Scholar
[2] Barth T, Aleu J, Pupo MT, Bonato PS, Collado IG. HPLC analysis of midodrine and desglymidodrine in culture medium: Evaluation of static and shaken conditions on the biotransformation by fungi. J Chromatogr Sci. 2013;51(5):460–7.10.1093/chromsci/bms163Search in Google Scholar PubMed
[3] Benchaoui H, McKellar Q. Determination of rafoxanide and closantel in ovine plasma by high performance liquid chromatography. Biomed Chromatogr. 1993;7(4):181–3.10.1002/bmc.1130070402Search in Google Scholar PubMed
[4] Saad AS, Hamdy AM, Salama FM, Abdelkawy M. Validated UPLC and TLC-densitometry stability indicating methods for the determination of rafoxanide in the presence of its degradation products. J Chromatogr Sci. 2016;54(9):1661–9.10.1093/chromsci/bmw112Search in Google Scholar PubMed
[5] Sharma A, Ahmed A, Singh A, Oruganti SK, Khosla A, Arya S. Recent advances in tin oxide nanomaterials as electrochemical/chemiresistive sensors. J Electrochem Soc. 2021;168(2):027505.10.1149/1945-7111/abdee8Search in Google Scholar
[6] Swartz ME. UPLC™: An introduction and review. J Liq Chromatogr Rel Technol. 2005;28(7–8):1253–63.10.1081/JLC-200053046Search in Google Scholar
[7] Talley CP, Trenner NR, Downing GV, VandenHeuvel W. Gas chromatographic determination of rafoxanide [3′-chloro-4′-(4-chlorophenoxy)-3, 5-diiodosalicylanilide] in plasma by electron capture detection of its trimethylsilyl derivative. Anal Chem. 1971;43(11):1379–82.10.1021/ac60305a049Search in Google Scholar PubMed
[8] Yeung HS, Lee WO, Wong YT. Screening of closantel and rafoxanide in animal muscles by HPLC with fluorescence detection and confirmation using MS. J Sep Sci. 2010;33(2):206–11.10.1002/jssc.200900503Search in Google Scholar PubMed
[9] Fink DW. Spectrophotometric quantification of the salicylanilide anthelmintic rafoxanide based on the charge-transfer absorbance of its iron (III) complex. Anal Chim Acta. 1981;131:281–5.10.1016/S0003-2670(01)93561-5Search in Google Scholar
[10] Saad AS, Attia AK, Alaraki MS, Elzanfaly ES. Comparative study on the selectivity of various spectrophotometric techniques for the determination of binary mixture of fenbendazole and rafoxanide. Spectrochimica Acta Part A Mol Biomol Spectrosc. 2015;150:682–90.10.1016/j.saa.2015.05.098Search in Google Scholar PubMed
[11] Alharthi S, Batakoushy HA, Alharthy SA, El-Magied A, Mahmoud O, Salem WM. Electro-analytical sensing of anti-hypotensive agents: application to dosage forms and human urine. Toxicol Res. 2022;11(1):245–54.10.1093/toxres/tfac004Search in Google Scholar PubMed PubMed Central
[12] Radi A-E, El-Samboskany H. Anodic adsorptive stripping voltammetric determination of rafoxanide on glassy carbon electrode. Comb Chem High Throughput Screen. 2020;23(10):1002–9.10.2174/1386207323666200422083339Search in Google Scholar PubMed
[13] Alemu H, Khoabane NM, Tseki PF. Electrochemical oxidation of niclosamide at a glassy carbon electrode and its determination by voltammetry. Bull Chem Soc Ethiop. 2003;17(1).10.4314/bcse.v17i1.61740Search in Google Scholar
[14] Aziz MA, Kawde A-N. Gold nanoparticle-modified graphite pencil electrode for the high-sensitivity detection of hydrazine. Talanta. 2013;115:214–21.10.1016/j.talanta.2013.04.038Search in Google Scholar PubMed
[15] Kawde A-N, Aziz M, Baig N, Temerk Y. A facile fabrication of platinum nanoparticle-modified graphite pencil electrode for highly sensitive detection of hydrogen peroxide. J Electroanal Chem. 2015;740:68–74.10.1016/j.jelechem.2015.01.005Search in Google Scholar
[16] Kawde AN, Aziz MA. Disposable palladium nanoparticle-modified graphite pencil electrode. U.S. Patent No. 8,968,825; 2015.Search in Google Scholar
[17] Sağlam Ö, Dilgin DG, Ertek B, Dilgin Y. Differential pulse voltammetric determination of eugenol at a pencil graphite electrode. Mater Sci Eng C. 2016;60:156–62.10.1016/j.msec.2015.11.031Search in Google Scholar PubMed
[18] Wang J, Kawde A-N, Sahlin E. Renewable pencil electrodes for highly sensitive stripping potentiometric measurements of DNA and RNA. Analyst. 2000;125(1):5–7.10.1039/a907364gSearch in Google Scholar PubMed
[19] Dede E, Sağlam Ö, Dilgin Y. Sensitive voltammetric determination of niclosamide at a disposable pencil graphite electrode. Electrochim Acta. 2014;127:20–6.10.1016/j.electacta.2014.01.153Search in Google Scholar
[20] Alipour E, Majidi MR, Saadatirad A. mahdi Golabi S, Alizadeh AM. Simultaneous determination of dopamine and uric acid in biological samples on the pretreated pencil graphite electrode. Electrochim Acta. 2013;91:36–42.10.1016/j.electacta.2012.12.079Search in Google Scholar
[21] Barth T, Pupo MT, Borges KB, Okano LT, Bonato PS. Stereoselective determination of midodrine and desglymidodrine in culture medium: application to a biotransformation study employing endophytic fungi. Electrophoresis. 2010;31(9):1521–8.10.1002/elps.200900685Search in Google Scholar PubMed
[22] Dilgin Y, Ertek B, Kızılkaya B, Dilgin DG, Gökçel HI. Electrocatalytic oxidation of NADH using a pencil graphite electrode modified with hematoxylin. Sci Adv Mater. 2012;4(9):920–7.10.1166/sam.2012.1376Search in Google Scholar
[23] Dilgin Y, Kızılkaya B, Ertek B, Işık F, Dilgin DG. Electrocatalytic oxidation of sulphide using a pencil graphite electrode modified with hematoxylin. Sens Actuators B Chem. 2012;171:223–9.10.1016/j.snb.2012.03.020Search in Google Scholar
[24] Elzanfaly ES, Zaazaa HE, Merey HA. Ion selective phosphotungstate and β-cyclodextrin based membrane electrodes for stability-indicating determination of midodrine hydrochloride. Acta Chim Slovenica. 2013;60(2):256–62.Search in Google Scholar
[25] Furlanetto S, Pinzauti S, Gratteri P, La Porta E, Calzeroni G. Experimental design strategies in the optimization and robustness testing of adsorptive stripping voltammetric conditions for kynurenic acid determination. J Pharm Biomed Anal. 1997;15(9–10):1585–94.10.1016/S0731-7085(96)02029-8Search in Google Scholar
[26] Pala BB, Vural T, Kuralay F, Çırak T, Bolat G, Abacı S, et al. Disposable pencil graphite electrode modified with peptide nanotubes for Vitamin B12 analysis. Appl Surf Sci. 2014;303:37–45.10.1016/j.apsusc.2014.02.039Search in Google Scholar
[27] Uygun ZO, Dilgin Y. A novel impedimetric sensor based on molecularly imprinted polypyrrole modified pencil graphite electrode for trace level determination of chlorpyrifos. Sens Actuators B Chem. 2013;188:78–84.10.1016/j.snb.2013.06.075Search in Google Scholar
[28] Xu S, Zhu Q, Xu S, Yuan M, Lin X, Lin W, et al. The phase behavior of n-ethylpyridinium tetrafluoroborate and sodium-based salts ATPS and its application in 2-chlorophenol extraction. Chin J Chem Eng. 2021;33:76–82.10.1016/j.cjche.2020.07.024Search in Google Scholar
[29] Shalaby A, Hassan WS, Hendawy HA, Ibrahim A. Electrochemical oxidation behavior of itraconazole at different electrodes and its anodic stripping determination in pharmaceuticals and biological fluids. J Electroanal Chem. 2016;763:51–62.10.1016/j.jelechem.2015.12.047Search in Google Scholar
[30] Hendawy HA, Youssif RM, Salama NN, Fayed AS, Salem MY. Challenge approach of an inexpensive electrochemical sensor for rapid selective determination of two Non‐classical β‐lactams in presence of different degradants and interference substances. Electroanalysis. 2017;29(12):2708–18.10.1002/elan.201700431Search in Google Scholar
[31] Al‐Ghamdi AH, Al‐Ghamdi AF, Al‐Omar MA. Electrochemical studies and square‐wave adsorptive stripping voltammetry of spironolactone drug. Anal Lett. 2008;41(1):90–103.10.1080/00032710701746832Search in Google Scholar
[32] Rizk M, Hendawy HA, El‐Alamin MMA, Moawad MI. Sensitive anodic voltammetric determination of methylergometrine maleate in bulk and pharmaceutical dosage forms using differential pulse voltammetry. J Electroanal Chem. 2015;749:53–61.10.1016/j.jelechem.2015.04.029Search in Google Scholar
[33] Gosser DK. Cyclic voltammetry: simulation and analysis of reaction mechanisms. New York: VCH; 1993.Search in Google Scholar
[34] Guideline IHT. Validation of analytical procedures: text and methodology. Q2 (R1). 2005;1(20):5.Search in Google Scholar
[35] Abdel-Lateef MA, Alzahrani E, Pashameah RA, Almahri A, Abu-Hassan AA, El Hamd MA, et al. A specific turn-on fluorescence probe for determination of nitazoxanide based on feasible oxidation reaction with hypochlorite: Applying cobalt ferrite nanoparticles for pre-concentration and extraction of its metabolite from real urine samples. J Pharm Biomed Anal. 2022;219:114941.10.1016/j.jpba.2022.114941Search in Google Scholar PubMed
[36] Abdel-Lateef MA. Utilization of the peroxidase-like activity of silver nanoparticles nanozyme on O-phenylenediamine/H2O2 system for fluorescence detection of mercury (II) ions. Sci Rep. 2022;12(1):1–9.10.1038/s41598-022-10779-8Search in Google Scholar PubMed PubMed Central
[37] Miller JN, Miller JC. Statistics and chemometrics for analytical chemistry. 6th edn. Canada: Pearson Education; 2005.Search in Google Scholar
© 2022 Waheed M. Salem et al., published by De Gruyter
This work is licensed under the Creative Commons Attribution 4.0 International License.
Articles in the same Issue
- Research Articles
- Abnormal retention of s-triazine herbicides on porous graphitic carbon
- One-factor-at-a-time method combined with ICP-MS for determining 11 elements in soy sauce and their migration from the containing glass bottles
- Analysis of initiator content of prepreg by near-infrared spectroscopy
- Simultaneous MEKC-DAD and smart spectrophotometric assays of thiocolchicoside and etoricoxib in challenging concentration ratio mixtures
- Alternative analytical methods for ibrutinib quantification in pharmaceutical formulation: A statistical comparison
- Chemometric determination of common cold infection drugs in human urine
- An effective, novel, and cheap carbon paste electrode for naproxen estimation
- Fabrication of ultra-sensitive carbon paste electrode with nanocomposite CdS modification for electroanalysis of rafoxanide in dosage form and biological fluids
- Purification and characterisation of phytochemicals extracted from Rhizophora mucronata: Their efficacy against Pseudomonas aeruginosa infection in Catla catla
- Review Articles
- Recent applications of quantitative analytical FTIR spectroscopy in pharmaceutical, biomedical, and clinical fields: A brief review
- Review of characteristics and analytical methods for determination of indomethacin
- A review of the application of comprehensive two-dimensional gas chromatography MS-based techniques for the analysis of persistent organic pollutants and ultra-trace level of organic pollutants in environmental samples
- Enrichment and analysis of glycated proteins
- Round robin tests of secondary raw materials: A systematic review of performance parameters
- Paper-based microfluidic devices: Fabrication, detection, and significant applications in various fields
- Applications of headspace solid-phase microextraction in human biological matrix analysis
- Chemometrics and infrared spectroscopy – A winning team for the analysis of illicit drug products
- Canagliflozin: A review with specific focus on analytical methods in biological matrices and pharmaceuticals
- RNA-based isothermal amplification technology and its clinical application in pathogen infection
- Detection of diarrheal shellfish toxins
- Special Issue: Nanomaterials with mimetic enzymatic properties for label-free sensors and biosensors (Guest Editors: Gang Wei and Zhiqiang Su)
- Preparation of cuprous oxide-supported silver-modified reduced graphene oxide nanocomposites for non-enzymatic electrochemical sensor
- Recent advances in matrix metalloproteinases-responsive nanoprobes for cancer diagnosis and therapy
- A simple salicylaldehyde-bearing pyrazine as a turn-on fluorescent chemosensor for Al3+ and Zn2+ recognition and its applications
- Preparation of silver nanosheet-assembled film as a surface-enhanced Raman scattering substrate
- Synthesis of group I–III–VI semiconductor quantum dots and its application in food safety testing